Article

Separation Emulsion via Non-Ionic Surfactant: An Optimization

by
Murtada Mohammed Abdulredha
,
Siti Aslina Hussain
* and
Luqman Chuah Abdullah
Department of Chemical and Environmental Engineering, Universiti Putra Malaysia, 47100 Selangor, Malaysia
*
Author to whom correspondence should be addressed.
Processes 2019, 7(6), 382; https://doi.org/10.3390/pr7060382
Submission received: 20 March 2019 / Revised: 9 May 2019 / Accepted: 10 May 2019 / Published: 20 June 2019
(This article belongs to the Special Issue Green Separation and Extraction Processes)

Abstract

:
Achieving emulsion stability in the petroleum industry is a major challenge due to several problems encountered in the oil refining process, such as corrosion in equipment, high-pressure drops in pipelines, and catalyst poisoning in upstream facilities. Thus, several methods are applied for emulsion treatment and chemical treatment using surface-active agents, a fundamental method in the petroleum industry. The present work investigated the performance of a non-ionic surfactant in separating water in a crude oil emulsion via the bottle test technique. Then, a Fractional Factorial Design (2K−1) was used to characterise the effect of significant variables. In particular, a Pareto chart was employed and factors such as demulsifier dosage, toluene concentration, pressure, sitting time, and temperature were investigated. Accordingly, the parameters applied were further analysed using a Central Composite Design (CCD) based on the Response Surface Method (RSM). The experimental results based on analysis of Variance (ANOVA) show that demulsifier dosage, temperature, and sedimentation times were the main variables affecting the dehydration process, with the highest F-values being 564.74, 94.53 and 78.65 respectively. The increase in the surfactant dosage before critical concentration, temperature and sitting time leads to boosting dehydration efficiency. In addition, a mathematical model was established for the variables, with a coefficient of determination value of 0.9688. Finally, numerical optimisation was performed on the variables and the results show that the optimal values are 1000 ppm, 15.5 mL, −400 mmHg, 120 min, and 90 °C, for demulsifier dosage, toluene concentration, pressure, sitting time, and temperature, respectively.

1. Introduction

A major challenge that the oil and gas industry faces is the presence of more than 80% water during the production process on oil and gas platforms. This water naturally comes from two sources—the reservoir and from being injected during hydrocarbon extraction [1]. Most of the water in the wells is produced as an emulsion in the surface facilities, the pipelines, and the wellbore. The percentage of water produced from wells increases with the increasing age of wells [2]. The physical and chemical characteristics of the water produced affect the hydrocarbon composition, the water injection history, and the geographical location of the oil reservoir geology [3]. In addition, the emulsion contains organic and inorganic compounds (Na+, Cl, CO32−, SO42−, HCO, etc.), chemical materials used during the extraction process, and heavy metals (Zn, Cd, Pb, Cu, etc.). Accordingly, all these compounds cause serious problems in petroleum refineries such as fouling, corrosion in equipment and pipelines, and toxicity of catalysts in the upstream facility [4,5]. Thus, emulsions should be divided into two phases—water and oil [6]. Crude oil contains several hydrocarbon compounds such as aromatic compounds, alkenes, carboxylic acids, phenols, naphthenes, etc. Asphaltenes are considered the heaviest components in the mixture. Asphaltenes stabilise the interfacial phase between the water and oil phases by creating a protective layer and strengthening the stability of the interfacial film [7]. However, there are many techniques that can be used for the dehydration of crude oil from water. The chemical demulsification method is considered a common method that employs surface active agents (surfactant) as chemical additives [6,8]. The main challenge in the petroleum refining process is to identify the most effective variables to destabilise water-in-crude oil emulsions. Recently, many studies on chemical demulsification have been conducted. Wolf-Pet et al. [9] used chemical demulsifiers to break up water-in-oil emulsion with a 50:50 (v/v) mixing ratio. The demulsifiers were based on natural Alginite. The study recycled the Alginite via thermal treatment. The results showed that the emulsion was successfully broken down into two phases. By adding 0.5 wt% of demulsifiers, the viscosity of emulsion decreased and the size of water droplets increased. Recycling the Alginite had a negative effect, though; it reduced the efficiency of the demulsifier in comparison with the native compounds. Wanli Kang et al. [10] studied the demulsification efficiency of non-ionic surfactant in water in light crude oil. The results showed that the demulsifiers significantly destabilised the emulsion and enhanced the dehydration process. Abdurahman et al. [11] investigated the influence of microwave heating in destabilising a water-in-oil emulsion. The results showed that microwave radiation had a significant effect on demulsification performance. Kedar et al. [12] investigated the influence of salts, several demulsifiers, and the dynamic interfacial tension (DIFT) of the interfacial film between water and crude oil. The result showed that salts more effectively reduced the interfacial film tension, accelerating the demulsifier molecule migration towards the interface film and enhancing the chemical recovery of crude oil. Maaref et al. [13] focused their research on the influence of seawater salinities, investigating water from the Persian Gulf, the Red Sea, the Mediterranean Sea, and the North Sea on the stability of a water-in-crude-oil emulsion. It was concluded that increased salt concentration in water led to reduced stability of the emulsion, due to the rising rate of coalescence and aggregation of water droplets. Rajak et al. [14] studied the influence of pH, demulsifier dosage, temperature, and sedimentation time on dehydration performance. Accordingly, their result showed that increased sitting time, pH, demulsifier dosage, and temperature broke up emulsions more effectively via improvement in water droplet coalescence. Fávero et al. [15] designed and created a new approach to study the asphaltene deposition mechanism. They concluded that the new method helped them understand asphaltene deposition in a viscous flow system at nano-metre scale. Painter [16] investigated the ability of several solvents in dissolving soluble asphaltenes; the selection or classification of the solvent was based on the hydrogen bonds in the solvent or its capability to self-associate as well as its polarity. The experimental results showed that toluene had the highest rate in dissolving asphaltene, as compared to other solvents. Nastaran Hazrati et al. [17] investigated the effect of ionic liquids in the break-up of a water-in-oil emulsion. Full Factorial Design was used for screening and optimising three variables, including anion type, alkyl chain length, and surfactant dosage based on three levels. They concluded that the demulsification performance was increased with increasing demulsifier dosage, length of alkyl chain, and hydrophobicity of ionic liquids. Sara Nageeb et al. [18] used Full Factorial Design for screening several factors. Anil Kumar et al. [19] used Factorial Design for selecting significant parameters in the demulsification of water-in-crude oil emulsion using a green emulsion ionic liquid membrane. Biniaz et al. [8] investigated the effect of demulsifier concentration using three ionic surfactants. The pH, temperature, water percentage from dehydration performance, modelling, and optimal value were determined using Central Composite Design (CCD) based on Response Surface Methodology (RSM). The results showed that the maximum separation of water could be achieved with high temperature and pH close to neutral value. Hussain et al. [20] studied the influence of surfactant-polymer, alkali-surfactant, and alkali polymer demulsifier on the destabilisation of the water-in-crude-oil emulsion. They concluded from the results that the interaction between alkali and polymer surfactant had the highest impact on the demulsification performance. Fouladitajar [21] applied CCD based on RSM to design the modelling process and optimise the microfiltration of gas in an oil-in-water emulsion. Roshan et al. [22] investigated the effect of different surfactants on the dehydration process of water-in-crude oil emulsion using the bottle test technique. CCD was applied based on RSM to establish mathematical models for optimisation, while Analysis of Variance (ANOVA) was used to conduct the statistical analysis. The experimental result showed that all surfactants had a significant impact at high temperature and dosage of surfactant. Thus, RSM was utilised for designing the experimental, analysing the parameters dependent on analysis of variance, and developing the quadratic polynomial formal based model to study the influence of parameters on response and optimisation of the condition of process [23,24].
Moreover, the non-ionic surfactant is less used in demulsification of water in oil emulsion in comparison with other types of surfactant [2], while the properties of non-ionic surfactant are very promising. Glycerol based on non-ionic surfactant with the hydrophilic end do not have any negative or positive charge, do not ionise in aqueous solution and therefore do not have a corrosion effect, because of no counter ion and natural neutral. Also, glycerol can apply to different types of crude oil because it is less sensitive to electrolytes and change in pH, which makes it suitable for use with many sorts of crude oil, including high salinity and acidic crude oil [25,26]. Also, glycerol can be used in demulsification water in oil emulsion in small dosage, which make it very economical in comparison to ionic surfactant, as well as contributing low toxicity to the environment [27]. By comparing Glycerol with other non-ionic surfactants, such as octyl phenol 9-10 ethylene oxide, it is as valuable as any other non-ionic surfactant and has a good surface activity [28]. The non-ionic surfactant is characterised by its capability of dispersing in water and its ability to form micelles in water; its thermal stability and its higher density lends well as a surface active agent in emulsion [29,30]. Glycerol based alcohol is both hydrophobic and lipophilic, making it preferential for diffusing in the interfacial film between the two phases; additionally, the glycerol is a hydrophilic surfactant (water soluble) and this gave it the capacity to make hydrogen bonds with water droplets and force them to link together [26].
Moreover, by conducting an in-depth literature review, it is found that there is still a significant gap in information for using the other variables with demulsifier that can be used to enhance the oil recovery, depending on resolving the basic reason for water droplets stability in oil (asphaltenes) and providing the best condition for the demulsifier to achieve maximum separation in a short time. Additionally, asphaltenes in crude oil are the most problematic components through absorbing the molecules on the interface between oil and water which makes a high rigid film. The highest level of stability emulsion can reach is when the asphaltenes are at precipitation point or close to it [31]. As a result, reduction in asphaltene precipitation is a promising technique to enhanced oil recovery. Consequently, this study investigates this hypothesis by using variables that reduce asphaltenes precipitation on the interfacial film between two phases with a demulsifier to achieve high demulsification efficiency in a short time. To the best of our knowledge, we could not detect a study on asphaltenes film with using a demulsifier, which can be a promising technique in maximising the separation efficiency of water from crude oil and using Glycerol as a demulsifier. Finally, according to previous literature, it can be concluded that temperature, sitting time, toluene solvent, and demulsifier dosage have a significant impact on the demulsification of a water-in-oil emulsion. In addition, this study also aims to investigate the pressure effect on the dehydration process due to a lack of studies in this area [32]. The present work studies the influence of demulsifier dosage, toluene concentration, sitting time, pressure, and temperature on the demulsification of water-in-oil emulsion using the bottle test technique. In addition, Design Expert software was used following two steps—first, the significance of parameters was characterised using a Pareto chart. Second, a mathematical model was established to optimise the significant parameters, while the statistical analysis was conducted using CCD based on RSM. The influence of variables on the output response was also studied via CCD based on RSM.

2. Material and Methods

2.1. Materials

The chemicals used in this study were supplied by Laboratory and Scientific Enterprise Company. The purity and analytical grade of the chemicals exceeded 99%. The viscosity, density, and water content of the synthetic oil used in this study were measured according to ASTM D445, ASTM D70, and ASTM D4007, respectively. Table 1 shows the characteristics of the synthetic oil. The American Petroleum Institute (API) of synthetic oil was calculated according to Equation (1).
A P I = 141.5 S p e c i f i c   G r a v i t y 131.5

2.2. Demulsification Procedures

The bottle test technique is considered a common method for studying the performance of demulsifier efficiency in breaking water-in-oil emulsion into two phases [33]. In this study, brine water was mixed with synthetic oil using a homogeniser (S STECTM, ST-H500) for five min at certain speeds (15000–17500 rpm) and then placed in a sonicator (Qsonica, Q500, Connecticut, USA) for five minutes. The percentage of brine water in the emulsion was 25% and the salt concentration in the water was 3% (NaCl). The mixing ratio of water to synthetic oil was 1:3 )v/v). Asphaltenes were added as a natural interfacial active compound in the synthetic oil to stabilise the interfacial film between the two phases. This was done by adsorbing the polycyclic aromatic and aromatic hydrocarbons on the water–oil interface, rendering it difficult to break up the rigid film [34]. The stability of emulsion was tested by storing the emulsion at room temperature for one day; no sign of water separation was noticed at the end. Next, 30 mL of the prepared emulsion was mixed with toluene and surfactant using a shaker (Stuart®, orbital shaker SSL1, Staffordshire, UK) for ten min and injected into a 50 mL graduate vacuum tube. The tube was discharged from air using a vacuum pump (Edwards, RV12, Florida, USA) and put in a water bath, and readings were taken at different times. Furthermore, the experiments were designed with variations in the variables such as surfactant dose, toluene concentration, pressure drop, temperature, and sitting time. The performance efficiency of the demulsifier in breaking the emulsion was calculated following Equation (2), where DE is the demulsification efficiency, v is the separated water, and vo is the initial volume of water [33]:
D E = V V O 100

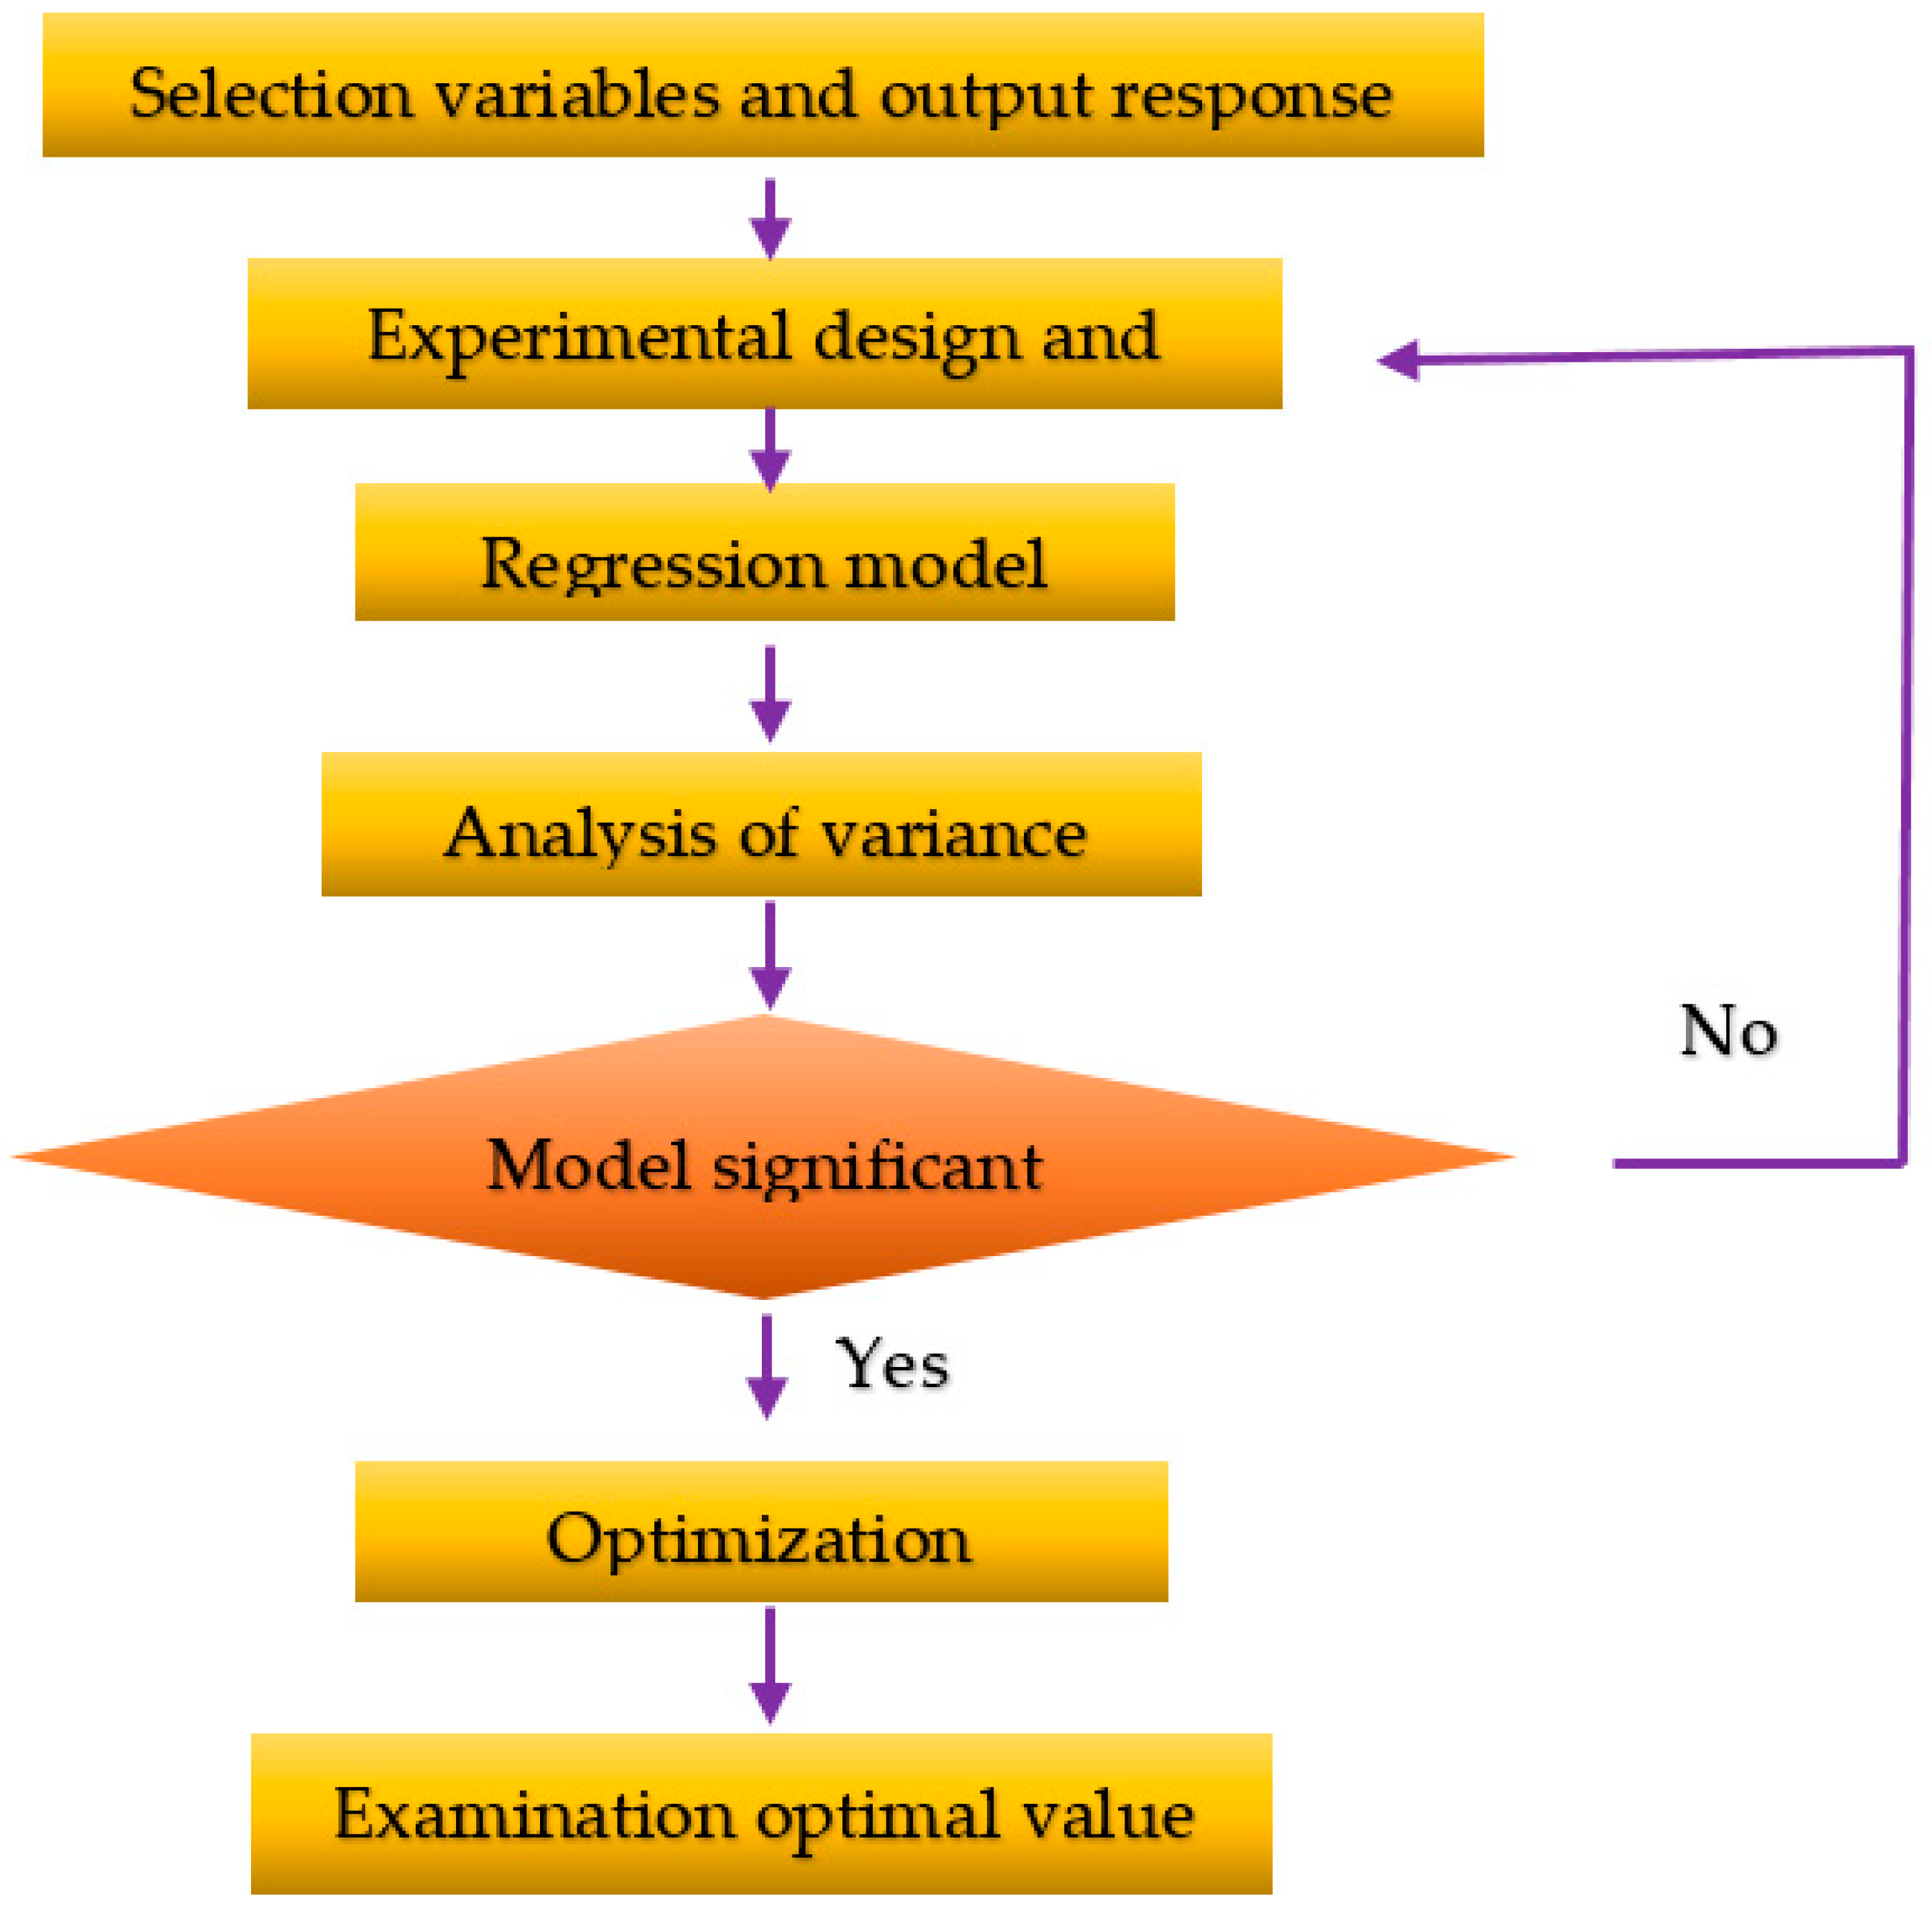
2.3. Experimental Design

Numerical designs of experiments were used in this work to perform numerical simulations of the demulsification process in order to enhance and optimise the variables, so that the time and cost of the process could be reduced and the influence of variables on the response (demulsification efficiency) studied [35]. Design-Expert (V11.0.0, Stat-Ease Inc., Minneapolis, MN, USA) software was used for optimising the chemical and physical variables including demulsifier dose, toluene concentration, pressure drop, temperature, and sedimentation time. Two-level Factorial Design (2k−1) was used with k representing the number of variables, to screen and investigate the significance of parameters in two levels for each parameter. The distinctive properties of the two-level Factorial Design include a reduced number of experiments compared to the traditional method and the characterisation of many variables in a specific range [36]. Also, the output response of the system designed may be influenced by numerous factors, and it will be difficult or impossible to control and identify the small effect of each variable. As a result of that, it is important to screen variables for determining which factors and their interactions have a significant influence on the response. The fractional two-level designs utilised for this purpose is an economical and efficient tool [37]. Also, the utilised fractional factorial design helps in reviewing the raw material, critical steps, the whole system, and equipment, as well as the possibility to make a change in the system in a short time. The data obtained were analysed by the following Equation (3):
y = β o x = 1 k β x Z x + α
where α, Zx, βx, βo represent the error in the experiments, variables, linear factors coefficients, and constant term respectively, while k is the number of parameters. Additionally, the most advantage of using fractional factorial design for estimating the significant influence of variables and their interaction is by reducing the number of experimental to the minimum level, which makes it very economical design in RSM, as explained in the literature [37,38]. In addition, RSM was used in this research, as it is considered the most powerful tool for optimising, predicting, modelling, and designing the experiments for different parameters [39]. In addition, the main reason for using RSM is to find the optimal value of different variables to achieve maximum demulsification of water-in-oil emulsion [40]. CCD is considered a common and popular RSM design used for predicting the quadratic and linear influence of variables on the output response [40,41]. Figure 1 illustrates the steps for applying CCD based on RSM for parameter optimisation.

3. Results and Discussion

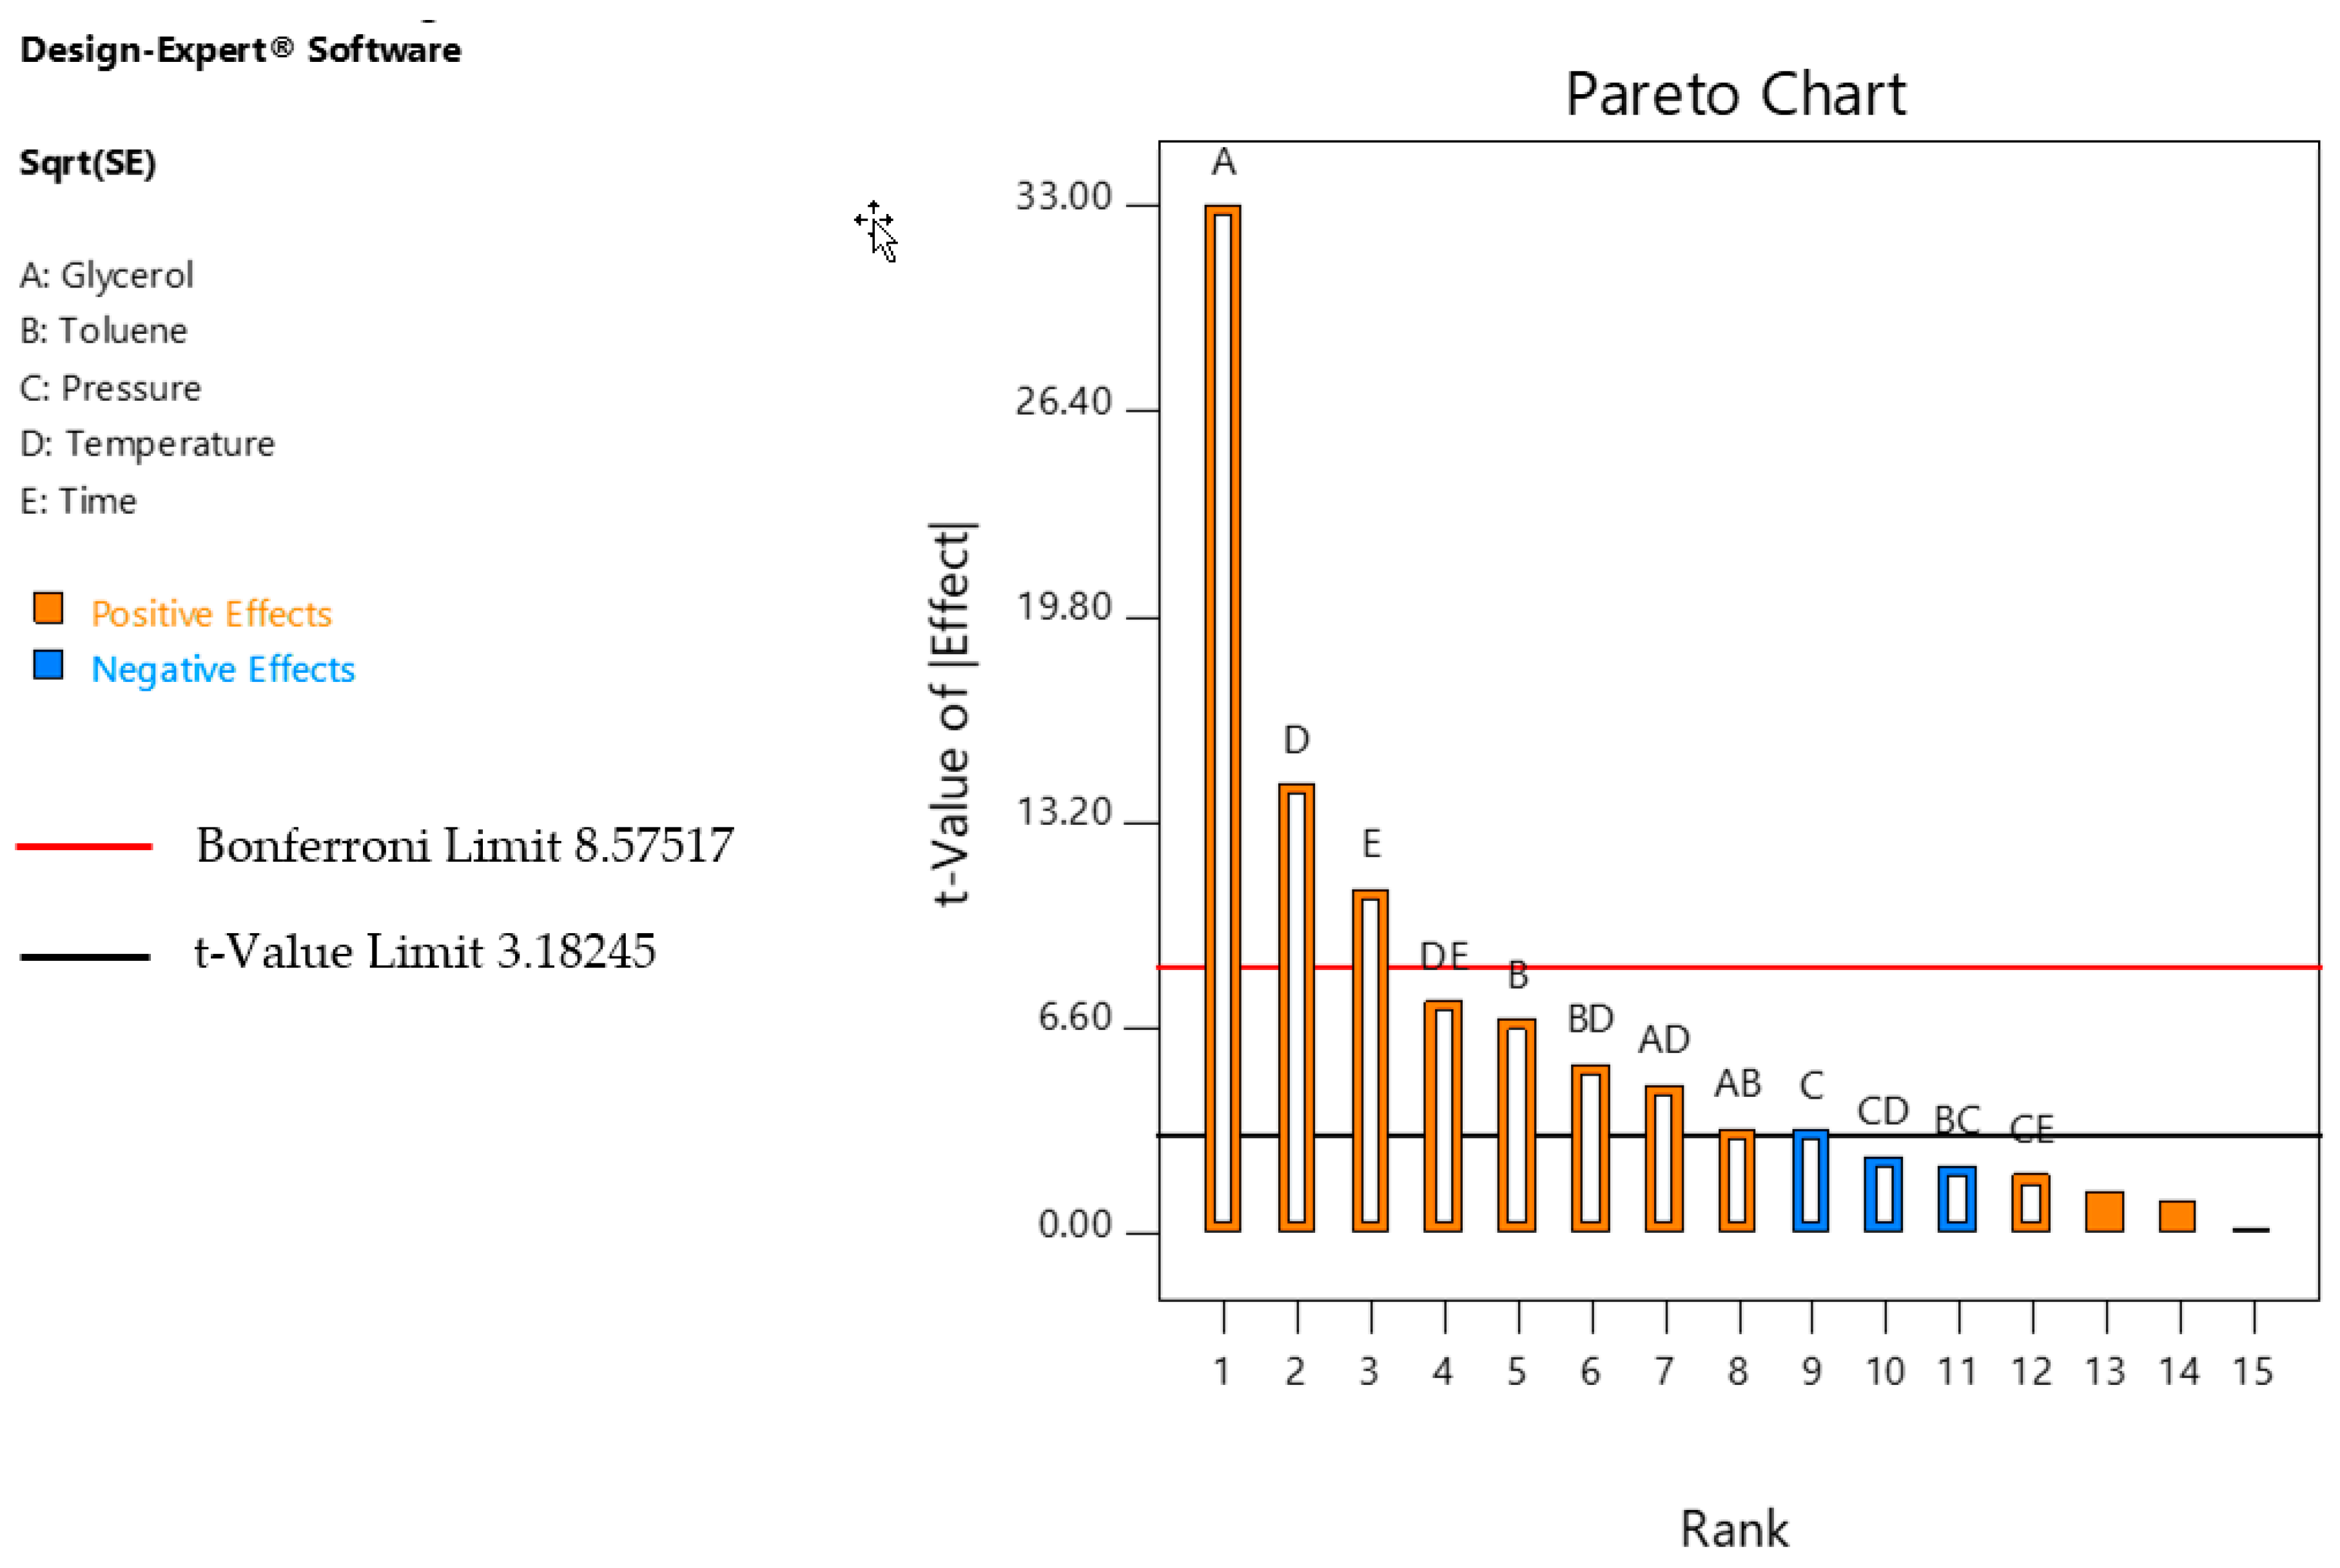
3.1. Two-Level Factorial Design

Fractional Factorial Design was used to characterise the significant effects of demulsifier dose, pressure drop, temperature, sitting time, and toluene concentration on the demulsification process and a Pareto chart at a high level (+1) and a low level (−1) was employed, as illustrated in Table 2.
Sixteen experimental designs were generated according to the formula 2K−1 where k is the number of factors in the experiment. In addition, all experiments were performed randomly to help avoid any influences on the experiment [42]. A Pareto chart was used to characterise the significance of variables and to select the most significant variables on the output response. The Pareto chart depends on the standard deviation to estimate the sampling errors of variables. Two important signs in the Pareto chart are the Bonferroni limit of 8.57517 and the t-value limit of 3.18245 as show in Figure 2. Variables with coefficients above the Bonferroni limit are considered significant factors. These were found to be the terms A, D, and E as clear in Figure 2. Meanwhile, the coefficient below the t-value limit is insignificant. The terms DE, B, BD, AD, AB, and C fell between the Bonferroni limit of 8.57517 and the t-value limit of 3.18245 and are described as significant coefficients as show in Figure 2 [36,42,43].
Accordingly, all parameters, i.e., surfactant dose, pressure drop, temperature, toluene concentration, and sitting time were found to have a significant effect in a specific range. All parameters were used for further analysis using CCD, as it is considered the most powerful tool for establishing a quadratic model and for optimising several parameters compared with other designs [44].

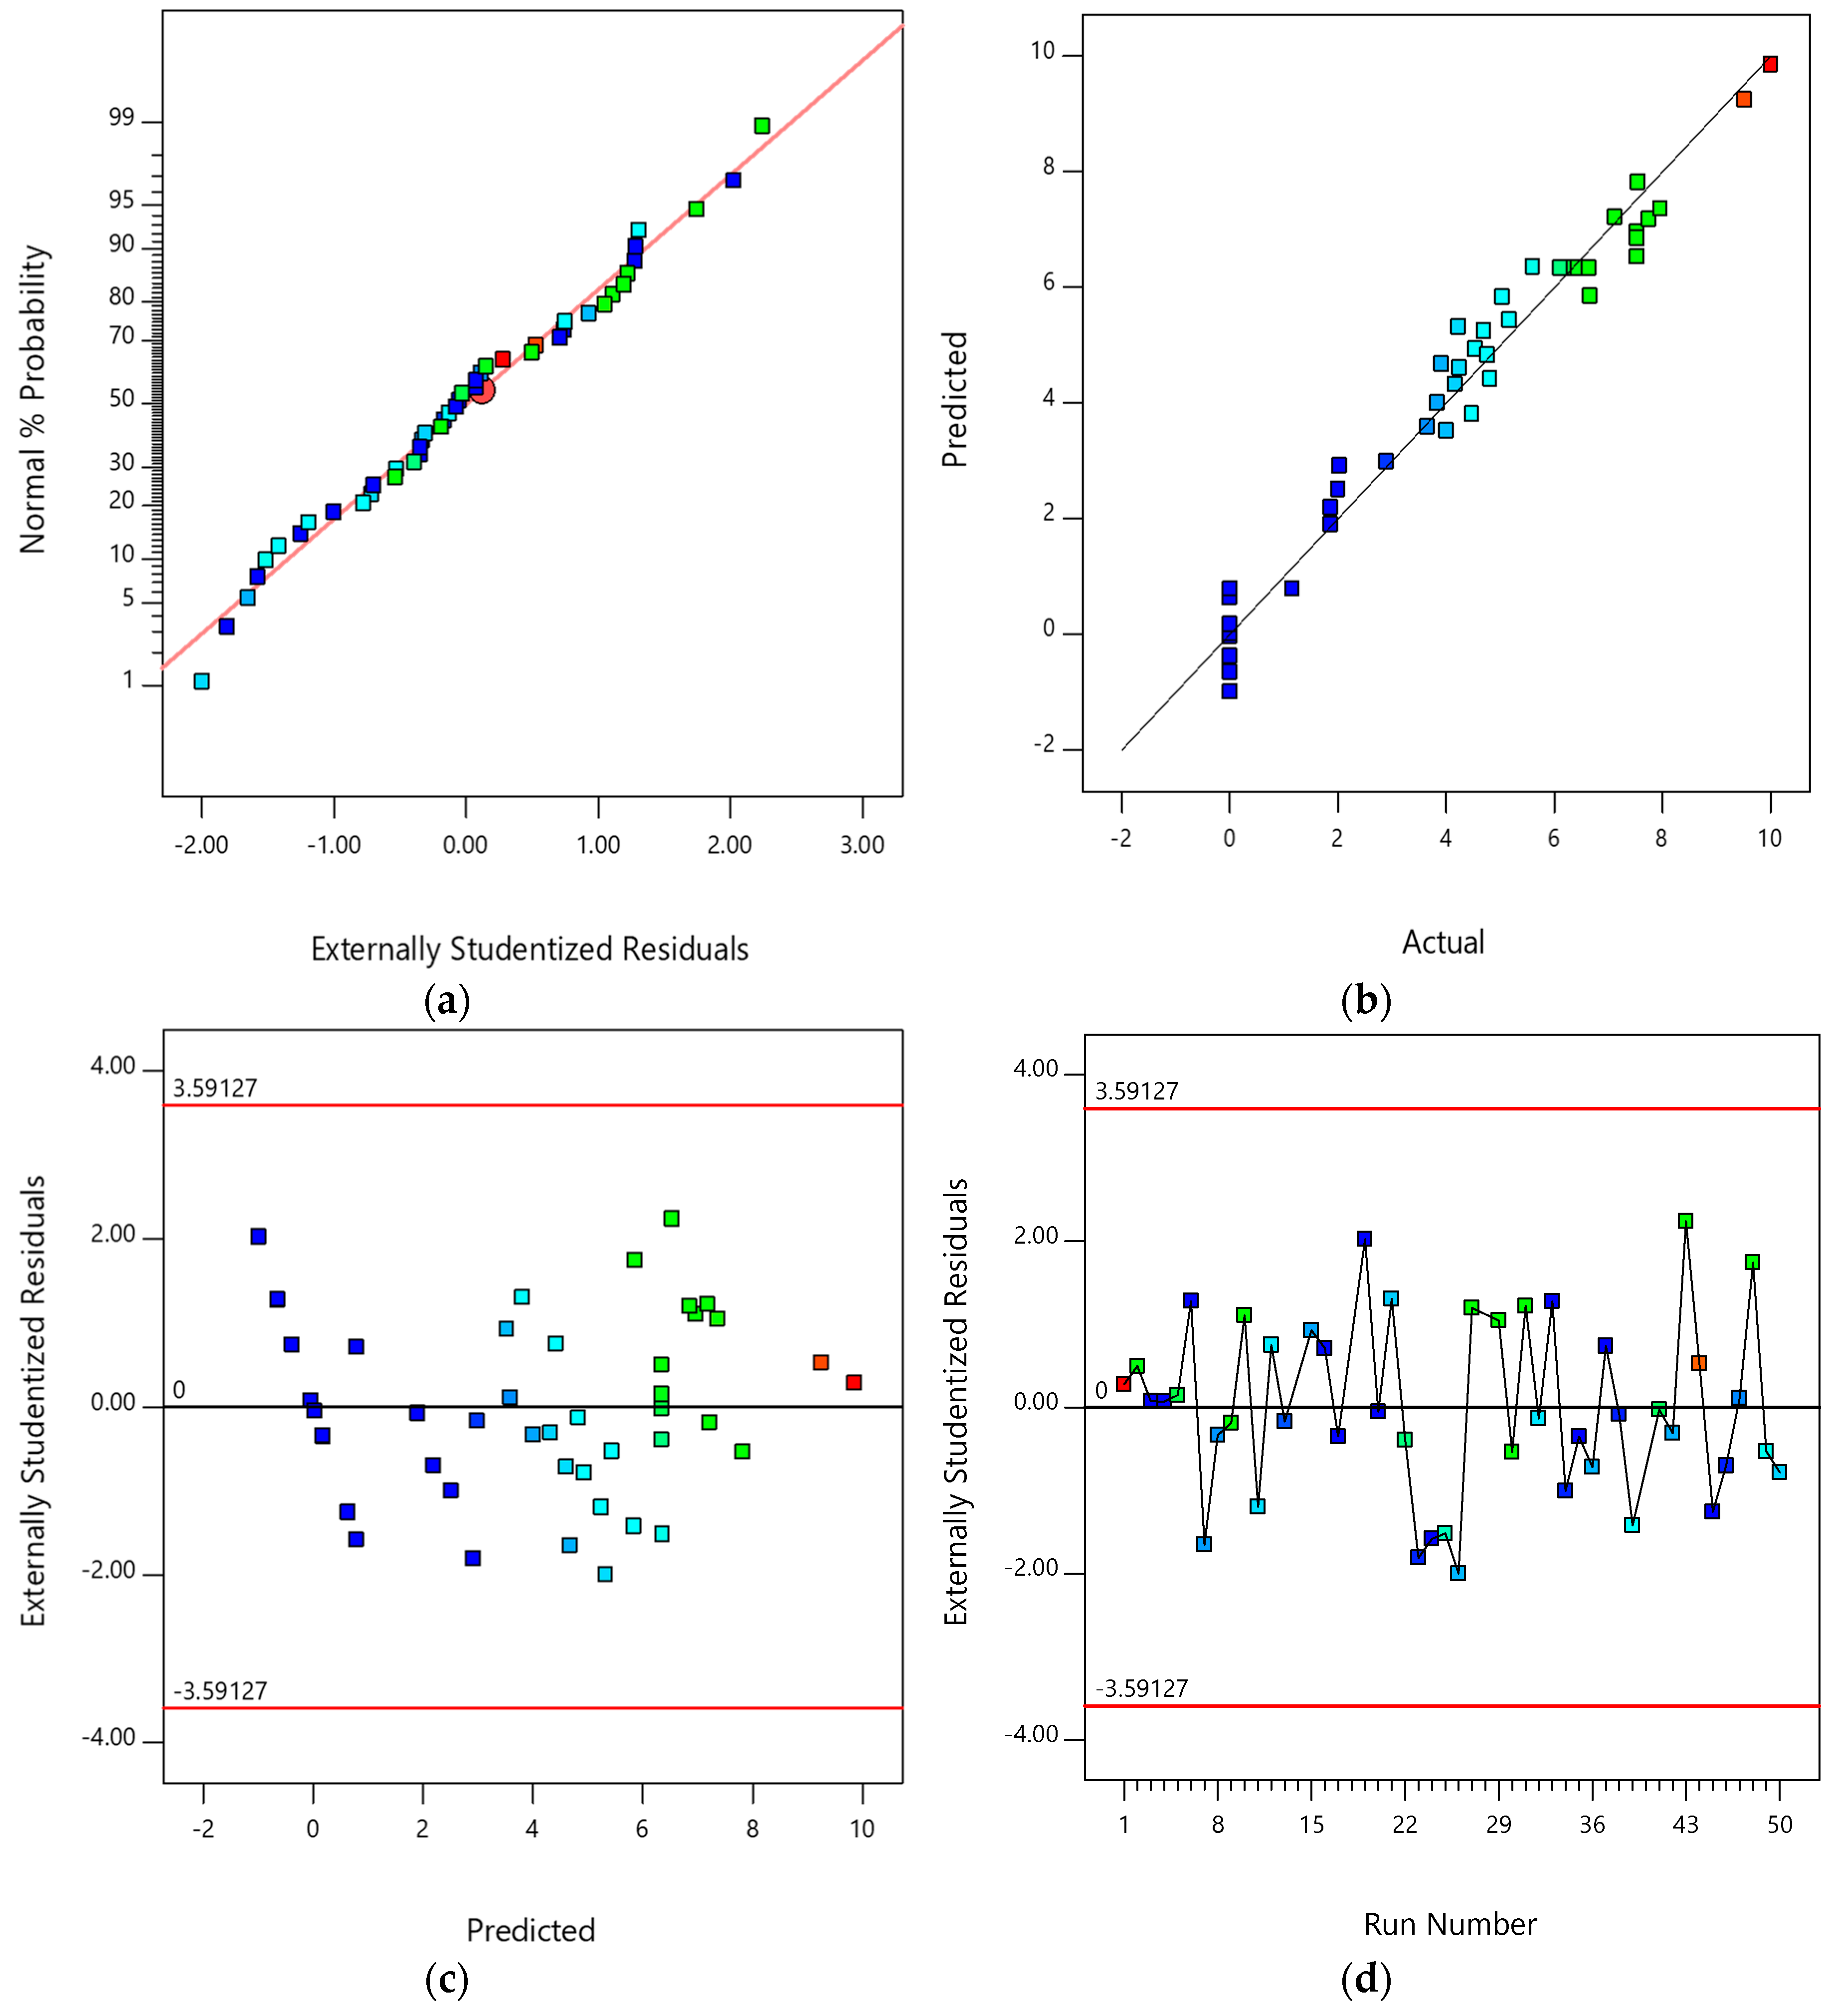
3.2. Statistical Analysis

RSM has attracted numerous researchers’ interest in the last two decades [39]. RSM is a combination of statistical and mathematical techniques used to establish mathematical models, experimental design, parameter optimisation, and to determine the influence of variables and their interactions on the response. RSM examines the accuracy of mathematical models or the design by comparing results from the model with the actual result from the experiment [45,46]. Table 3 shows the independent factors including surfactant dose (A), toluene concentration (B), pressure (C), temperature (D), and sitting time (E), as applied in CCD based on RSM.
All factors were examined at a high level, a low level, and at four central points. The high, low, and central point levels were presented as 1, −1, and 0, respectively, as shown in Table 3. The total number of experiments was calculated using Equation (4) [39]:
N u m b e r   o f   e x p e r i m e n t s =   2 K + 2 K + C o  
where k is considered as the number of factors and Co is the central points. The experimental design was generated with 46 experiments, as shown in Table A1. Quadratic modelling for higher accuracy was used to correlate between independent and dependent factors [46]. Also, the experimental data were analysed using Equation (5):
Y = β o +   i = 1 k β i x i +   i = 1 k β i i x i 2 +   i i < j j β i j x i x j +   ε
where the separation efficiency of water or output response appears as Y. In addition, βo, βi, βii, βij, and ε represent the constant coefficient, slope influence of input variables, quadratic influence, cross output term, and statistical error, respectively. Meanwhile, the parameters are denoted as xi [8]. The result from CCD is shown in Table 4. These were fitted to a square root second-order polynomial response using Design-Expert software, as per the following regression Equation (6) [47].
y = ( 6.34005   +   2.49028 A   +   0.507862 B   +   0.304069 C   +   1.01883 D   +   0.929355 E   +   0.254426 A B   +   0.42002 A D   +   0.253886 B D   +   0.516099 D E   +   1.65511 A 2 +   0.787501 C 2 +   0.737843 E 2 ) 1 2
The five factors, i.e., surfactant dose, toluene concentration, pressure drop, temperature, and sitting time are denoted as A, B, C, D, and E, respectively, while the response or demulsification efficiency is denoted as y. The minus and plus symbols that appear in the model (Equation (5)) show that the variables have a positive or negative influence on the demulsification process [47]. Accordingly, the significance of the factors can be confirmed using P-value and F-value, which are statistical expressions used to indicate the significance of the model and variables. The models or variables with a P-value < 0.05 are considered significant with a 95% confidence level [8]. Thus, the result of ANOVA in Table 4 shows that all the variables A, B, C, D, E, AB, AD, BD, DE, A2, C2, E2 are significant model terms in the demulsification process. The model obtained an F-value of 85.49 and a P-value of 0.0001, implying that it is significant [8]. In addition, increasing the F-value of variables will also increase the influence of variables on the response [8]. The result in Table 4 shows that surfactant dose has the most significant influence on dehydration efficiency with the highest F-value (564.74), while pressure has the least influence on the output response with an F-value of 8.42.
The ANOVA result shows that the coefficient of determination, R2, for the model is 0.9688, which means that the quality of the model is 96.88%. The adjusted R2 for the model is 0.9575, which shows that there is a good agreement between the results predicted by the regression design and experimental data. A reasonable agreement between the adjusted R2 and predicted R2 indicates an adequate model, as shown in Table 4 [48].
Furthermore, it is crucial to ensure that the selected design gives sufficient approximation of the results to that of the actual experiment. Subsequently, diagnostic plots are one of the techniques used for this purpose, as illustrated in Figure 3a,b. All plots in Figure 3 represent a comparison of results from the model and the actual experiment [49]. The plots in Figure 3 represent the experimental runs that were dispersed randomly across a constant range of residuals. The plot indicates that the constant variance assumption and model are sufficient. Figure 3b is the most important graph, as it draws a comparison between the actual result and the predicted result from the design using Equation (5); the points gathering around a straight line represent the output response. The graph shows good agreement between the predicted and actual values. Also, the adjusted R² (0.9575) confirm the results in the graphs of Figure 3. The value of the adjusted R² is close to 1, which shows high agreement between the actual and predicted results [49,50]. Meanwhile, Figure 3c shows the relationship between the predicted values against the actual values to determine the standard deviations for normal probability. All results in the graph show underlying errors and the graph indicates normality for the experimental result. Finally, the residuals versus experimental runs were used to analyse the goodness-of-fit of the model using an internally studentised construction, as shown in Figure 3d. The difference between the fitted value under the theorised model and the response measurement showed a value represented by the residual. Meanwhile, the reliability of experimental data increased with smaller absolute value and the result showed that the model prediction was accurate [51,52].

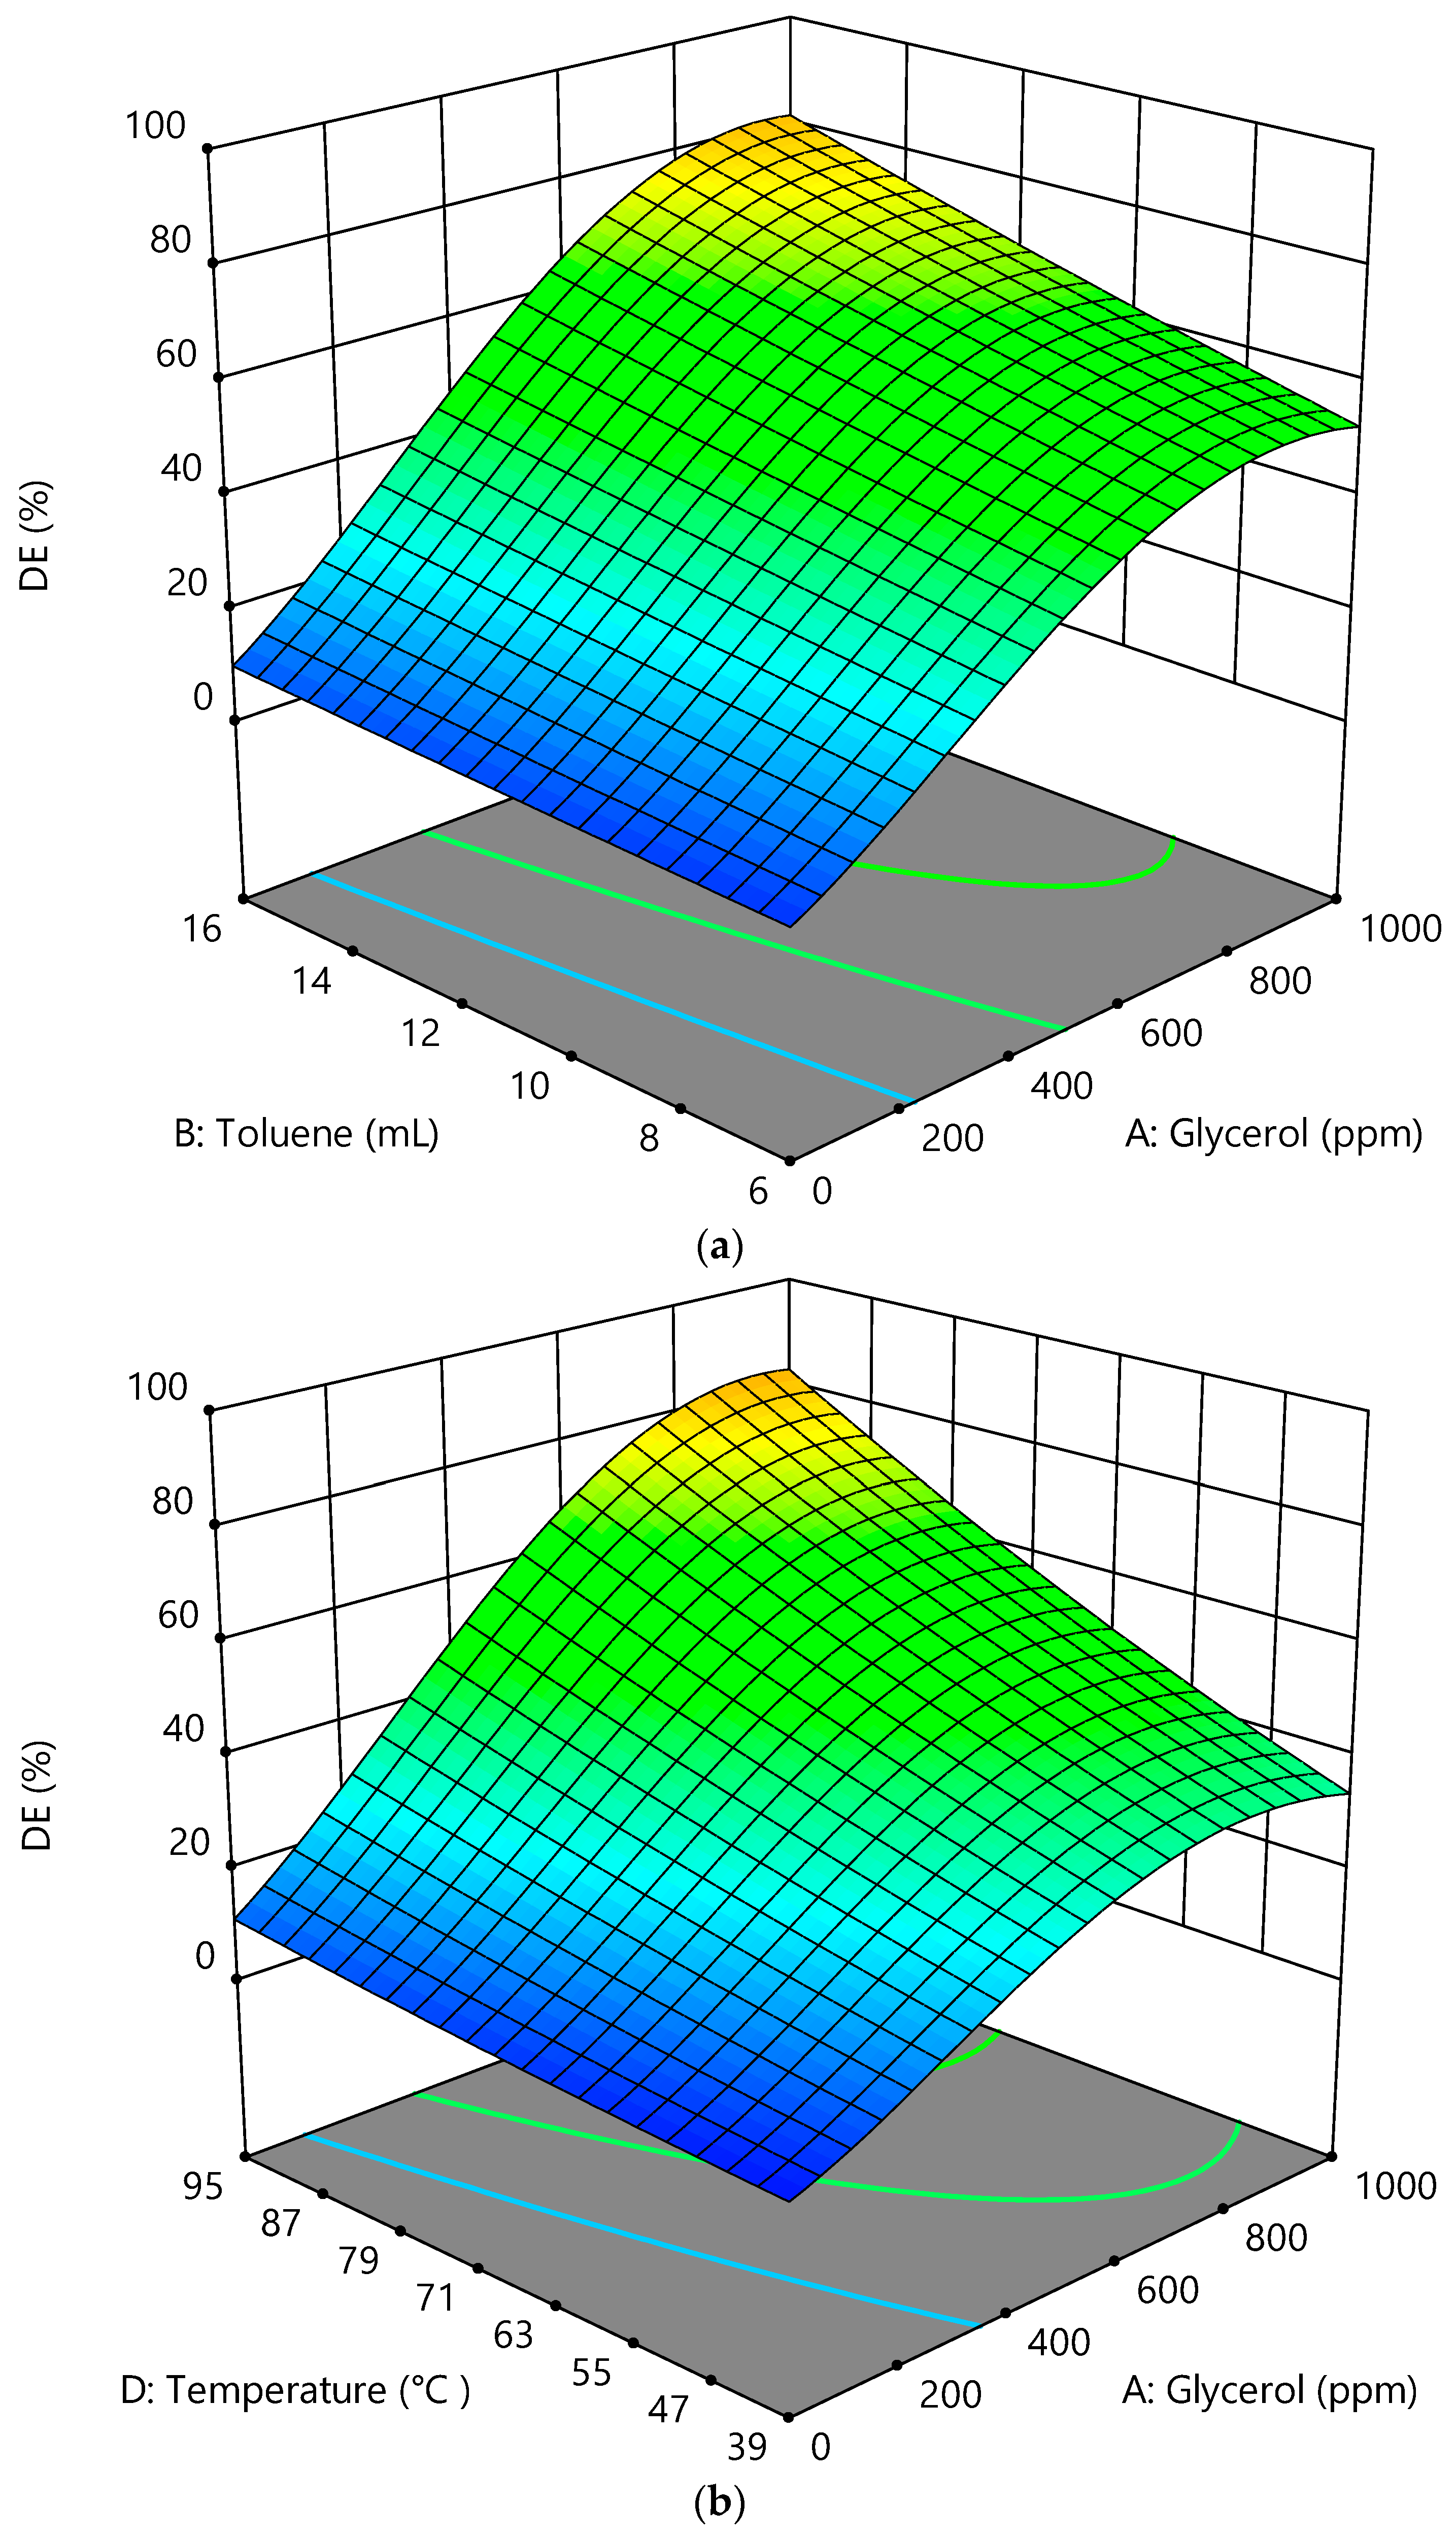
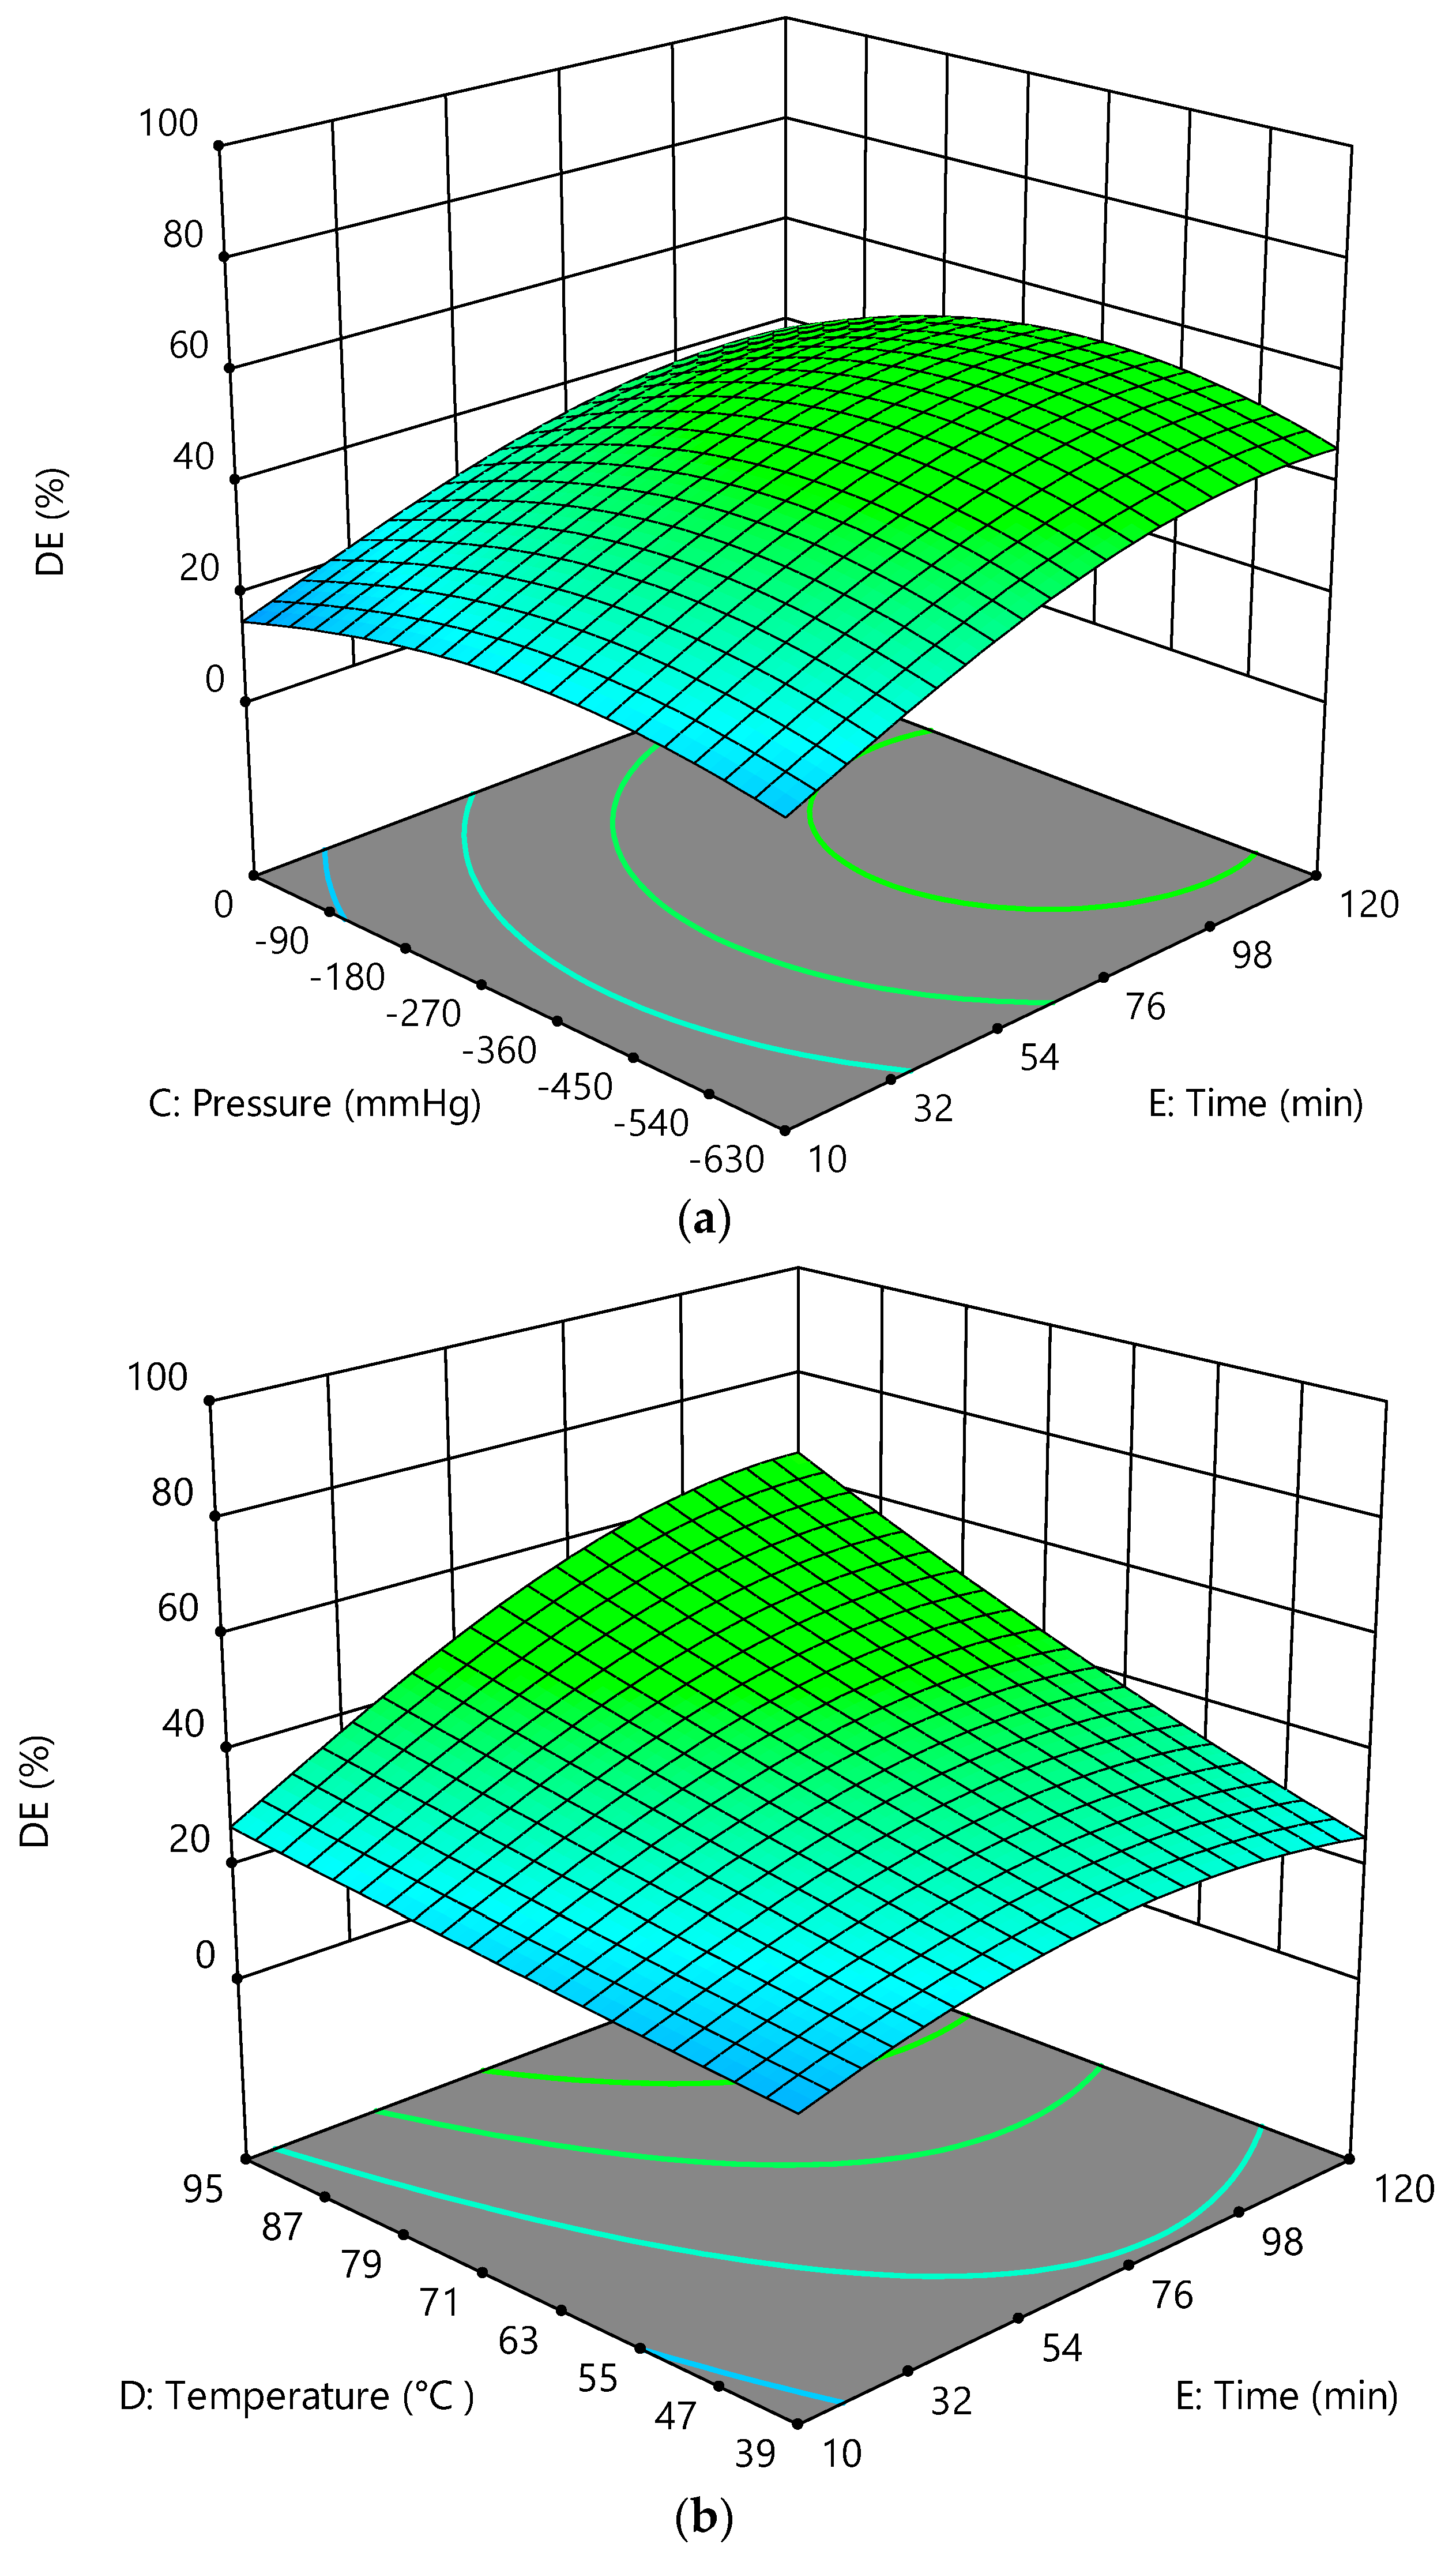
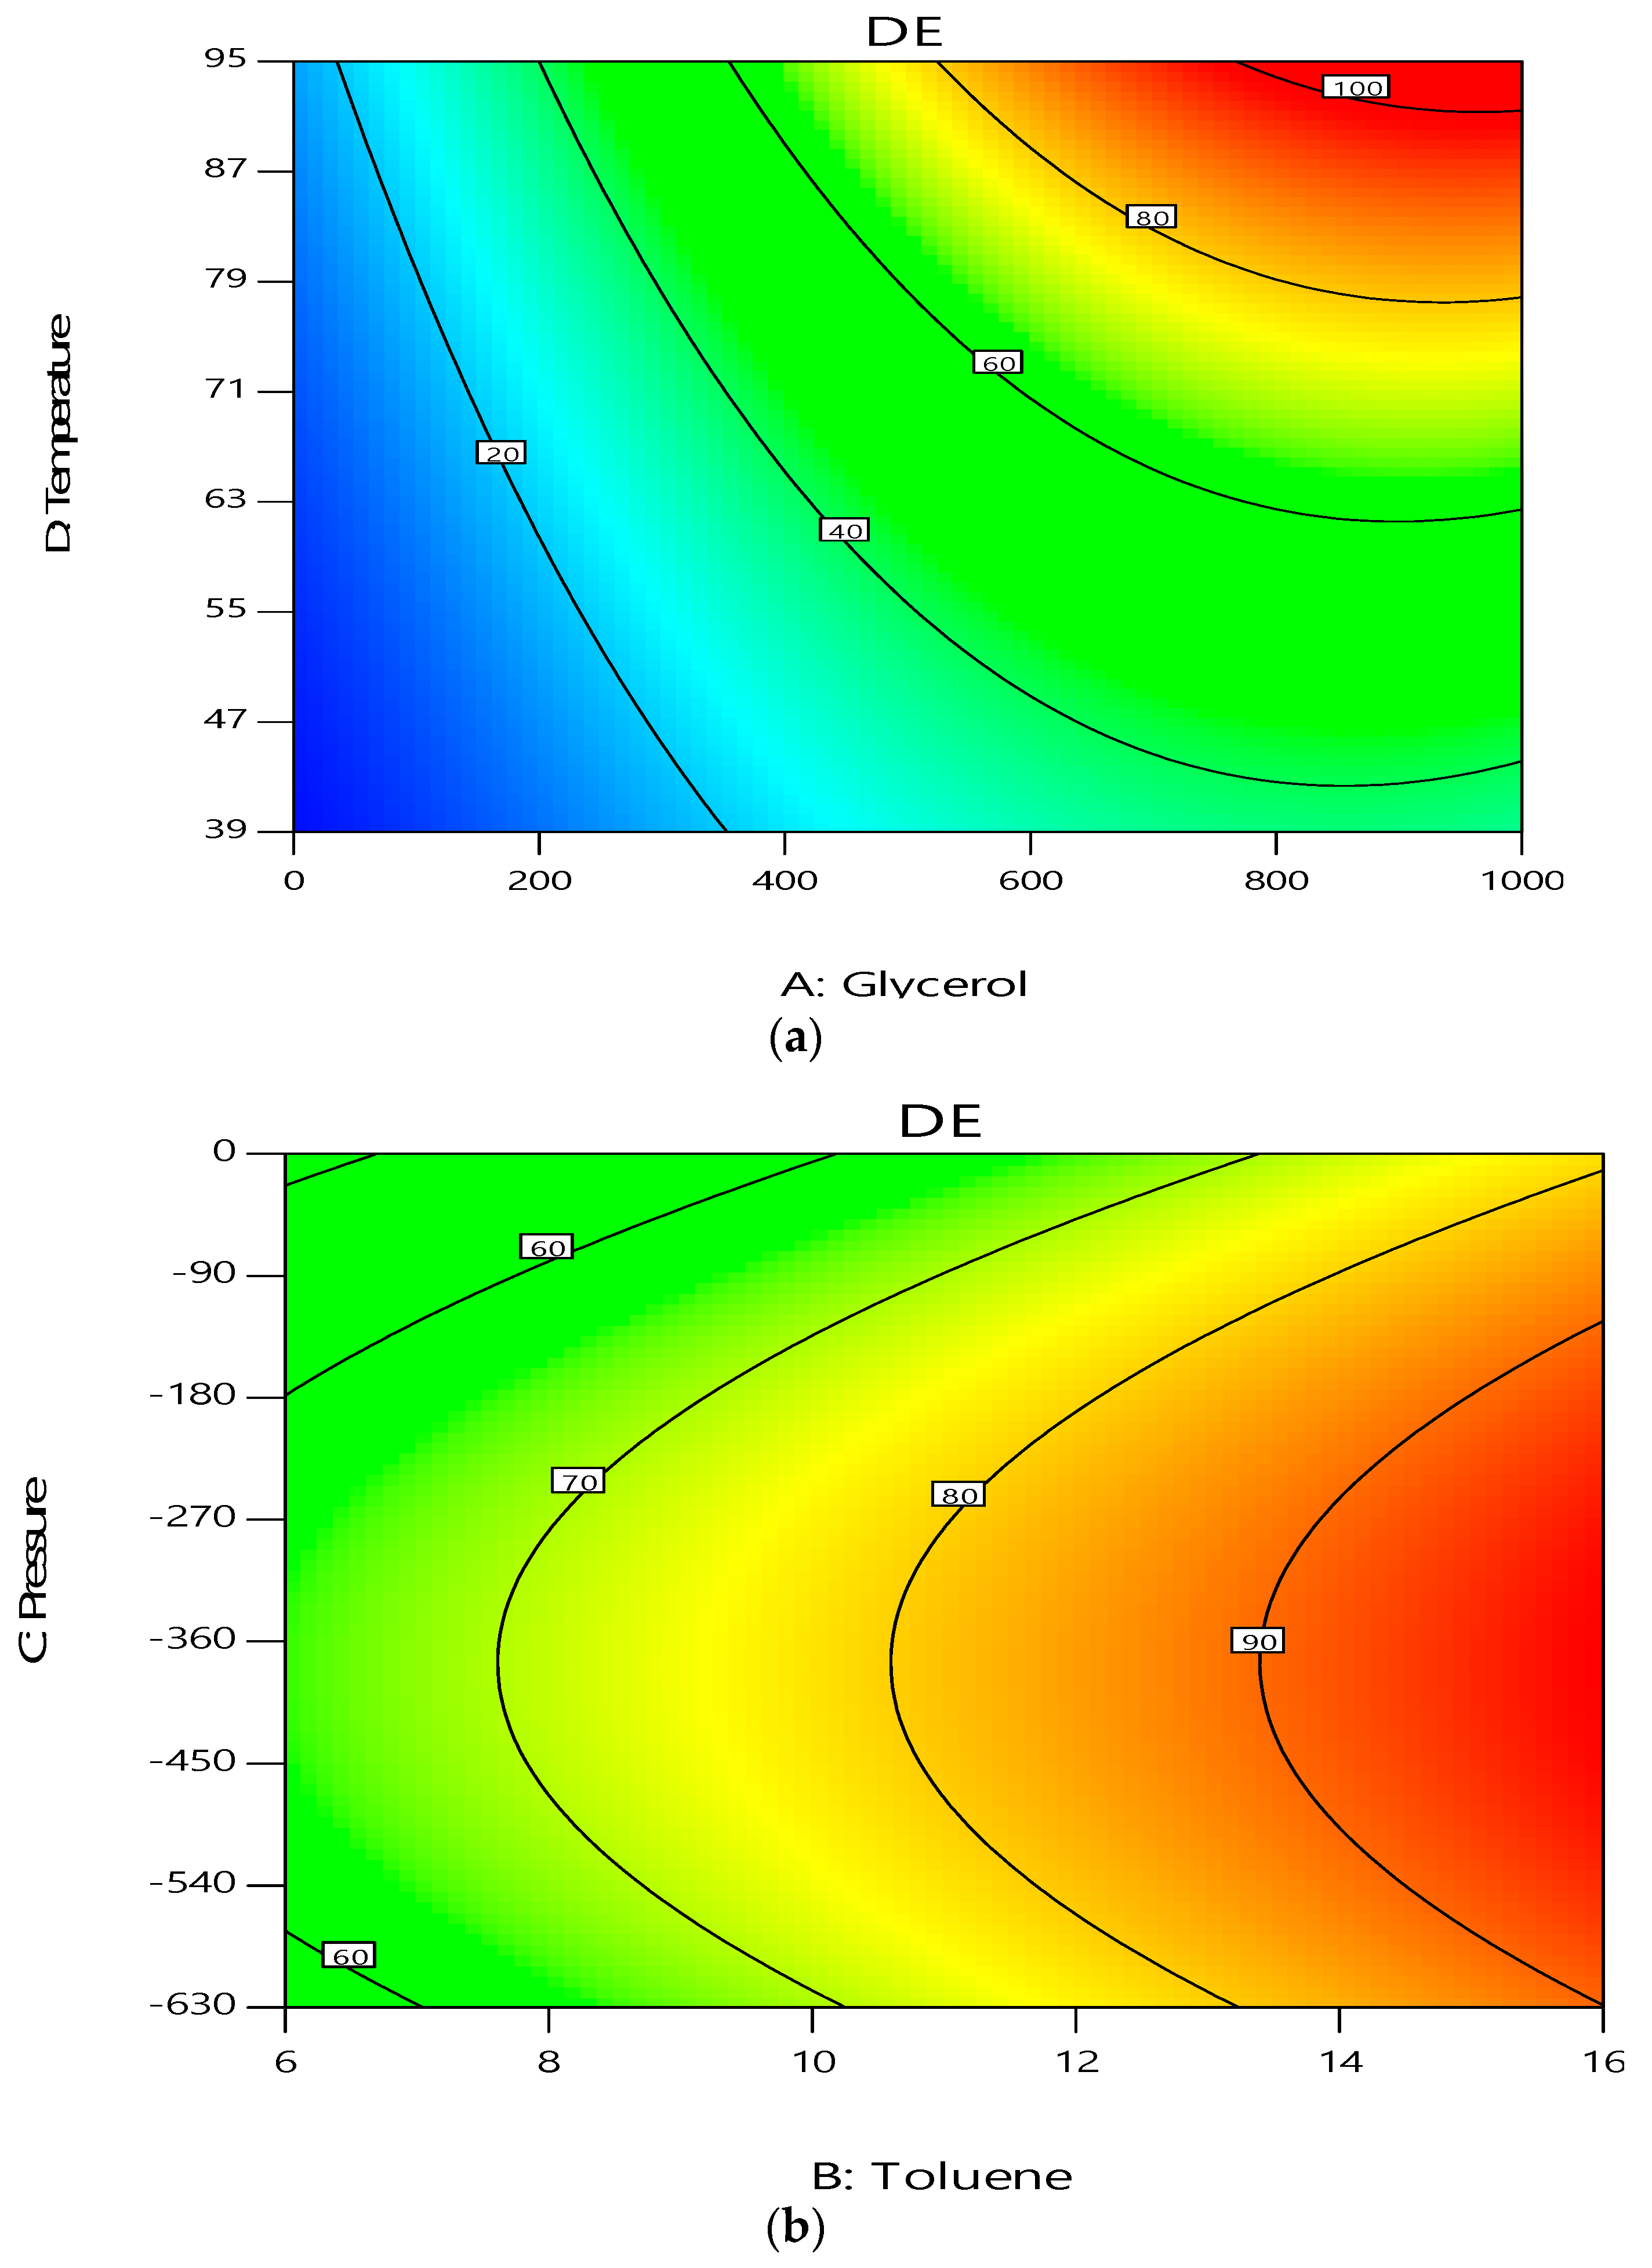
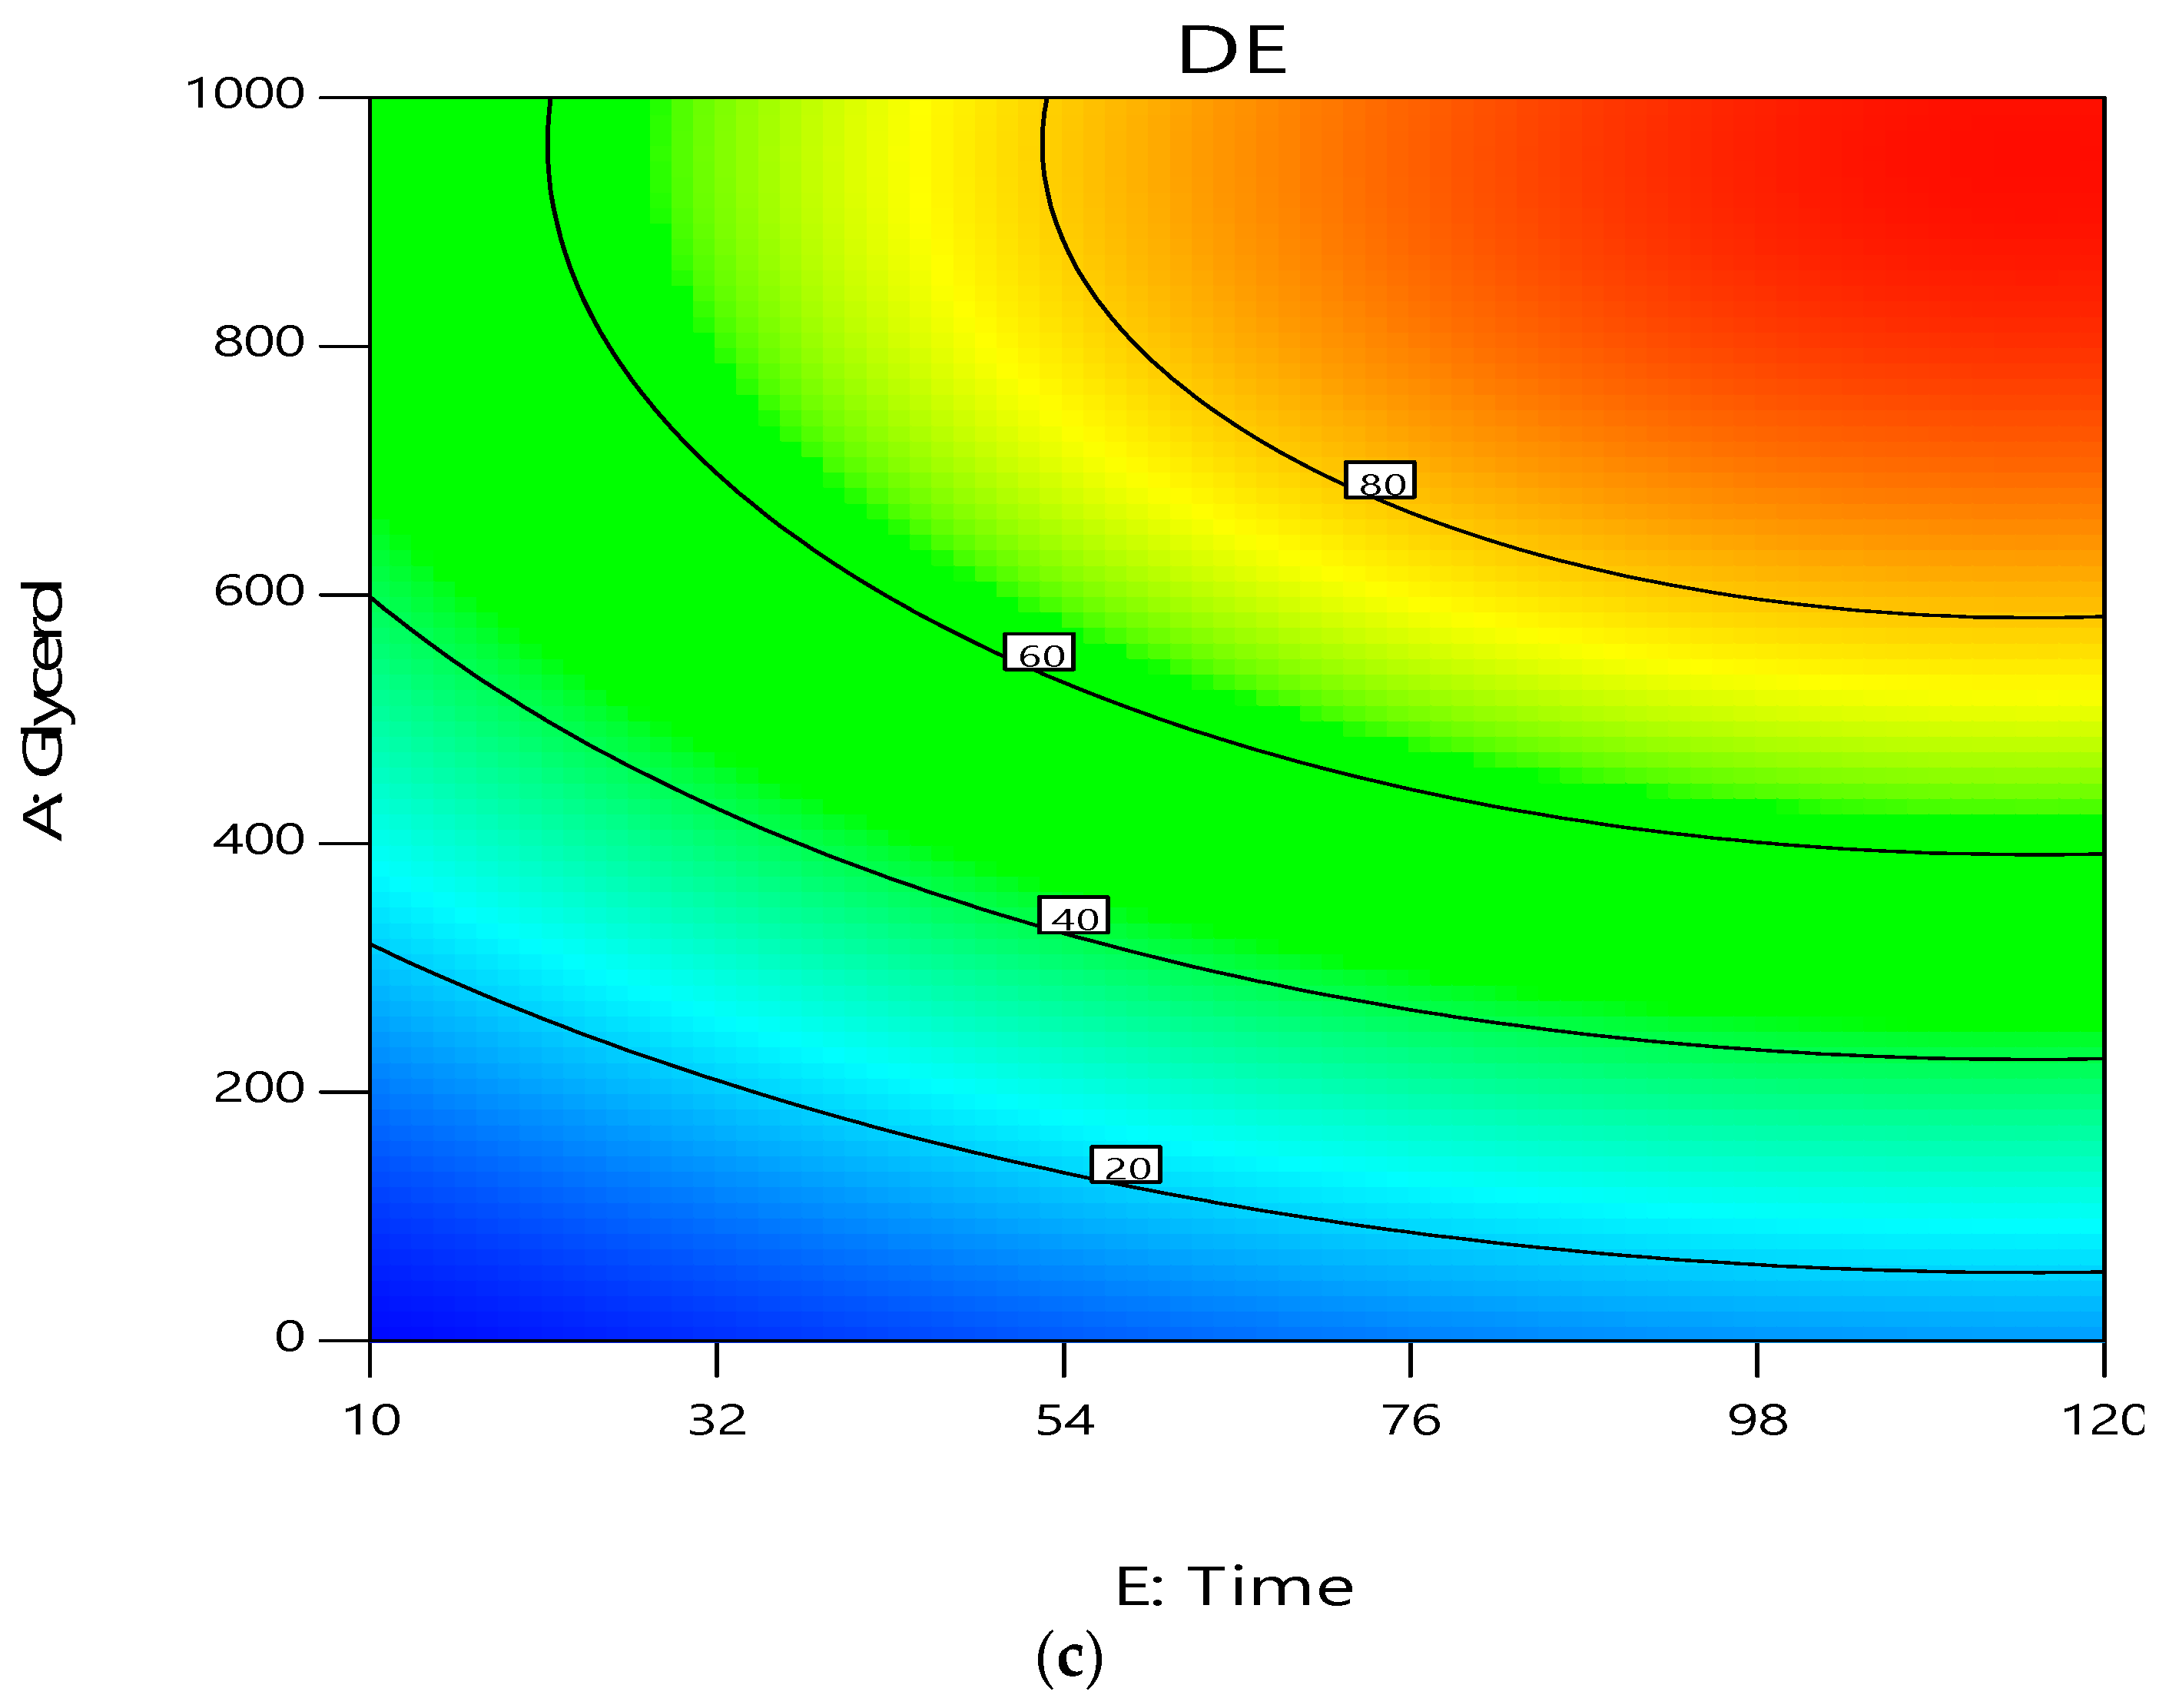
3.3. Parameter Influence and Their Interaction with Demulsification Efficiency

Three-dimensional graphs were generated using CCD based on RSM to study the influence of variables and their interaction on the output response. Figure 4a,b show the effect of demulsifier dosage, toluene solvent, temperature, and their interaction on separation efficiency, while other factors were fixed at constant levels. A non-ionic demulsifier was added to the emulsion in the range of 0–1000 ppm. In addition, at a low dosage of demulsifier of less than 300 ppm, the effect of surfactant on separation efficiency was limited, but with an increasing dosage in the emulsion, the influence of surfactant increased. The reason behind the rising influence of surfactant with increasing dosage of surfactant in the emulsion is the breaking mechanism of the water-in-oil emulsion. The demulsifier atoms are divided into two parts—hydrophilic and lipophilic; the lipophilic part dissolves in the oil phase and the hydrophilic part dissolves in the water phase. Therefore, with increased concentration of demulsifier in the emulsion, the deposition of surfactant molecules on the water–oil interface increases until a sufficient extent was reached, such that the film between the interface thinned until it collapsed and water droplets coalesced; this thereby increased the separation efficiency, as shown in Figure 4 [27]. However, with increased surfactant dosage to approximately above 800 ppm, the efficiency of water separation is reduced. This is because the surfactant molecules started acting as an emulsifying agent after the critical aggregation concentration is reached [8].
Moreover, the most effective factor in stabilising emulsions is the asphaltene content in crude oil. Asphaltenes establish a protective layer that covers the water droplets with a rigid film; therefore preventing water droplets from coalescing [53]. To address this issue, toluene was added to dissolve the protective layer of asphaltene and enhance the emulsion destabilisation process. Toluene is a good solvent for dissolving asphaltene [31]. Figure 4a shows the significant influence of toluene on destabilising the water-in-oil emulsion through dissolving the protective layer of asphaltene that covers the water droplets. Toulene ruptures the interfacial film between the water and oil phases leading to enhanced water droplet coalescence and increased water separation efficiency. At the same time, the result in this section shows good agreement with other research [54].
Figure 4b shows the influence of temperature on dehydration efficiency. In addition, the mechanisms of temperature in enhancing the efficiency of the demulsification of water in oil are based on reducing the viscosity of oil (continuous phase) and reducing the interfacial viscosity of water (dispersed phase), which will lead to accelerated water sinking. The other effects of increasing temperature on destabilising the emulsion are the enhancement of the interaction between asphaltene–water and asphaltene−asphaltene molecules by increasing the functional groups in asphaltene and decreasing the size of aggregates in the asphaltene, leading to weakened hydrogen bonding and increased dilatational viscoelasticity. Thus, water droplet coalescence is increased with increasing temperature [55]. It is concluded from Figure 4b that increasing the temperature will increase the efficiency of the dehydration process, which is consistent with the ANOVA results listed in Table 4.
The interaction between experimental parameters is illustrated in 3D graphs. According to the ANOVA result in Table 4, the terms AB, AD, BD, and DE are significant model terms. The highest F-values were obtained by DE, AD, and AB, which also had the highest effect on response. Figure 4a shows the interaction between surfactant dosage and toluene concentration with the other parameters fixed at a constant level. It is obvious that surfactant dosage has a significant effect on dehydration efficiency, with the maximum influence occurring approximately at the critical aggregation concentration of 800 ppm. The toluene concentration has an insignificant effect on the response at low surfactant dosage. The toluene influence rises with increasing demulsifier dosage. Figure 4b shows that dehydration efficiency depends more on surfactant dosage, as well as the optimal condition of demulsification obtained approximately at a critical aggregation concentration of approximately 800 ppm of surfactant dosage and at high temperature. Additionally, Figure 4b shows that at low temperatures, e.g., 39 °C, the influence of surfactant is very low, but the effect of surfactant concentration increases with increased temperature until a maximum effect is reached at 95 °C.
Figure 5a represents the effect of sitting time and pressure on the efficiency of surfactant in destabilising the emulsion. The sedimentation time is found to have a significant effect on breaking the emulsion after the addition of surfactant. The influence of time is represented by the availability of enough time for the thermodynamic phenomenon to occur, including sedimentation, flocculation, coalescence of water droplets, and phase separation [14]. Thus, Figure 5a shows that with increasing time, oil recovery improves because increasing time increases the probability of water droplet coalescence and enhances dehydration efficiency.
Figure 5a shows the influence of pressure on separation performance, with other parameters fixed at a constant level. Thus, dropping the pressure to −630 mmHg increased the demulsification efficiency because the reduced pressure destabilised the surface-active compounds on the water–oil interface and increased the capability of water droplets to coalesce and, in turn, raised the water separation efficiency [56]. Figure 5b shows the interaction effect between temperature and sitting time on the separation performance of Glycerol. Thus, the interaction between temperature and time is more interconnected with the output response. In addition, it is clear that with rising sitting time and temperature, the efficacy of breaking emulsion increases to reach the maximum influence at a high temperature and at approximately 80 min.
One of the objectives of this study is to find the optimal condition to achieve maximum efficiency of dehydration water, as well as numerical optimisation, which is used to navigate in the variable space for the highest trade-offs for achieving the goals. The minimise, target, maximise and within range were to be the possible goals. The desirable goal in dehydration efficiency was put on maximising value for maximum efficiency of breaking the emulsion, as well as the desirability function combined with goals, ranging from zero to one. The CCD based on RSM aims to increase this function by starting at a random point. Figure 6 demonstrates the predicted optimal values for maximum dehydration efficiency, as well as the desirability for the variables and response shown in Figure 7. Figure 6a–c show the optimal condition for maximum dehydration; in Figure 6a the optimal value for surfactant dose is shown and the temperature it is approximately above 800 ppm and 87 °C. Moreover, for pressure and toluene, it is about −400mmHg and 15.5 mL, while for time it is above 100 min as shown in Figure 6b,c. The input variables were selected depending on desirability as shown in Figure 7. As a result, the optimum condition for the five variables, i.e., surfactant dosage, toluene concentration, pressure drop, temperature, and sitting time was determined using CCD based on RSM. The emulsion was totally separated into two phases using a Glycerol agent. In addition, the predicted optimal condition to achieve maximum separation (approximately 99.99%) of water was 1000 ppm, 15.5 mL, −400 mmHg, 90 °C, and 120 min for surfactant dosage, toluene concentration, pressure drop, temperature, and sitting time, respectively. At the same time, the optimal condition was retested again to measure the difference between the predicted reading from the model and the actual result from the bottle test. The result shows that the percentage error between the predicted and actual result for separation efficiency was very small, i.e., less than 4%.

4. Conclusions

In this research, the performance of a non-ionic surfactant, namely Glycerol, as a novel surface-active agent was studied in the demulsification of a water-in-oil emulsion. A bottle test technique was applied to investigate the performance of the demulsifier under different conditions. A Full Factorial Design was used to screen and select the significant parameters, i.e., demulsifier dosage, pressure, sitting time, temperature, and toluene concentration. Then, the significant variables were applied in CCD based on RSM for the experimental design, to establish the mathematical models, parameter optimisation, and to find the optimal condition for the maximum separation of water. Therefore, a quadratic model was developed to study the influence of variables on the output response, while ANOVA was used to evaluate the accuracy of the model. In addition, the coefficient of variation, predicted, and adjusted R-squared were all in the acceptable range. The experimental result showed that surfactant dosage and sitting time were the most significant parameters affecting the dehydration process. The optimal value to achieve the highest efficiency of breaking water-in-oil emulsion was the demulsifier dosage, toluene concentration, pressure, sitting time, and temperature of 1000 ppm, 15.5 mL, −400 mmHg, 120 min, and 90 °C, respectively.

Author Contributions

Conceptualisation, M.M.A; Data curation, M.M.A; Investigation, M.M.A; Project administration, S.A.H and L.C.A; Supervision, S.A.H and L.C.A; Visualisation, M.M.A; Writing—original draft, (M.A); Writing—review and editing, S.A.H and L.C.A.

Funding

The author acknowledges Universiti Putra Malaysia and the Department of Chemical and Environmental Engineering, Faculty of Engineering, for financial support.

Acknowledgments

The authors duly acknowledge the financial support from Ministry of Higher Education, University Putra Malaysia and Department of Chemical and Environmental Engineering.

Conflicts of Interest

The authors declare no conflict of interest.

Appendix A

Table A1. Experimental design results for Glycerol.
RunInput FactorsResponse (DE)
ABCDE
111−111100.00
20000044.00
3−11−1−1−10.00
4−1−1−1−1−10.00
50000041.33
6−111−1−10.00
70000−115.33
8111−1−114.67
91−111150.67
1011−11−156.67
110010022.00
121−1−1−1123.10
131−11−1−18.40
14−11−11116.00
15−11−1−111.33
16−111−110.00
17−1−111−10.00
18−1111−10.00
191−11−1120.00
200000037.33
21−111114.10
22−1−1−1−110.00
231111−131.33
24000−1017.87
250100056.67
260001063.33
271−1−11156.93
281000060.00
29111−1122.67
30−1−11−1−10.00
31−1−1−1114.00
32−1−11−110.00
3311−1−1−118.00
34−1−1−11−10.00
35−1−11113.47
360−100025.33
370000040.00
381−111−117.33
390000156.67
401111190.60
41−11−11−10.00
42−100003.47
431−1−1−1−113.33
4400−10044.27
4511−1−1126.67
461−1−11−120.53

References

  1. Drioli, E.; Ali, A.; Lee, Y.M.; Al-Sharif, S.F.; Al-Beirutty, M.; Macedonio, F. Membrane operations for produced water treatment. Desalin. Water Treat. 2016, 57, 14317–14335. [Google Scholar] [CrossRef]
  2. Uma, A.A.; Saaid, I.B.M.; Sulaimon, A.A.; Pilus, R.B.M. A review of petroleum emulsions and recent progress on water-in-crude oil emulsions stabilized by natural surfactants and solids. J. Pet. Sci. Eng. 2018, 165, 673–690. [Google Scholar]
  3. Ammar, S.H.; Akbar, A.S. Oilfield produced water treatment in internal-loop airlift reactor using electrocoagulation/flotation technique. Chin. J. Chem. Eng. 2017, 26, 879–885. [Google Scholar] [CrossRef]
  4. Aryafard, E.; Farsi, M.; Rahimpour, M.; Raeissi, S. Modeling electrostatic separation for dehydration and desalination of crude oil in an industrial two-stage desalting plant. J. Taiwan Inst. Chem. Eng. 2016, 58, 141–147. [Google Scholar] [CrossRef]
  5. Zheng, J.; Chen, B.; Thanyamanta, W.; Hawboldt, K.; Zhang, B.; Liu, B. Offshore produced water management: A review of current practice and challenges in harsh/Arctic environments. Mar. Pollut. Bull. 2016, 104, 7–19. [Google Scholar] [CrossRef] [PubMed]
  6. Kedar, V.; Bhagwat, S.S. Effect of polar head surfactants on the demulsification of crude oil. Pet. Sci. Technol. 2018, 36, 91–98. [Google Scholar] [CrossRef]
  7. Zhang, S.; Zhang, L.; Lu, X.; Shi, C.; Tang, T.; Wang, X.; Huang, Q.; Zeng, H. Adsorption kinetics of asphaltenes at oil/water interface: Effects of concentration and temperature. Fuel 2018, 212, 387–394. [Google Scholar] [CrossRef]
  8. Biniaz, P.; Farsi, M.; Rahimpour, M. Demulsification of water in oil emulsion using ionic liquids: Statistical modeling and optimization. Fuel 2016, 184, 325–333. [Google Scholar] [CrossRef]
  9. Hippmann, S.; Ahmed, S.S.; Fröhlich, P.; Bertau, M. Demulsification of water/crude oil emulsion using natural rock Alginite. Colloids. Surf. A Physicochem. Eng. Asp. 2018, 553, 71–79. [Google Scholar] [CrossRef]
  10. Kang, W.; Yin, X.; Yang, H.; Zhao, Y.; Huang, Z.; Hou, X.; Sarsenbekuly, B.; Zhu, Z.; Wang, P.; Zhang, X. Demulsification performance, behavior and mechanism of different demulsifiers on the light crude oil emulsions. Colloids. Surf. A Physicochem. Eng. Asp. 2018, 545, 197–204. [Google Scholar] [CrossRef]
  11. Abdurahman, N.; Yunus, R.; Azhari, N.; Said, N.; Hassan, Z. The Potential of Microwave Heating in Separating Water-in-Oil (w/o) Emulsions. Energy Procedia 2017, 138, 1023–1028. [Google Scholar] [CrossRef] [Green Version]
  12. Kedar, V.; Bhagwat, S.S. Effect of salinity on the IFT between aqueous surfactant solution and crude oil. Pet. Sci. Technol. 2018, 36, 835–842. [Google Scholar] [CrossRef]
  13. Maaref, S.; Ayatollahi, S. The effect of brine salinity on water-in-oil emulsion stability through droplet size distribution analysis: A case study. J. Dispers. Sci. Technol. 2018, 39, 721–733. [Google Scholar] [CrossRef]
  14. Rajak, V.; Singh, I.; Kumar, A.; Mandal, A. Optimization of separation of oil from oil-in-water emulsion by demulsification using different demulsifiers. Pet. Sci. Technol. 2016, 34, 1026–1032. [Google Scholar] [CrossRef]
  15. Vilas Bôas Fávero, C.; Hanpan, A.; Phichphimok, P.; Binabdullah, K.; Fogler, H.S. Mechanistic investigation of asphaltene deposition. Energy Fuels 2016, 30, 8915–8921. [Google Scholar] [CrossRef]
  16. Painter, P.; Veytsman, B.; Youtcheff, J. Guide to asphaltene solubility. Energy Fuels 2015, 29, 2951–2961. [Google Scholar] [CrossRef]
  17. Hazrati, N.; Beigi, A.A.M.; Abdouss, M. Demulsification of water in crude oil emulsion using long chain imidazolium ionic liquids and optimization of parameters. Fuel 2018, 229, 126–134. [Google Scholar] [CrossRef]
  18. El-Helaly, S.N.; Habib, B.A.; El-Rahman, M.K.A. Resolution V fractional factorial design for screening of factors affecting weakly basic drugs liposomal systems. Eur. J. Pharm. Sci. 2018, 119, 249–258. [Google Scholar] [CrossRef]
  19. Kumar, A.; Thakur, A.; Panesar, P.S. Statistical optimization of lactic acid extraction using Green Emulsion Ionic Liquid Membrane (GEILM). J. Environ. Chem. Eng. 2018, 6, 1855–1864. [Google Scholar] [CrossRef]
  20. Al-Kayiem, H.H.; Khan, J.A. Evaluation of Alkali/Surfactant/Polymer Flooding on Separation and Stabilization of Water/Oil Emulsion by Statistical Modeling. Energy Fuels 2017, 31, 9290–9301. [Google Scholar] [CrossRef]
  21. Fouladitajar, A.; Ashtiani, F.Z.; Dabir, B.; Rezaei, H.; Valizadeh, B. Response surface methodology for the modeling and optimization of oil-in-water emulsion separation using gas sparging assisted microfiltration. Environ. Sci. Pollut. Res. 2015, 22, 2311–2327. [Google Scholar] [CrossRef] [PubMed]
  22. Roshan, N.; Ghader, S.; Rahimpour, M.R. Application of the response surface methodology for modeling demulsification of crude oil emulsion using a demulsifier. J. Dispers. Sci. Technol. 2018, 39, 700–710. [Google Scholar] [CrossRef]
  23. Dailey, A.; Vuong, Q. Optimum conditions for microwave assisted extraction for recovery of phenolic compounds and antioxidant capacity from Macadamia (Macadamia tetraphylla) skin waste using water. Processes 2016, 4, 2. [Google Scholar] [CrossRef]
  24. Tehlah, N.; Kaewpradit, P.; Mujtaba, I. Development of molecular distillation based simulation and optimization of refined palm oil process based on response surface methodology. Processes 2017, 5, 40. [Google Scholar] [CrossRef]
  25. Shao, J.; Darkwa, J.; Kokogiannakis, G. Review of phase change emulsions (PCMEs) and their applications in HVAC systems. Energy Build. 2015, 94, 200–217. [Google Scholar] [CrossRef] [Green Version]
  26. Roodbari, N.H.; Badiei, A.; Soleimani, E.; Khaniani, Y. Tweens demulsification effects on heavy crude oil/water emulsion. Arab. J. Chem. 2016, 9, S806–S811. [Google Scholar] [CrossRef]
  27. Yau, Y.-H.; Rudolph, V.; Ho, K.-C.; Lo, C.C.-M.; Wu, K.-C. Evaluation of different demulsifiers for Marpol oil waste recovery. J. Water Proc. Eng. 2017, 17, 40–49. [Google Scholar] [CrossRef]
  28. Kandeel, E. Synthesis and performance of glycerol ester-based nonionic surfactants. J. Dispers. Sci. Technol. 2012, 33, 949–954. [Google Scholar] [CrossRef]
  29. Lu, Z.; Jiang, J.; Ren, M.; Xu, J.; Da, J.; Cao, F. The study on removing the salts in crude oil via ethylene glycol extraction. Energy Fuels 2014, 29, 355–360. [Google Scholar] [CrossRef]
  30. Zhuang, G.; Zhang, Z.; Wu, H.; Zhang, H.; Zhang, X.; Liao, L. Influence of the nonionic surfactants’ nature on the structures and properties of organo-montmorillonites. Colloid. Surf. A Physicochem. Eng. Asp. 2017, 518, 116–123. [Google Scholar] [CrossRef]
  31. Langevin, D.; Argillier, J.-F. Interfacial behavior of asphaltenes. Adv.Colloid. Interface Sci. 2016, 233, 83–93. [Google Scholar] [CrossRef]
  32. Negin, C.; Ali, S.; Xie, Q. Most common surfactants employed in chemical enhanced oil recovery. Petroleum 2017, 3, 197–211. [Google Scholar] [CrossRef]
  33. Xu, B.; Zhou, X.; Wang, C. Synergistic effect of demulsifiers with different structures for crude oil emulsions. Pet. Sci. Technol. 2016, 34, 485–490. [Google Scholar] [CrossRef]
  34. Zhang, J.; Tian, D.; Lin, M.; Yang, Z.; Dong, Z. Effect of resins, waxes and asphaltenes on water-oil interfacial properties and emulsion stability. Colloid. Surf. A Physicochem. Eng. Asp. 2016, 507, 1–6. [Google Scholar] [CrossRef]
  35. Blondet, G.; Le Duigou, J.; Boudaoud, N.; Eynard, B. An ontology for numerical design of experiments processes. Comput. Ind. 2018, 94, 26–40. [Google Scholar] [CrossRef]
  36. Abreu-Naranjo, R.; Crespo, Y.A.; Pedretti, E.F.; Conesa, J.A. Experiments on torrefaction of Dichrostachys cinerea wood: Two-Level factorial design and thermogravimetric analysis. Wood Sci. Technol. 2018, 1–15. [Google Scholar] [CrossRef]
  37. Lundstedt, T.; Seifert, E.; Abramo, L.; Thelin, B.; Nyström, Å.; Pettersen, J.; Bergman, R. Experimental design and optimization. Chemom. Intell. Lab. Syst. 1998, 42, 3–40. [Google Scholar] [CrossRef]
  38. Bezerra, M.A.; Santelli, R.E.; Oliveira, E.P.; Villar, L.S.; Escaleira, L.A. Response surface methodology (RSM) as a tool for optimization in analytical chemistry. Talanta 2008, 76, 965–977. [Google Scholar] [CrossRef]
  39. Karimifard, S.; Moghaddam, M.R.A. Application of response surface methodology in physicochemical removal of dyes from wastewater: A critical review. Sci. Total Environ. 2018, 640, 772–797. [Google Scholar] [CrossRef]
  40. Zhang, L.; Zeng, Y.; Cheng, Z. Removal of heavy metal ions using chitosan and modified chitosan: A review. J. Mol. Liq. 2016, 214, 175–191. [Google Scholar] [CrossRef]
  41. Gangil, M.; Pradhan, M. Modeling and optimization of electrical discharge machining process using RSM: A review. Mater. Today Proc. 2017, 4, 1752–1761. [Google Scholar] [CrossRef]
  42. Kala, M.; Shaikh, M.V.; Nivsarkar, M. Development and optimization of psychological stress model in mice using 2 level full factorial design. J. Pharmacol. Toxicol. Methods 2016, 82, 54–61. [Google Scholar] [CrossRef] [PubMed]
  43. Alara, O.; Abdurahman, N.; Olalere, O. Ethanolic extraction of flavonoids, phenolics and antioxidants from Vernonia amygdalina leaf using two-level factorial design. J. King Saud Univ. Sci. 2017, in press. [Google Scholar] [CrossRef]
  44. Ferreira, S.L.; Lemos, V.A.; de Carvalho, V.S.; da Silva, E.G.; Queiroz, A.F.; Felix, C.S.; da Silva, D.L.; Dourado, G.B.; Oliveira, R.V. Multivariate optimization techniques in analytical chemistry-an overview. Microchem. J. 2018, 140, 176–182. [Google Scholar] [CrossRef]
  45. Niaragh, E.K.; Moghaddam, M.A.; Emamjomeh, M. Techno-economical evaluation of nitrate removal using continuous flow electro-coagulation process: Optimization by Taguchi model. Water Sci. Technol. Water Supply 2017, 17, 1703–1711. [Google Scholar] [CrossRef]
  46. Witek-Krowiak, A.; Chojnacka, K.; Podstawczyk, D.; Dawiec, A.; Pokomeda, K. Application of response surface methodology and artificial neural network methods in modelling and optimization of biosorption process. Bioresour. Technol. 2014, 160, 150–160. [Google Scholar] [CrossRef]
  47. Antoniou, G.; Papakyriacou, I.; Papaneophytou, C. Optimization of Soluble Expression and Purification of Recombinant Human Rhinovirus Type-14 3C Protease Using Statistically Designed Experiments: Isolation and Characterization of the Enzyme. Mol. Biotechnol. 2017, 59, 407–424. [Google Scholar] [CrossRef]
  48. Benyounis, K.; Olabi, A.; Hashmi, M. Effect of laser welding parameters on the heat input and weld-bead profile. J. Mater. Proc. Technol. 2005, 164, 978–985. [Google Scholar] [CrossRef]
  49. Sktani, Z.D.I.; Rejab, N.A.; Ratnam, M.M.; Ahmad, Z.A. Fabrication of tougher ZTA ceramics with sustainable high hardness through (RSM) optimisation. Int. J. Refract. Met. Hard Mater. 2018, 74, 78–86. [Google Scholar] [CrossRef]
  50. Ghoreishian, S.M.; Badii, K.; Norouzi, M.; Malek, K. Effect of cold plasma pre-treatment on photocatalytic activity of 3D fabric loaded with nano-photocatalysts: Response surface methodology. Appl. Surf. Sci. 2016, 365, 252–262. [Google Scholar] [CrossRef]
  51. Selvakumaran, S.; Muhamad, I.I.; Razak, S.I.A. Evaluation of kappa carrageenan as potential carrier for floating drug delivery system: Effect of pore forming agents. Carbohydr. Polym. 2016, 135, 207–214. [Google Scholar] [CrossRef] [PubMed]
  52. Esmaeili, A.; Haseli, M. Electrospinning of thermoplastic carboxymethyl cellulose/poly (ethylene oxide) nanofibers for use in drug-release systems. Mater. Sci. Eng. C 2017, 77, 1117–1127. [Google Scholar] [CrossRef] [PubMed]
  53. Subramanian, D.; May, N.; Firoozabadi, A. Functional molecules and the stability of water-in-crude oil emulsions. Energy Fuels 2017, 31, 8967–8977. [Google Scholar] [CrossRef]
  54. Elsharkawy, A.M.; Al-Sahhaf, T.A.; Fahim, M.A. Further Investigation into the Stability of Water-in-Crude Oil Emulsions Formed in Burgan Oilfield: Effect of Toluene, Resins to Asphaltenes Ratio, and Surfactant. J. Dispers. Sci. Technol. 2012, 33, 805–811. [Google Scholar] [CrossRef]
  55. Wang, D.; Lin, M.; Dong, Z.; Li, L.; Jin, S.; Pan, D.; Yang, Z. Mechanism of High Stability of Water-in-Oil Emulsions at High Temperature. Energy Fuels 2016, 30, 1947–1957. [Google Scholar] [CrossRef]
  56. Auflem, I.H.; Kallevik, H.; Westvik, A.; Sjöblom, J. Influence of pressure and solvency on the separation of water-in-crude-oil emulsions from the North Sea. J. Pet. Sci. Eng. 2001, 31, 1–12. [Google Scholar] [CrossRef]
Figure 1. Steps of the optimisation procedure using Central Composite Design (CCD).
Processes 07 00382 g001
Figure 2. The selection of variables according to the Pareto chart where the highlighted bars show the selected parameters.
Processes 07 00382 g002
Figure 3. Diagnostic plots of (a) Normal plot of residuals; (b) Predicted versus actual plot; (c) Residuals versus predicted; and (d) Residuals versus the experimental run.
Processes 07 00382 g003
Figure 4. Three-dimensional plots of the influence of: (a) surfactant dosage and toluene; and (b) surfactant dosage and temperature.
Processes 07 00382 g004
Figure 5. Three-dimensional plots representing the effect of: (a) time and pressure and (b) temperature and time on the dehydration process.
Processes 07 00382 g005
Figure 6. (a)–(c). Contour plots of numerical optimisation for dehydration efficiency obtained by Response Surface Method (RSM).
Processes 07 00382 g006aProcesses 07 00382 g006b
Figure 7. The desirability of optimised variables.
Processes 07 00382 g007
Table 1. Properties of applied synthetic oil.
Crude Oil PropertiesMeasure
Specific gravity at 15 °C (kg/m3)0.843
Viscosity at 15 °C (cSt)3.381
Asphaltenes (wt.%)0.5%
Density at 15 °C0.842
API gravity at 15 °C36.4
Table 2. Investigative variables and levels of the non-ionic surfactant in Factorial Design.
ParametersFactor TermsCoded Levels
−1+1
Demulsifier dose (ppm)A01000
Pressure (mmhg)B−6300
Toluene concentration (mL)C616
Sitting time (min)D10120
Temperature (°C)E3995
Table 3. Experimental levels and range of independent parameters.
VariablesTermsCoded Levels Unit
−10+1
Demulsifier dosageA05001000ppm
Toluene concentrationB61116mL
PressureC−630−3150mmHg
TemperatureD396795°C
TimeE1065120Minutes
Table 4. ANOVA result for CCD.
SourceSum of SquaresdfMean SquareF-ValueP-Value
Model383.021231.9285.49<0.0001Significant
A-Glycerol210.851210.85564.74<0.0001
B-Toluene8.7718.7723.49<0.0001
C-Pressure3.1413.148.420.0066
D-Temperature35.29135.2994.53<0.0001
E-Time29.37129.3778.65<0.0001
AB2.0712.075.550.0246
AD5.6515.6515.120.0005
BD2.0612.065.520.0249
DE8.5218.5222.83<0.0001
A27.8717.8721.08<0.0001
C21.7811.784.770.0361
E21.5611.564.190.0487
Residual12.32330.3734
Lack of Fit12.18300.40598.550.0505Not significant
Pure Error0.142430.0475
Correlation Total395.3445
R20.9688 Predicted R20.9355
Adjusted R20.9575 Adequate Precision33.3811

