1. Introduction
Bileaflet mechanical heart valves (BMHVs) are designed and used to replicate the function of natural human heart valves to maintain a unidirectional blood flow, depending on the pressure difference in the upstream and downstream sides of the leaflets. More than 170,000 of the valve replacement operations that occur annually around the world use mechanical heart valves [
1,
2]. Among various mechanical heart valve types, BMHVs are the most popular and are often implanted to replace diseased heart valves because of their longer lifespan and reliable performance.
Despite the widespread clinical use of mechanical valve replacements, the BMHVs are far from perfect. The major potential complications that remain as drawbacks to mechanical heart valves include hemolysis, damage of blood elements, and thrombosis, as a result of the high-velocity jet flow through the narrow passage between the leaflets [
3,
4]. Another noticeable phenomenon associated with mechanical valves is unsteady, blood flow-induced leaflet vibration, which leads to the complex interaction of flow dynamics and leaflet kinematics. One of the main reasons for leaflet vibration is the unsteady blood flow pressure pulsation, which is induced by the turbulent flow instabilities [
5,
6]. Although the occurrence of such a phenomenon is quite low, it may lead to the fracture of BMHVs and life-threatening conditions to patients. In order to deal with the potential risks caused by the leaflet vibration phenomenon, it is of critical importance to understand the mechanism and characteristics of pressure pulsation induced by unsteady blood flow [
7,
8].
Previous studies mainly focus on flow characteristics and the flow structure interactions of BMHVs. For example, Matteo Nobili et al. [
9] investigated the dynamics of a BMHV by means of a fluid–structure interaction method and an ultrafast cinematographic technique. The computational model captured the main features of the leaflet motion during the systole. Iman Borazjani et al. [
10] performed high-resolution fluid–structure interaction simulations of physiologic pulsatile flow through a BMHV in an anatomically realistic aorta. Meanwhile, numerous in vitro and in silico studies on the characteristics of leaflet motion and the hemodynamic performances of BMHVs have been conducted. For example, L. Ge et al. [
11] analyzed the results of 2D high-resolution velocity measurements, and a full 3D numerical simulation for pulsatile flow through a BMHV mounted in a model axisymmetric aorta, to investigate the mechanical environment experienced by blood elements under physiologic conditions. Redaelli et al. [
12] analyzed the opening phase of a bileaflet heart valve under low flow rates and validated the leaflet motion experimentally. Cheng et al. [
13] presented a three-dimensional unsteady flow analysis past a bileaflet valve prosthesis in the mitral position incorporating an FSI algorithm for leaflet motion during the valve closing phase.
As mentioned above, few studies have been performed regarding the mechanism and characteristics of pressure pulsation induced by unsteady blood flow. The mechanisms and influencing factors of pressure pulsation in BMHVs are not well understood at the present time. Hence, it is imperative to study the mechanism and characteristics of pressure pulsation induced by unsteady blood flow.
The objective of this study is, therefore, to numerically investigate the characteristics and influence factors of pressure pulsation in BMHVs under different conditions of flow rate and leaflet fully opening angle. Additionally, the non-dimensional coefficient of pressure pulsation was proposed to evaluate the impact on pressure pulsation induced by unsteady blood flow in a BMHV.
2. Numerical Methods and Modeling
2.1. Numerical Method
Ansys CFX commercial software based on finite volume method was used to run pulsatile flow simulations in this study. According to previous experimental results, especially in the studies of velocity and pressure distribution, blood flow was assumed incompressible, turbulent, and Newtonian [
2,
4].
The continuity equation and the Reynolds-averaged Navier–Stokes (RANS) equation can be written as follows:
where
ρ is the blood density,
u is the velocity,
P is the pressure, and
μ is the dynamic viscosity. These governing equations are numerically solved for the pressure and velocity profiles in the flow field.
As shown in Equations (3) and (4), all of the spontaneous variables are decomposed into average values and fluctuating components [
14]. For example, where
p is the transient pressure at some point in the flow field,
pm and
p′ represent the time-average pressure and time-average pulsating pressure, respectively.
In this study, the pressure pulsation of the BMHV internal flow field under different flow rate and opening angle conditions was analyzed by the non-dimensional coefficient of pressure pulsation.
where
τ is the coefficient of pressure pulsation (it was proposed to evaluate the impact on pressure pulsation induced by unsteady blood flow).
2.2. Geometry of BMHV
Figure 1 shows a three-dimensional simplified geometry of the St. Jude bileaflet mechanical heart valve investigated in this research, which was chosen to be similar to previous studies [
14,
15]. The model geometry mainly consists of four parts: valve leaflets, aortic sinus, inlet, and outlet sections [
16]. In the previous experimental study, the phenomenon of leaflet fluttering was only observed when the leaflets were in the fully open position, so the leaflets were assumed to be fixed in the fully open position to simplify the calculation. The geometry of the aortic root is modelled as an axial-symmetric expansion. The aortic root diameter was 27 mm, and the leaflet opening angle was 80°. The hinge mechanism was simplified as solid cylinder. To obtain the fully developed flow and minimize the influence of outlet boundary conditions, the lengths of the upstream and downstream sections were added as 2D and 6D (where D is the inlet diameter), respectively. Three models with different fully opening angles (75°, 80°, and 85°) were created for the purpose of this study.
2.3. Meshing Configurations and Mesh Independency Test
ICEM-CFD software was employed to generate the mesh of fluid domain. The regions of valve and aortic sinus were discretized with locally refined tetrahedral elements. In the remaining domain (upstream and downstream sections), the hexahedral mesh was used in order to limit the numerical diffusion. One of the mesh independency tests is shown in
Table 1. The maximum velocity value at central and lateral orifices were used to check the mesh independency in all cases [
17,
18]. The total number of cells chosen was equal to 850,131.
2.4. Boundary Conditions
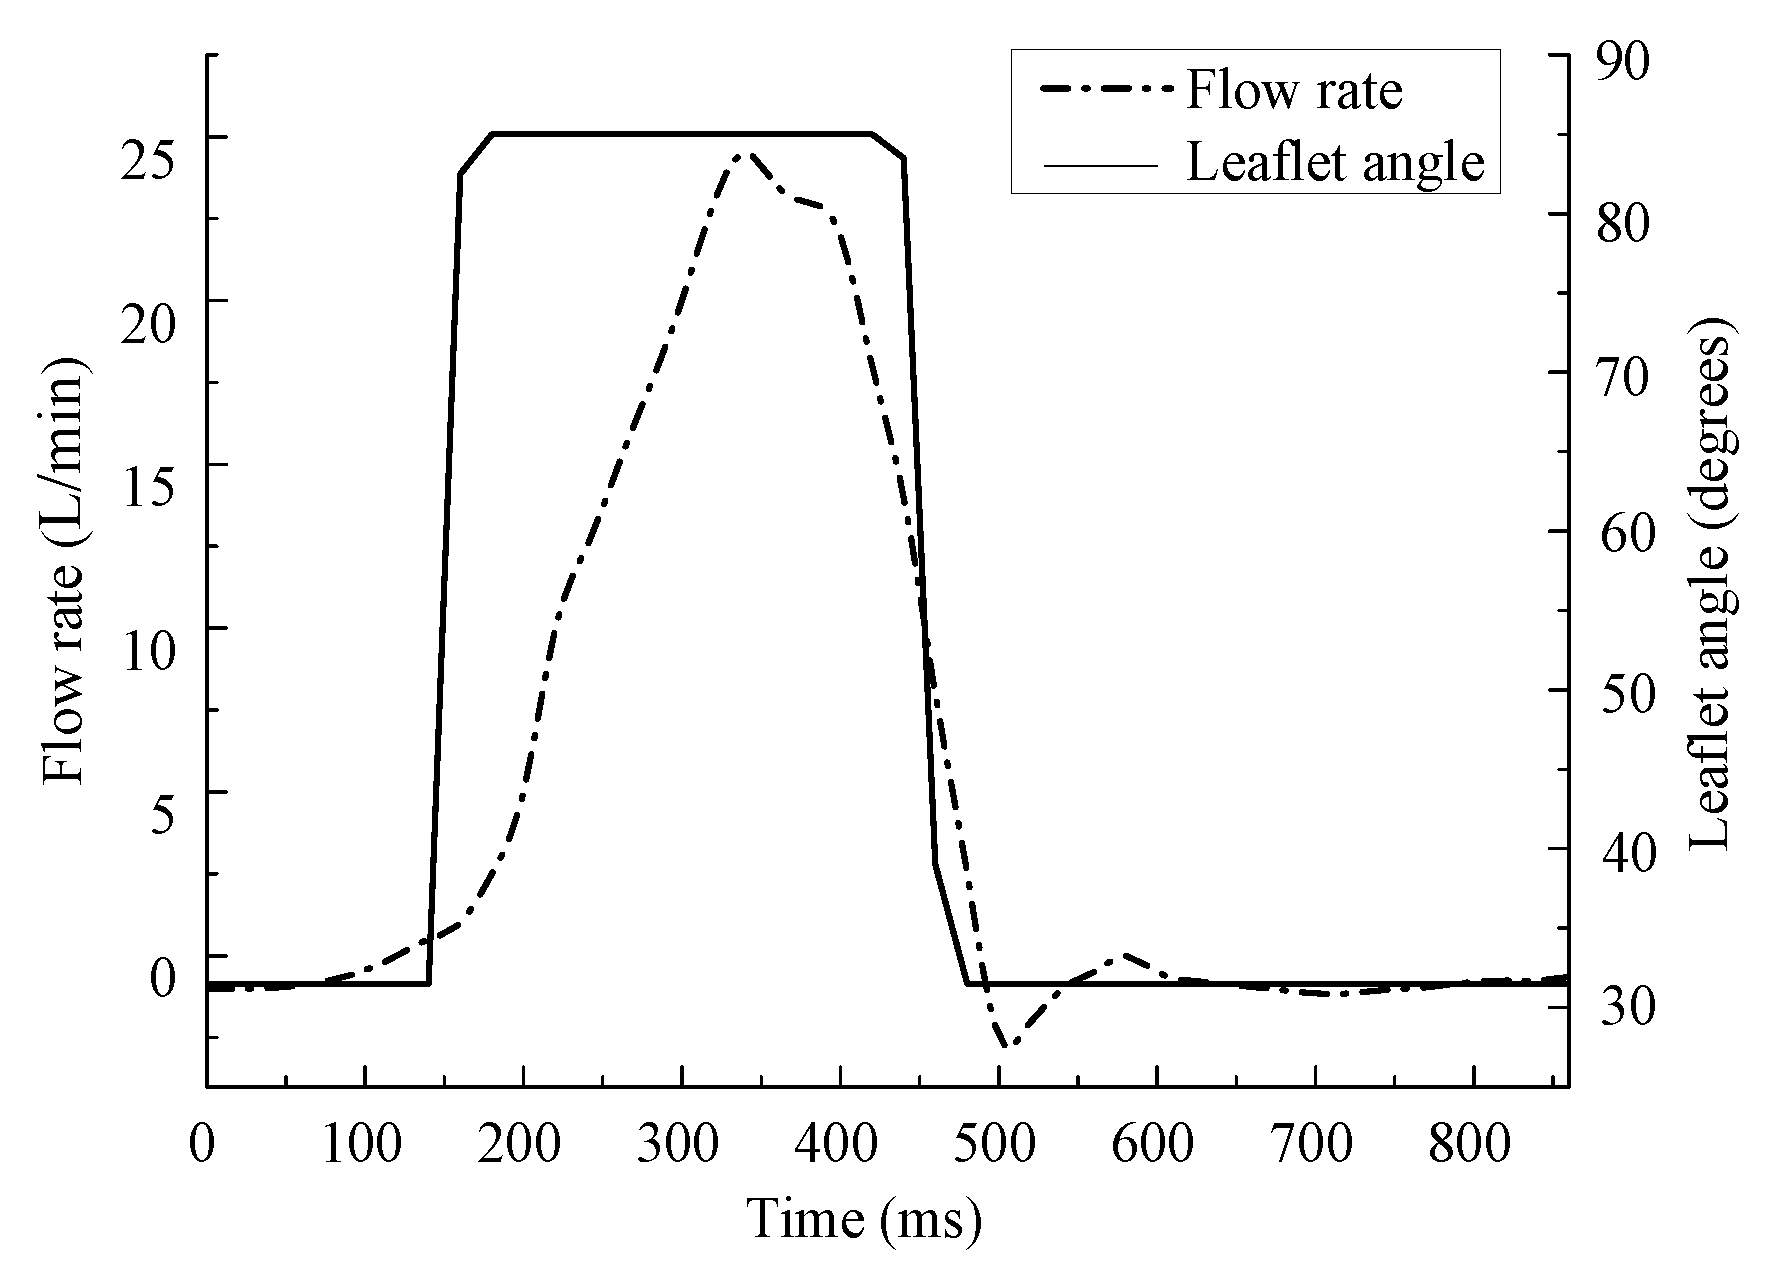
For the boundary conditions, the different flow rates (from 5 L/min to 25 L/min) measured in the vitro study [
19,
20] (
Figure 2) were considered for the inlet condition (ventricular side), and the zero static pressure was set as outlet condition (aorta side) [
21]. The density and dynamic viscosity of blood were set to 1055 kg/m
3 and 0.0035 Pa·s, respectively. Because the influence of the change of pressure and velocity boundary conditions on the phenomenon of leaflet fluttering is not clear, only part of the cardiac cycle was selected for simulation. The total transient simulation time was controlled, ranging from the 200th ms to the 500th ms in one cardiac cycle (
Figure 2), and the 300 ms time was discretized with 1500 steps corresponding to a time step of 0.2 ms.
2.5. Validation of the Computational Methods
For validation of the current calculation, the monitoring line was set at 2.54 mm cross-section after the leaflets, as shown in
Figure 3a. The opening angle of 85° was used. Comparisons of the velocity profiles along the monitoring line calculated by three different turbulent models (standard k-ε, RNG k-ε, and k-ω) under a 25 L/min flow rate are shown in
Figure 3b. The velocity profile observed in previous experimental studies that considered a BMHV with similar geometry and the same flow condition [
15,
22] is also shown in the same figure. The comparison of the results illustrates that the results calculated by the k-ω model, in particular the velocity distribution near the leaflets, were in good agreement with the experimental data. The main differences between all of the computational results and the previous experimental data are located in the vicinity of the trailing edges. Considering the fact that this study mainly focused on the flow field near the leaflets, the k-ω model was chosen for simulation.
3. Results and Discussion
3.1. Effect of Different Flow Rate Conditions
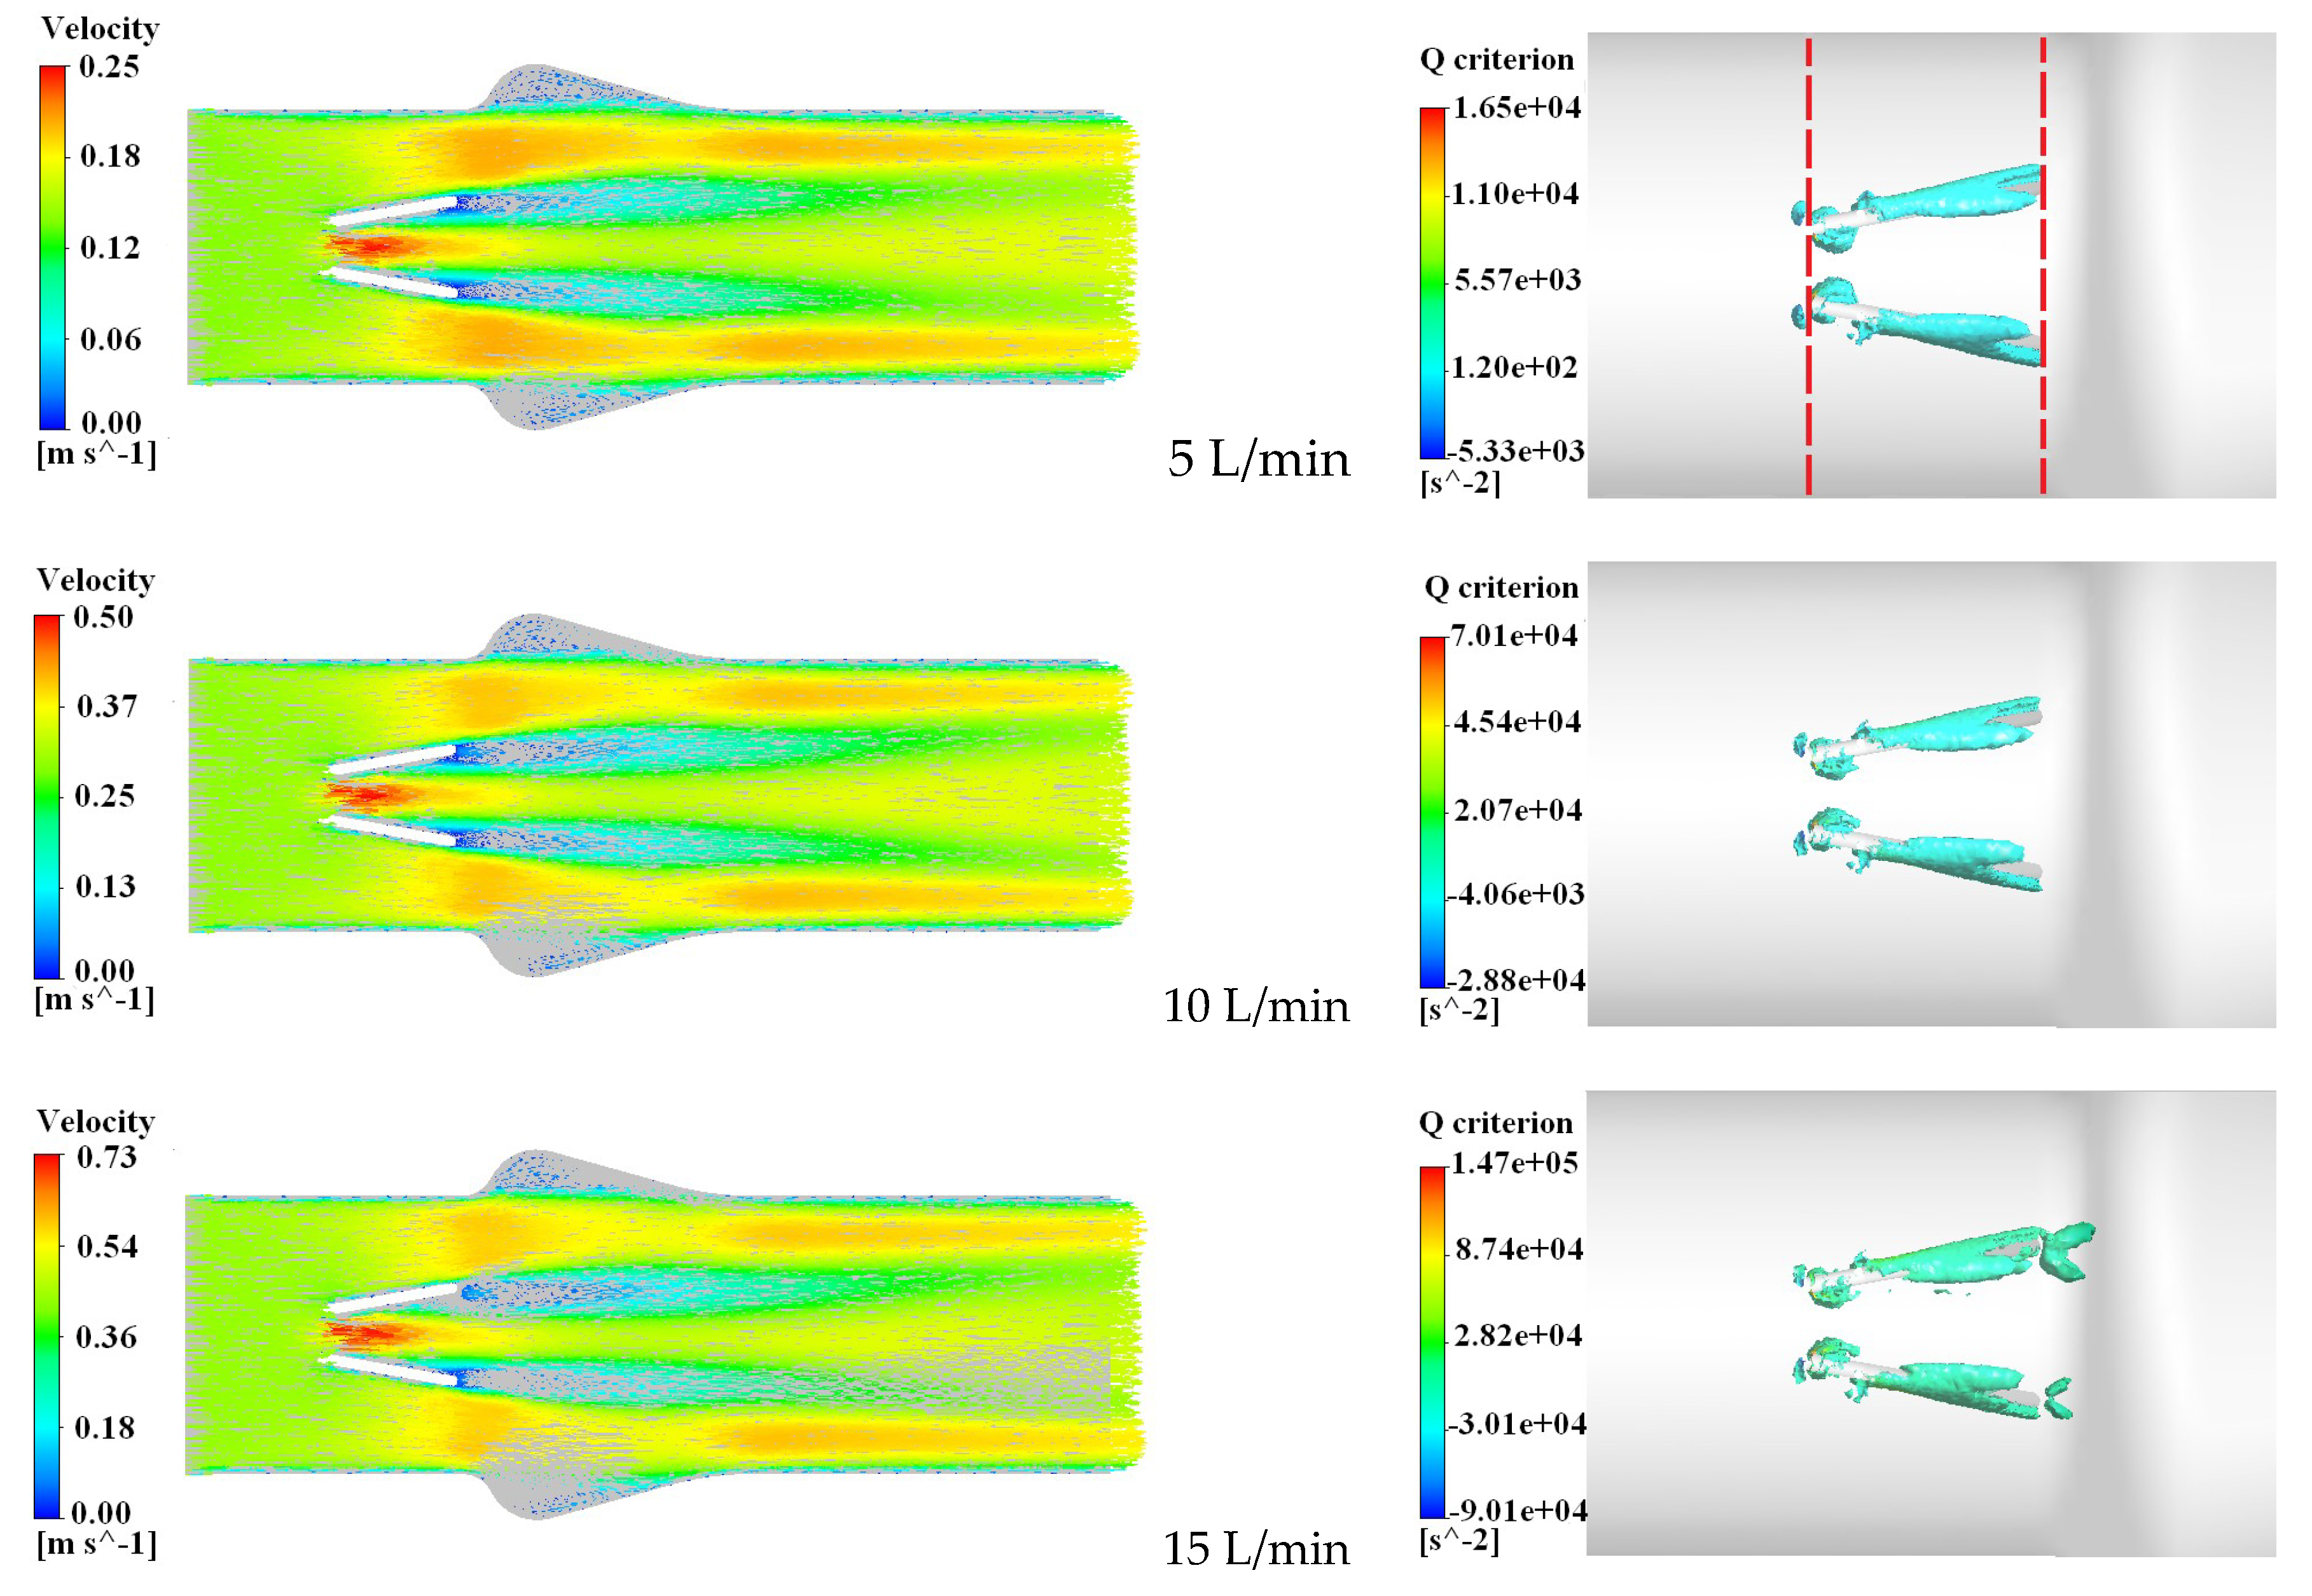
Figure 4a shows the blood flow patterns by velocity vector distribution of a BMHV at different flow rate conditions (5 L/min, 10 L/min, 15 L/min, 20 L/min, and 25 L/min), where the color represents the velocity magnitude [
23,
24]. The flow patterns developed in all cases were similar to each other because of the same opening degree of 80°. Because of the nonphysiologic geometries of mechanical valves, a three-jet configuration through the central and lateral orifices can show a relatively higher velocity and a low-velocity region located at the whole surfaces and trailing edges of both leaflets. The spread region of the trailing edges of the leaflets increases with the flow rate. As the flow rate changed from 5 L/min to 25 L/min, the maximum velocity increased from 0.25 m/s to 1.21 m/s in the central orifices and increased from 0.22 m/s to 0.95 m/s in the lateral orifices, respectively. Higher velocities at the central and lateral orifices were accompanied by higher level of velocity gradient in the vicinity of leaflet surfaces [
25,
26].
Figure 4b shows the vortex structure of the flow field at different flow rate conditions by means of the vortex core region, where the color represents the value of the Q criterion. In all cases, the vortex core region was mainly formed in the low-velocity region near both leaflet edges. As the flow rate changed from 5 L/min to 25 L/min, the value of the Q criterion in the vortex core region increased rapidly, and the maximum Q value increased from 1.65 × 10
4 s
−2 to 3.24 × 10
5 s
−2. As the flow rate increased to more than 15 L/min, the velocity of the mainstream region increased and the vortices shed downstream from the trailing edges of the leaflets.
In order to study the pressure pulsation characteristics in the vicinity of the leaflets under different flow conditions, two monitoring lines perpendicular to the flow direction (Y direction) were set at the leading edge and trailing edge of the leaflets of the BMHV, respectively, as shown in
Figure 4b. One hundred monitoring points were set on every monitoring line, which were evenly distributed in the central and lateral orifices. The transient flow calculation results showed that the pressure value became stable after the first calculation cycle. The pressure value data in the second calculation cycle at each monitoring point were recorded, and the time-average pressure pulsation at each point were calculated by Equation (5).
where △
T is the time of one calculation cycle of 300 ms, from the 200th ms to the 500th ms in one cardiac cycle.
p’ is the time-average pulsating pressure, which represents the average pressure pulsation range at a certain point.
The average pressure pulsation at all monitoring points under five different flow conditions were measured and calculated, and the coefficients of pressure pulsation were calculated by equation (4). The coefficient distribution of pressure pulsation at the leading edge and trailing edge monitoring lines under different flow conditions are shown in
Figure 5 and
Figure 6, respectively.
Figure 5a is the complete view of the coefficient distribution of pressure pulsation at the leading edge monitoring lines at flow rates from 5 L/min to 25 L/min.
Figure 5b is the local enlarged view. Under different flow conditions, the level of pressure pulsation coefficient near the wall and the leading edge of the leaflets was higher. The level of the pressure pulsation coefficient in central and lateral orifices was relatively lower. As the flow rate increased, the distribution of the pressure pulsation coefficient on the leading edge monitoring line showed a trend of gradual decline, and the maximum value of pressure pulsation coefficient near the leading edge decreased from 0.014 to 0.003. The results show that the lower the flow velocity on the leading edges of the leaflets, the larger the coefficient of pressure pulsation. The flow velocity near the leading edges of the leaflets increased with the increased flow rate. The vortices fell off downstream, and the influence of the pressure pulsation decreased.
Figure 6a is the complete view of the coefficient distribution of pressure pulsation at the trailing edge monitoring lines at flow rates from 5 L/min to 25 L/min.
Figure 6b is the local enlarged view. Under different flow conditions, the coefficient of pressure pulsation near the trailing edge of the leaflets was relatively higher (the maximum value, equal to 8.4), which was reached at the trailing edges of the leaflets. At the main flow region, the coefficients of pressure pulsation in central and lateral orifices were close to zero. As the flow rate increased from 5 L/min to 15 L/min, the distribution of the pressure pulsation coefficient near the trailing edge decreased rapidly, with the maximum value decreasing from 8.4 to 2.1. As the flow rate increased from 20 L/min to 25 L/min, the maximum value of pressure pulsation coefficient gradually decreased from 1.4 to 1.2. The results show that the high-pressure pulsation region was mainly formed in the vicinity of the trailing edges of leaflets. As the flow rate increased, the coefficient of pressure pulsation showed a decreasing trend. Additionally, the level of the pressure pulsation coefficient near the trailing edges was much larger than the data obtained near the leading edges of leaflets. It could be considered that one of the main reasons for the result in leaflet vibration was the pressure pulsation located at the trailing edges of leaflets under low-velocity conditions.
3.2. Effect of Different Fully Opening Angles of Leaflets
In the same way, the pressure pulsation characteristics in the vicinity of the leaflets under different fully opening angle conditions, from 75° to 85°, were studied.
Figure 7a shows the blood flow patterns by the velocity vector distribution of a BMHV at different opening degree conditions, where the color represents the velocity magnitude. All cases were simulated under the same flow rate condition of 5 L/min. The leaflets act as an obstruction to the blood flow through the BMHV, and coupled with the relatively high-velocity three-jet through the central and lateral orifices. As the leaflet opening degree increased from 75° to 85°, the maximum velocity decreased from 0.28 m/s to 0.22 m/s and from 0.24 m/s to 0.19 m/s in the central and lateral orifices, respectively. The results showed that, with the increase of the opening angle, the velocity distribution was more uniform and the average level of flow velocity decreased.
Figure 7b shows the vortex structure of the flow field under different leaflet opening angle conditions by means of vortex core region, where the color represents the value of the Q criterion. In all cases, the vortex core region mainly formed in the vicinity of the surfaces of both leaflets. As the leaflet opening degree increased from 75° to 85°, the range of the vortex core region near the leaflets was gradually enlarged, and the maximum Q value decreased from 2.02 × 10
4 s
−2 to 1.13 × 10
4 s
−2. The results showed that, because of the larger opening angle and the lower average velocity, the vortices were more likely to stay at the surfaces of the leaflets than to shed downstream from the trailing edges.
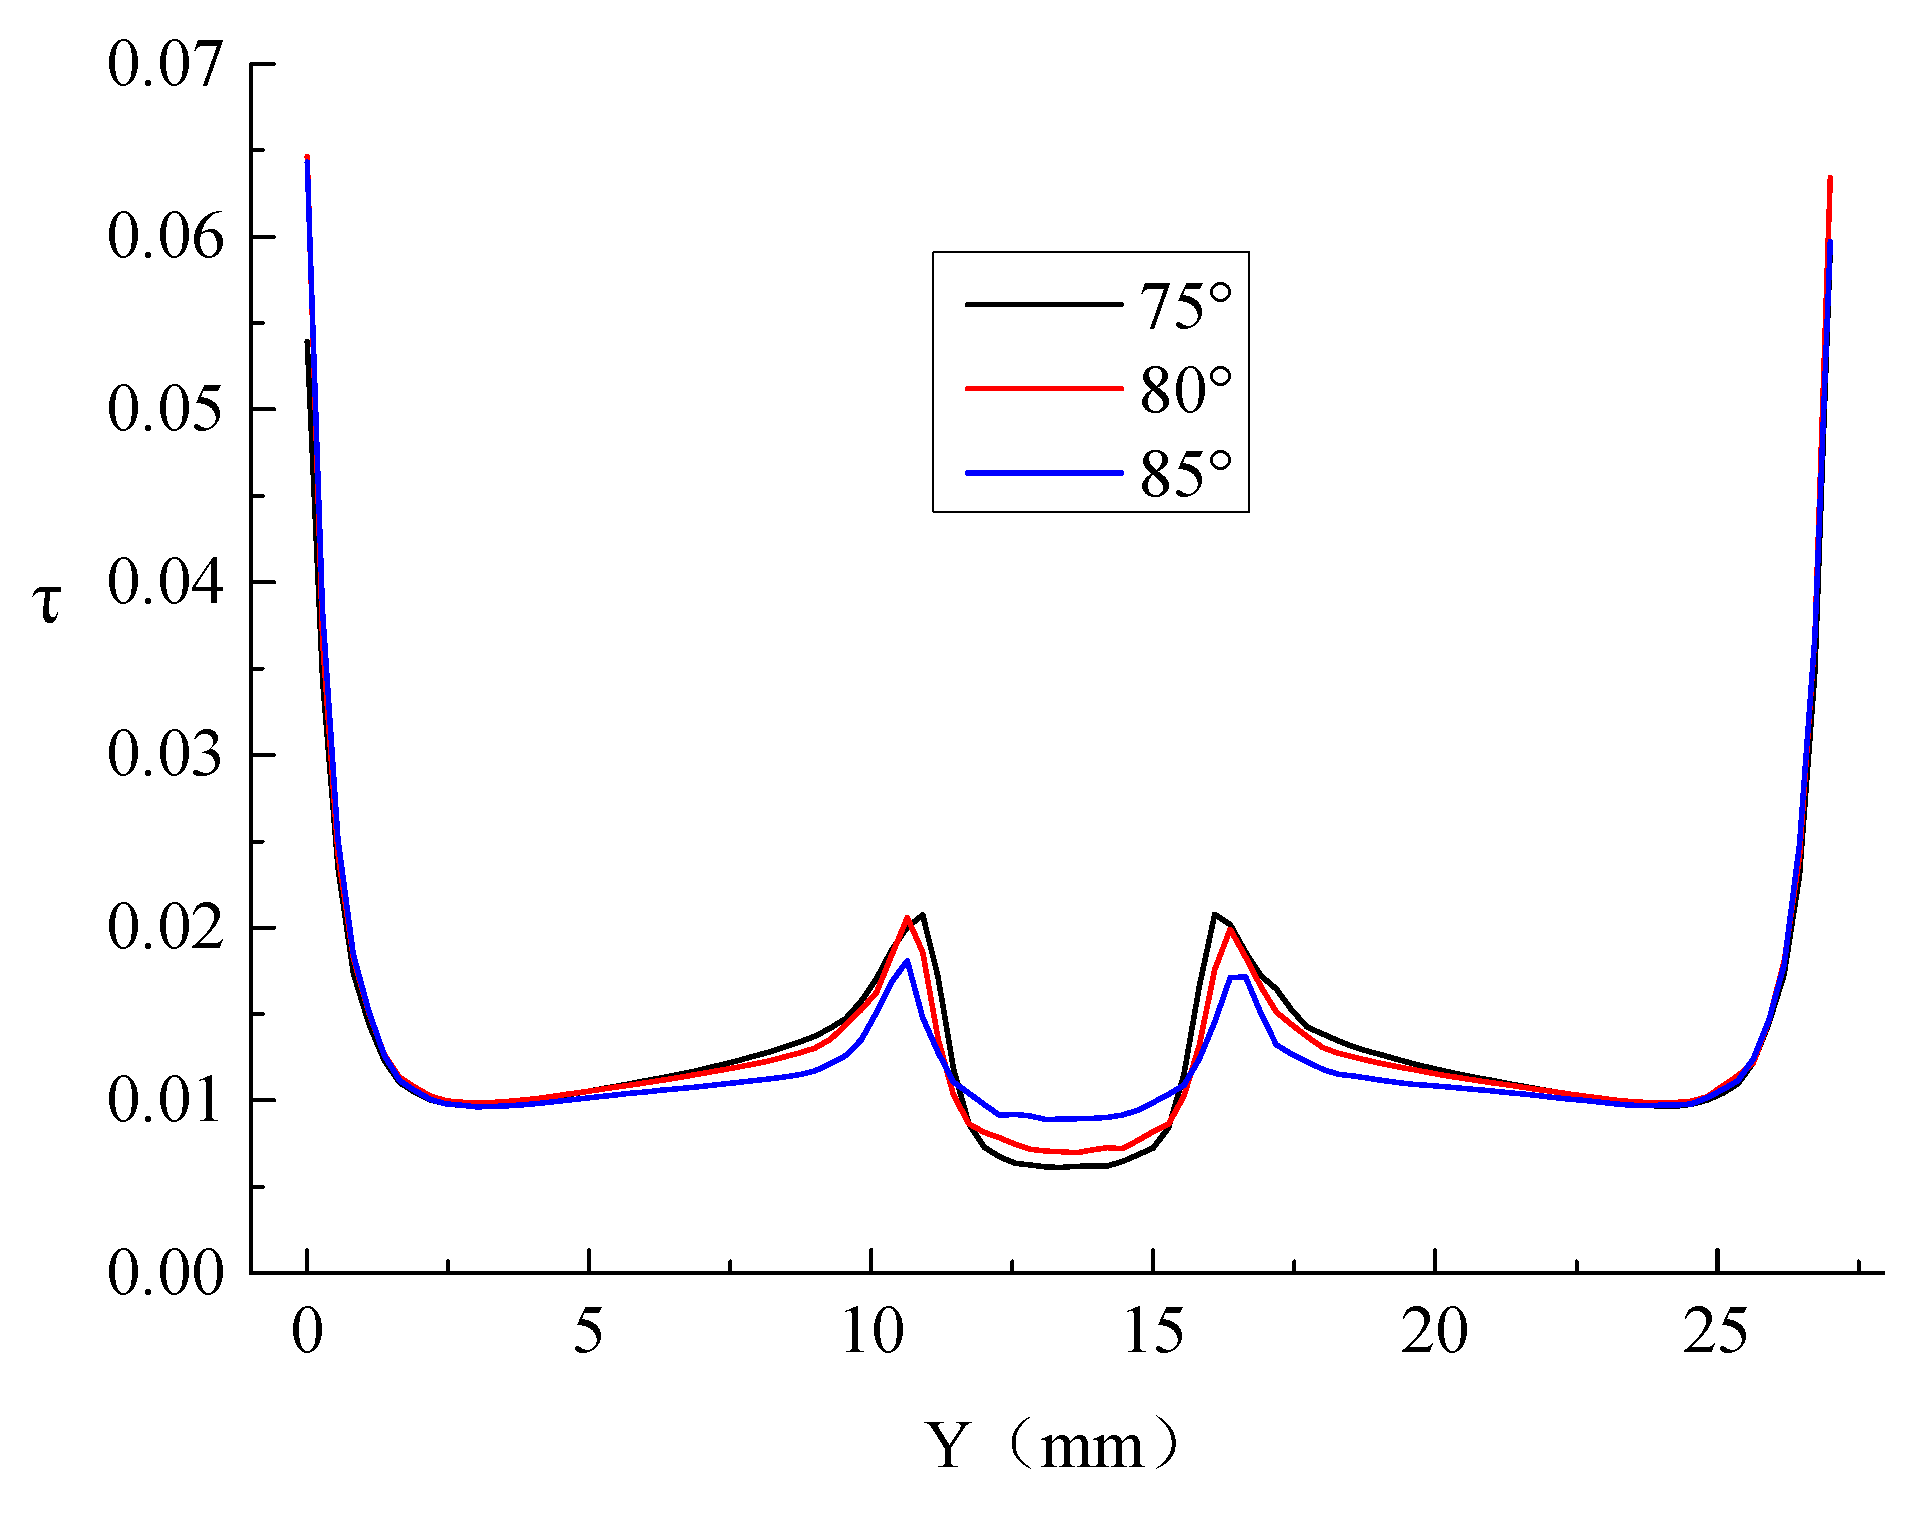
Figure 8 shows the coefficient distribution of pressure pulsation at the leading edge monitoring lines at different fully opening leaflet angles from 75° to 85°. Under different fully opening angle conditions, the coefficient distribution of pressure pulsation at the leading edge monitoring lines were similar. The level of the pressure pulsation coefficient near the wall and the leading edge was relatively higher, and relatively lower at the central and lateral orifices. As the fully opening angle increased from 75° to 85°, the level of the pressure pulsation coefficient in the region of the leading edges and the lateral orifices slightly decreased, and the maximum value of the pressure pulsation coefficient near the leading edge decreased from 0.02 to 0.017. Under the same conditions, the pressure pulsation coefficient in the central orifice gradually increased and the minimum value of the pressure pulsation coefficient at the central orifice increased from 0.007 to 0.011. The results showed that, at the same flow rate condition, the level of the pressure pulsation coefficient near the leading edges slightly decreased with the increased leaflet fully opening angle. It could be inferred that the main influencing factor of the pressure pulsation coefficient level near the leading edges was the different velocity distribution. The lower the flow velocity, the larger the coefficient of pressure pulsation. Since the level of the pressure pulsation coefficient near the leading edges was very low in all cases, it could be considered that the change of the leaflet fully opening angle had little effect on pressure pulsation and the potential vibration of leaflets leading edges.
Figure 9 is the coefficient distribution of pressure pulsation at the trailing edge monitoring lines at different fully opening leaflet angles from 75° to 85°. In all three cases, the distribution of the pressure pulsation coefficient at the trailing edge monitoring lines were similar. The pressure pulsation coefficient near the trailing edge was relatively higher. At the main flow region, the pressure pulsation coefficients in the central and lateral orifices were close to zero. As the fully opening angle increased from 75° to 85°, the level of the pressure pulsation coefficient near the trailing edges gradually increased, and the maximum value of the pressure pulsation coefficient increased from 6.6 to 9.5. Additionally, in comparison to another two cases, the pressure pulsation coefficient in the central orifice showed a nonuniform distribution with the under 75° opening angle condition. The results showed that at the same flow rate condition, the level of the pressure pulsation coefficient near the trailing edges gradually increased as the leaflet fully opening angle increased. It could be inferred that the main influencing factor on the pressure pulsation coefficient level near the trailing edges was the different vortex structure distribution. The larger leaflet fully opening angle led to the larger vortex core region and a higher level of pressure pulsation coefficient. The nonuniform distribution of the pressure pulsation coefficient indicated that the nonuniform velocity distribution might be induced by the narrow central orifice under a relatively lower leaflet opening angle condition. Thus, considering the pressure pulsation and the flow uniformity, the recommended setting of leaflet fully opening angle was about 80°.
4. Conclusions
In this study, the pressure pulsation characteristics induced by unsteady blood flow in the BMHV under different flow rates and leaflet fully opening angle conditions were analyzed. The conclusions can be listed as follows.
In regard to blood flow through a BMHV, the main influencing factor of the pressure pulsation coefficient level was the different velocity distribution. In all cases, the vortex core region and low-velocity region were mainly formed in the leading and trailing edges of leaflets. The lower the flow velocity on the edges of leaflets, the larger the coefficient of pressure pulsation. As the flow rate increased, the flow velocity near the edges of the leaflets increased and the coefficient of pressure pulsation decreased; the vortices then fell off downstream, and the influence of pressure pulsation decreased.
The level of the pressure pulsation coefficient near the trailing edges was much larger than the data obtained near the leading edges of leaflets, which indicated that one of the main reasons for leaflet vibration was the pressure pulsation located at the trailing edges of leaflets under low-velocity conditions. At the same flow rate and different leaflet fully opening angle conditions, the level of the pressure pulsation coefficient near the leading edges was close to 0, which indicated that the change in leaflet fully opening angle had little effect on the pressure pulsation and the potential vibration of leaflet leading edges.
The range of the vortex core region increased with the increased leaflet fully opening angle. The relatively lower the velocity in the vortex core region, the larger the level of the pressure pulsation coefficient. Meanwhile, the nonuniform velocity distribution could have been induced by the narrow central orifice under the relatively lower leaflet opening angle condition. Thus, considering the pressure pulsation and the flow uniformity, the recommended setting of leaflet fully opening angle was about 80°.
In this study, because the influence of the change of pressure and velocity boundary conditions to the phenomenon of leaflet fluttering are not well understood, a model of leaflets in fixed positions was adopted to simplify the calculation, which may have led to deviation between the simulation results and the actual situation. In addition, only one of the velocity profile monitoring lines was compared and validated by the experimental results. Considering the periodic boundary conditions, the simulation of the whole cardiac cycle and more detailed data are required for full validation in future work.
Author Contributions
Conceptualization, X.-g.-X. and S.-x.-L.; methodology, X.-g.-X.; software, X.-g.-X. and L.Z.; validation, T.-y.-L. and X.-g.-X.; formal analysis, T.-y.-L.; investigation, T.-y.-L. and X.-g.-X.; resources, S.-x.-L.; data curation, T.-y.-L. and C.L.; writing—original draft preparation, X.-g.-X. and C.L.; writing—review and editing, X.-g.-X. and C.L.; visualization, X.-g.-X.; supervision, S.-x.-L.; project administration, X.-g.-X.; funding acquisition, S.-x.-L.
Funding
This research was funded by National Natural Science Foundation of China, grant number 51569012, and the Fundamental Research Funds for Colleges and Universities in Gansu province, grant number 20146302.
Conflicts of Interest
The authors declare no conflict of interest.
References
- Yoganathan, A.P.; Chandran, K.B.; Sotiropoulos, F. Flow in prosthetic heart valves: State-of-the-art and future directions. Ann. Biomed. Eng. 2005, 33, 1689–1694. [Google Scholar] [CrossRef] [PubMed]
- Smadi, O.; Hassan, I.; Pibarot, P.; Kadem, L. Numerical and experimental investigations of pulsatile blood flow pattern through a dysfunctional mechanical heart valve. J. Biomech. 2010, 43, 1565–1572. [Google Scholar] [CrossRef]
- Alemu, Y.; Bluestein, D. Flow-induced platelet activation and damage accumulation in a mechanical heart valve: Numerical studies. Artif. Organs 2007, 31, 677–688. [Google Scholar] [CrossRef] [PubMed]
- Zhou, F.; Cui, Y.Y.; Wu, L.L.; Yang, J.; Liu, L. Analysis of Flow Field in Mechanical Aortic Bileaflet Heart Valves Using Finite Volume Method. J. Med. Biol. Eng. 2016, 36, 110–120. [Google Scholar] [CrossRef]
- Cheon, G.J.; Chandran, K.B. Dynamic behavior analysis of mechanical monoleaflet heart valve prostheses in the opening phase. J. Biomech. Eng. 1993, 115, 389–395. [Google Scholar] [CrossRef]
- Chu, Y.P.; Cheng, J.L.; Liu, A.J. Evaluation on opening status of the mechanical heart valve in vitro under pulsatile flow. Chin. J. Tissue Eng. 2012, 16, 7480–7485. [Google Scholar] [CrossRef]
- Lee, S.H.; Ryu, S.M.; Jeong, W.B. Vibration analysis of compressor piping system with fluid pulsation. J. Mech. Sci. Technol. 2012, 26, 3903–3909. [Google Scholar] [CrossRef]
- Zhang, N.; Yang, M.; Gao, B.; Li, Z.; Ni, D. Experimental and numerical analysis of unsteady pressure pulsation in a centrifugal pump with slope volute. J. Mech. Sci. Technol. 2015, 29, 4231–4238. [Google Scholar] [CrossRef]
- Nobili, M.; Morbiducci, U.; Ponzini, R.; Gaudio, C.; Balducci, A.; Grigioni, M.; Montevecchi, M.; Redaelli, A. Numerical simulation of the dynamics of a bileaflet prosthetic heart valve using a fluid-structure interaction approach. J. Biomech. 2008, 41, 2539–2550. [Google Scholar] [CrossRef]
- Borazjani, I.; Ge, L.; Sotiropoulos, F. High-Resolution Fluid–Structure Interaction Simulations of Flow through a Bi-Leaflet Mechanical Heart Valve in an Anatomic Aorta. Ann. Biomed. Eng. 2010, 38, 326–344. [Google Scholar] [CrossRef] [PubMed]
- Ge, L.; Dasi, L.P.; Sotiropoulos, F.; Yoganathan, A. Characterization of Hemodynamic Forces Induced by Mechanical Heart Valves: Reynolds vs. Viscous Stresses. Ann. Biomed. Eng. 2008, 36, 276–297. [Google Scholar] [CrossRef]
- Redaelli, A.; Bothorel, H.; Votta, E.; Soncini, M.; Morbiducci, U.; Del Gaudio, C.; Balducci, A.; Grigioni, M. 3-D simulation of the SJM bileaflet valve opening process: Fluid–structure interaction study and experimental validation. J. Heart Valve Dis 2004, 13, 804–813. [Google Scholar] [CrossRef]
- Cheng, R.; Lai, Y.G.; Chandran, K.B. Three-Dimensional Fluid-Structure Interaction Simulation of Bileaflet Mechanical Heart Valve Flow Dynamics. Ann. Biomed. Eng. 2004, 32, 1471–1483. [Google Scholar] [CrossRef] [Green Version]
- Bluestein, D.; Rambod, E.; Gharib, M. Vortex shedding as a mechanism for free emboli formation in mechanical heart valves. J. Biomech. Eng. 2000, 122, 125–134. [Google Scholar] [CrossRef]
- Shahriari, S.; Maleki, H.; Hassan, I.; Kadem, L. Evaluation of shear stress accumulation on blood components in normal and dysfunctional bileaflet mechanical heart valves using smoothed particle hydrodynamics. J. Biomech. 2012, 45, 2637–2644. [Google Scholar] [CrossRef]
- Kwon, Y.J. Numerical analysis for the structural strength comparison of st. jude medical and edwards mira bileaflet mechanical heart valve prostheses. J. Mech. Sci. Technol. 2010, 24, 461–469. [Google Scholar] [CrossRef]
- Qian, J.Y.; Li, X.J.; Gao, Z.X.; Jin, Z.J. Mixing Efficiency Analysis on Droplet Formation Process in Microchannels by Numerical Methods. Processes 2019, 7, 33. [Google Scholar] [CrossRef]
- Qu, J.; Yan, T.; Sun, X.; Li, Z.; Li, W. Numerical Simulation of the Effects of the Helical Angle on the Decaying Swirl Flow of the Hole Cleaning Device. Processes 2019, 7, 109. [Google Scholar] [CrossRef]
- MinYun, B.; McElhinney, D.B.; Shiva, A.; Lucia, M.; Aidun, C.K.; Yoganathan, A.P. Computational simulations of flow dynamics and blood damage through a bileaflet mechanical heart valve scaled to pediatric size and flow. J. Biomech. 2014, 47, 3169–3177. [Google Scholar] [CrossRef]
- Kuan, Y.H.; Kabinejadian, F.; Nguyen, V.T.; Su, B.; Yoganathan, A.P.; Leo, H.L. Comparison of hinge microflow fields of bileaflet mechanical heart valves implanted in different sinus shape and downstream geometry. Comput. Method. Biomech. 2015, 18, 1785–1796. [Google Scholar] [CrossRef] [PubMed]
- Kim, C.N.; Hong, T. The effects of the tilt angle of a bileaflet mechanical heart valve on blood flow and leaflet motion. J. Mech. Sci. Technol. 2012, 26, 819–825. [Google Scholar] [CrossRef]
- Ge, L.; Leo, H.L.; Sotiropoulos, F.; Yoganathan, A.P. Flow in a mechanical bileaflet heart valve at laminar and near-peak systole flow rates: CFD simulations and experiments. J. Biomech. Eng. 2005, 127, 782–797. [Google Scholar] [CrossRef]
- Jin, Z.J.; Gao, Z.X.; Qian, J.Y.; Wu, Z.; Sunden, B. A parametric study of hydrodynamic cavitation inside globe valves. ASME J. Fluids Eng. 2018, 140, 031208. [Google Scholar] [CrossRef]
- Qian, J.Y.; Gao, Z.X.; Liu, B.Z.; Jin, Z.J. Parametric study on fluid dynamics of pilot-control angle globe valve. ASME J. Fluids. Eng. 2018, 140, 111103. [Google Scholar] [CrossRef]
- Jin, Z.J.; Gao, Z.X.; Zhang, M.; Liu, B.Z.; Qian, J.Y. Computational fluid dynamics analysis on orifice structure inside valve core of pilot-control angle globe valve. IMeChE Part C J. Mech. Eng. Sci. 2018, 232, 2419–2429. [Google Scholar] [CrossRef]
- Qian, J.Y.; Chen, M.R.; Liu, X.L.; Jin, Z.J. A numerical investigation of the flow of nanofluids through a micro Tesla valve. J. Zhejiang Univ. Sci. A. 2019, 20, 50–60. [Google Scholar] [CrossRef]
© 2019 by the authors. Licensee MDPI, Basel, Switzerland. This article is an open access article distributed under the terms and conditions of the Creative Commons Attribution (CC BY) license (http://creativecommons.org/licenses/by/4.0/).


