Article

Response Surface Method in the Optimization of a Rotary Pan-Equipped process for Increased Efficiency of Slow-Release Coated Urea

by
Farahnaz Eghbali Babadi
1,*,
Robiah Yunus
2,
Ali Abbasi
3 and
Salman Masoudi Soltani
4,*
1
Chemical Engineering Research Unit for Value Adding of Bioresources, Department of Chemical Engineering, Faculty of Engineering, Chulalongkorn University, Phayathai Road, Bangkok 10330, Thailand
2
Department of Chemical and Environmental Engineering, Faculty of Engineering, Universiti Putra Malaysia, Selangor 43400, Malaysia
3
Computational Process Engineering Research Laboratory, Department of Chemical Engineering, Faculty of Engineering, Chulalongkorn University, Bangkok 10330, Thailand
4
Department of Chemical Engineering, Brunel University London, Uxbridge UB8 3PH, UK
*
Authors to whom correspondence should be addressed.
Processes 2019, 7(3), 125; https://doi.org/10.3390/pr7030125
Submission received: 11 January 2019 / Revised: 13 February 2019 / Accepted: 19 February 2019 / Published: 28 February 2019

Abstract

:
The high solubility of urea in water and its consequent leaching into the soil adversely prevents its full assimilation by plants. An improved slow-release process could effectively minimise the loss of fertilizer material and thus mitigate the associated environmental pollution. In this study, the effects of the operational variables on the efficiency of the urea coating process in a rotary pan have been systematically analysed. A mixture of gypsum-sulphur was used as the coating material with refined water as a binder. In order to comprehensively investigate the impact of each process variable on the efficiency and any potential interactions between them, the effects of particle size, coating material percentage, rotational speed of the pan, spray flow rate and the amount of sprayed water were investigated and analysed via a central composite design of experiments (DoE). The second-order polynomial model provided the best correlation for the experimental data. The predictive model was then used to estimate the efficiency of the coated urea as a function of the statistically-significant variables. The results revealed an increase in the efficiency of the coated urea from 22% to 35% (i.e., ~59%) when prepared under the optimum process conditions.

Graphical Abstract

1. Introduction

Urea fertilizer, one of the most commonly-used nitrogenous fertilizers, has been widely used in agricultural applications owing to its high nitrogen content, low cost and relative abundance. However, the high water solubility of urea also portrays an impactful downside in the form of consequential environmental pollution (i.e., ammonia & nitrous oxide). It may also result in the contamination of underground drinking water resources via the leaching of nitrogen in form of nitrates.
A significant amount of research has been centred on finding ways to control and minimise the loss of nitrogen. So far, there have been four main approaches to achieving this: (1) the use of the slightly soluble materials such as urea formaldehyde [1,2,3]; (2) the use of materials for deep placement such as urea super granules (USG) [4,5]; (3) the use of urease and nitrification inhibitors [6,7] and (4) the use of fertilizers coated with semi-permeable or impermeable layers [8,9].
The use of coated urea to control nitrogen release has been investigated in the literature [10,11]. Various types of coated urea and processes have been reported which not only optimise the release of chemicals but also enhance the handling and storage of the materials. The initial work at Tennessee Valley Authority (TVA) resulted in the development of an economical, technically- feasible production of sulphur-coated fertilizers [12]. Rindt, Blouin, and Getzinger (1968) continued the studies on sulphur coating of urea and developed an industrial batch process [13]. The coating process equipment consisted of a rotary pan in which the urea granules were sprayed with sulphur, an electrically heated sulphur melt pot and air-atomizing nozzle for spraying sulphur and a second pan in which the wax sealant and conditioner were applied to the sulphur-coated granules. The TVA then developed the first continuous coating process of urea with sulphur in a rotary drum [14]. The operational parameters of the rotary drum were optimised by Shirley & Meline (1975) to improve the efficiency of the nitrogen release from the sulphur coated-urea [15]. In 1978, Meisen and Mathur investigated the use of spouted beds for the manufacture of sulphur-coated urea owing to its successful application in the production of pharmaceutical tablets [16]. In the following decade, Salman analysed the dissolution rate of coated urea with polyethylene, produced in a modified fluidized bed [8,17]. In order to devise a solution for caking and dustiness problems in the storage, handling and shipping of sulphur-coated urea, Gullett, Simmons and Lee (1991) used a bench-scale rotary pan for the sulphur coating of urea-clay [18]. Later on, the fluidized bed Wurster column was used to apply polymeric topcoats on the sulphur coating in order to manufacture controlled-release fertilizer products [19]. Choi and Meisen developed two mathematical models for shallow spouted beds to predict the distribution of coating material (sulphur) on urea particles [20]. A two-dimensional spouted bed was also employed in the analysis of the surface quality of sulphur-coated urea [21]. Donida and Sandra studied the effects of the operational variables on particle growth in a conventional spouted bed [22]. Modified sulphur with dicyclopentadien (DCPD) was used by Liu et al. (2008) to increase the strength and abrasion resistance of the controlled-release urea in a fluidized bed coater [23]. The influence of operational parameters on particle growth was also analysed for urea coating in a spouted bed by Rosa & Rocha [24]. Lignin-based biodegradable controlled-release urea was developed by Mulder et al. in a pan coater [25]. In the meantime, Lan et al. (2011) designed an experimental rig in order to investigate the effects of key factors involved in the coating process using a Wurster fluidized bed [26]. Qin et al. employed the response surface method (RSM) to study and optimize the synthesis process conditions of slow-release nitrogen fertilizer [27]. Later, Pursell et al. (2012) studied biopolymer coating in order to synthesise controlled-release fertilizers in a bench-scale rotary drum [28]. More recently, the application of the response surface method (RSM) to identify the optimal process parameters in the synthesis of urea-formaldehyde fertilizers was reported by Guo et al. [29].
In the present study, a rotary pan has been selected due to its versatility, flexibility, large throughputs and its ability to handle a wide range of particles to study the effects of process variables on the efficiency of the synthesised coated urea. The individual and inter-variable interaction effects were systematically analysed via a central composite design of experiments (DoE). Optimum process envelopes and a predictive model were generated using RSM.

2. Experimental Procedures

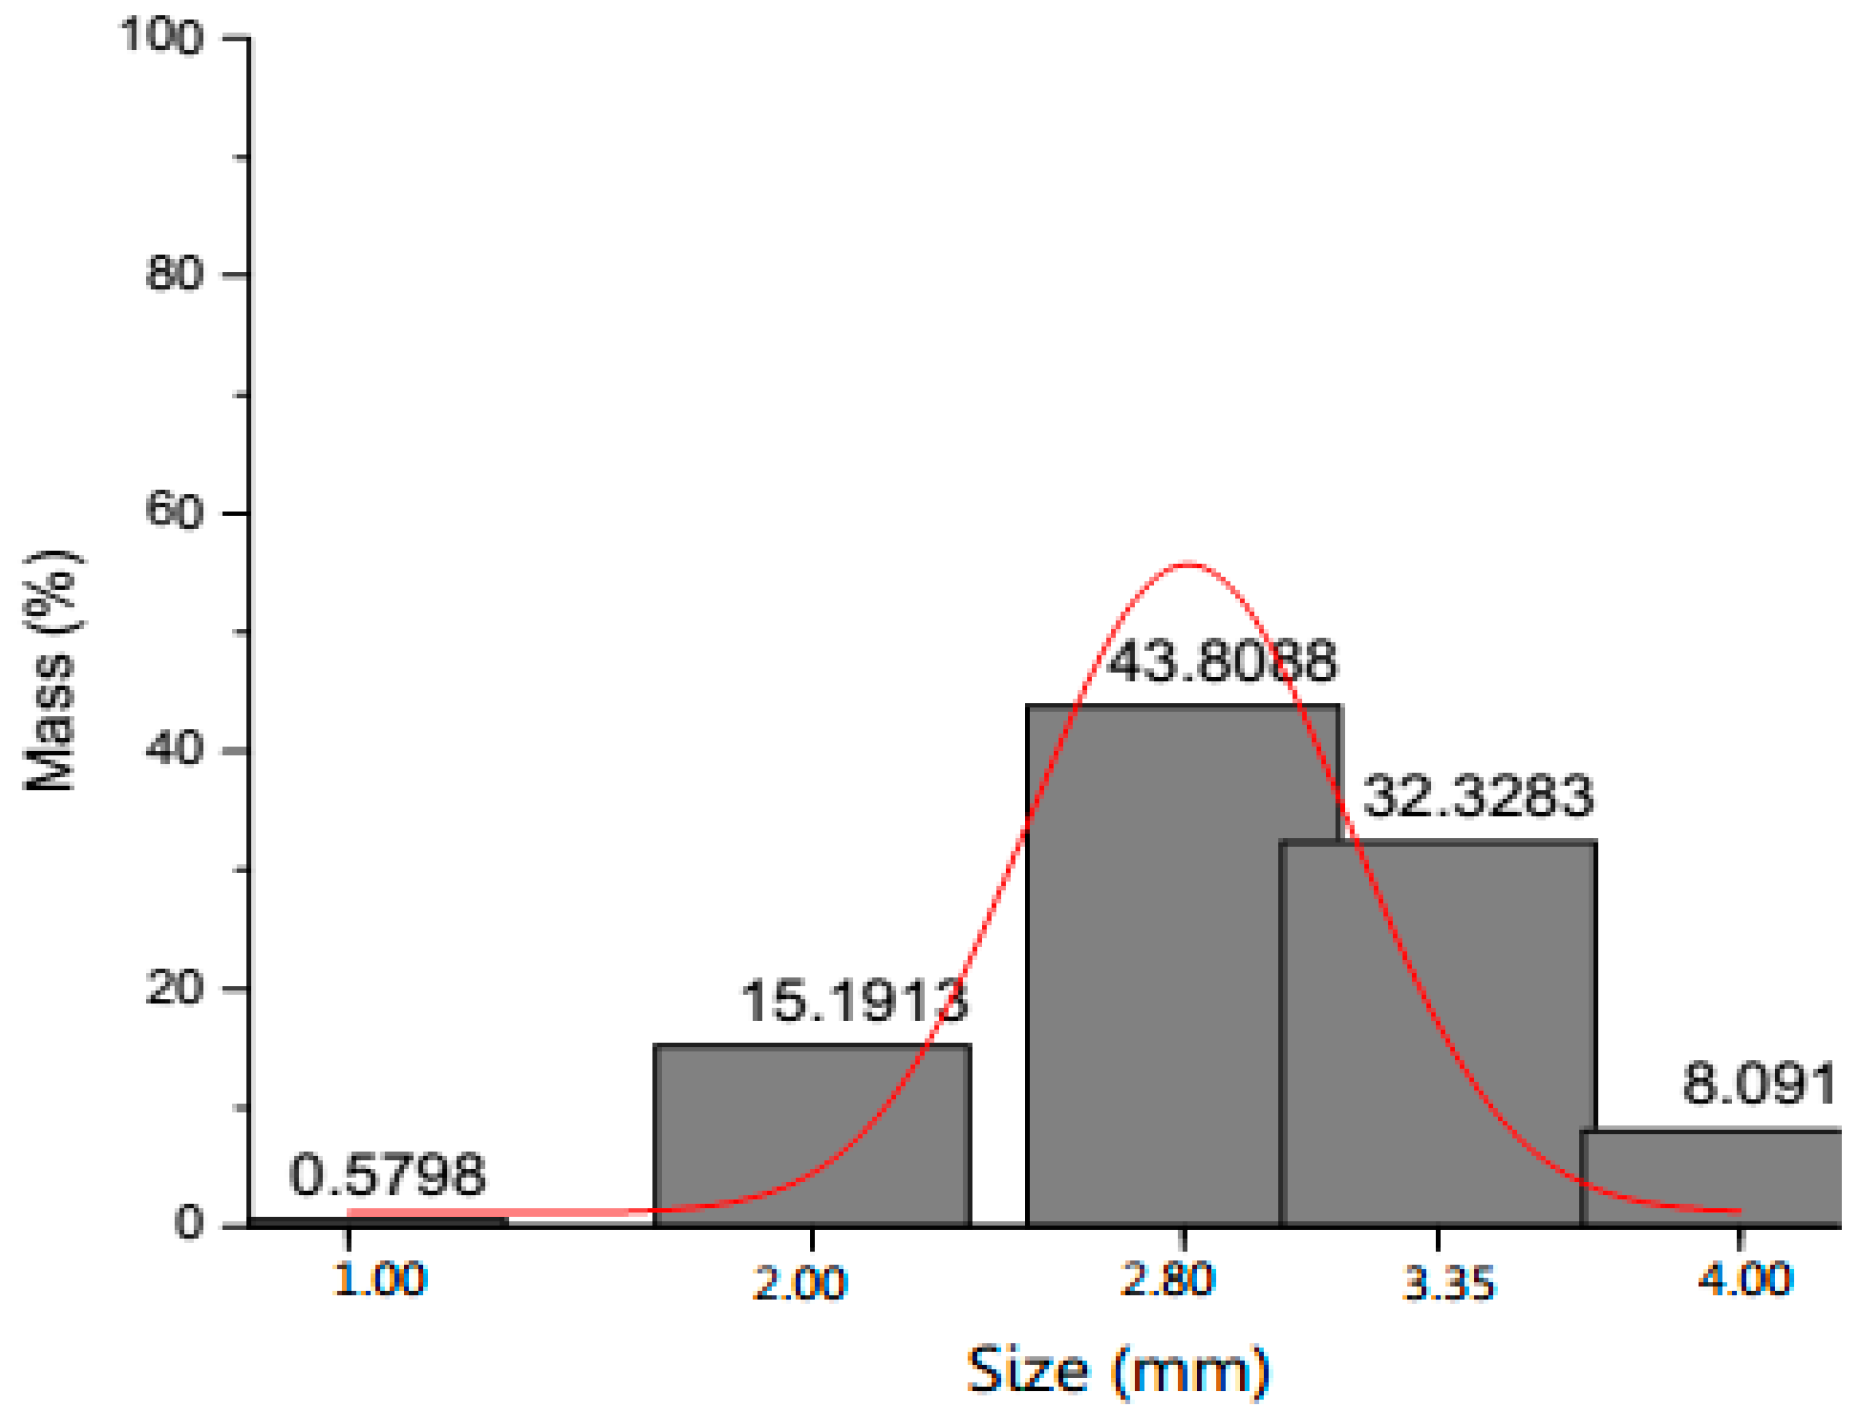
2.1. Materials and Related Analysis

Commercial urea particles (1 mm—4 mm in size with a nitrogen content of 46%) were supplied by Petronas Agrenas. Figure 1 shows the particle size distribution for the urea granules. The gypsum powder and sulphur were used as the coating materials. The coating provides the nutrients needed to supply the plants. By using gypsum, the nitrogen utilization percentage increases from 33%—38% to around 60% [30]. Sulphur is an essential element for growth and physiological functioning of plants [31]. Commercial gypsum and sulphur were purchased from Siam Gypsum Plaster L.P. (Bangkok, Thailand) and Palm Brand (National Establishment for Agricultural and Industrial Sulphur, Saudi Arabia). All other chemicals and reagents used in this study were purchased from Merck and Systerm. The quantitative analysis of the released urea was completed using a high-performance liquid chromatograph (HPLC) with acetonitrile (HPLC grade, Friendeman Schmidt) in a 10:90 ratio and with distilled water as the mobile phase.

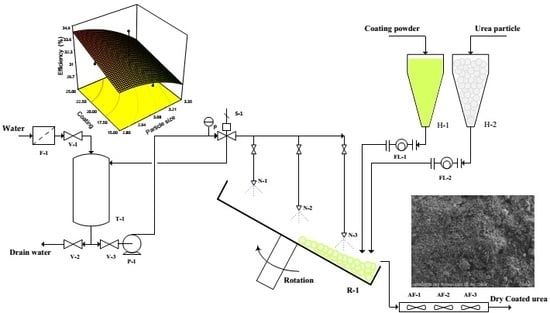
2.2. Coating Process

The coating process employed in this work has been adopted from our previous work on gypsum-dolomite coated urea [32]. A stainless steel rotary pan (60 cm in diameter and 12 cm in pan height) (Figure 2) was used to coat the urea particles. Urea granules, previously sieved to 2.8 mm and 3.3 mm in diameter, were weighed and fed into the rotary pan. The coating materials were first weighed separately before they were mixed. The mixture was then ground to produce a fine powder. In all experiments, the ratio of the coating material was adjusted at 50% sulphur and 50% gypsum and was kept constant for the duration of the coating process. The amount of urea and coating material charged to the hopper was a function of the coating percentage and the available bed in the rotary pan (i.e., loading). After blending the urea granules and the coating material in the rotary pan, water mist was introduced into the bed surface. These steps were repeated until all of the urea and the coating material were completely used. Finally, the coated urea granules were placed on a vibration tray where they were dried with a small fan and then collected for analysis.

2.3. Analysis of Urea Dissolution

A sample of the granules (50 g) was placed in a sealed Erlenmeyer flask filled with water (250 ml). The Erlenmeyer flask was then placed in an incubator and agitated for 300 minutes. The temperature and rotation speed were set at 30 °C and 100 rpm, respectively. The extracted samples were diluted tenfold with distilled water, and subsequently analysed via HPLC to measure the urea concentration. A known volume of the diluted samples (20 µL) was injected into a LiChroCART 250-4,6 Pureser STAR column mounted on the HPLC (Shimadzu LC20AT-Prominence, Japan), equipped with a UV-Vis detector. The oven temperature was set and kept at 30 °C with the wavelength fixed at 210 nm.
The HPLC was calibrated to measure the urea concentration (Equation (1) with R2 = 0.99833)
C u = 1.20426 e 5 × x
where x is the peak area (×106) (at a retention time of 2.7 min) and Cu is the concentration of urea (mg L−1).
The efficiency of coating (Equation (2)), defined as a comparison of the undissolved urea in coated samples against the raw urea, was calculated based on the formula:
C o a t i n g e f f i c i e n c y ( % ) = ( 1 C c u 1 ( p / 100 ) C ) × 100
where Ccu is the concentration of the coated urea (mg L−1) with urea completely dissolved in water (after 300 minutes of the experimental trial) and p is the coating percentage of urea granules.

2.4. Experimental Design

The optimization study was carried out using a fractional factorial design of experiments (DoE) with five factors and three levels, corresponding to a total number of 48 experimental trials. The fractional factorial design, comprising 42 factorial points and six centre points, was generated using the Design-Expert 7 statistical software. The associated response surface model is described by Equation (3). The corresponding variables and their corresponding levels selected for this study are represented in Table 1.
Y = β 0 + i = 1 5 β i X i + i = 1 5 β i i X i 2 + i = 1 4 j = i + 1 5 β i j X i X j + ε
where Y (efficiency %) represents the response variable, β0 is a constant, βi represents the coefficients of the linear parameters, xi represents the variables, βii represents the coefficients of the quadratic parameters, βij represents the coefficients of the interaction parameters and ε is the residual associated with the experimental trials.

2.5. Characterization Method

The surface morphology of the coated sample before and after process optimization was studied on a scanning electron microscope (Hitachi Co., Japan, model No. S3400N). In this study, the specific surface area and the pore size distribution of the three samples (urea, coated urea before and after optimization) were measured on a nitrogen adsorption/desorption instrument (Micromeritics (USA)) at 77 K. Prior to the experiments, the samples were degassed at 50 °C under vacuum. The BET surface area and the full adsorption isotherms were measured for all samples according to the Brunauer-Emmett-Teller (BET) method. The pore size distribution was calculated using the non-local density functional theory (NLDFT) method.

3. Results and Discussion

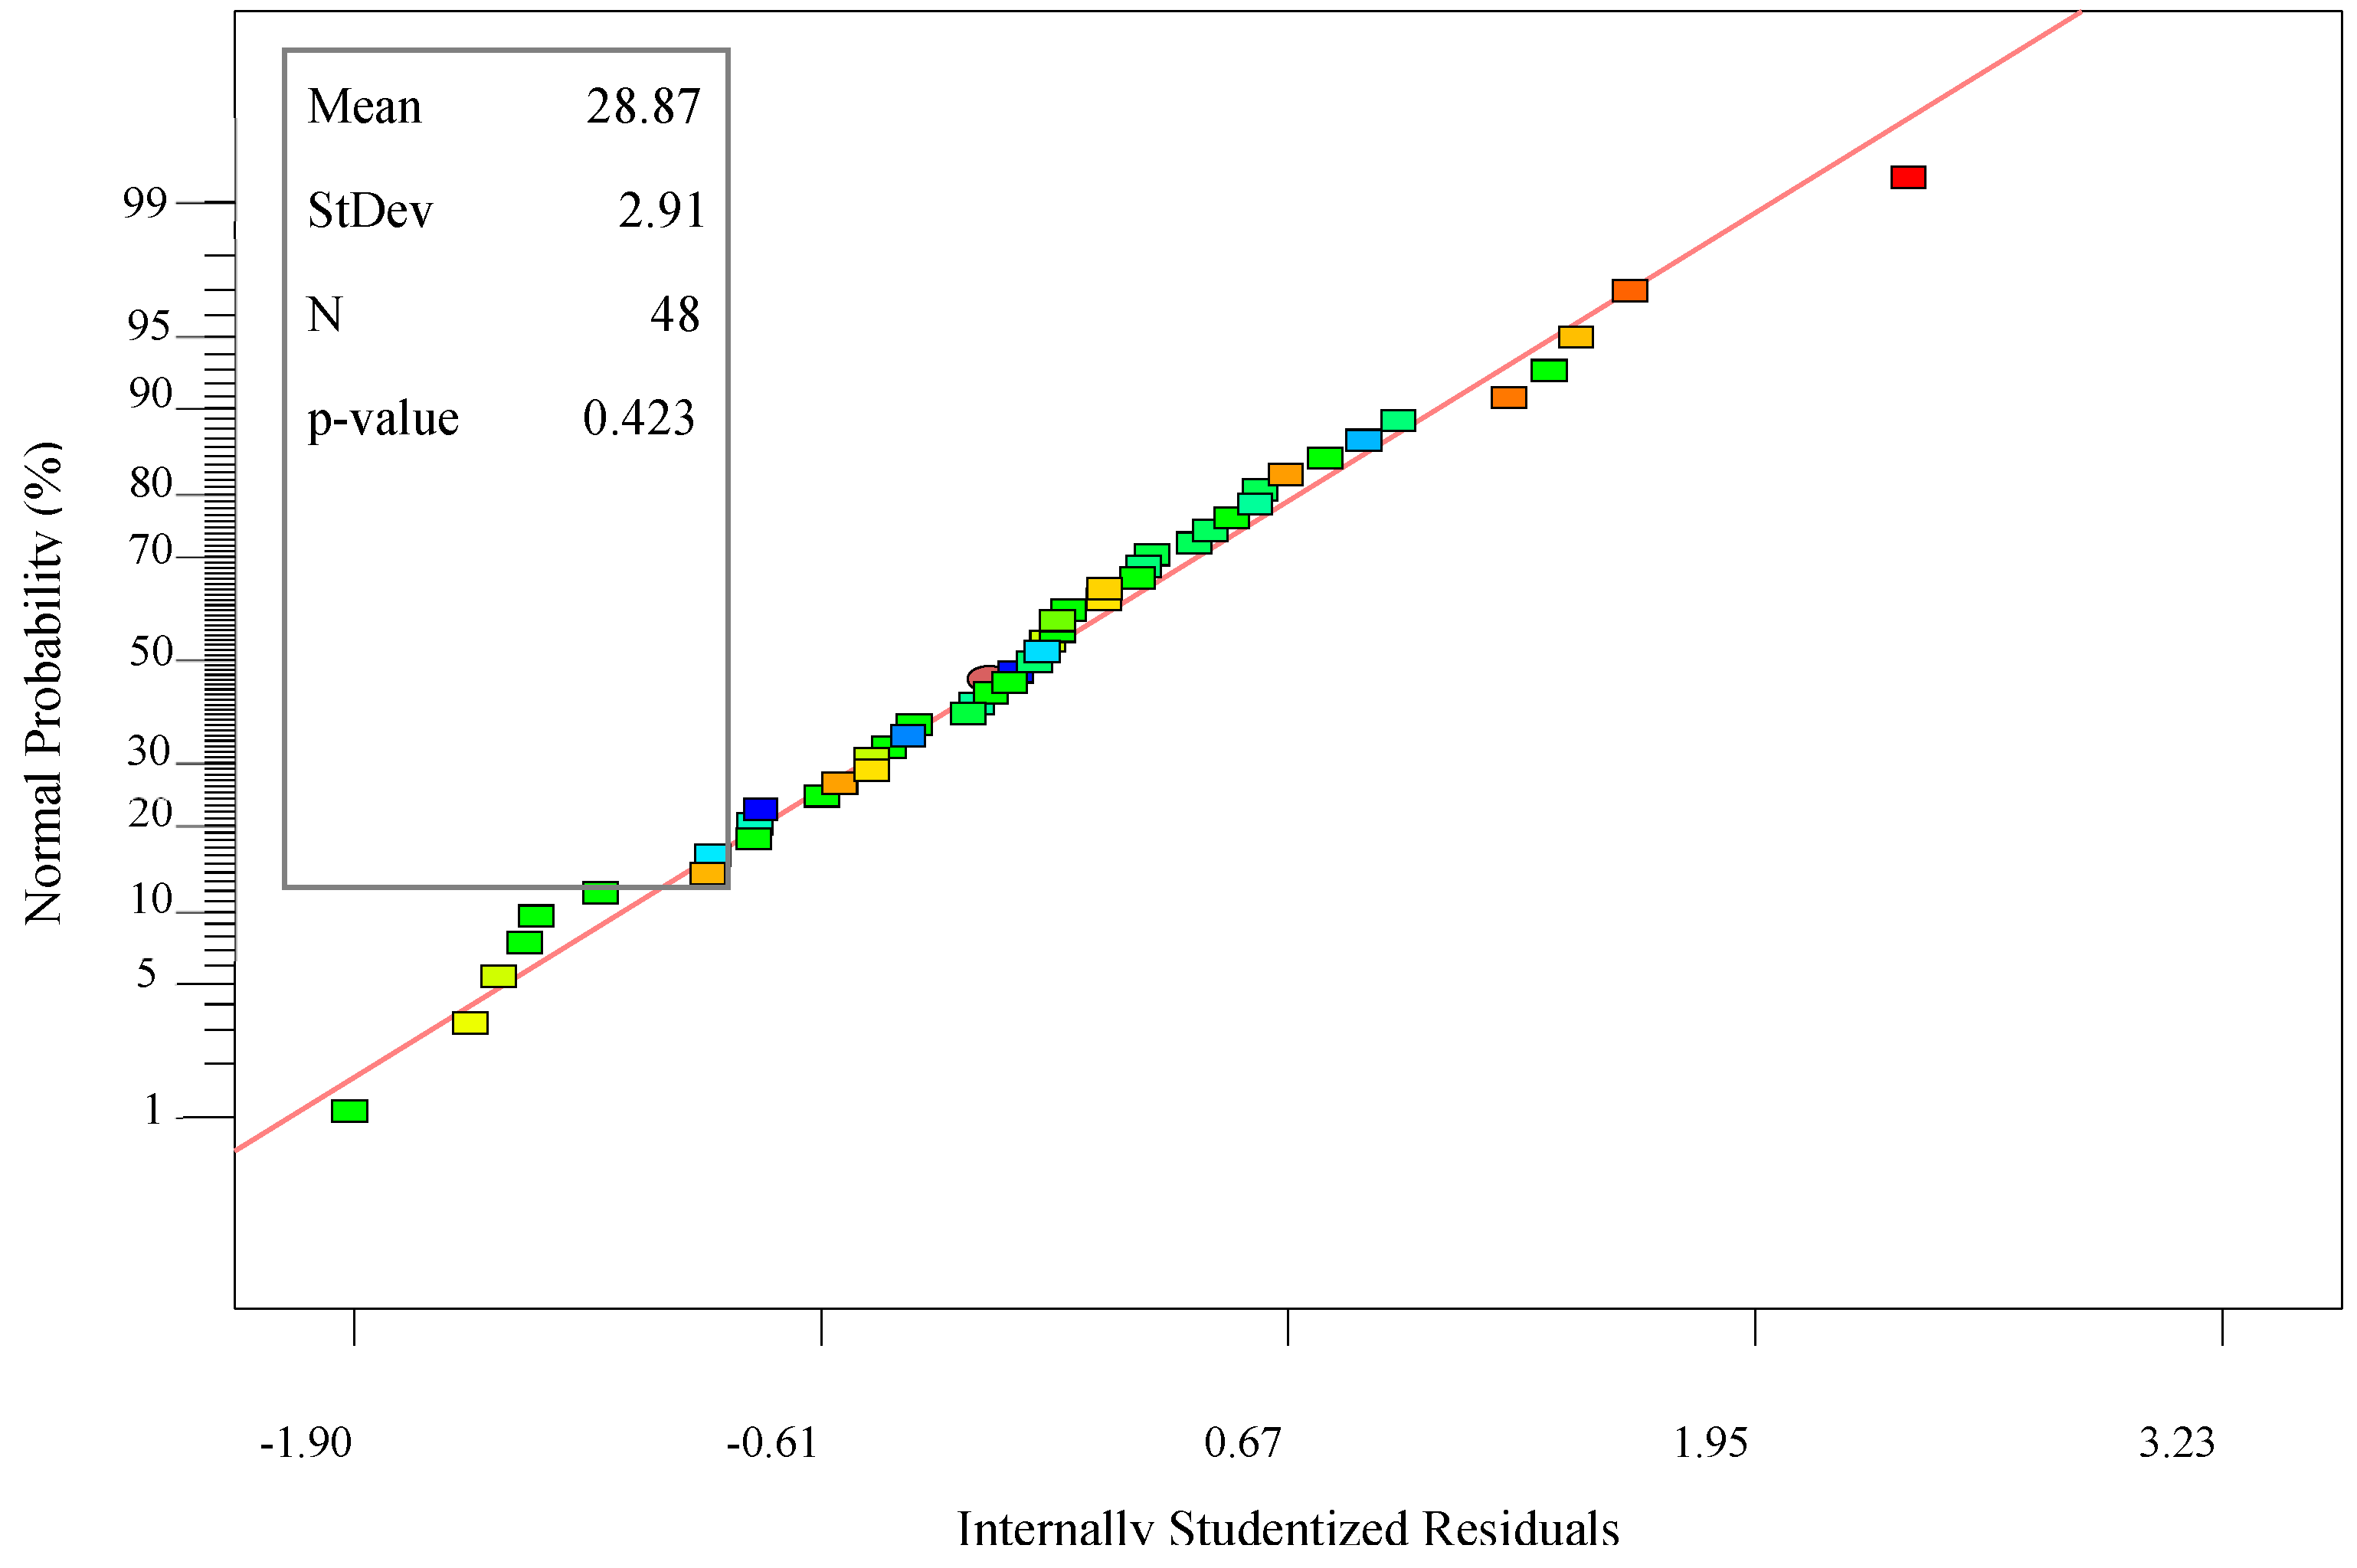
3.1. Normality Tests

The normality graph representing the experimental data in this work is illustrated in Figure 3. The graph confirms that the efficiency of the coating distribution of gypsum-sulphur coated urea is normal (i.e., p-value > 0.05). This confirms that the analysis of variance (ANOVA) for this data set can be now performed. Table 2 shows the descriptive statistics to examine the skewness and kurtosis values for the five variables at three levels. The results show that skewness varies between −0.059 and −1.108 (the acceptable range of normality is between −2.0 and +2.0) [33]. The values of kurtosis falls between −0.015 and +4.020 (the acceptable range of normality is between −5.0 and +5.0). Based on the above, the skewness and kurtosis values confirm a normal distribution of the experime ntal data in this work.

3.2. Analysis of Variance (ANOVA)

ANOVA was employed to identify and isolate the significant parameters impacting the efficiency of the process among the studied parameters (i.e., particle size, urea coating percentage, spayed water quantity, rotation speed of the pan, pan inclination, pan loading and spray flow rate). The independent variables, their levels, the associated experimental results and the predictive values of the efficiency of the gypsum-sulphur coated urea are shown in Table 3.
Four different descriptive models and their corresponding R2 values are shown in Table 4. By fitting the experimental data to these four models (i.e., linear, 2FI, quadratic and cubic) and the subsequent analysis of variance, it is realised that the efficiency of the coating is most accurately described by a quadratic model. The ANOVA results for gypsum-sulphur-coated urea is given in Table 5. The model’s F-value of 41.58 suggests a significant model. It is also seen that there exists a significantly low chance of only 0.01% that the model’s F-value can be due to the presence of statistical noise. The coefficient of determination (R2) of the model is calculated to be 0.9512, suggesting that 95.12% of the variability in the response can be well explained by the model itself. Therefore, the R2-value reflects a very good fit between the experimental and the predicted numerical figures (Figure 4). The adjusted determination coefficient (adjusted R2 = 0.9283) satisfactorily confirms the significance of the model. The Coefficient of Variation (CV)—defined as the ratio of the standard error of estimate to the mean value of the observed response (as a percentage)—is a measure of the reproducibility of the model. A lower value of the coefficient variation (i.e., CV = 2.70%) shows a high degree of accuracy and a good level of reliability of the experimental values [34]. The model also shows an adequate accuracy measured for the signal-to-noise ratio (i.e., 23.753). This model can be used to navigate through the design space.
Regression was employed to fit the quadratic model to the experimental data and to calculate the terms embedded in the model (Table 6). p-values are statistically used to evaluate the significance of each variable. They also reveal the existence (or lack of) as well as the level of interactions between the independent variables [35]. The p-values in this study are found to be < 0.05, highlighting significant model terms. Based on the statistical analyses (Table 6), three linear coefficient terms (i.e., particle size (X1), coating percentage (X2) and pan speed (X3)) were shown to be significant terms resulting in an accurate descriptive model. The negative values of the coefficient estimates denote the negative influence of parameters on the coating. It is observed that the linear coefficients of the model for the particle size (X1), pan speed (X3) and the spray flow rate (X4) demonstrate negative effects. This can be due to the fact that higher rotational speeds produce a centrifugal force sufficient to hold the powder of coating materials to the wall of the pan coater, and therefore adversely impact the efficiency of the mixing process [36]. At higher flow rates, the granules’ surface moisture increases compared to the lower spraying rates. The drying of the coating layer was therefore prolonged, and subsequently the surface was significantly more coarse compared to when lower spray rates were employed. The results are consistent with those reported by Obara and McGinity (1995), stating that a high spray rate of coating could result in the over-wetting of the tablet surface and the formation of an uneven film during the drying phase [37]. Besides, it was observed that particle size has a significant effect on the efficiency of the coating. Indeed, despite the negative values, urea particle size has a critical impact on the coating efficiency.
After the elimination of the insignificant terms, the optimum model, capable of accurately predicting the efficiency% of the gypsum-sulphur coated urea, is reduced to:
Y = 32.39 1.40 X 1 + 0.89 X 2 0.28 X 3 0.22 X 4 + 0.17 X 5 0.24 X 1 X 2 1.08 X 1 X 3 0.055 X 1 X 4 + 0.66 X 2 X 3 0.18 X 2 X 4 0.53 X 2 X 5 0.61 X 1 2 2.72 X 4 2 1.64 X 5 2 0.18 X 1 X 2 X 4
where Y is the efficiency% of coating and X1, X2, X3, X4 and X5 represent the urea particle size (mm), coating percentage, pan speed (rpm), spray flow rate (g/min) and spray water percentage, respectively.

3.3. Interaction Effects between the Process Variables

Equation (4) suggests that the interactions between the variables have significant effects on the efficiency of the coating. Figure 5, Figure 6, Figure 7, Figure 8, Figure 9 and Figure 10 show the effects of different coating variables on the efficiency of the coated samples. Figure 5 demonstrates the effects of the particle size and coating percentage on the efficiency of the gypsum-sulphur-coated urea. The response surface describing the interactions between the particle size and the coating percentage was generated with a constant pan speed of 12 rpm, a spray flow rate of 75 g/min and 1.5% sprayed water. The increase in the efficiency of the coating with an increased coating percentage can be due to an increase in the available sites on the surface of the particles, which in turn increases the coating uniformity. The larger particles are expected to have a shorter circulation path in the bed due to their larger mass, and therefore are not carried all the way to the top of the rotary pan. Since these particles may not reach to the top of the pan, they would have a higher chance of exposure to the coating. With an increase in the urea particle size to 3.35 mm, the internal porosity increases, which in turn results in a reduction in the efficiency of the coating [38].
The effect of the particle size and the pan speed on the efficiency of gypsum-sulphur-coated urea is shown in Figure 6. The response surface showing the interaction between the particle size and the pan speed is generated with a constant coating percentage of 20%, a spray flow rate of 75 g/min and 1.5% sprayed water. The results show that an increase in the rotation speed of the pan improves the efficiency of the coating using small particles. However, an optimum point of efficiency is evidently observed for a particle size of 2.80 mm and at a higher rotation speed (i.e., 16 rpm).
Figure 7 shows the combined effects of the spray flow rate and the particle size on the efficiency of the coated urea. It is seen that with an increase in the spray flow rate, the coating efficiency initially increases by 33%. This is however followed by a subsequent drop in the efficiency. The results herein are consistent with those reported by Tzika (2003) where medium spray rates were employed, the produced coatings were considerably denser, and therefore a slower release rate of the fertilizer from the coated granules was observed [39]. For any given particle size between 2.80 mm and 3.35 mm, the efficiency of the coating process improves with an increase in the spray flow rate up to 75 g/min. Any further increase in the spray flow rate up to 100 g/min results in a decrease in the efficiency of the coating process. Figure 8 shows the response surfaces, the combined effects of the coating percentage and the rotational speed of the pan on the efficiency of the coating process for a particle size of 3 mm, a spray flow rate of 75 g/min and 1.5% sprayed water. Figure 8 indicates that with an increase in the coating percentage and the pan speed, the efficiency of the coating process will increase.
The response surface for the combined effect of the coating percentage and the spray flow rate is shown in Figure 9. The response surface was produced with a constant pan speed of 12 rpm, a particle size of 3 mm and 1.5% sprayed water. The results indicate that an increase in the coating percentage enhances the efficiency of the coating process. However, an optimum point for the coating process is clearly observed with a coating percentage of 25 %. For any given coating percentage (15% to 25%), the efficiency of the coating process increases with an increase in the spray flow rate up to 75 g/min. Any further increase in the spray flow rate (<100 g/min) results in a decrease in the efficiency of the coating process. An increase in the flow rate or the overall mixing within the bed will have an adverse impact on the process, translating into a less uniform coating distribution [40]. Tzika (2013) observed that when high spray rates were employed, the coating layer became too porous, leading to an unwanted high release rate of the fertilizer from the coated granules [39]. The interactive effects between the coating percentage and the amount of sprayed water are graphically illustrated in Figure 10. The response surface for this interaction is generated with a constant pan speed of 12 rpm, a particle size of 3 mm and a spray flow rate of 75 g/min. It is seen that an increase in the coating percentage enhances the efficiency of the coated urea. However, an optimum point of coating is seen corresponding to the maximum amount of coating (i.e., 25%). For any given coating percentage (15% to 25%), the efficiency of the coating process is improved with an increase in the amount of water to 1.5%. Any additional increase in the sprayed water to 1.6% results in a drop in the efficiency of the coating process.

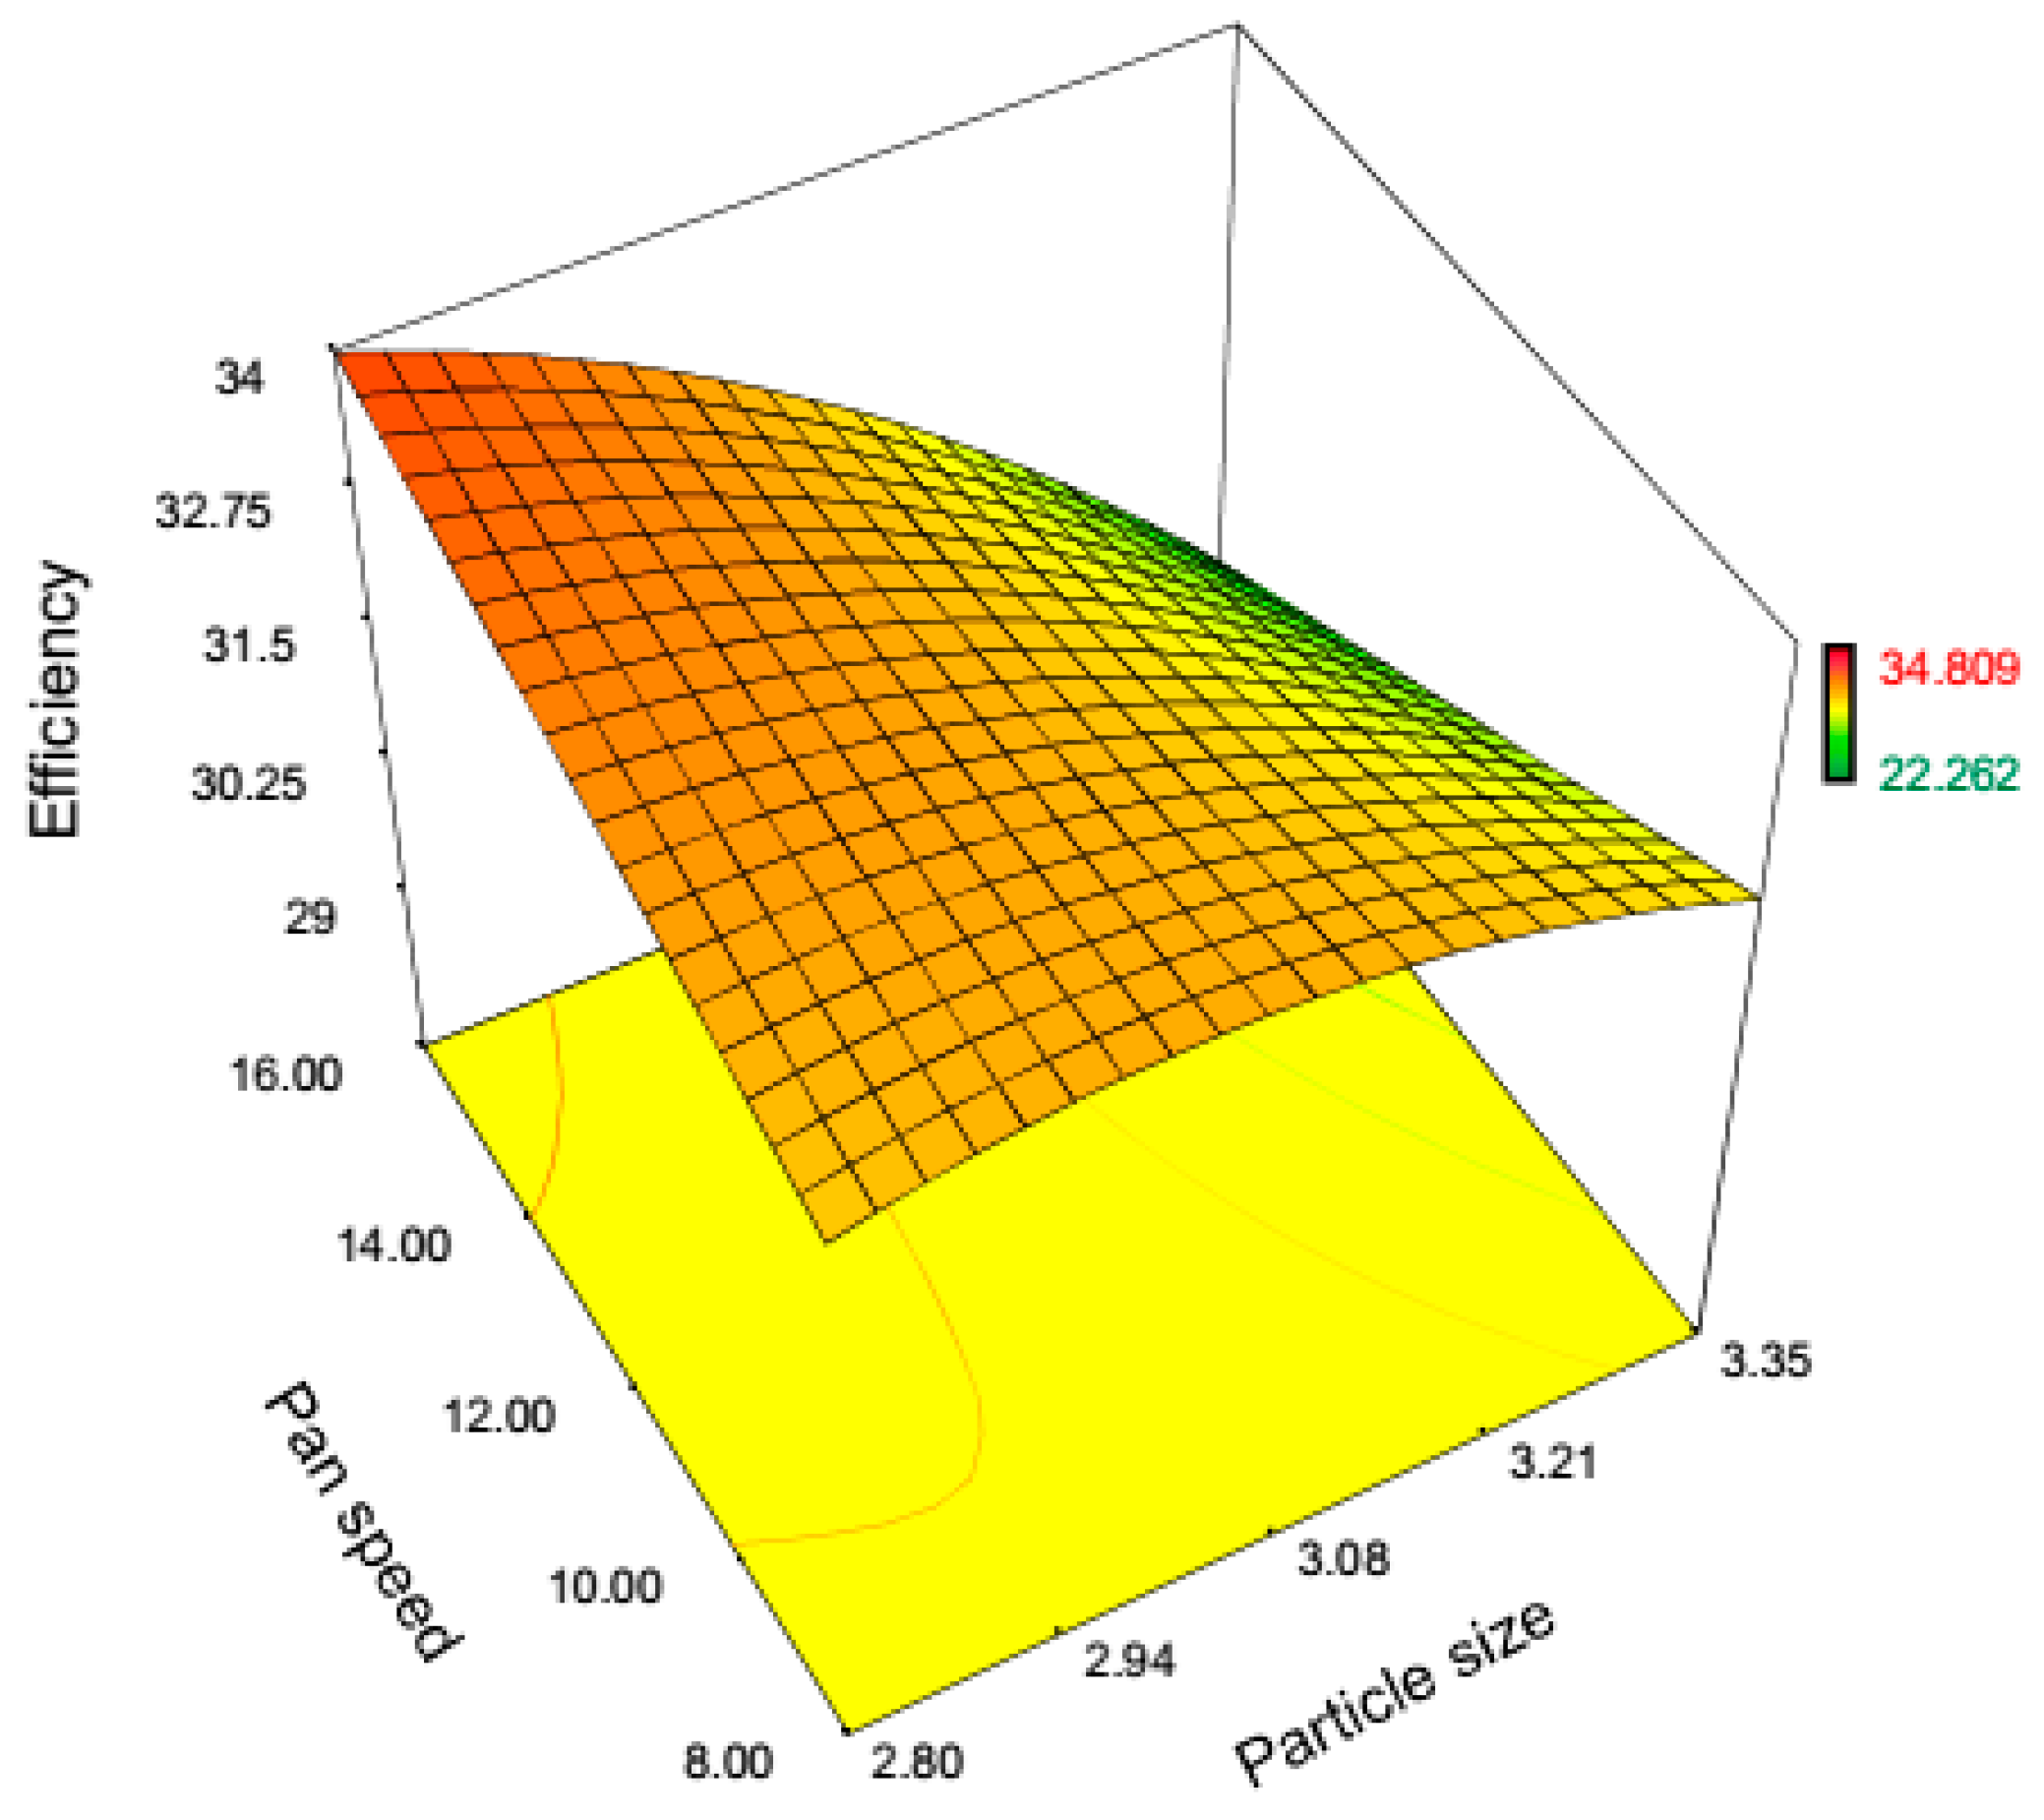
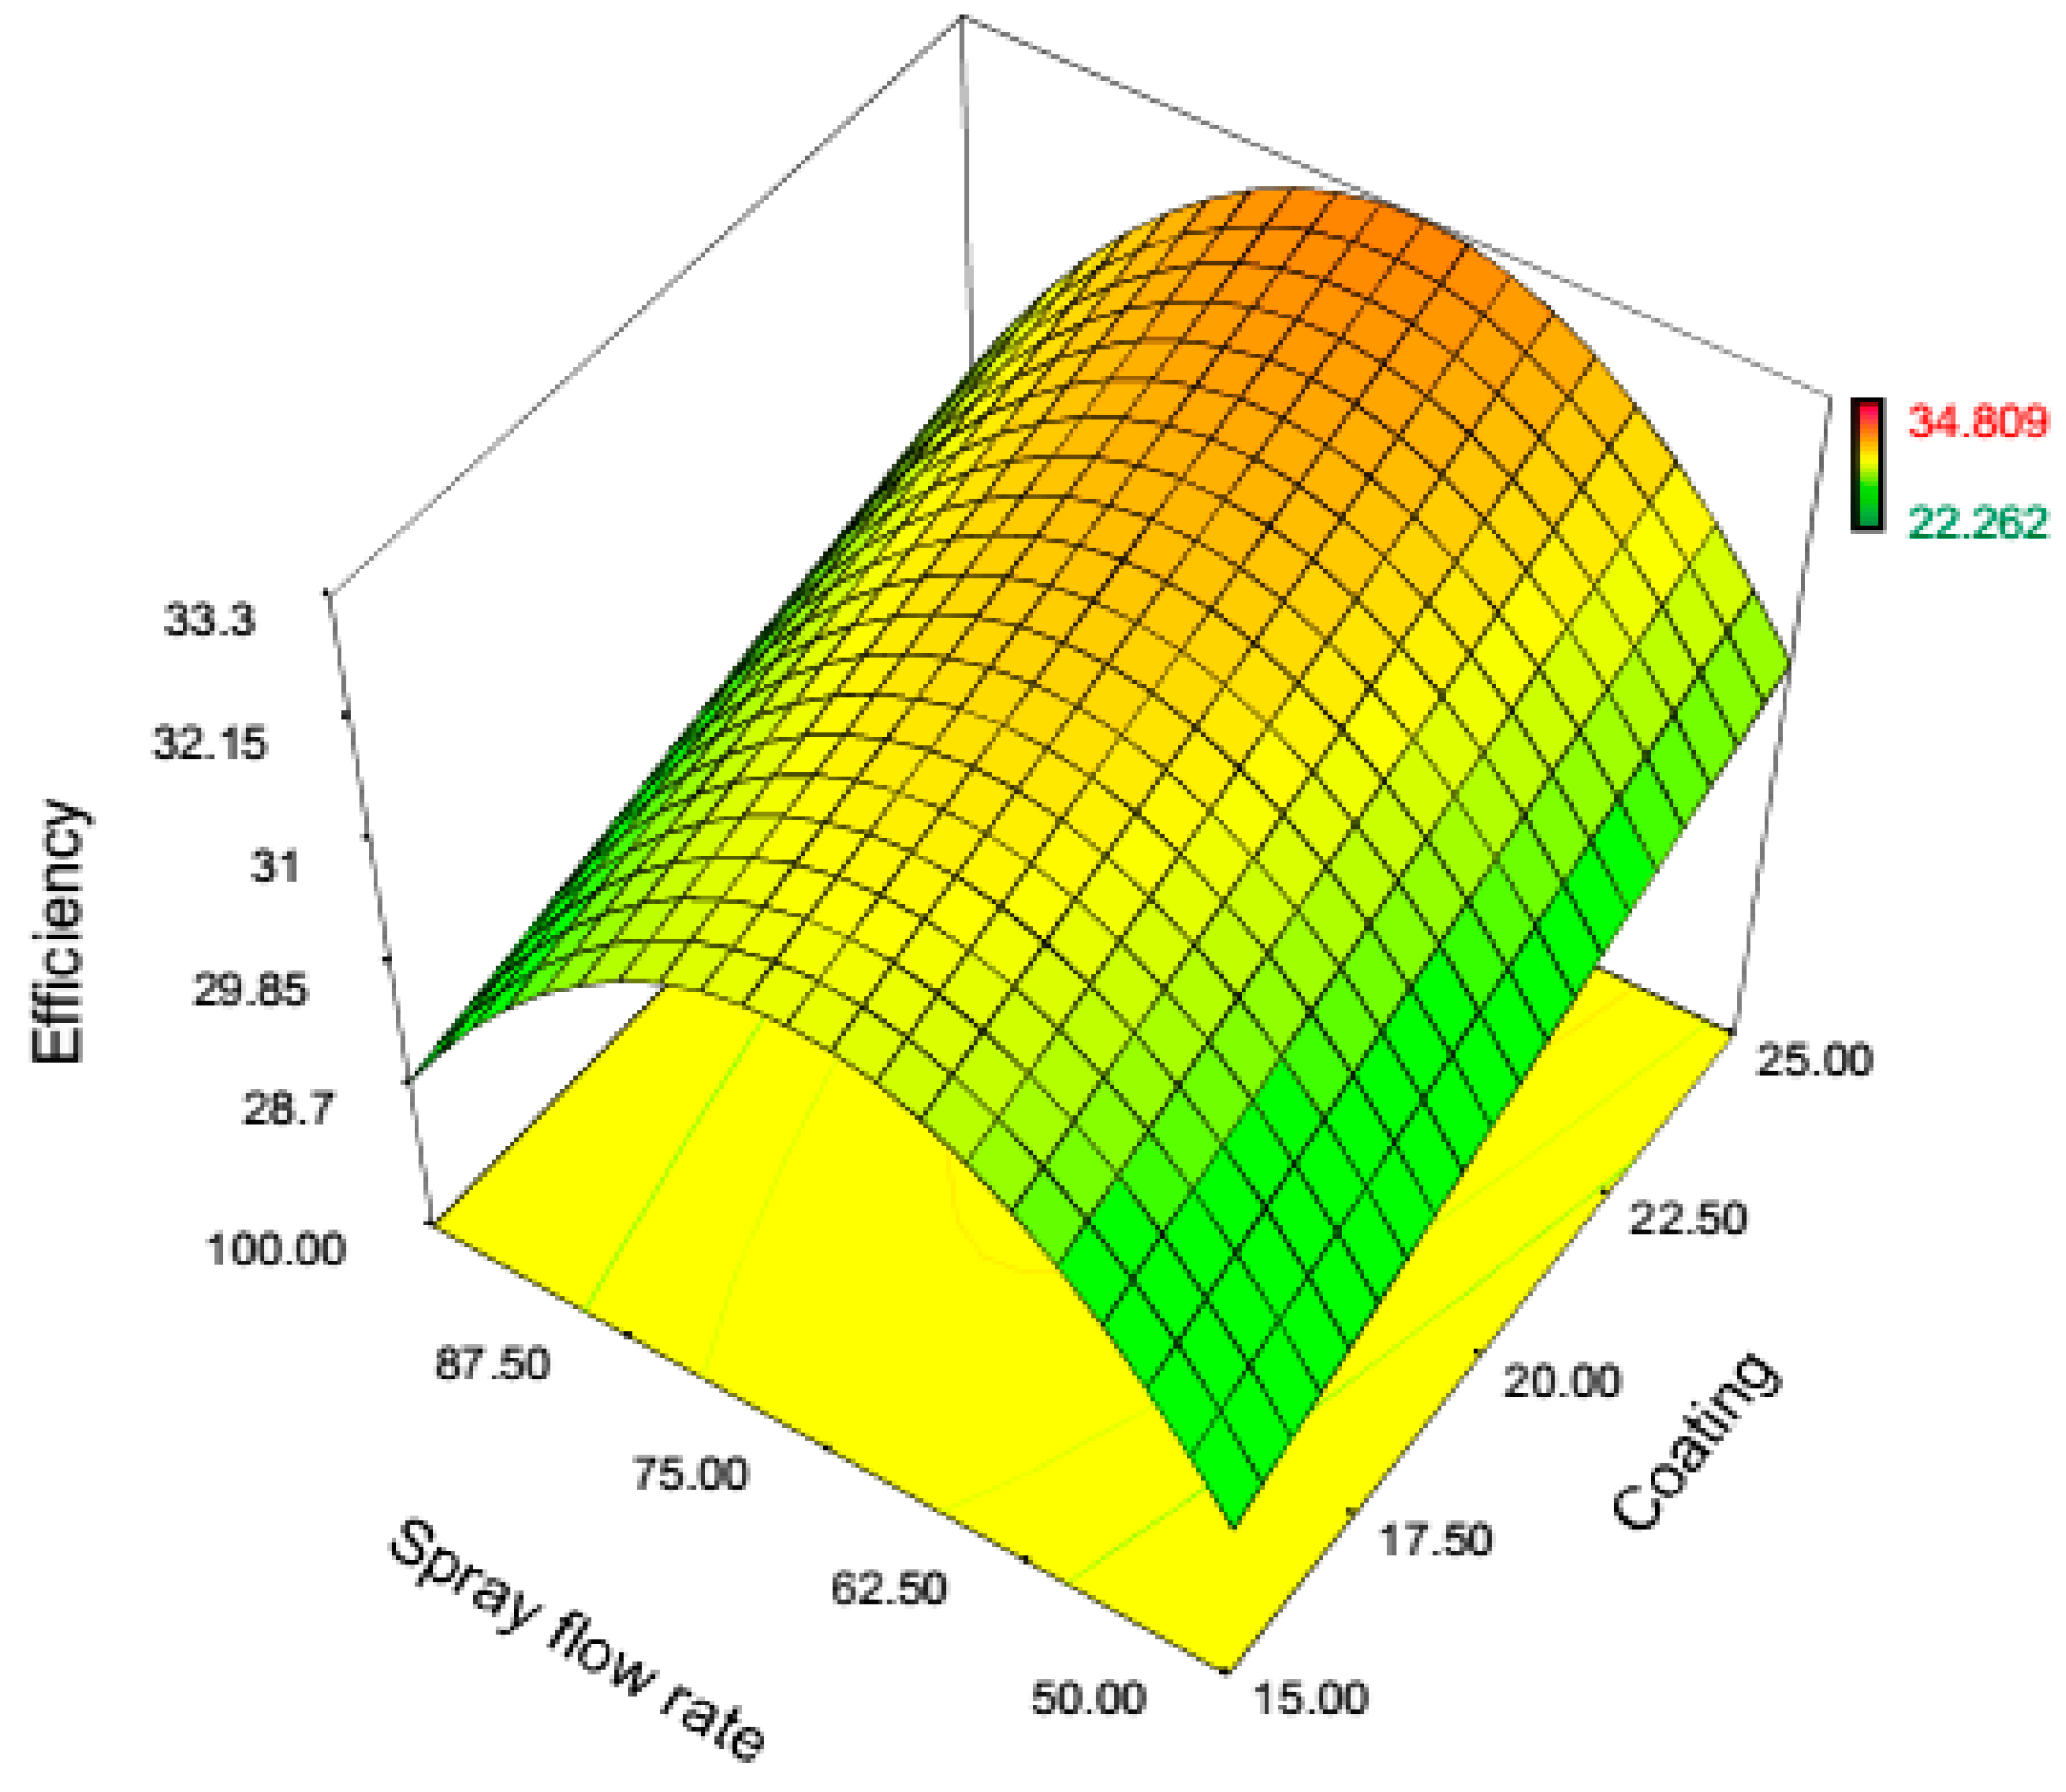
3.4. Response Surface and Process Optimisation

The effects of the five independent variables (i.e., particle size, coating percentage, pan speed, spray flow rate and sprayed water) on the mean predicted values of the efficiency of the coating process are shown in Table 7. For this purpose, RSM with a central composite design (CCD) was employed to pinpoint the optimum process conditions. Controlled experiments were then conducted under these optimum conditions. The experimental datasets were next compared against the model-based predictive values. Based on the generated RSM, the optimum process conditions corresponding to an optimum process performance are found to be: a particle size of 2.80 mm, a coating percentage of 25%, a pan speed of 16 rpm, a spray flow rate of 73.00 g/min and a sprayed water percentage of 1.50%. The coating of the urea demonstrated a reasonable percentage of efficiency (i.e., 34.56%). This verified the predictability of the model with a comparison of the experimental values against the predicted figures (i.e., 35.79%), implying that the RSM-based empirical model can adequately describe the relationship between the independent variables and the target response and therefore, successfully reveal the optimum process conditions.

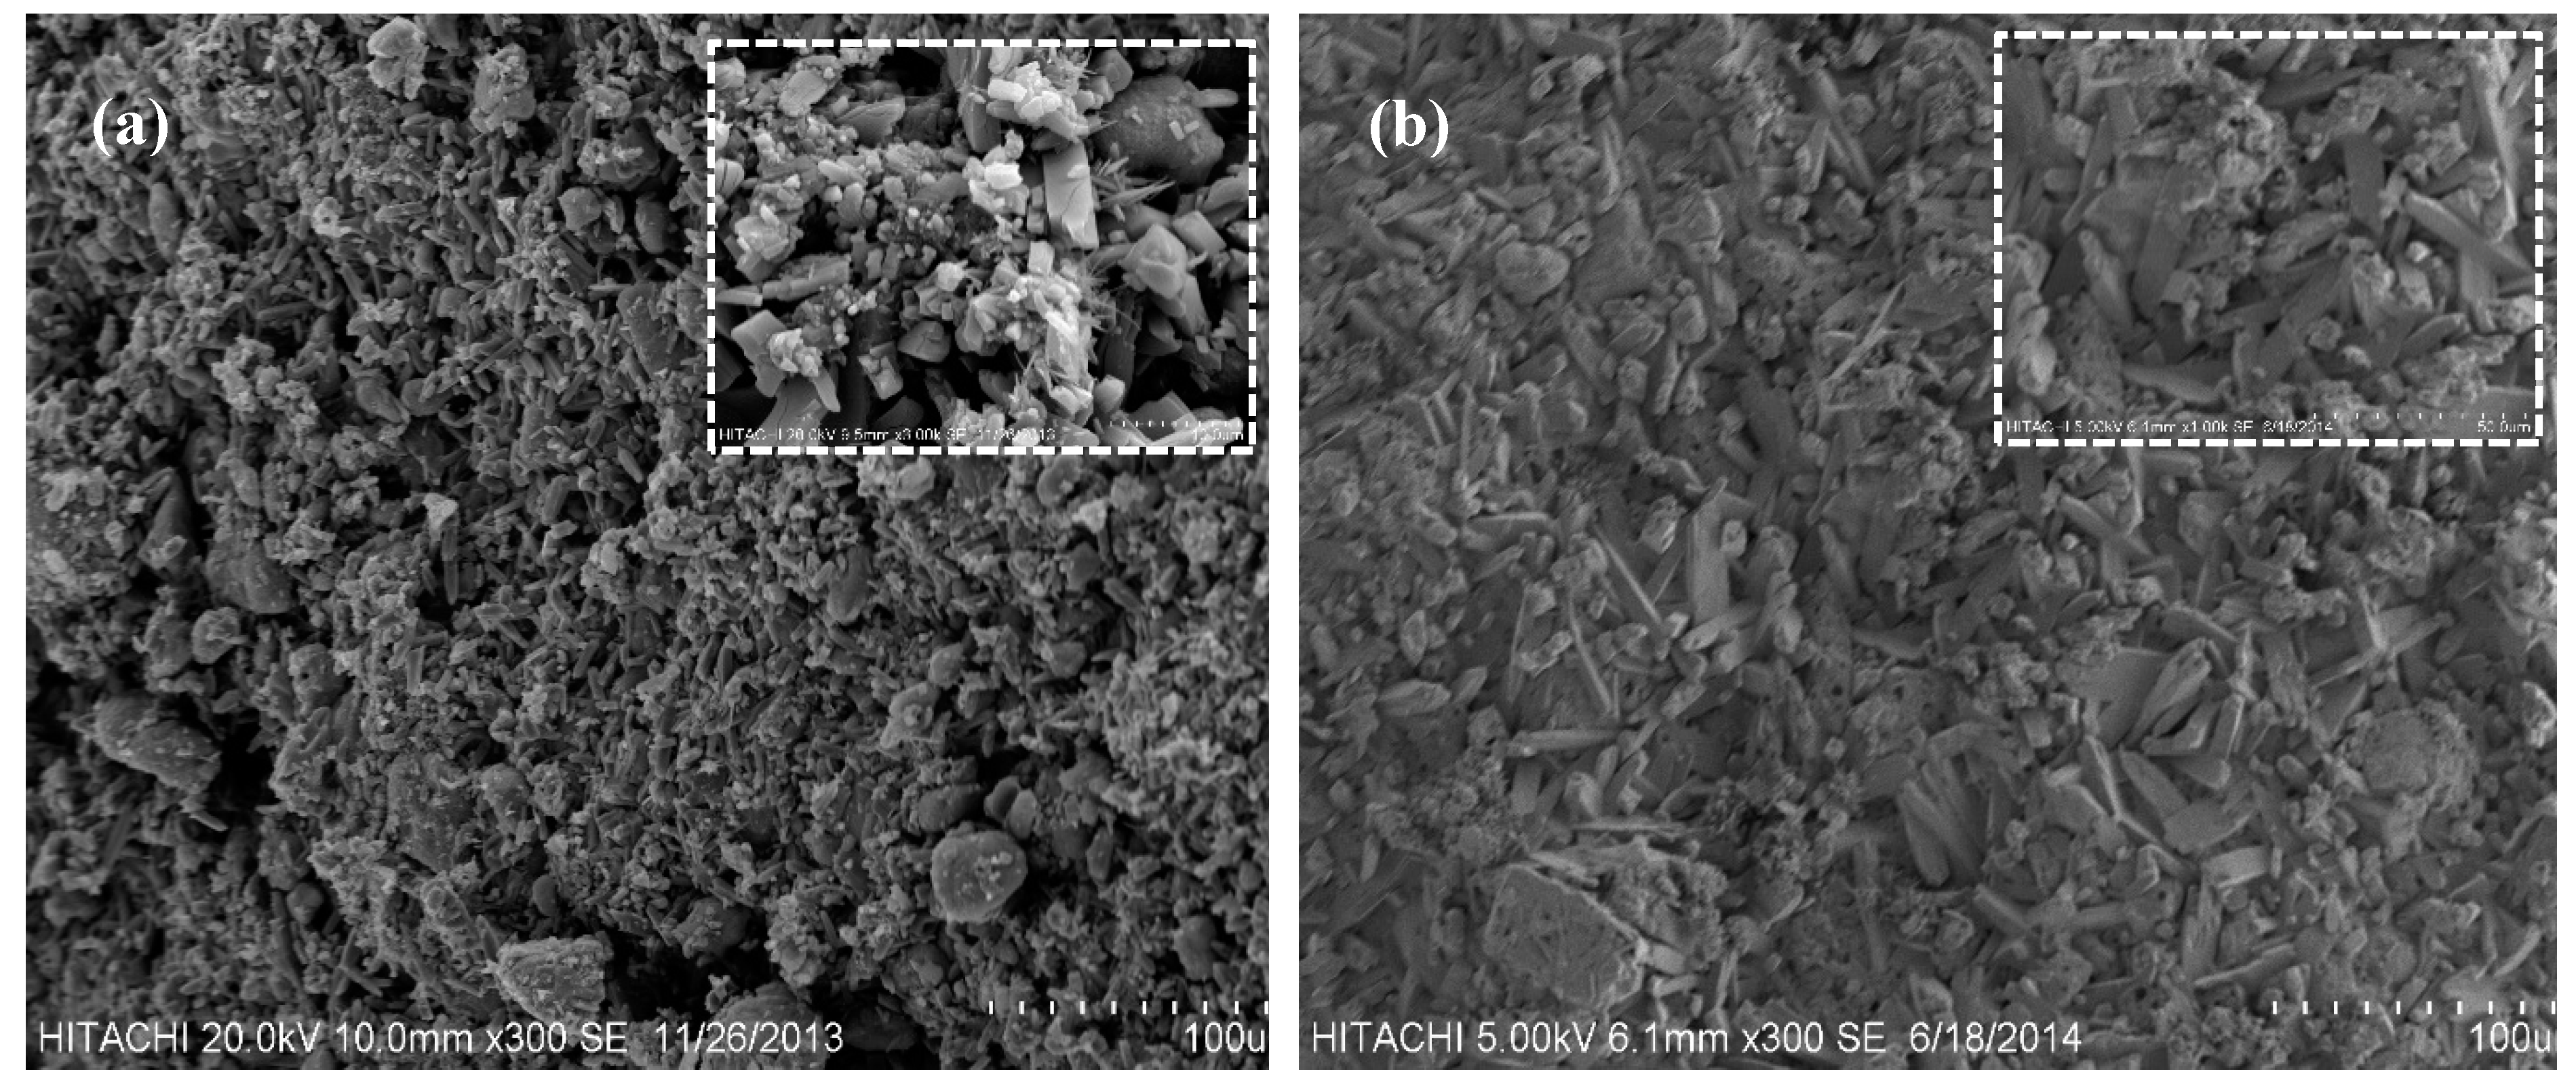
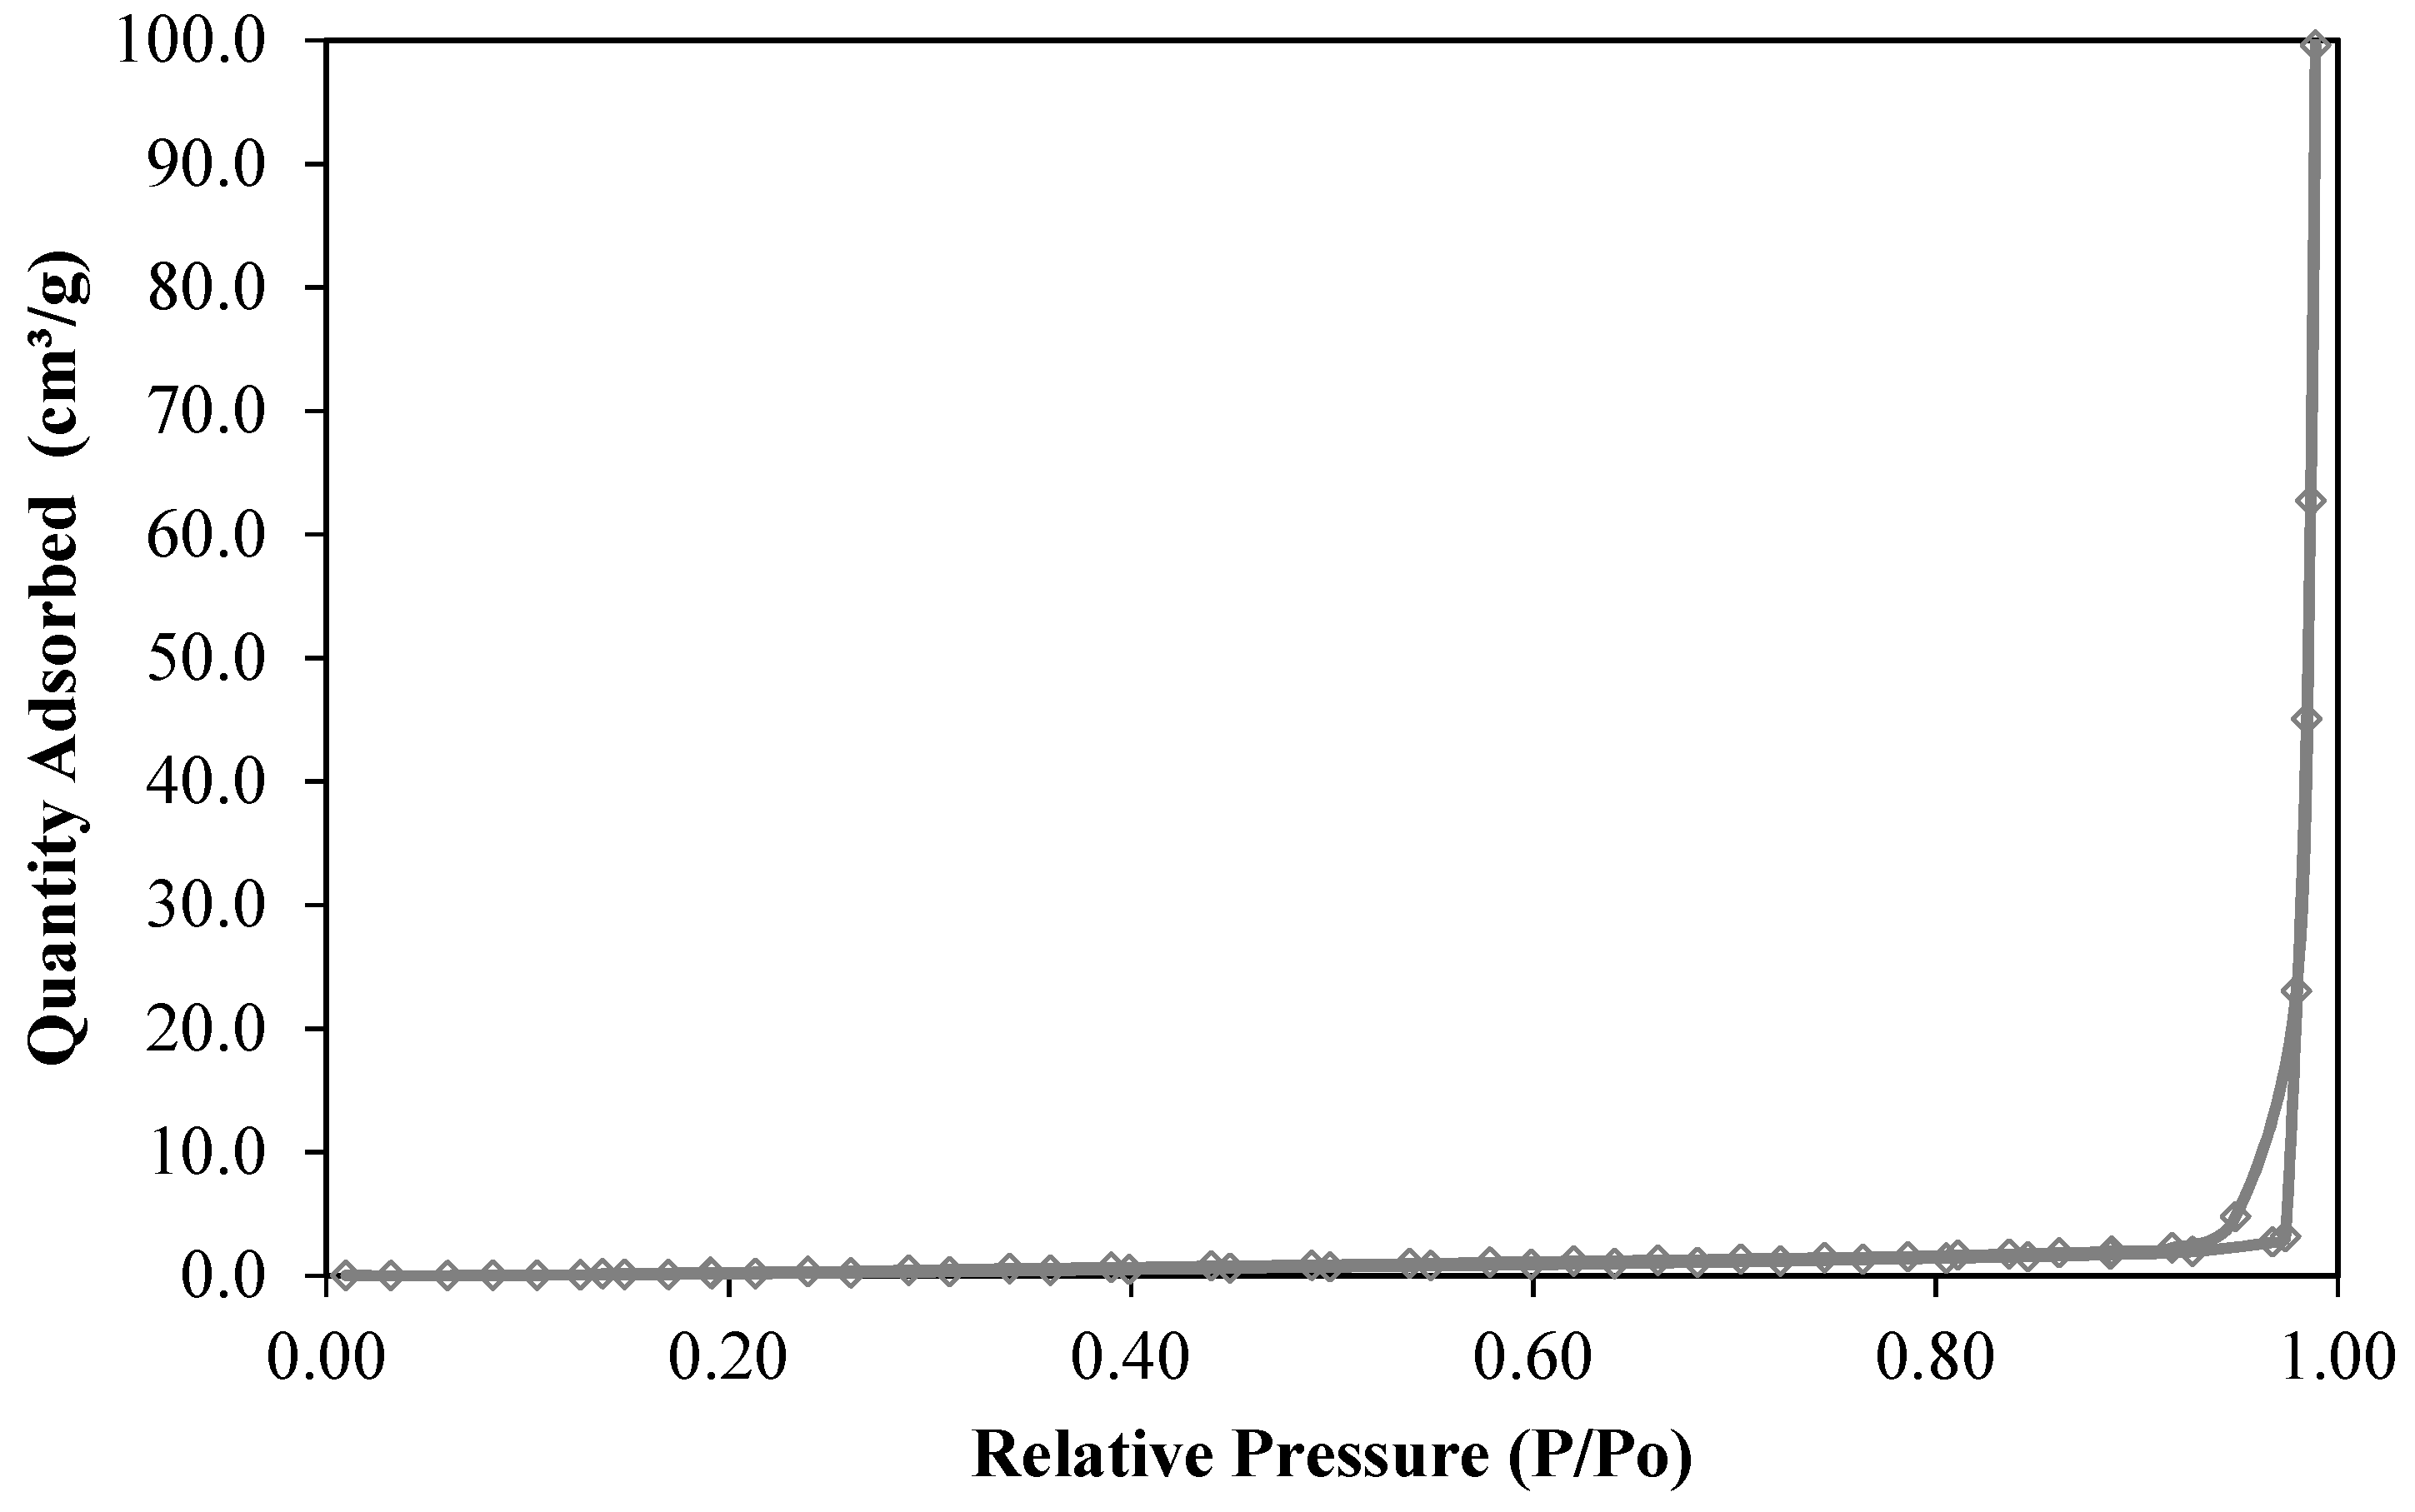
3.5. Structural Properties of the Coated Urea

The surface morphologies of the coated urea (the non-optimum and the optimum samples) are shown in Figure 11a,b, respectively. There is a significant difference in the surface morphologies of the two sample layers. In addition, the surface layers reveal the various states (i.e. the crystalline structure and compactness) for the two samples. It is seen that the porous non-optimum sample possesses a crystalline structure with a significant distribution of rhombic and hexagonal shape crystals. However, the optimum sample reveals a compact surface with a uniform monolithic structure. Ayub et al. (2001) reported a uniform film of sulphur coating forming on urea granules prepared in a spouted bed. As shown in Figure 11a, the gypsum-sulphur coating demonstrates an intact porous structural network. This enables a very fast absorption of water into the matrix of the gypsum-sulphur due to the porosity of the surface. Therefore, the coating facilitates the release of urea into the solvent. The optimization of the coating process led to a reduction in urea release; the coating process was improved by approximately 13% by tuning the particle size, coating percentage, pan speed, spray flow rate and the amount of sprayed water (Figure 11b). By applying the optimized process variables to manufacture the coated urea, a good dispersion of sulphur particles in the gypsum matrix caused a reduction in the number of the microscopic pores, forming a uniform coating layer covering the urea particles.
The study of nitrogen adsorption/desorption isotherms is a standard method to investigate the surface characteristics of adsorbents. During this study, a type III-category isotherm was observed indicating the formation of multi-layered coated urea (optimum coated urea) (Figure 12). The BET surface areas of the three samples (urea, non-optimum coated urea and the optimum coated urea) were measured to be 3.5397 m²/g, 1.8238 m²/g and 1.7048 m²/g, respectively. The surface area of the urea was much larger than that of the coated urea, which corresponds to the high dissolution rate. Figure 13 shows the pore size distribution plot for the three samples (urea, non-optimum coated urea and optimum coated urea). The pore sizes are distributed between 40 nm and 65 nm for both the urea and the coated urea samples. In comparison, the optimum coated sample has a smaller pore volume, indicating a more compact structure associated with the coated urea. This results in a decreased water permeation, and consequently a higher coating efficiency. The total pore volume is calculated based on the single point total pore volume method at a relative pressure of 0.98. Table 8 shows the calculated values for the structural properties of the urea and the coated urea. The optimum coated urea has a smaller total pore volume, resulting in an improved efficiency.

4. Conclusions

Coating processes result in an alteration of the physical properties of the surface of urea, and therefore the efficiency of its application. In this study we successfully improved the efficiency of the manufacturing process of the coated urea. We employed a systematic approach in order to study, identify and evaluate the significant variables together with any hidden interactions that can potentially impact the efficiency of coated urea by employing a central composite DoE. The statistical insights were then used to model the manufacturing process, and therefore facilitate its systematic optimisation. It is realised that the urea particle size has a critical effect on the efficiency of gypsum-sulphur-coated urea. The optimal conditions for the coating process analysed are found to be a particle size of 2.80 mm, a coating percentage of 25%, a pan rotational speed of 16 rpm, a spray flow rate of 53 g/min and a 1.50% sprayed water. The response surface method was used to pinpoint the optimum operating envelope corresponding to an enhanced efficiency of 35%.

Author Contributions

Conceptualization, F.E.B. and R.Y.; methodology, F.E.B.; software, A.A.; validation, F.E.B. and R.Y.; formal analysis, F.E.B.; writing—original draft preparation, F.E.B.; writing—review, interpretation and editing, S.M.S.; supervision, R.Y.; project administration, R.Y.

Funding

This research received no external funding.

Acknowledgements

We would like to thank the research support provided via Rachadapisaek Sompot Fund for Postdoctoral Fellowship, Chulalongkorn University. We would also acknowledge the support by Petroliam Nasional Berhad (PETRONAS) and Universiti Putra Malaysia throughout this research work.

Conflicts of Interest

The authors declare no conflict of interest.

References

  1. Simmons, C.L.; Cole, R.D. Sulfur coating of urea containing gelling clays. US Patent H1085, 8 April 1992. [Google Scholar]
  2. Blouin, G.M. Production of high-strength, storage-stable particulate urea. US Patent 4587358, 6 May 1986. [Google Scholar]
  3. Gullett, L.L.; Simmons, C.L. Sulfur-coated urea. US Patent 4676821, 30 June 1987. [Google Scholar]
  4. Savant, N.K.; Stangel, P.J. Deep placement of urea super granules in transplanted rice: Principles and practices. Fertil. Res. 1990, 25, 1–83. [Google Scholar] [CrossRef]
  5. Roy, B. Coated and modified urea materials for increasing nitrogen use efficiency of lowland rice in heavy clay soils. Fertil. Res. 1988, 15, 101–109. [Google Scholar] [CrossRef]
  6. Malhi, S.S.; Oliver, E.; Mayerle, G.; Kruger, G.; Gill, K.S. Improving effectiveness of seedrow-placed urea with urease inhibitor and polymer coating for durum wheat and canola. Comm. Soil Sci. Plant. Anal. 2003, 34, 1709–1727. [Google Scholar] [CrossRef]
  7. Junejo, N.; Khanif, M.Y.; Hanfi, M.M.; Wan, Z.W.Y.; Dharejo, K.A. Maize response to biodegradable polymer and urease inhibitor coated urea. Int. J. Agric. Biol. 2010, 12, 773–776. [Google Scholar]
  8. Salman, O.A. Polymer coating on urea prills to reduce dissolution rate. J. Agric. Food Chem. 1988, 36, 616–621. [Google Scholar] [CrossRef]
  9. Wei, Y.; Li, J.; Li, Y.; Zhao, B.; Zhang, L.; Yang, X.; Chang, J. Research on permeability coefficient of a polyethylene controlledrelease film coating for urea and relevant nutrient release pathways. Polym. Test. 2017, 59, 90–98. [Google Scholar] [CrossRef]
  10. Cahill, S.; Osmond, D.; Israel, D. Nitrogen release from coated urea fertilizers in different soils. Commun. Soil Sci. Plant Anal. 2010, 41, 1245–1256. [Google Scholar] [CrossRef]
  11. Bouranis, D.L.; Gasparatos, D.; Zechmann, B.; Bouranis, L.D.; Chorianopoulou, S.N. The Effect of Granular Commercial Fertilizers Containing Elemental Sulfur on Wheat Yield under Mediterranean Conditions. Plants 2019, 8, 2. [Google Scholar] [CrossRef] [PubMed]
  12. Blouin, G.M.; Rindt, D.W. Sulfur-coated fertilizer pellet having controlled dissolution rate and inhibited against microbial decomposition. US Patent 3342577, 19 September 1967. [Google Scholar]
  13. Rindt, D.W.; Blouin, G.M.; Getsinger, J.G. Sulfur coating on nitrogen fertilizer to reduce dissolution rate. J. Agric. Food Chem. 1968, 16, 773–778. [Google Scholar] [CrossRef]
  14. Blouin, G.M.; Rindt, D.W.; Moore, O.E. Sulfur-coated fertilizers for controlled release. Pilot-plant production. J. Agric. Food Chem. 1971, 19, 801–808. [Google Scholar] [CrossRef]
  15. Shirley, A.R.; Meline, R.S. Production of slow release nitrogen fertilizers by improved method of coating urea with sulfur. US Patent 3903333A, 2 September 1975. [Google Scholar]
  16. Meisen, A.; Mathur, K.B. Production of sulphur-coated urea by the spouted bed process. In Proceedings of the British Sulfur Corporation-Part I, London, UK, 3–6 December 1978; p. XTV-2. [Google Scholar]
  17. Salman, O.A.; Hovakeemian, G.; Khraishi, N. Polyethylene-coated urea. 2. Urea release as affected by coating material, soil type and temperature. Ind. Eng. Chem. Res. 1989, 28, 633–638. [Google Scholar] [CrossRef]
  18. Gullett, L.L.; Simmons, C.L.; Lee, R.G. Sulfur coating of urea treated with attapulgite clay. Fertil. Res. 1991, 28, 123–128. [Google Scholar] [CrossRef]
  19. Goertz, H.M.; Timmons, R.J.; McVey, G.R. Sulfur coated fertilizers and process for the preparation thereof. US Patent 5219465, 15 June 1993. [Google Scholar]
  20. Choi, M.; Meisen, A. Sulfur coating of urea in shallow spouted beds. Chem. Eng. Sci. 1997, 52, 1073–1086. [Google Scholar] [CrossRef]
  21. Ayub, G.S.E.; Rocha, S.C.S.; Perrucci, A.L.I. Analysis of the Surface Quality of Sulphur- Coated Urea Particles in a Two-Dimensional Spouted Bed. Braz. J. Chem. Eng. 2001, 18, 13–22. [Google Scholar] [CrossRef]
  22. Donida, M.; Rocha, S.C.S. Coating of urea with an aqueous polymeric suspension in a two-dimensional spouted bed. Drying Technol. 2002, 20, 37–41. [Google Scholar] [CrossRef]
  23. Liu, Y.; Wang, T.-J.; Qin, L.; Jin, Y. Urea particle coating for controlled release by using DCPD modified sulfur. Powder Technol. 2008, 183, 88–93. [Google Scholar] [CrossRef]
  24. da Rosa, G.S.; dos Santos Rocha, S.C. Effect of process conditions on particle growth for spouted bed coating of urea. Chem. Eng. Process. 2010, 49, 836–842. [Google Scholar] [CrossRef]
  25. Mulder, W.J.; Gosselink, R.J.; Vingerhoeds, M.H.; Harmsen, P.F.H.; Eastham, D. Lignin based controlled release coating. Ind. Crops Prod. 2011, 34, 915–920. [Google Scholar] [CrossRef]
  26. Lan, R.; Liu, Y.; Wang, G.; Wang, T.K.; Kan, C.; Jin, Y. Experimental modeling of polymer latex spray coating for producing controlled-release urea. Particuology 2011, 9, 510–516. [Google Scholar] [CrossRef]
  27. Qin, S.; Wu, Z.; Rasool, A.; Li, C. Synthesis and characterization of slow-release nitrogen fertilizer with water absorbency: Based on poly(acrylic acid-acrylic amide)/Na-bentonite. J. Appl. Polym. Sci. 2012, 126, 1687–1697. [Google Scholar] [CrossRef]
  28. Pursell, T.; Shirley, A.R.; Cochran, K.D.; Miller, J.M.; Holt, T.G.; Peeden, G.S. Controlled Release Fertilizer with Biopolymer Coating and Process for Making Same. US Patent 9266787 B2, 23 February 2016. [Google Scholar]
  29. Guo, Y.; Zhang, M.; Liu, Z.; Tian, X.; Zhang, S.; Zhao, C.; Lu, H. Modeling and Optimizing the Synthesis of Urea-formaldehyde Fertilizers and Analyses of Factors Affecting these Processes. Sci. Rep. 2018, 8, 4504. [Google Scholar] [CrossRef] [PubMed]
  30. Bah, A.R.; Rahman, Z.A. Evaluating urea fertilizer formulations for oil palm seedlings using the 15N isotope dilution technique. J. Oil Palm Res. 2004, 16, 72–77. [Google Scholar]
  31. Weisany, W.; Raei, Y.; Haji Allahverdipoor, K. Role of Some of Mineral Nutrients in Biological Nitrogen Fixation. Bull. Env. Pharmacol. Life Sci. 2013, 2, 77–84. [Google Scholar]
  32. Eghbali Babadi, F.; Yunus, R.; Abdul Rashid, S.; Mohd Salleh, M.A.; Ali, S. New coating formulation for the slow release of urea using a mixture of gypsum and dolomitic limestone. Particuology 2015, 23, 62–67. [Google Scholar] [CrossRef]
  33. George, D.; Mallery, M. SPSS for Windows Step by Step: A Simple Guide and Reference, 10th ed.; 17.0 update; Allyn & Bacon: Boston, MA, USA, 2009; pp. 1–400. [Google Scholar]
  34. Traub, R.E.; Rowley, G.L. An NCME instructional module on understanding reliability. Educ. Meas. 1991, 10, 37–45. [Google Scholar] [CrossRef]
  35. Nathans, L.L.; Oswald, F.L.; Nimon, K. Interpreting multiple linear regression: A guidebook of variable importance. Pract. Assess. Res. Eval. 2012, 17, 1–19. [Google Scholar]
  36. Sahni, E.; Chaudhuri, B. Experiments and numerical modeling to estimate the coating variability in a pan coater. Int. J. Pharm. 2011, 418, 286–296. [Google Scholar] [CrossRef] [PubMed]
  37. Obara, S.; McGinity, J.W. Influence of processing variables on the properties of free films prepared from aqueous polymeric dispersions by a spray technique. Int. J. Pharm. 1995, 126, 1–10. [Google Scholar] [CrossRef]
  38. Marple, B.R.; Hyland, M.M.; Lau, Y.C.; Li, C.J.; Lima, R.S.; Montavon, G. Thermal Spray 2007: Global Coating Solutions. In Proceedings of the 2007 International Thermal Spray Conference, Beijing, China, 14–16 May 2007. [Google Scholar]
  39. Tzika, M.; Alexandridou, S.; Kiparissides, C. Evaluation of the morphological and release characteristics of coated fertilizer granules produced in a Wurster fluidized bed. Powder Technol. 2003, 132, 16–24. [Google Scholar] [CrossRef]
  40. Wong, P.M.; Chan, L.W.; Heng, P.W.S. Investigation on side-spray fluidized bed granulation with swirling airflow. AAPS PharmSciTech. 2013, 14, 211–221. [Google Scholar] [CrossRef] [PubMed]
Figure 1. Particle size distribution of urea.
Processes 07 00125 g001
Figure 2. A schematic of coating process in rotary pan. (F: Water Filter; V: Valve; T: Water Tank; P: Pump; p: Pressure gauge; S: Solenoid valve; N: Spray nozzle; R: Rotary pan; H: Hopper; FL: Flow meter; AF: Air Fan).
Processes 07 00125 g002
Figure 3. Normal test plot for efficiency of gypsum-sulphur coated urea; N: Number of Run
Processes 07 00125 g003
Figure 4. Scatter plot of predicted efficiency% value versus the actual efficiency% value from central composite design for gypsum-sulphur coated urea.
Processes 07 00125 g004
Figure 5. Response surface plot demonstrating the effect of particle size (mm) and coating percentage (%) (X1X2) on the efficiency of coating.
Processes 07 00125 g005
Figure 6. Response surface plot demonstrating the effect of particle size (mm) and pan speed (rpm) (X1X3) on the efficiency of coating.
Processes 07 00125 g006
Figure 7. Response surface plot demonstrating the effect of particle size (mm) and spray flow rate (g/min) (X1X4) on the efficiency of coating.
Processes 07 00125 g007
Figure 8. Response surface plot demonstrating the effect of coating percentage (%) and pan speed (rpm) (X2X3) on the efficiency of coating.
Processes 07 00125 g008
Figure 9. Response surface plot demonstrating the effect of coating percentage (%) and spray flow rate (g/min) (X2X4) on the efficiency of coating.
Processes 07 00125 g009
Figure 10. Response surface plot demonstrating the effect of coating percentage (%) and spray water (%) (X2X5) on the efficiency of coating.
Processes 07 00125 g010
Figure 11. SEM analysis of the (a) non-optimum and (b) optimum coated urea.
Processes 07 00125 g011
Figure 12. Nitrogen adsorption–desorption isotherm of the optimum coated urea.
Processes 07 00125 g012
Figure 13. Pore size distribution graphs of the urea and the coated urea (NLDFT model with nitrogen at 77 K).
Processes 07 00125 g013
Table 1. Variables and their levels employed in the central composite design.
VariablesUnitsCoded Level of Variables
−10+1
Particle size (X1)mm2.803.103.35
Coating percentage (X2)%152025
Pan speed (X3)rpm81216
Spray flow rate (X4)g/min5075100
Spray water (X5)%1.41.51.6
Table 2. Descriptive statistics to check the skewness and kurtosis values for five variables.
Descriptive Statistics Particle Size (mm)Coating (%)Pan Speed (rpm)Spray Flow Rate (g/min)Spray Water (%)
−10+1−10+1−10+1−10+1−10+1
Skewness−0.447−0.740−0.059−0.638−0.7790.4290.150−1.108−0.226−0.601−0.7800.194−0.365−0.780−0.128
Kurtosis0.1773.902−0.8190.5562.571−1.278−1.1234.020−0.269−0.0152.584−0.079−0.2382.584−0.091
Table 3. Central composite design matrix (coded), the actual and the predicted values of the model describing the efficiency for the gypsum-sulphur coated urea.
RunX1X2X3X4X5Efficiency %
ActualPredicted
12.8158501.427.27127.014
23.35158501.426.15526.628
32.8258501.428.26828.998
43.35258501.428.10128.351
52.81516501.427.47927.292
63.351516501.422.53622.575
72.82516501.432.03631.930
83.352516501.427.23526.951
92.81581001.426.57326.678
103.351581001.426.95326.781
112.82581001.428.97328.654
123.352581001.427.07327.081
132.815161001.427.32426.956
143.3515161001.422.26222.727
152.825161001.432.47831.585
163.3525161001.425.13625.681
172.8158501.628.32728.408
183.35158501.628.18728.023
192.8258501.629.13628.288
203.35258501.627.52327.642
212.81516501.628.47728.687
223.351516501.624.51023.970
232.82516501.631.23331.220
243.352516501.626.60026.241
252.81581001.628.10228.073
263.351581001.628.65128.175
272.82581001.627.89327.944
283.352581001.626.96926.371
292.815161001.627.98828.351
303.3515161001.623.90324.122
312.825161001.629.72530.875
323.3525161001.624.97424.971
332.82012751.532.84333.175
343.352012751.529.90930.384
353.081512751.531.16331.503
363.082512751.532.60133.273
373.08208751.531.51732.669
383.082016751.532.23832.108
393.082012501.529.03629.891
403.0820121001.529.48929.441
413.082012751.430.60330.573
423.082012751.630.08030.916
433.082012751.533.60132.388
443.082012751.531.27632.388
453.082012751.532.04332.388
463.082012751.534.80932.388
473.082012751.532.89432.388
483.082012751.533.35232.388
X1= particle size (mm), X2= coating percentage (%), X3= pan speed (rpm), X4= spray flow rate (g/min) and X5= spray water (%).
Table 4. Model summary statistics.
SourceStandard DeviationR-SquaredAdjusted R-SquaredPredictedPRESS *Remarks
R-Squared
Linear2.680.24620.15650.0686371.66-
2FI2.710.41170.13590.0854433.09-
Quadratic0.810.95520.92200.894242.21Suggested
Cubic1.050.96710.87110.3186125.14Aliased
* PRESS is Predicted Residual Error of Sum of Squares.
Table 5. Analysis of Variance (ANOVA) and R-Squared of gypsum-sulphur coated urea.
SourceSum of SquaresDegree of FreedomMean SquareF Valuep-Value
Model379.561525.3041.58<0.0001 a
Residual19.47320.61--
Lack of fit11.82270.440.290.9855 b
Pure error7.6651.53--
Corrected total399.0347---
R-Squared0.9512Standard Deviation0.78
Adjusted R20.9283Coefficient of variation %2.70
Adequate Precision23.753PRESS 35.22
a Model F-value is significant at “Prob > F” less than 0.05. b Lack of Fit value is not significant relative to pure error.
Table 6. Analysis of variance (ANOVA) and the regression coefficients of gypsum-sulphur coated urea.
SourceCoefficient EstimateSum of SquaresDegree of FreedomMean SquareF Valuep-Value Prob > F
Intercept32.39-1---
X11.4066.23166.23108.84< 0.0001
X20.8926.63126.6343.77< 0.0001
X3−0.282.6812.684.400.0440
X4−0.221.7211.722.820.1027
X50.171.0011.001.640.2097
X1 X2−0.241.8811.883.080.0887
X1 X3−1.0837.53137.5361.67< 0.0001
X1 X4−0.050.1010.100.160.6938
X2 X30.6614.08114.0823.13< 0.0001
X2 X4−0.181.0211.021.680.2037
X2 X5−0.538.8618.8614.560.0006
X12−0.611.0711.071.760.1943
X42−2.7221.40121.4035.17< 0.0001
X52−1.647.8017.8012.820.0011
X1 X2 X4−0.181.0011.001.640.2094
X1 = particle size (mm), X2 = coating percentage (%), X3 = pan speed (rpm), X4 = spray flow rate (g/min) and X5 = spray water (%).
Table 7. Optimum condition derived by the RSM for the gypsum-sulphur coated urea.
Optimal conditionEfficiency %
X1X2X3X4X5ActualPredictedRelative Deviation
2.8025.0016.0073.001.5034.5635.793.44
X1 = particle size (mm), X2 = coating percentage (%), X3 = pan speed (rpm), X4 = spray flow rate (g/min) and X5 = spray water (%).
Table 8. Structural properties of the urea and the optimum coated urea.
SampleTotal Surface Area (m2/g)Total Pore Volume (cm³/g)Average Pore Diameter (nm)
Urea3.53970.17314657.4
Non-optimum coated urea1.82380.16245058.2
Optimum coated urea1.70480.14739153.7

