Article

Degradation of Aqueous Polycyclic Musk Tonalide by Ultraviolet-Activated Free Chlorine

1
Environmental Engineering, Jiyang College of Zhejiang A & F University, Zhuji 311800, China
2
Institute of Water Resources & Ocean Engineering, Ocean College, Zhejiang University, Hangzhou 310058, China
3
Institute of Municipal Engineering, College of Civil Engineering and Architecture, Zhejiang University, Hangzhou 310058, China
*
Authors to whom correspondence should be addressed.
Processes 2019, 7(2), 95; https://doi.org/10.3390/pr7020095
Submission received: 6 December 2018 / Revised: 31 January 2019 / Accepted: 7 February 2019 / Published: 14 February 2019
(This article belongs to the Special Issue Application of Advanced Oxidation Processes)

Abstract

:
Chlorine-incorporating ultraviolet (UV) provides a multiple barrier for drinking water disinfection. Meanwhile, post-UV employment can promote the degradation of micropollutants by radical production from chlorine residual photolysis. This work studied the degradation of one such chemical, tonalide (AHTN), by low-pressure UV-activated free chlorine (FC) under typical UV disinfection dosage of <200 mJ·cm−2 and water matrix of filtered tank effluent. AHTN was rapidly degraded by UV/FC in accordance with pseudo-first-order kinetics. The reaction rate constants of AHTN with reactive chlorine species and hydroxyl radical (HO•) were estimated. Mechanistic exploration evidenced that under UV/FC, AHTN degradation was attributable to direct photolysis, ClO•, and HO•. The carbonyl side chain of AHTN served as an important attack site for radicals. Water matrices, such as natural organic matter (NOM), HCO 3 , Cu 2 + , PO 4 3 , and Fe 2 + , showed noticeable influence on the UV/FC process with an order of NOM > HCO 3 > Cu 2 + > PO 4 3 > Fe 2 + . Reaction product analysis showed ignorable formation of chlorinated intermediates and disinfection byproducts.

1. Introduction

Polycyclic musks (PCMs), as fragrance ingredients, have been extensively used in cosmetics, household cleaning products, and personal care products. Typical PCMs include tonalide (AHTN) and galaxolide (HHCB), which currently compose 85% of the total produced synthetic musk. These chemicals exist in various media, such as drinking water sources, owing to their hydrophobic characteristics, poor biodegradability, and frequent use. The adverse environmental effects of AHTN and HHCB on organisms have been reported [1,2,3]. Thus, AHTN and HHCB can pose a challenge to the health of consumers if they cannot be effectively intercepted by drinking water treatment processes (DWTPs). Such trepidation was confirmed by the survey of Stackelber et al. [4], who reported that typical DWTP through clarification, granular-activated-carbon filtration, and chlorine disinfection failed to comprehensively remove AHTN (~71.4%). Other studies have attempted to use chemical oxidation methods, such as ozonation and ferrate (VI) oxidation, to degrade AHTN; nonetheless, unsatisfied degradation was observed [5,6]. Similarly, ultrafiltration showed poor rejection of aqueous AHTN [7]. UV photolysis was proven efficient to remove AHTN and HHCB; however, considerable degradation intermediates with remarkable similarities to the structure of parent molecules were generated [8]. Therefore, additional efforts to control PCMs in potable water may be needed.
Advanced oxidation processes (AOPs) are effective methods for degrading and detoxifying aqueous contaminants by maximizing highly reactive radicals [9,10]. Combining medium-pressure UV with H2O2, a kind of AOP, was reported to show desirable degradation efficiency toward PCMs [11]. This hydroxyl radical (HO•)-dominated process showed a rate constant of 1.58 min−1 for HHCB degradation. The UV irradiation of free chlorine (UV/FC), as a novel AOP, has demonstrated its effectiveness in the attenuation of specific personal care products, taste and odor compounds, and antibiotics [9]. This process achieves contaminant degradation by three possible pathways: (1) direct reaction with FC, (2) direct photolysis, and (3) transformation mediated by radicals, such as HO• and/or reactive chlorine species (RCS, Cl•, Cl 2 , and ClO•). Nonetheless, no other studies reported using UV/FC to degrade PCMs. Moreover, possible factors that may affect the degradation efficiency (i.e., pH, cations, and natural organic matter (NOM)) have not been investigated thus far.
In the current study, we aimed to (1) investigate the degradation efficiencies of AHTN by UV/FC; (2) to identify the primary contributor responsible for AHTN degradation and intermediate formation; (3) to obtain information on the toxicity profile accompanied by AHTN degradation; and (4) to evaluate the influence of relevant parameters of water-plant treated water, namely, NOM; common anions ( Cl , NO 3 , SO 4 2 , PO 4 3 , and HCO 3 ); and cations ( Ca 2 + , Fe 3 + , Fe 2 + , Mn 2 + , Zn 2 + , and Cu 2 + ). Distinguished from the high UV and chlorine doses delivered (>200 mJ·cm−2 for UV-C dosage; 5–10 mg·L−1 for chlorine dosage) in previous works [12,13,14], low chlorine concentration (<4.0 mg·L−1 as FC) and typical UV doses (product of fluence rate and exposure time, 40–100 mJ·cm−2 [15]) were adopted herein. AHTN was more retainable in potable water than HHCB, and thus, it was selected as the model compound to test the degradation characteristics of PCMs by UV/FC.

2. Materials and Methods

2.1. Materials

High purity AHTN, nitrobenzene (NB), 5,5-dimethyl-1-pyrroline N-oxide (DMPO), and benzoate (BA) with high purity were obtained from J&K Scientific (Beijing, China). XAD-4 and XAD-8 Amberlite resins were purchased from Sigma-Aldrich (San Francisco, CA, USA) and used to extract NOM in water plant-treated water. A total of 13 halogenated organic standards (chloroform, 1,1,1-trichloroethane, 1,1,2-trichloroethane, 1,1-dichloro-2-propanone, 1,1,1-trichloro-2-propanone, 1,2,3-trichloropropane, carbon tetrachloride, trichloroethylene, tetrachloroethylene, chloralhydrate, monochloroacetic acid, dichloroacetic acid, and trichloroacetic acid) were ordered from Center of National Standard Reference Material of China (Shanghai, China). High-performance liquid chromatography (HPLC)-grade acetonitrile and methyl tertiary-butyl ether (MTBE) were obtained from Merck (Darmstadt, Germany). H3BO3, Na2B4O7, NaNO2, NaCl, CaCl2, MnCl2, ZnCl2, FeCl3, CuCl2, NaHCO3, Na3PO4, and Na2SO4 were all analytical-reagent grade and traceable to Sinopharm Chemical Reagent Co., Ltd. (Shanghai, China). Sodium hypochlorite (NaOCl, 5%) was obtained from Aladdin (Shanghai, China) and calibrated by N,N-diethyl-p-phenylenediamine method. Ultrapure water (18.2 MΩ·cm) was used to prepare solutions. Three water plant-treated water samples were collected from drinking water plants of Hang Zhou (Zhejiang Province, China). The water samples were allowed to stand overnight to remove residual chlorine and stored at 4 °C before use.
NOM was extracted from the filtered tank effluent of Hangzhou Jiuxi drinking water plant. Amberlite resins were employed in NOM isolation, and NOM fractionation was achieved in accordance with previous works [16,17]. Hydrophobic fraction was collected by XAD-8 resin and XAD-4 resin. These two fractions were mixed for subsequent experiments.

2.2. Experimental Procedures

The experiment was performed at 25 °C in a 1.5-L glass reactor, which was wrapped with aluminum foil to block light. Figure S1 presents the set-up and construction of photoreactor. AHTN (1 mg∙L−1) was initially prepared with ultrapure or real water, and pH was adjusted using 10 mM borate buffer. HCl and NaOH were used to adjust the pH for investigating the effects of cations. NaOCl stock solution (200 mg∙L−1) was then added to generate an initial concentration of 3.28 mg∙L−1. The mixture was vigorously stirred with a magnetic stirrer during the whole reaction process. The temperature of the reaction slurry was maintained at the set point with water bath. The UV lamp was lit for 5 min to obtain a stable UV output (Figure S2). Timing was started as soon as the UV light baffle was opened. Residual chlorine in samples was quenched by NaNO2 before HPLC analysis. Each degradation experiment was performed in triplicate under identical conditions, and results were presented as the averages. Error bars represented the standard deviation of means (n = 3).

2.3. Determination of UV Fluence Rate and UV Dosage

The fluence rate in the photoreactor was determined using atrazine as actinometer [18]; a photon flux of 6.3 × 10⁻⁸ Einstein·s−1 was obtained. Average UV fluence rate (mW·L−1) was calculated afterward. The photoreactor was non-standard collimated beam reactor. The UV light was casted to a cylindrical surface and not the horizontal one. The area of light projection varied with distance from light source. Thus, transforming the volume-averaged UV fluence rate into area-averaged UV fluence rate (mW·cm−2), which was frequently used, presented difficulty. For comparisons with other UV-based processes, we assumed that the UV light projected on the cylindrical surface at a position of the effective light path length (L, cm), and a value of 0.067 mW·cm−2 was obtained. This value approximated the area-averaged UV fluence rate rather than the exact UV light distribution. UV fluence rates in presence of acetone, isopropanol, and NOM were calibrated in the same manner.
The effective path length of UV light (L = 7.03 cm) in the reactor was determined on the basis of H2O2 photolysis at a low concentration (0.1 mM, Figure S3). A detailed description is shown in Section S1 of the Supporting Information.

2.4. Analysis

AHTN was quantified by an Agilent 1200 HPLC (Agilent, Palo Alto, CA, USA). Separation was performed with an Agilent Eclipse XDB-C18 column (5 μm, 4.6 mm × 150 mm) at 30 °C. The mobile phase consisted of 90% acetonitrile and 10% H2O, and had a flow rate of 1 mL·min−1. Detection wavelength was set at 253 nm. A total of 10 μL of sample injection was employed.
To detect the possible presence of organic chlorinated products, we drew samples from the reactor (1 mg·L−1 AHTN initially in pH 7 borate buffer) after treatment by UV/FC (FC = 3.28 mg·L−1) at different time points. We then added a dechlorination agent, i.e., sodium thiosulfate, to consume residual FC. Chlorinated products were analyzed by a Thermo Scientific TRACE 1300 gas chromatography (Thermo Fisher, Waltham, MA, USA). A total of 13 chlorinated byproducts (CBPs) were analyzed. The nonpolar chlorinated products were directly extracted with MTBE (50 mL samples with the addition of 2 mL MTBE). The polar chlorinated products were initially derivatized with methanol. A HP-5MS capillary column (30 m × 250 mm × 0.25 mm) was used for separating CBPs. The linearity (by R2) of calibration data (0.1–40 μg·L−1) was higher than 0.999. Table S1 provides the method detection limits (MDLs). Qualitative analysis was performed by matching retention times of samples with those of commercial standards. For comprehensive detection of degradation intermediates, samples were also concentrated on a Gilson GX-271 ASPEC apparatus (Gilson, Middleton, WI, USA) and qualified with an Agilent 6460 triple-quad HPLC-MS (Agilent, Palo Alto, CA, USA). The HPLC-mass spectrometer was equipped with an Agilent EclipseXDB-C18 column (5 μm, 4.6 mm × 150 mm), and column temperature was set at 40 °C. Parameter settings for the mass spectrometry (MS) were negative ion mode with a gas flow rate of 5 L·min−1 at 325 °C, a nebulizer pressure of 45 psi, sheath gas flow at 11 L·min−1 at 350 °C, a nozzle voltage of 0 or 500 V(+), a capillary voltage of 3000 V(+)/3500 V(−), and a fragmentor voltage of 135 V. The mobile phase for the HPLC-MS analysis was a 70/30 (v/v) mixture of 10 mM ammonium acetate with acetonitrile. The equipment was run at 1.0 mL·min−1.
Inorganic chlorine species ( Cl , ClO 2 , ClO 3 , and ClO 4 ), NO 3 , and SO 4 2 were monitored using a Dionex ICS-2000 ion chromatograph (Chameleon 6.8, Sunnyvale, CA, USA) equipped with a Dionex IonPac AS19 analytical column (250 mm × 4 mm). An EluGen EGC-KOH cartridge and a continuously regenerated anion trap column (CR-ATC) were used. All analytes were detected by suppressed conductivity with an ASRS ULTRA II (4 mM) self-regenerating suppressor operating at 130 mA current.
Qualitative analysis of HO• was realized through a Bruker A200 electron paramagnetic resonance (EPR) 300E instrument (Bruker, Karlsruhe, Germany). The EPR spectrometer settings in the spin trapping experiments were as follows: center field, 351.194 mT; sweep width, 10.00 mT; modulation amplitude, 0.1 mT; sweep time, 41 s; microwave frequency, 9.858 GHz; microwave power, 2.25 mW; and receiver gain, 1.42 × 10⁴.
Typical water-quality indexes were measured for the three collected effluent samples of waterworks filter. Total organic carbon (TOC) was determined via a Shimadzu TOC analyzer (Shimadzu, Kyoto, Japan). The concentrations of cations ( Ca 2 + , Mn 2 + , Cu 2 + , and total Fe) were determined using a PerkinElmer NexION 350Q ICP-MS Spectrometer (PerkinElmer, Shelton, CT, USA). UV absorbance at 254 nm (UV254) was determined with a Shimadzu UV-250 spectrophotometer (Shimadzu, Kyoto, Japan). The pH was determined using an Orion 3-Star pH meter (Thermo Fisher, Shanghai, China). Bicarbonate was detected using chemical titration with a standard HCl solution. Phosphate concentration was determined using the molybdenum blue method.

2.5. Contributions of Different Radicals

Competitive kinetics methods were used to determine the second-order reaction rate constants of AHTN with HO• (k(HO• + AHTN)) and RCS (k(RCS + AHTN), RCS = Cl•, Cl 2 , and ClO•). Table 1 summarizes the primary chemical reactions in the UV/FC system and rate constants. NB was selected as the probe compound to evaluate k(HO• + AHTN) and the steady-state concentration of HO• ([HO•]ss). The HO•-dominated system was generated by peroxymonosulfate activation using KOH while controlling the pH at 11, as most sulfate radicals were converted into HO• at such pH [19]. [Cl•]ss was determined using both BA and NB as the probe compounds. 2,5-Dimethoxybenzoate (DMBA) was used as a probe compound for k(ClO• + AHTN) evaluation. Detailed information is provided in Supporting Information (Section S2, Figures S4–S6). k(HO• + AHTN) and k(ClO• + AHTN) measured 8.3 × 10⁹ and 6.3 × 10⁹ M−1·s−1, respectively. [HO•]ss, [Cl•]ss, and [ClO•]ss reached 2.6 × 10⁻¹⁴, 2.8 × 10⁻¹⁵, and 7.0 × 10⁻¹⁴ M, respectively. The pseudo first-order rate constants of AHTN with different reactive species ( k ( R + AHTN ) , R = HO•, Cl•, Cl 2 , and ClO•) can be calculated using Equations (1)–(5). Relative contributions of reactive species ( G R ) can be calculated using Equations (6) and (7).
k ( HO + AHTN ) = k ( HO +   AHTN ) [ HO ] s s
k ( Cl + AHTN ) = k ( Cl +   AHTN ) [ Cl ] s s
k ( Cl 2 + AHTN ) = k ( Cl 2 +   AHTN ) [ Cl 2 ] s s
k ( ClO + AHTN ) = k ( ClO +   AHTN ) [ ClO ] s s
k ( RCSs + AHTN ) = k ( Cl + AHTN ) + k ( Cl 2 + AHTN ) + k ( ClO + AHTN )
k Total = k ( HO + AHTN ) + k ( RCSs + AHTN ) + k UV + k FC
G R = k ( R + AHTN ) / k Total

2.6. Toxicity Evaluation of Samples

Toxicity was evaluated using 1 L of samples of the reaction solutions. A Microtox Model 500 toxicity analyzer coupled with luminescent bacteria Vibrio fisheri was used. Samples were examined in quartz tube containing 2% sodium chloride in three dilutions. A toxic-free control experiment was conducted in three repeats using 2% sodium chloride, 3.5 mg·L−1 FC, 0.022 mM sodium thiosulfate, and 10 mM borate buffer. Luminescence was recorded after 15 min of incubation at 15 °C. The percentage of luminescence inhibition was recorded. Samples were concentrated by the freeze-drying method. Recovery for freeze-dried samples totaled from 95% to ~110%. The detoxification rate is defined in Equation (8).
Detoxification   rate   ( % ) = ( L t L 0 ) / L 0
where L0 refers to the initial loss rate of light emission and Lt denotes the loss rate of light emission at reaction time t (min).

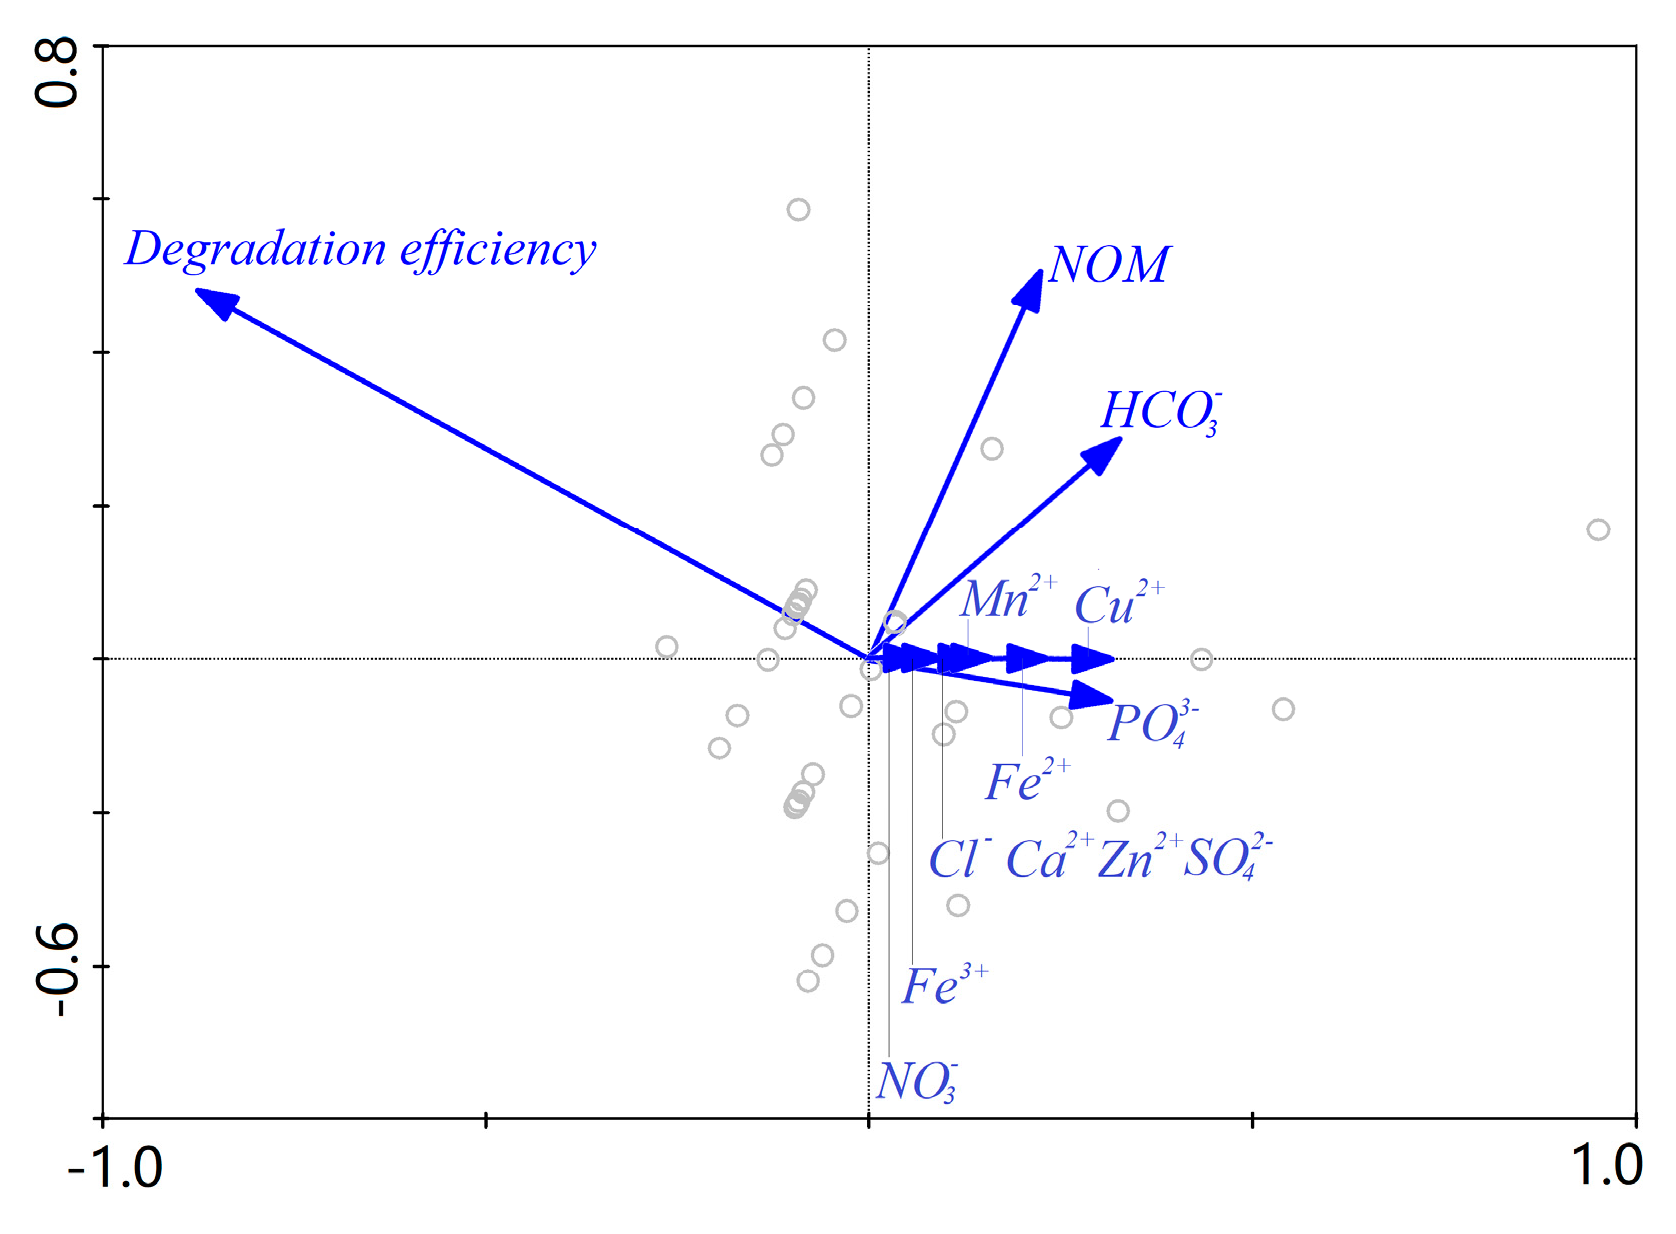
2.7. Principal Factor Analysis

We used CANOCO for Windows package (version 4.5, Ter Braak & Smilauer, Wageningen, the Netherlands) to execute the principal component analysis. We initially performed detrended correspondence analysis (DCA) on the efficiency variance to determine the length of the ordination gradient. The length of the gradient along the first axis was 0.545 (<3.0); therefore, redundancy analysis (RDA) was performed. The degradation efficiency in UV/FC was expressed as response variables. Water quality parameters were set as environmental variables. The data were log (x + 1) transformed.

3. Results and Discussion

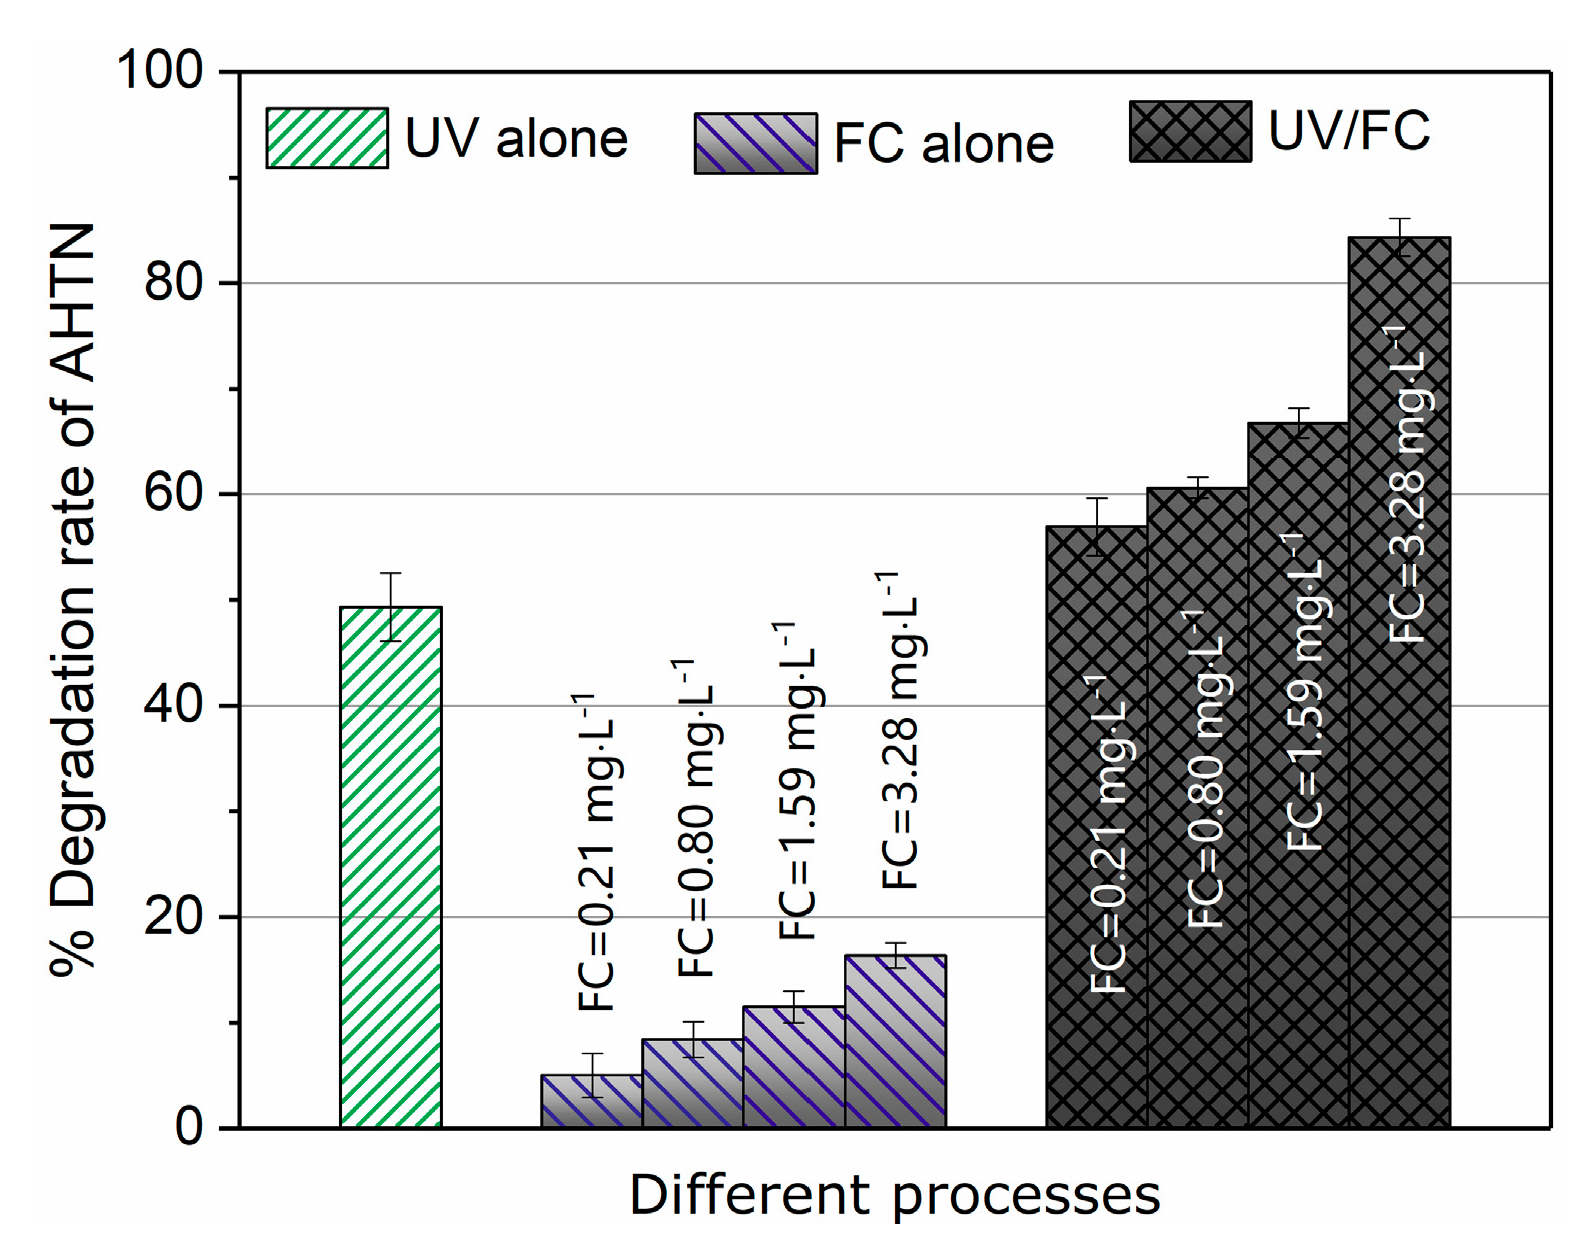
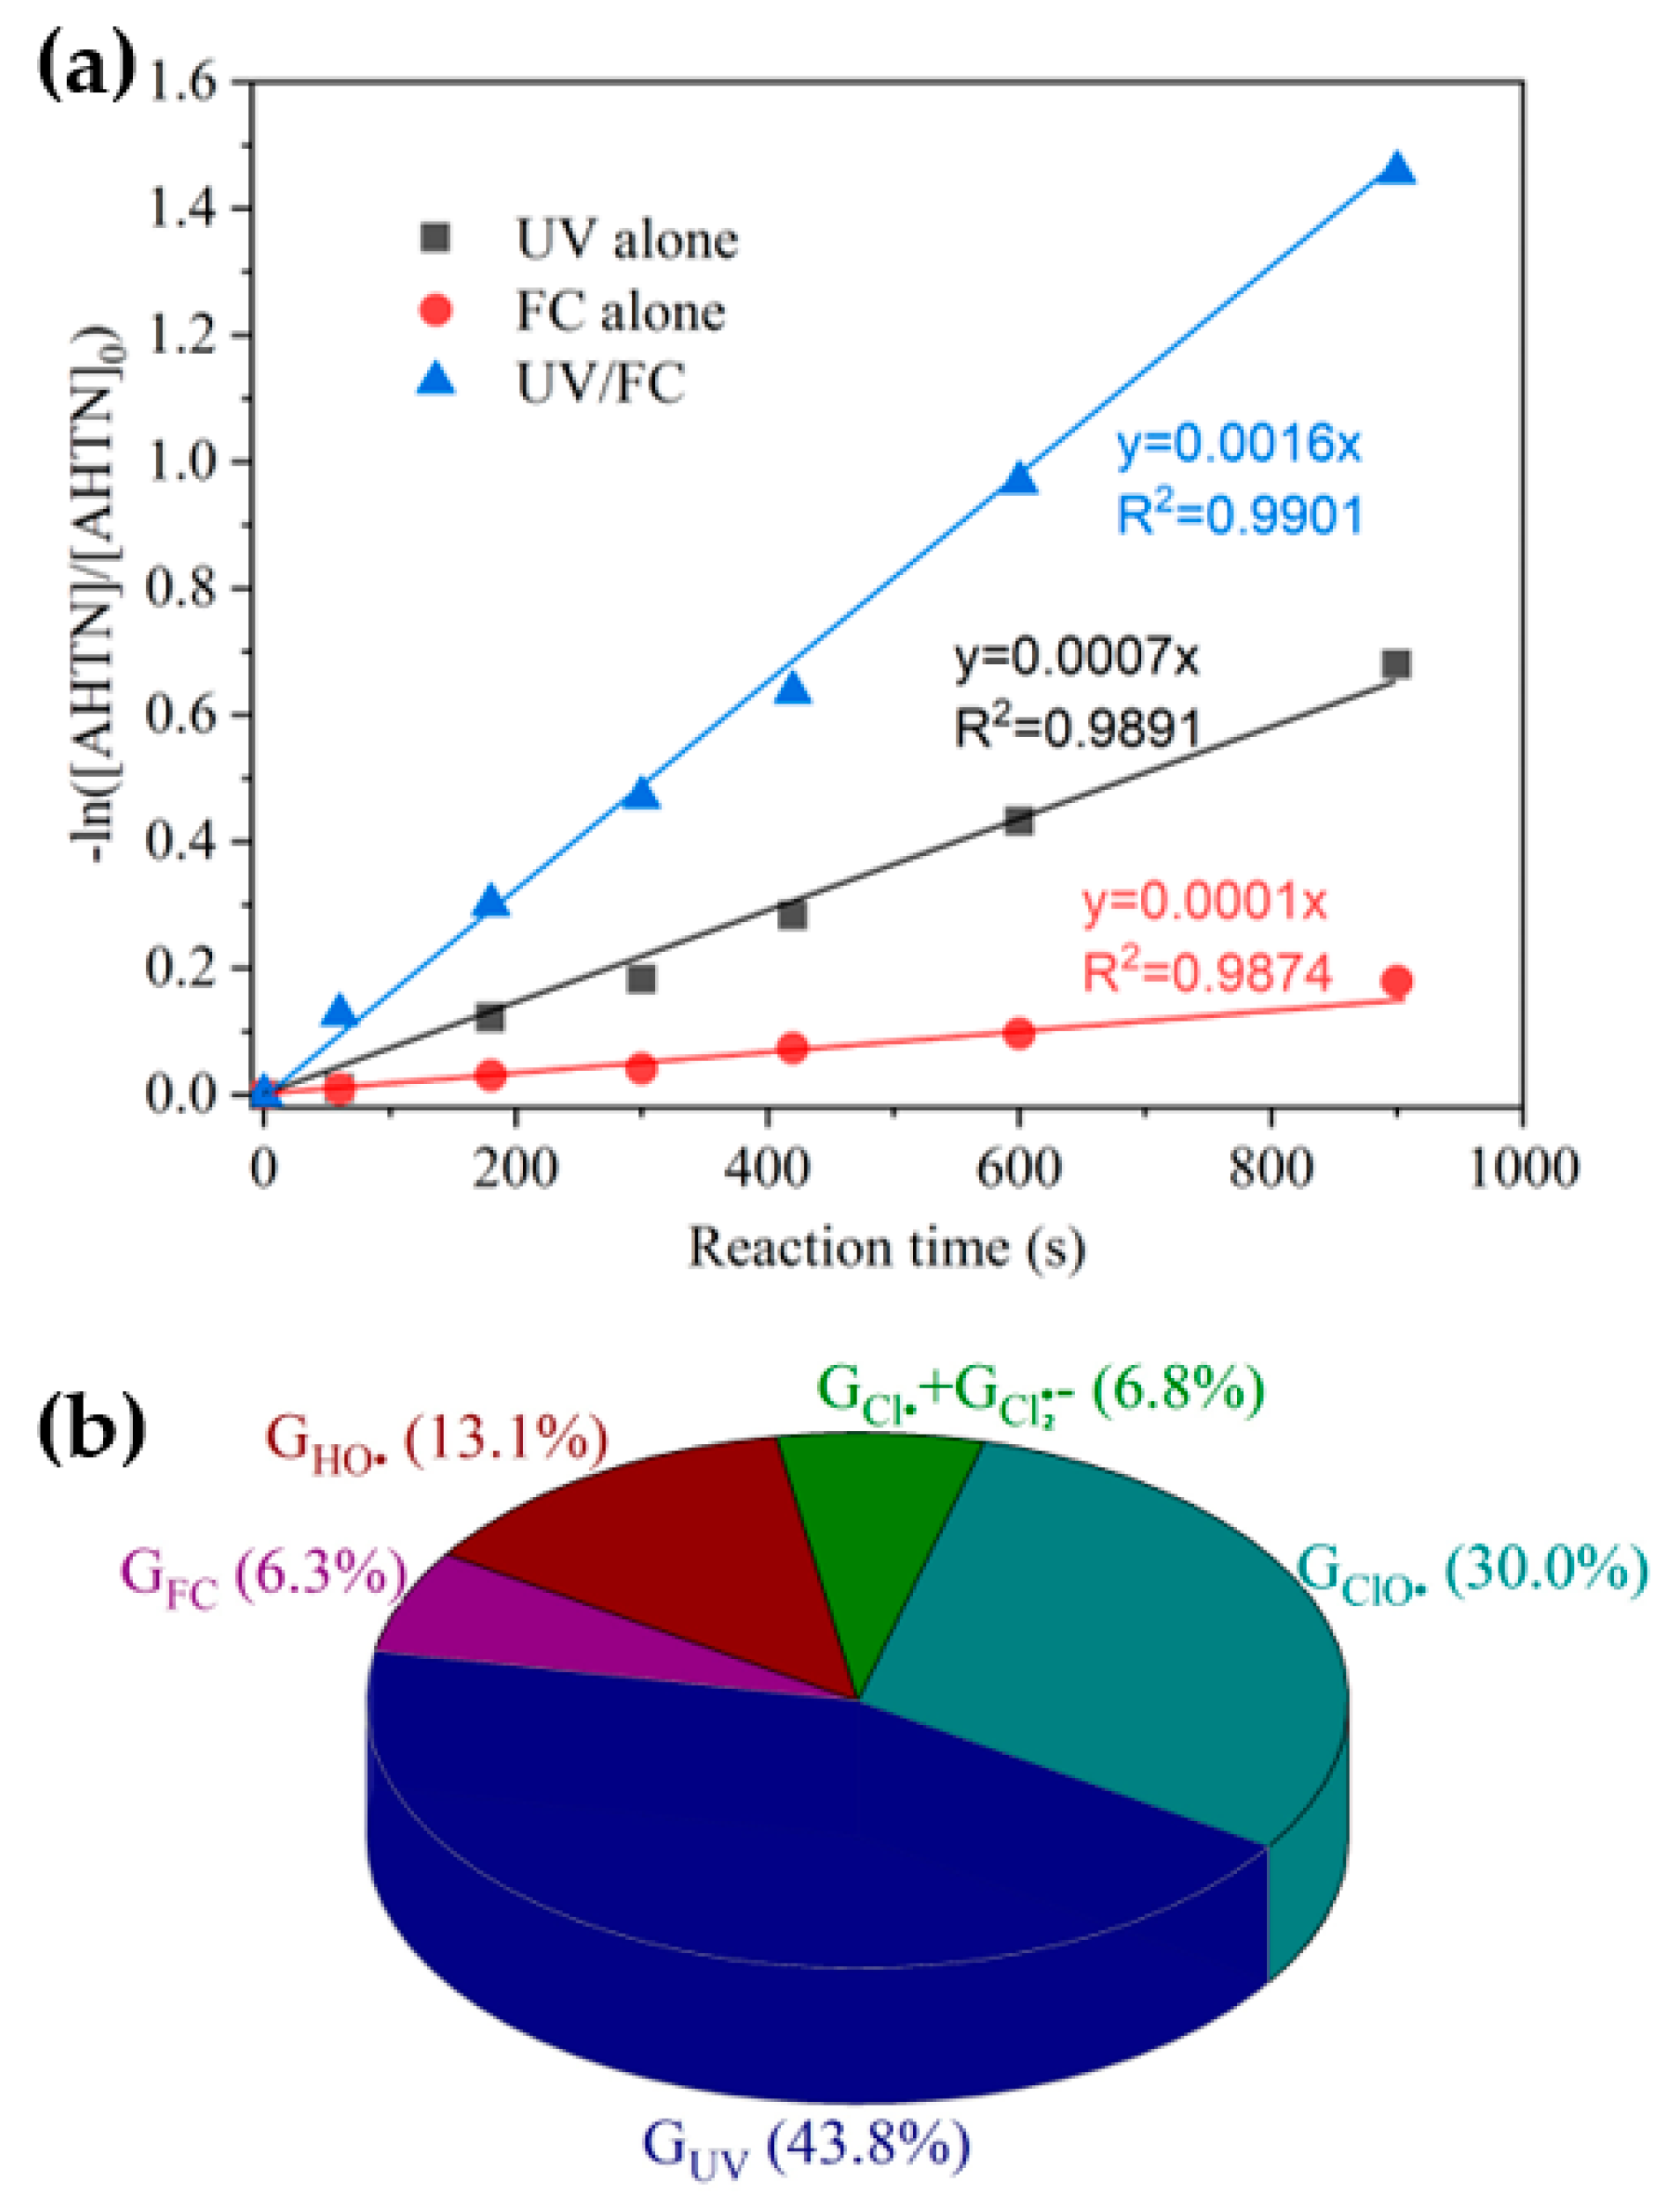
3.1. AHTN Degradation under UV/FC Conditions

AHTN decomposition in ultrapure water by UV, FC, and UV/FC were compared (Figure 1). The UV/FC rapidly degraded AHTN by 60–90% for 60 mJ·cm−2 at a FC dosage of 0.21–3.28 mg·L−1. Direct UV photolysis showed a moderate degradation rate of 49.3% at 60 mJ·cm−2. AHTN was resistant to FC alone. The measured molar absorbance of AHTN and quantum yield reached ε = 7911.7 M−1·cm−1 and Φ = 1.3 mol·Einstein−1, respectively (Section S3 and Figures S8 and S9 in the Supporting Information). This finding illustrates the moderate degradation performance of UV photolysis. The reaction of AHTN with FC has been reported to initiate with a substitution reaction occurring at the acetyl side chain of AHTN (H substitution of α-carbon), successively followed by haloform reaction, decarboxylation, and methylation [32]. In the current study, the weak electron-withdrawing capability of carbonyl caused a slow reaction kinetics of FC with the methyl group of acetyl side chain. This result well explains the FC resistance of AHTN. The excellent degradation performance of UV/FC may be attributed to the formation of reactive species, such as HO•, Cl•, and Cl 2 , which were generated from the UV photolysis of FC (Equations (I)–(XXII)).

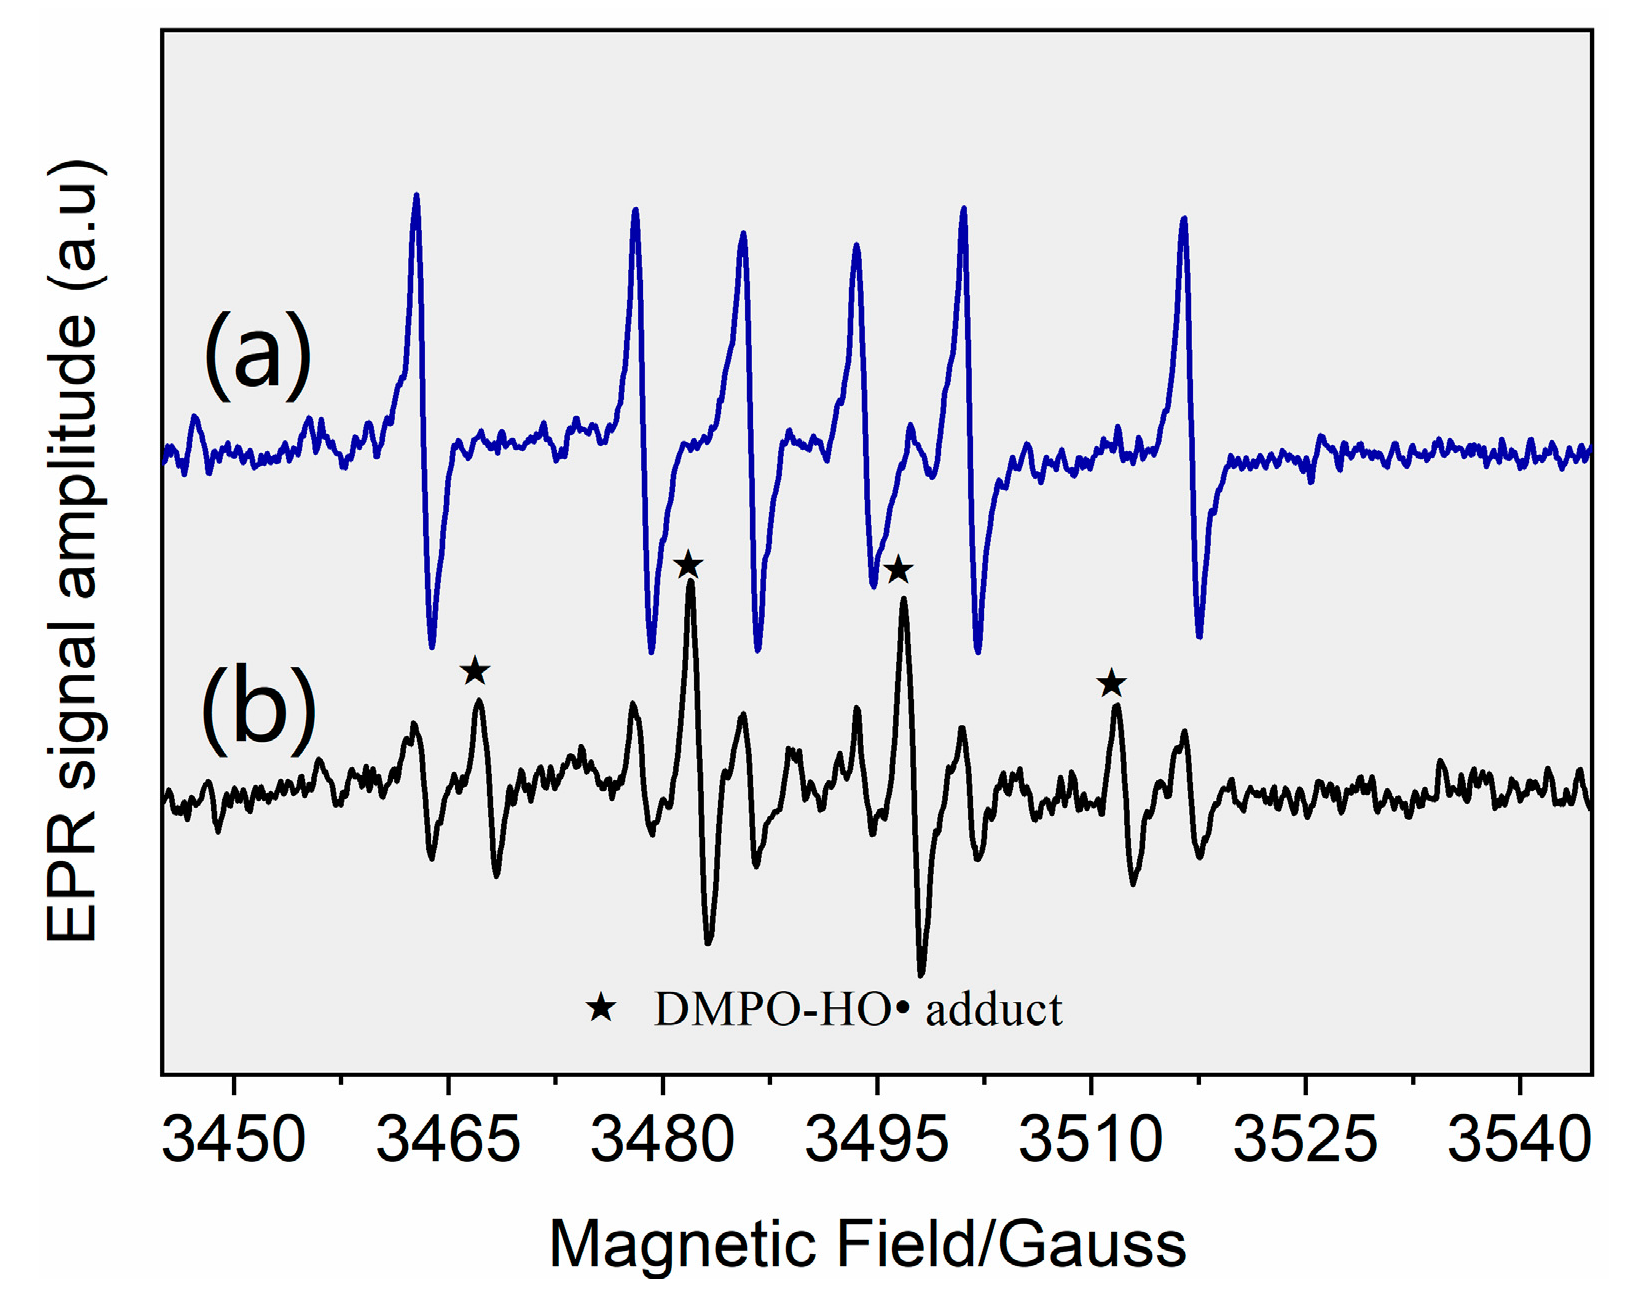
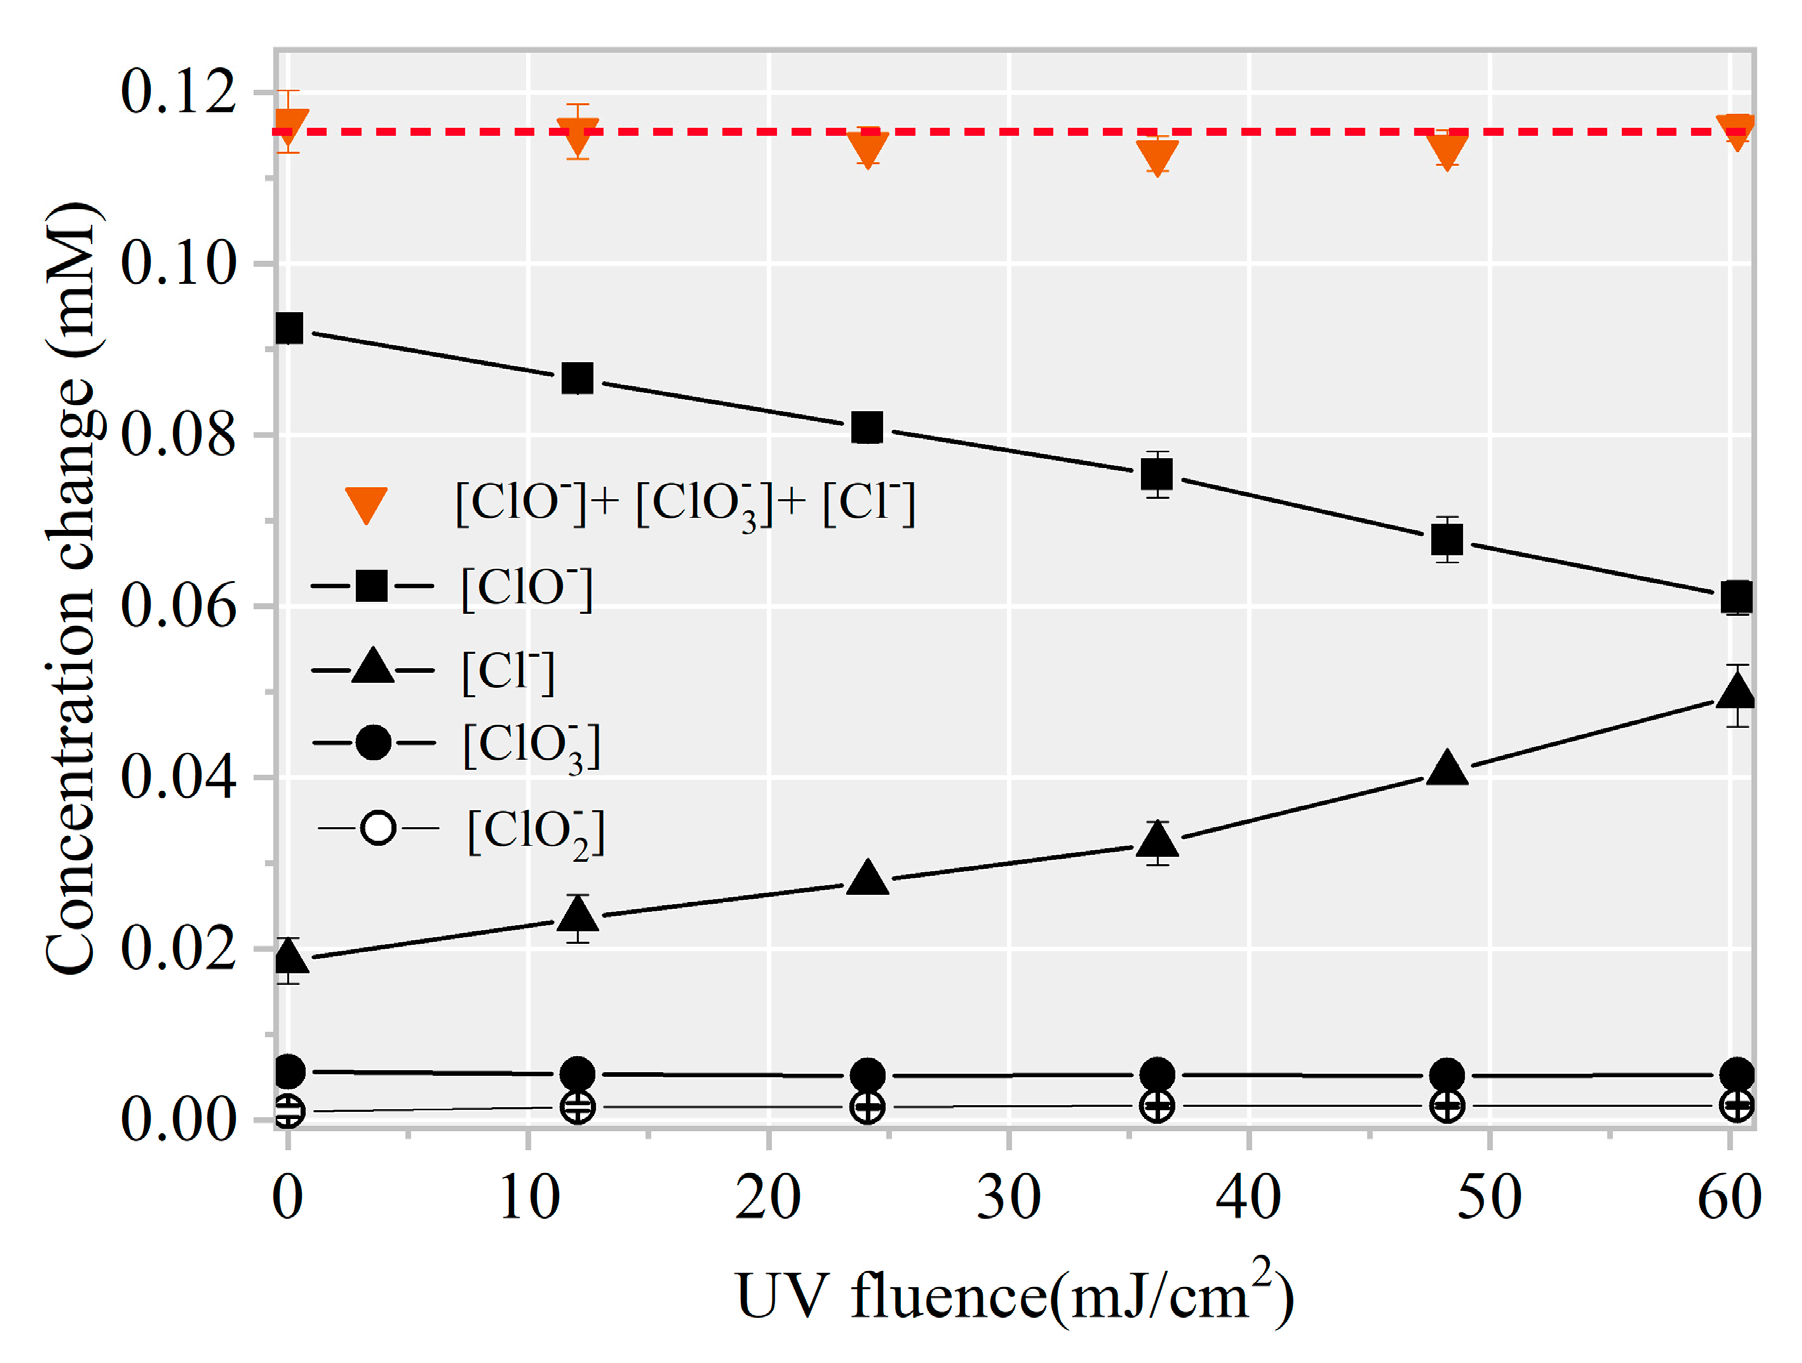
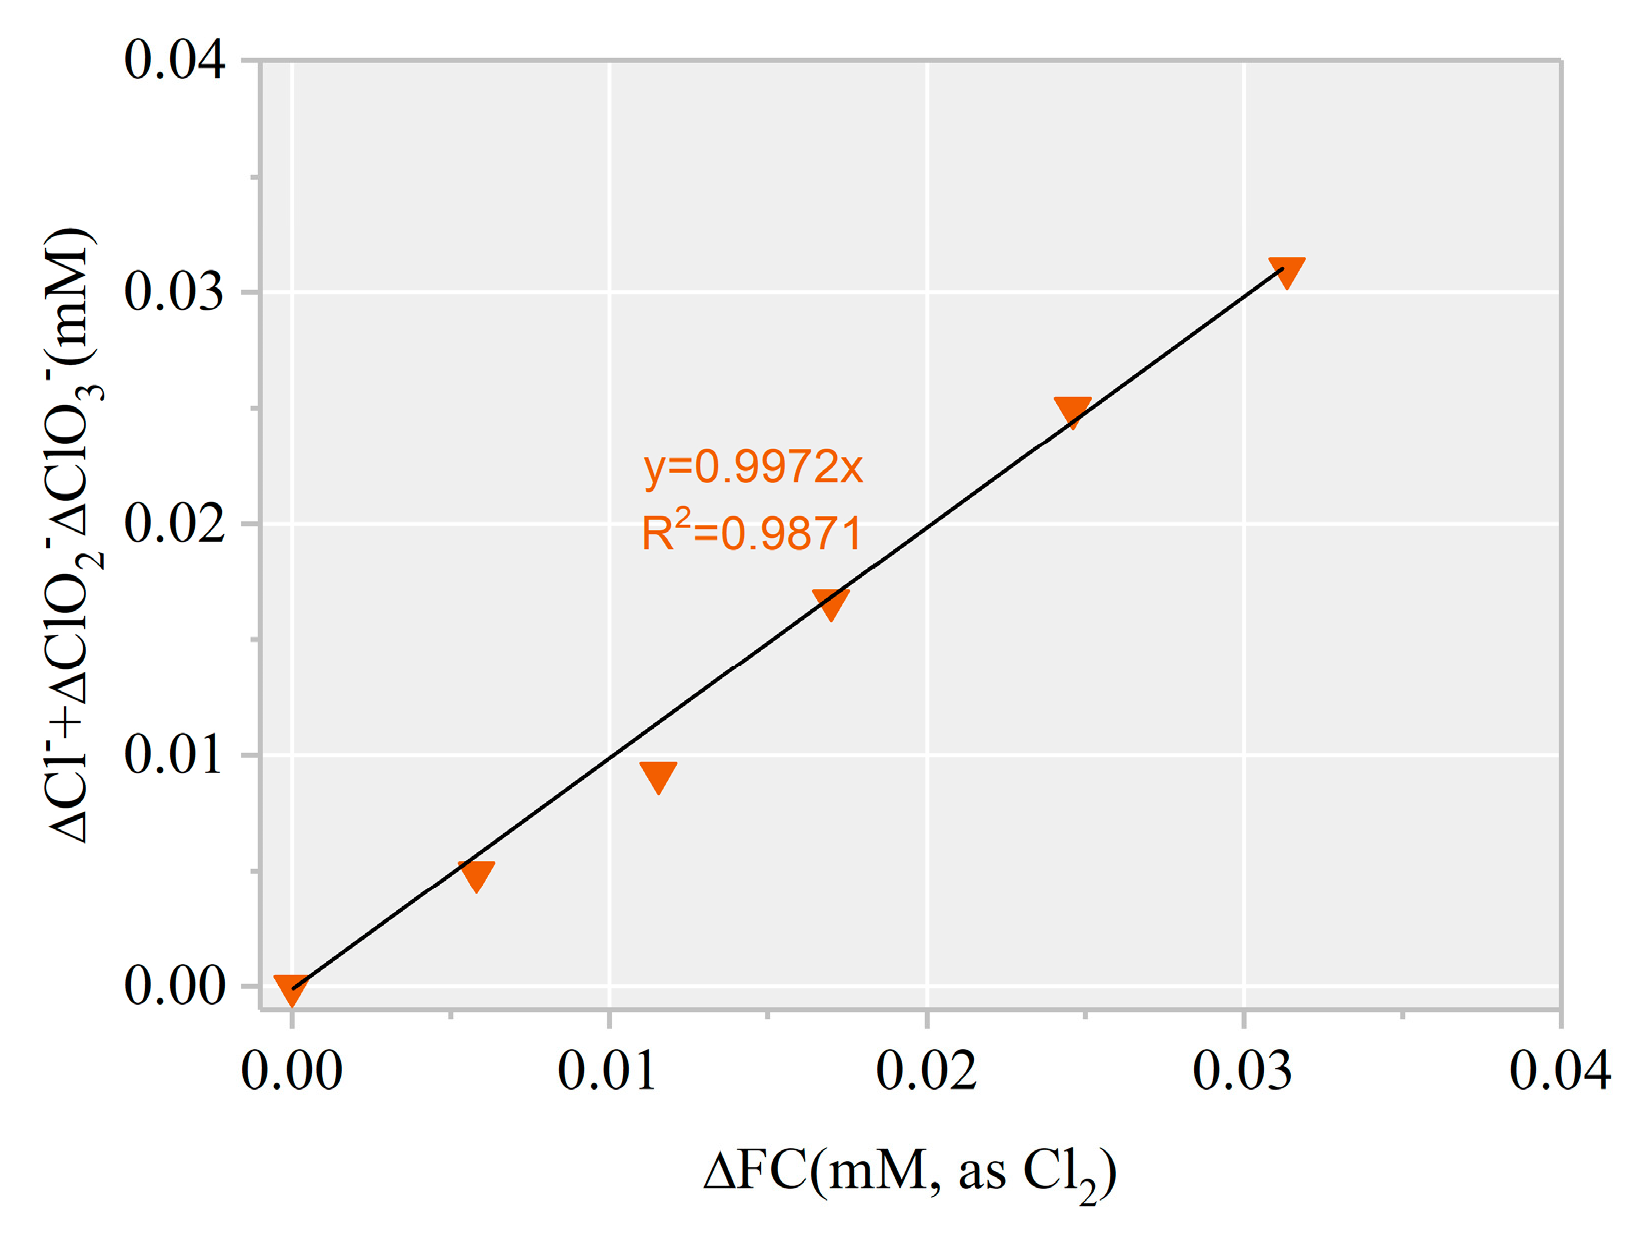
3.2. Identification of Reactive Species for AHTN Degradation by UV/FC

FC photolysis under irradiation at 253.7 nm mainly yielded HO•/ O and Cl• (Equations (I)–(VI)). O was rapidly captured by H2O to generate HO• under neutral pH condition (Equation (XV)) and exhibited low reactivity toward organic pollutants. Therefore, O was usually considered to be less vital than HO• and Cl•. FC was added as NaOCl solution containing a small amount of Cl . Production of Cl 2 and ClOH was expected via the reaction between Cl• or HO• with Cl (Equations (IX) and (XIII)). At neutral condition, ClOH was unstable and rapidly decomposed into HO• (Equation (XX)). Both Cl• (2.4 V) and Cl 2 (2.0 V) are strong oxidants [20]. In the current study, another secondary radical, ClO•, was derived from the reaction of FC with HO•/Cl• (Equations (VII), (VIII), (XI), and (XII)). Sun et al. [24] observed that ClO• featured the same importance as HO• and Cl• in degrading caffeine by UV/FC. Therefore, the four radicals HO•, Cl•, Cl 2 , and ClO• were suspected to contribute to AHTN degradation, in addition to direct photolysis and FC chlorination.
On the basis of the determined k(HO• + AHTN) and [HO•]ss, k (HO• + AHTN) was 2.1 × 10⁻⁴ s−1. Given k Total (1.6 × 10⁻³ s−1), k UV (7.0 × 10⁻⁴ s−1), and k FC (1.0 × 10⁻⁴ s−1) were known (Figure 2a), the relative contributions of HO• ( G HO ) and RCSs ( G RCSs ) could be initially determined. HO• and RCS, respectively, accounted for 13.1% and 36.9% of AHTN degradation compared with a G UV value of 43.8% produced by direct UV photolysis. To ascertain the RCSs that played a major role, we calculated G ClO (30%) from the obtained k(ClO• + AHTN) (6.3 × 10⁹ M−1·s−1) and [ClO•]ss (7.0 × 10⁻¹⁴ M). Cl• and Cl 2 accounted for 6.9% of AHTN degradation. Figure 2b presents the contributions of relevant contributors.
The results indicated that HO• and ClO• were the primary contributors among the four radicals, whereas Cl• and Cl 2 played minor roles. A direct support from EPR testing results confirmed the formation of HO• (Figure 3). When Cl• was generated from the photolysis of HOCl, Cl• was initially captured by H2O molecules to form ClOH at a rate of 2.5 × 10⁵ s−1 (k(Cl• + H2O) × [H2O], Equation (XIV)). The initial concentration of Cl approximated 0.02 mM in the reaction system, corresponding to a Cl• scavenging rate of 1.3 × 10⁵ s−1 (k(Cl• + Cl ) × [ Cl ], Equation (XIII)). Furthermore, 3.28 mg·L−1 FC led to a Cl• scavenging rate of 2.0 × 10⁵ s−1 (k(Cl•+ ClO ) × [ ClO ] + k(Cl• + HClO) × [HClO], Equations (XI) and (XII)). Even if k(Cl• + AHTN) reached a level of ~1010 M−1·s−1, AHTN only led to a Cl• scavenging rate of ~104 s−1 (k(Cl• + AHTN) × [AHTN]). Therefore, under the conditions of the present work, Cl• was primarily captured by H2O molecule, Cl , and FC, thereby leading to a low [Cl•]ss concentration (2.8 × 10⁻¹⁵ M). Thus, Cl 2 may have contributed to 6.9% of AHTN degradation. An insignificant formation of organic chlorinated compounds in the investigation of chlorine balance (Figure 4) confirms the above speculation. In summary, the radical-induced AHTN elimination is primarily attributed to the attacking of HO• and ClO•. An identical conclusion was obtained in studies where caffeine was treated by UV/FC [24].

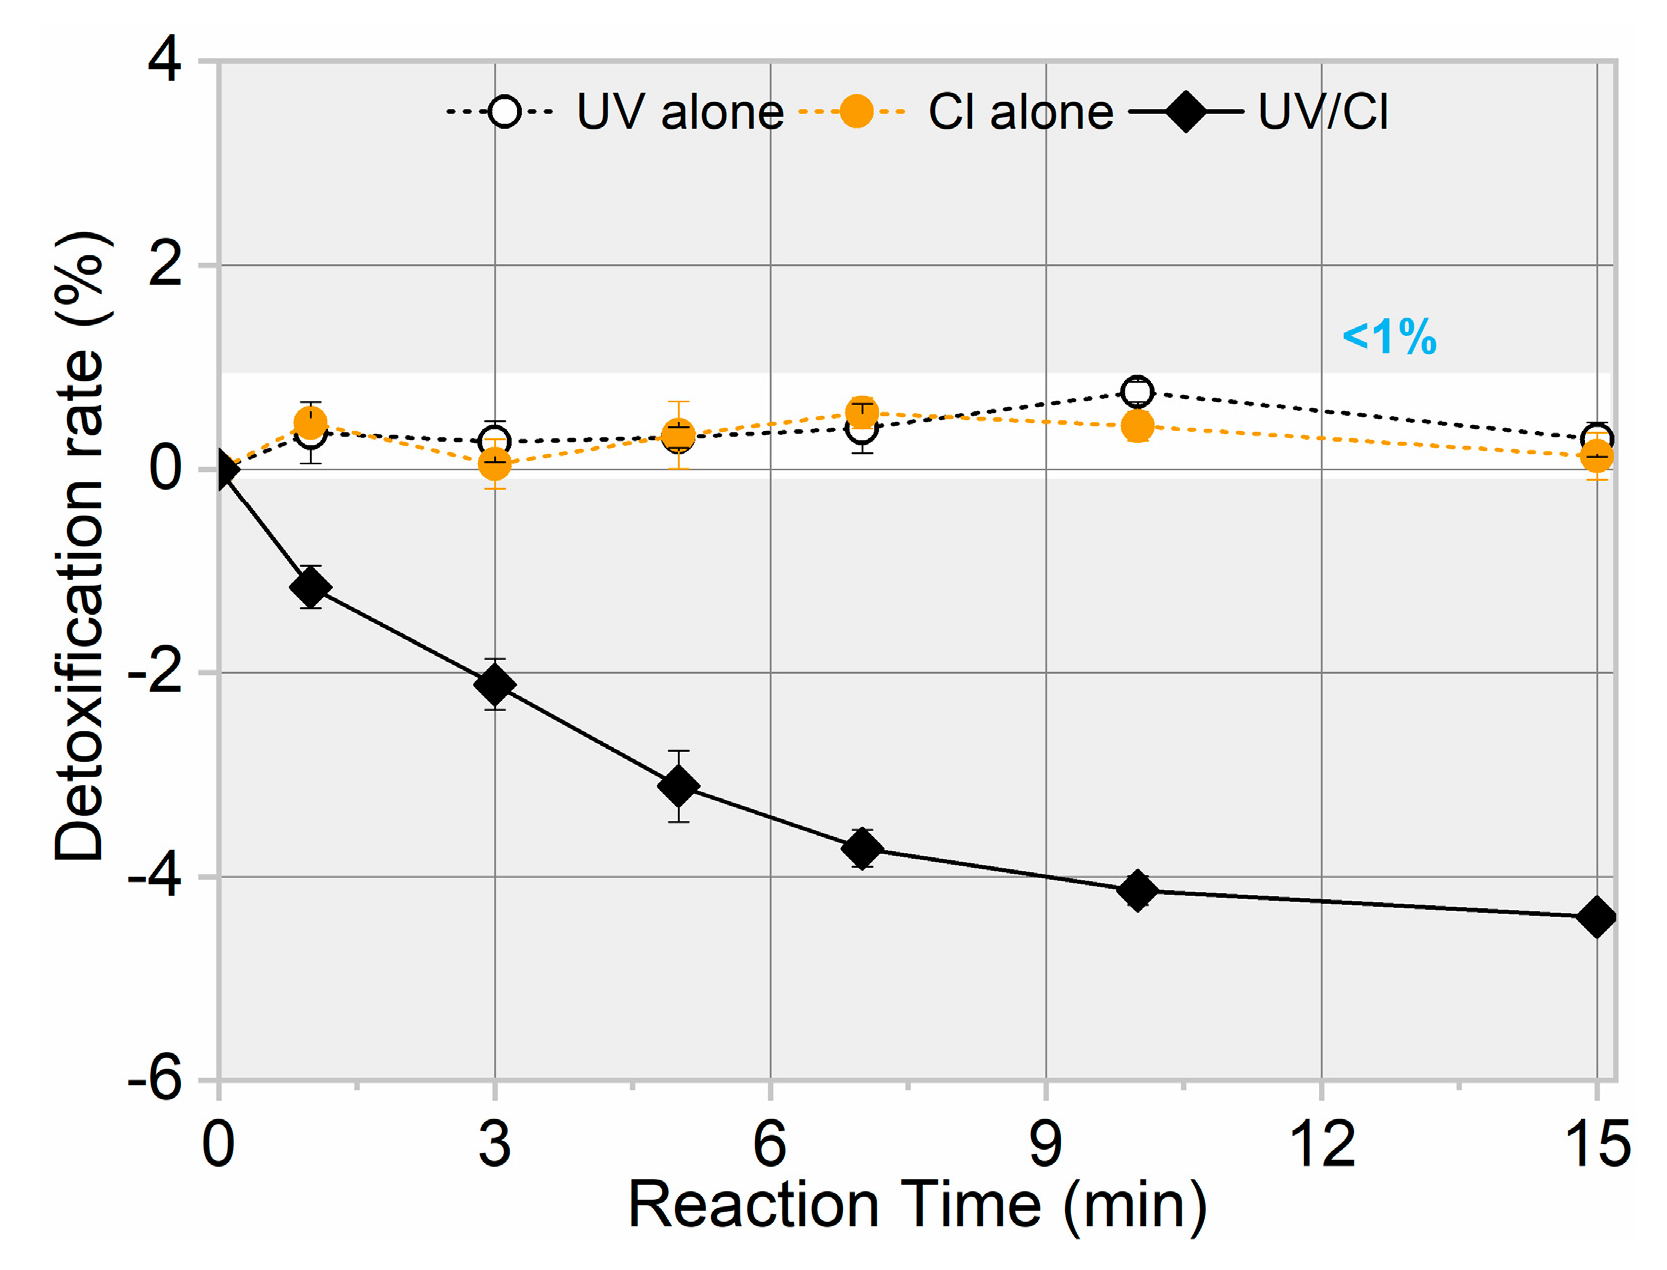
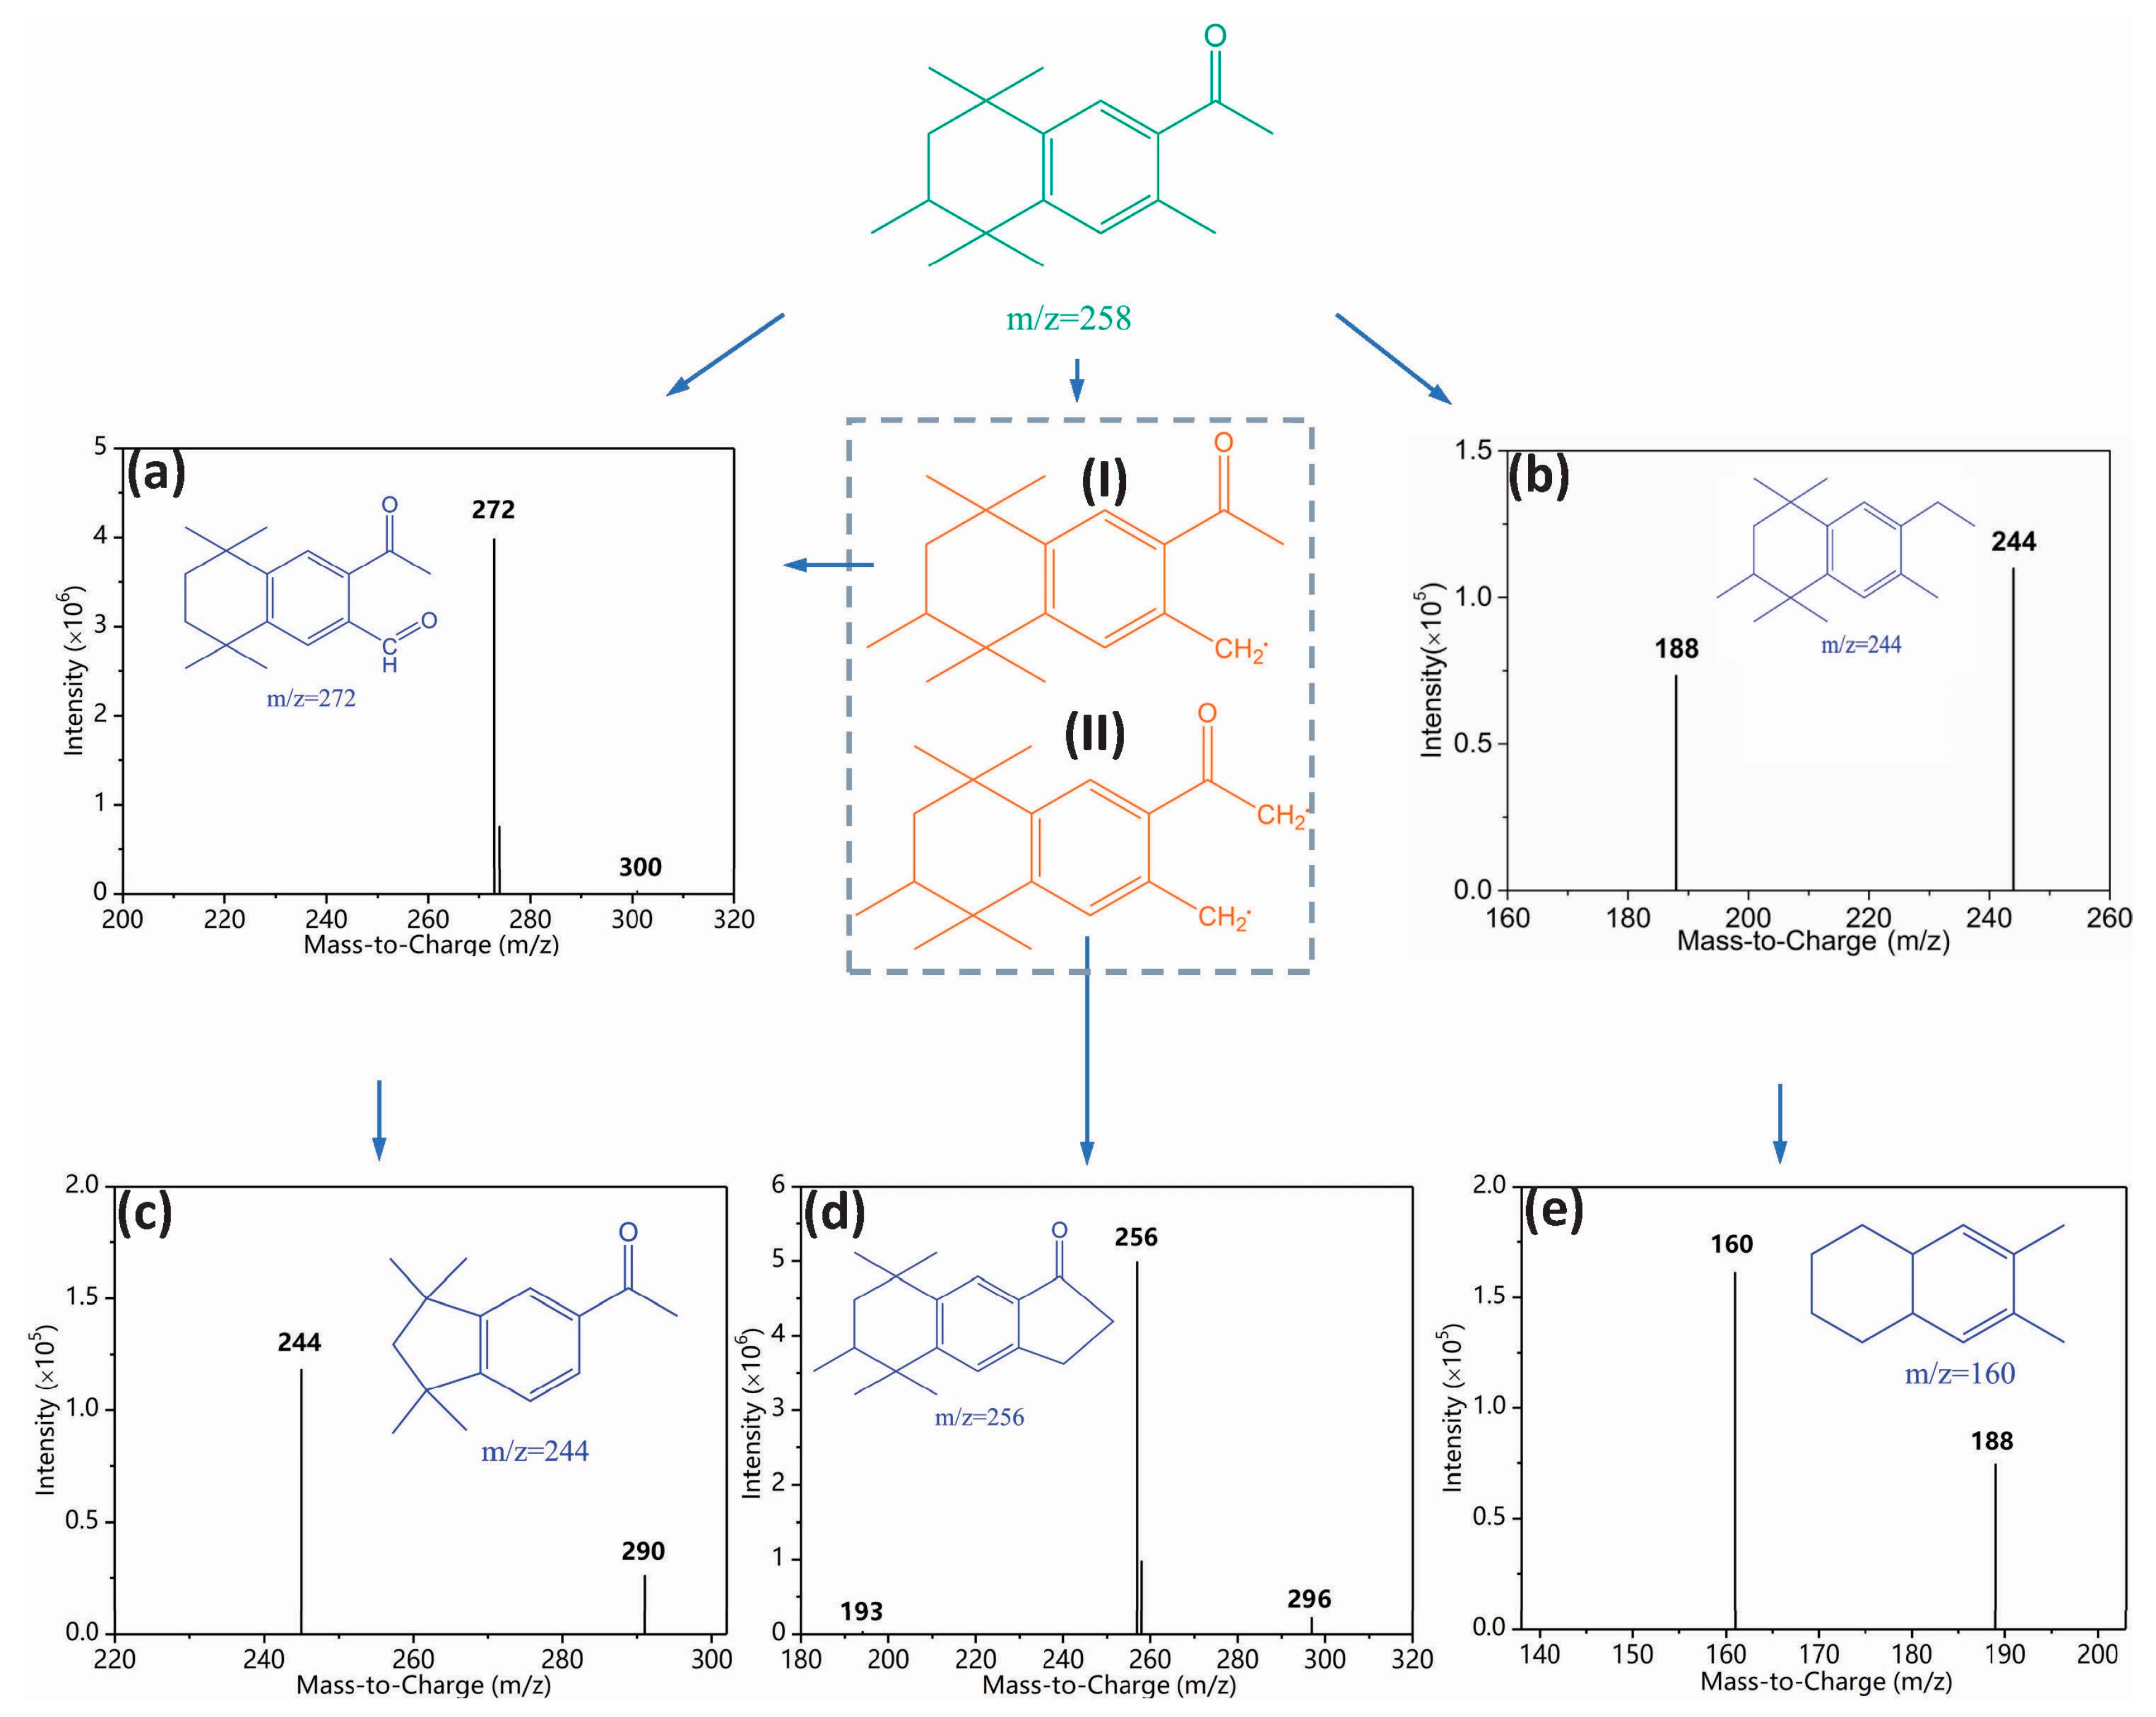
3.3. Toxicity Change, Intermediate Formation, and Degradation Pathway

The toxicity change of treated water during target pollutant degradation must also be a concern due to the possible formation of intermediates with similar or even higher toxicity than their parent compounds [33,34]. Therefore, toxicity variation related to AHTN degradation by FC, UV, and UV/FC was examined, allowing the evaluation of the detoxification efficiency of UV/FC. As shown in Figure 5, almost no toxicity change was observed for AHTN solution when treated by FC and UV. By contrast, a weak increase in toxicity was detected for the solution treated by UV/FC. Such phenomena indicate the generation of products with higher toxicity than AHTN.
To elucidate the observed toxicity elevation, we identified degradation intermediates. An intuitive image of intermediate formation was initially obtained from HPLC chromatogram (Figure S10). Three new peaks were detected with considerable abundance in the UV/FC system (Figure S10a). By contrast, a few intermediates were generated in UV (Figure S10b) and FC systems (Figure S10c). We performed LC-MS analysis to further qualify these intermediates. Figure 6 shows the mass spectrum and possible chemical structures of intermediates. Products (a), (c), (d), and (e) completely differed from those reported in AHTN chlorination [8,32] and UV photolysis [8]. The products were characterized by notable similarities to parent molecules. Such distinction in products confirms the difference in the major species that induced AHTN degradation. By combining the structural information of the products and the identification of contributors to AHTN degradation, a possible degradation pathway was proposed (Figure 6).
ClO• was reported as a powerful one-electron oxidant and non-reactive radical in hydrogen abstraction or addition reactions [35]. HO• can react with organic compounds in several different ways, such as C=C and C=N double bonds, H-atom abstraction, and electron transfer [36]. In the current study, the H-atom abstraction of AHTN resulted in the generation of carbon-centered radicals (Radical (I) and (II)). These carbon-centered species (Radical (I)) can react with dissolved oxygen to form peroxyl radicals, which can generate aldehydes (product (a)) through self-reaction and succeeding decomposition [37]. Another intermediate, with the same m/z value (244) as product (b), was observed during the UV photolysis of AHTN; this intermediate was proposed to be 6-ethyl-1,1,2,4,4,7-hexamethyltetralin [8]. The aldehyde functional group of product (a) was oxidized, whereas that of product (c) was subsequently decarboxylated. Radical (II) can undergo self-polymerization to form product (d). The appearance of product (e) would have been due to molecular branch trimming of product (b).
To further confirm the formation of chlorinated intermediates, 13 CBPs were screened. The MDLs of the 13 CBPs ranged from 0.01 to 0.06 μg·L−1 (Table S1). Results revealed no targeted CBP at detectable concentrations in any of the samples. Notably, the decreased FC amount showed a linear correlation with an increased Cl level (k = 1.02, Figure 7). Thus, the final product of HOCl/ OCl was harmless Cl .

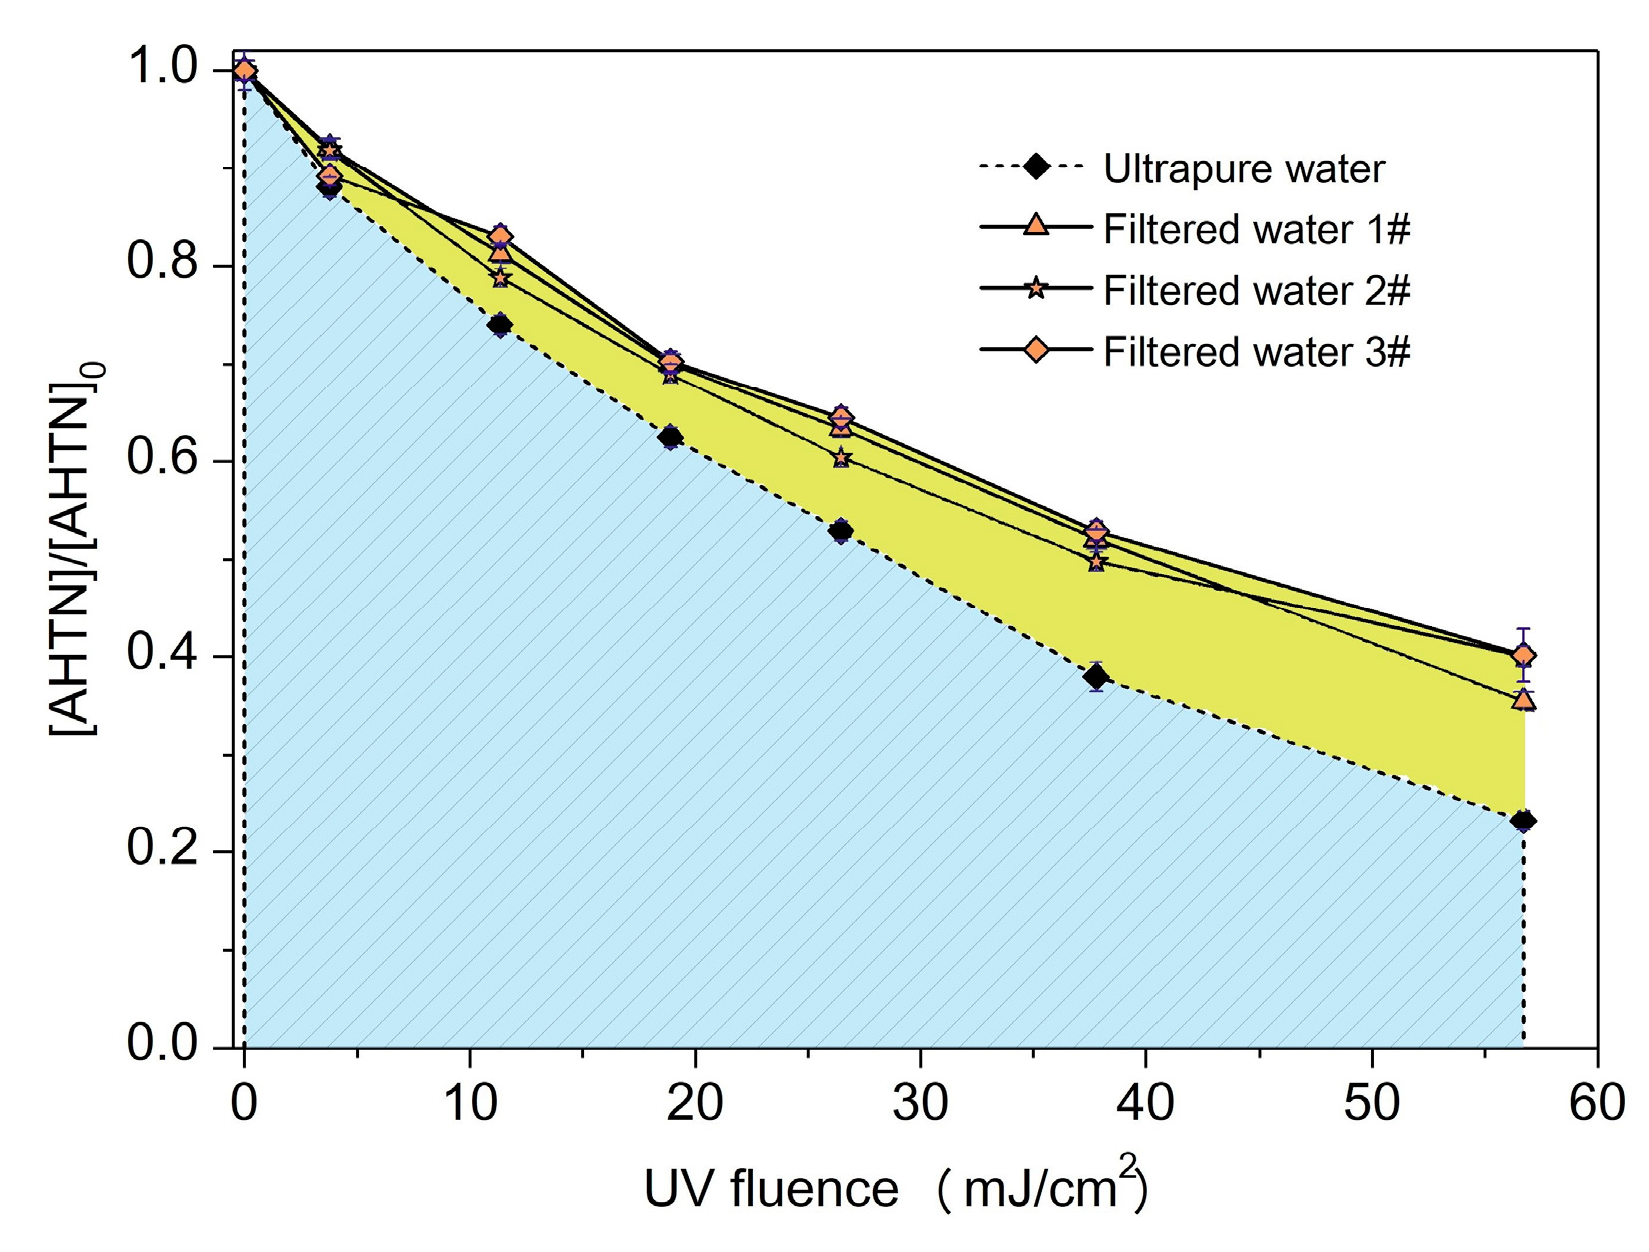
3.4. Effect of Water Background on AHTN Degradation

The destruction of AHTN under actual water background may be more striking than the degradation performance in ultrapure water. Thus, AHTN degradation by UV/FC, conducted in FWs collected from local drinking water treatment plants, was investigated. Table 2 provides the water quality parameters of the three FWs. Figure 8 displays the degradation curves. From the obtained results, we can conclude that AHTN degradation in actual waters slowed down compared with the case of ultrapure water to a certain extent (~12%). Background components may have induced the degradation differentiation. To screen out water quality parameters that substantially influenced AHTN degradation, we individually studied the effects of common water quality parameters in ultrapure water, such as Ca 2 + , Fe 3 + , Fe 2 + , Mn 2 + , Zn 2 + , Cu 2 + , Cl NO 3 , SO 4 2 , PO 4 3 , HCO 3 , and NOM. The degradation of AHTN followed pseudo-first-order kinetics (Figure S11). Table 3 summarizes the rate constants.
As stated above, the direct photolysis and attack of HO• and ClO• caused AHTN degradation. Co-solutes, namely, Ca 2 + , Fe 3 + , Fe 2 + , Mn 2 + , Zn 2 + , Cu 2 + , Cl , NO 3 , SO 4 2 , PO 4 3 , HCO 3 , and NOM, may interfere with AHTN degradation via competition for photons and radicals. Table 4 lists the HO• quenching rates of these co-solutes. Information on the reactions between ClO• and these co-solutes is limited. Comparison of the redox potential of ClO• (1.5–1.8 V [35]) with those of co-solutes will allow speculation of ClO• scavenging by these compounds. Preliminarily, ClO• was assumed to be inert toward Ca 2 + , Fe 3 + , Zn 2 + , Cu 2 + , Cl , NO 3 , SO 4 2 , PO 4 3 , and HCO 3 [38,39]. Reaction kinetics between ClO• and Fe 2 + / Mn 2 + can be obtained from the rate constants of carbonate radical ( CO 3 ) with Fe 2 + / Mn 2 + (k( CO 3 + Mn 2 + ) = 1.5 × 10⁷ M−1·s−1 and k( CO 3 + Fe 2 + ) = 3.6 × 10⁸ M−1·s−1) due to the close redox potentials of these two one-electron oxidants [35]. Regarding the scavenging of ClO• by NOM, a second-order rate constant of 4.5 × 10⁴ (mg·L−1 C)−1·s−1 was reported [40]. Thus, for ClO•, quenching by Fe 2 + / Mn 2 + and NOM needs to be determined.
Addition of 0.4–4 mM Cl caused almost no influence on AHTN degradation (Table 2). Although Cl can scavenge HO• (a primary contributor for AHTN degradation) at a rate of (0.6–5.6) × 106 s−1 (Table 3) to form ClOH (Equation (IX)), ClOH was unstable and rapidly decomposed into HO• and Cl (Equation (XX)). HO•-based AOPs were insensitive to low Cl concentration [43]. Thus, 0.4–4 mM Cl was not expected to exert considerable effect on AHTN degradation.
Similarly, Cl , PO 4 3 , SO 4 2 , and NO 3 at an environmental concentration level almost caused no remarkable influence, as presented in Table 2. Approximately, 16% inhibition was obtained until the concentration of PO 4 3 increased to as high as 1 mM. The weak scavenging of HO• by PO 4 3 , SO 4 2 , and NO 3 (≤~102 s−1, Table 3) compared with that by AHTN (3.2 × 10⁴ s−1, Table 3) can reasonably explain this phenomenon.
HCO 3 can capture HO• ((0.09–8.6) × 104 s−1 for 0.1–10 mM HCO 3 , Table 3) to yield CO 3 , which is a weak oxidant compared with the former. AHTN captured HO• at a rate of 3.2 × 10⁴ s−1. Thus, a considerable proportion of HO• would transform into CO 3 , once HCO 3 concentration increased above a certain threshold. This partial HO• conversion may illustrate the deterioration of degradation efficiency at a higher concentration of HCO 3 (Table 2).
As an important component of drinking water, the dissolved NOM often exerts noticeable effect on the chemical oxidation of pollutants. Table 2 shows the results on AHTN degradation in the presence of NOM. Overall, the degradation process is sensitive toward NOM. The presence of NOM at 0.5 mg·L−1 decreased the degradation efficiency by approximately 10%. NOM reacted with HO• and ClO• at rates of 2.5 × 10⁴ and 4.5 × 10⁴ (mg·L−1 C)−1·s−1, respectively. Thus, 0.5 mg·L−1 NOM showed a scavenging rate of 1.3 × 10⁴ s−1 to HO• and 2.3 × 10⁴ s−1 to ClO•. The results were comparable to the scavenging rate of HO• and ClO• by AHTN (Table 3). By analogy, 50% decrease in reaction rate constant occurred in the presence of 5.0 mg·L−1 NOM.
Regarding the presence of common cations, such as Ca 2 + , Fe 3 + , Fe 2 + , Mn 2 + , Zn 2 + , and Cu 2 + , at concentrations relevant to environmental levels, a subtle inhibition influence on the degradation process was observed (k = 0.0012–0.0015 s−1 and kCB = 0.0016 s−1, Table 2). The influence of solution pH change and ion strength change induced by the introduction of cations was excluded (Table 2). As shown in Figure 6, numerous carbonyl-containing intermediates were produced during the degradation process. These carbonyl-containing intermediates can complex with metal ions. Studies have reported the degradation enhancement of nitrophenolic compounds by HO•-based AOP due to Fe3+ complexation [44]. Variations in oxidation characteristic of pollutants evoked by complexation with cations have been proposed [45]. In other words, metal ion complexation with transformation intermediates may increase the competition with parent molecule toward reactive species, such as HO•. A similar influencing mechanism was speculated to operate herein.
Finally, RDA was performed to screen out principal factors from the above water quality parameters. RDA results indicated that 98.1% of the response variables (gray circles in Figure 9) were explained by the environmental variables. The length of the arrows in the ordination biplot (Figure 9) indicates the relationship strength of the environmental variable and the response variables. The correlation among the variables is positively related to the cosine value of the intersection angles between two arrows. In accordance with these two rules, the five NOM, HCO 3 , Cu 2 + , PO 4 3 , and Fe 2 + considerably influenced the degradation efficiency in the order of NOM > HCO 3 > Cu 2 + > PO 4 3 > Fe 2 + .

4. Conclusions

UV/chlorine AOP degraded AHTN efficiently in accordance with pseudo first-order kinetics. The first-order rate constant in the UV/chlorine AOP were, respectively, 16 and 2.3 times higher than those in chlorination alone and direct UV photolysis under typical chlorine (3.28 mg·L−1) and UV (60 mJ·cm−2) dosage at pH 7. Among the common water matrix components, NOM, HCO 3 , Cu 2 + , PO 4 3 , and Fe 2 + showed a noticeable influence on AHTN degradation by the UV/chlorine AOP. However, other co-solutes, namely, Ca 2 + , Fe 3 + , Mn 2 + , Zn 2 + , Cl , NO 3 , and SO 4 2 , failed to show the same result. AHTN degradation in UV/chlorine AOP was induced by UV photolysis and attack of ClO• and HO•. Formation of chlorinated intermediates was irrelevant under current experimental conditions. Five chlorine-free intermediates were identified. After treatment with UV/chlorine AOP, the toxicity of AHTN mixture weakly increased.

Supplementary Materials

The following are available online at https://www.mdpi.com/2227-9717/7/2/95/s1, Section S1: Determination of effective optical path length. Section S2: Determination of k(HO• + AHTN) and k(RCS + AHTN). Section S3: Determination of εAHTN,254 and ΦAHTN,254. Figure S1: Set-up and construction of photoreactor; Figure S2: Energy output profile of UV lamp. Figure S3: UV Photolysis of H2O2. Figure S4: Degradation of AHTN and NB by (a) PMS oxidation in presence of 10 μM isopropanol and (b) direct UV photolysis. Figure S5: -ln ([AHTN]/[AHTN]0) Vs -ln ([NB]/[NB]0). Figure S6: k ( HO + BA ) k ( HO + BA ) ln ( [ NB ] [ NB ] 0 ) -   ln ( [ BA ] [ BA ] 0 )   Vs   t . Figure S7: Degradation of AHTN and DMOB in the ClO• system. Figure S8: UV absorbance of AHTN at different concentration. Figure S9: Degradation of AHTN corresponding to different absorbed photon. Figure S10: Chromatogram for HPLC of AHTN degradation by (a) FC, (b) UV, and (c) UV/FC. Figure S11: AHTN degradation by UV/FC under various conditions. Table S1: Method detection limits (MDL) of halogenated DBPs.

Author Contributions

Conceptualization, L.W. and X.L.; methodology, X.L.; validation, L.W.; formal analysis, L.W.; investigation, L.W.; resources, X.L.; data curation, L.W.; writing—original draft preparation, L.W.; writing—review and editing, X.L.; visualization, L.W.; supervision, X.L.; project administration, L.W. and X.L.; and funding acquisition, L.W. and X.L.

Funding

This work was financially supported by the Natural Science Foundation of Zhejiang Province (Grant No. LQ19E080023), Jiyang College of Zhejiang A & F University (Grant No. JY2015RC001), and the special S & T project on the treatment and control of water pollution (Grant No. 2017ZX07201-003).

Conflicts of Interest

The authors declare no conflict of interest.

References

  1. Parolini, M.; Magni, S.; Traversi, I.; Villa, S.; Finizio, A.; Binelli, A. Environmentally relevant concentrations of galaxolide (HHCB) and tonalide (AHTN) induced oxidative and genetic damage in Dreissena polymorpha. J. Hazard. Mater. 2015, 285, 1–10. [Google Scholar] [CrossRef] [PubMed]
  2. Bitsch, N.; Dudas, C.; Korner, W.; Failing, K.; Biselli, S.; Rimkus, G.; Brunn, H. Estrogenic activity of musk fragrances detected by the E-screen assay using human MCF-7 cells. Arch. Environ. Contam. Toxicol. 2002, 43, 257–264. [Google Scholar] [CrossRef] [PubMed]
  3. Yamauchi, R.; Ishibashi, H.; Hirano, M.; Mori, T.; Kim, J.W.; Arizono, K. Effects of synthetic polycyclic musks on estrogen receptor, vitellogenin, pregnane X receptor, and cytochrome P450 3A gene expression in the livers of male medaka (Oryzias latipes). Aquat. Toxicol. 2008, 90, 261–268. [Google Scholar] [CrossRef] [PubMed]
  4. Stackelberg, P.E.; Gibs, J.; Furlong, E.T.; Meyer, M.T.; Zaugg, S.D.; Lippincott, R.L. Efficiency of conventional drinking-water-treatment processes in removal of pharmaceuticals and other organic compounds. Sci. Total. Environ. 2007, 377, 255–272. [Google Scholar] [CrossRef] [PubMed]
  5. Li, W.; Nanaboina, V.; Chen, F.; Korshin, G.V. Removal of polycyclic synthetic musks and antineoplastic drugs in ozonated wastewater: Quantitation based on the data of differential spectroscopy. J. Hazard. Mater. 2016, 304, 242–250. [Google Scholar] [CrossRef] [PubMed]
  6. Barışçı, S.; Dimoglo, A. Review on the stability of ferrate (vi) species in aqueous medium and oxidation of pharmaceuticals and personal care products (PPCPs) by ferrate (VI): Identification of transformation by-products. In Ferrites and Ferrates: Chemistry and Applications in Sustainable Energy and Environmental Remediation, 1st ed.; Sharma, V.K., Doong, R.A., Kim, H., Varma, R.S., Dionysiou, D.D., Eds.; American Chemical Society: Washington, DC, USA, 2016; Volume 1238, pp. 287–335. ISBN 9780841231870. [Google Scholar]
  7. Snyder, S.A.; Adham, S.; Redding, A.M.; Cannon, F.S.; DeCarolis, J.; Oppenheimer, J.; Wert, E.C.; Yoon, Y. Role of membranes and activated carbon in the removal of endocrine disruptors and pharmaceuticals. Desalination 2007, 202, 156–181. [Google Scholar] [CrossRef]
  8. Godayol, A.; Gonzalez-Olmos, R.; Sanchez, J.M.; Anticó, E. Assessment of the effect of UV and chlorination in the transformation of fragrances in aqueous samples. Chemosphere 2015, 125, 25–32. [Google Scholar] [CrossRef] [PubMed]
  9. Kong, X.; Jiang, J.; Ma, J.; Yang, Y.; Liu, W.; Liu, Y. Degradation of atrazine by UV/chlorine: Efficiency, influencing factors, and products. Water Res. 2016, 90, 15–23. [Google Scholar] [CrossRef] [PubMed]
  10. Remucal, C.K.; Manley, D. Emerging investigators series: The efficacy of chlorine photolysis as an advanced oxidation process for drinking water treatment. Environ. Sci. Water Res. Technol. 2016, 2, 565–579. [Google Scholar] [CrossRef]
  11. Felis, E.; Alder, A.C.; Surmacz-Gorska, J.; Miksch, K. Advanced oxidation of the polycyclic musk fragrances with using UV and UV/H2O2 processes. Arch. Environ. Prot. 2008, 34, 13–23. [Google Scholar] [CrossRef]
  12. Wang, D.; Bolton, J.R.; Andrews, S.A.; Hofmann, R. Formation of disinfection by-products in the ultraviolet/chlorine advanced oxidation process. Sci. Total. Environ. 2015, 518–519, 49–57. [Google Scholar] [CrossRef] [PubMed]
  13. Zhang, T.; Lin, Y.; Xu, B.; Xia, S.; Tian, F.; Gao, N. Effect of UV irradiation on the proportion of organic chloramines in total chlorine in subsequent chlorination. Chemosphere 2016, 144, 940–947. [Google Scholar] [CrossRef] [PubMed]
  14. Deng, L.; Huang, C.; Wang, Y. Effects of combined UV and chlorine treatment on the formation of trichloronitromethane from amine precursors. Environ. Sci. Technol. 2014, 48, 2697–2705. [Google Scholar] [CrossRef] [PubMed]
  15. Liu, C.; Qiang, Z.; Tian, F.; Zhang, T. Photodegradation of etridiazole by UV radiation during drinking water treatment. Chemosphere 2009, 76, 609–615. [Google Scholar] [CrossRef] [PubMed]
  16. Leenheer, J.A. Comprehensive approach to preparative isolation and fractionation of dissolved organic carbon from natural waters and wastewaters. Environ. Sci. Technol. 1981, 15, 578–587. [Google Scholar] [CrossRef] [PubMed]
  17. Swietlik, J.; Dabrowska, A.; Raczyk-Stanislawiak, U.; Nawrocki, J. Reactivity of natural organic matter fractions with chlorine dioxide and ozone. Water Res. 2004, 38, 547–558. [Google Scholar] [CrossRef] [PubMed]
  18. Rosenfeldt, E.; Linden, K.; Canonica, S.; von Gunten, U. Comparison of the efficiency of OH radical formation during ozonation and the advanced oxidation processes O3/H2O2 and UV/H2O2. Water Res. 2006, 40, 3695–3704. [Google Scholar] [CrossRef] [PubMed]
  19. Guan, Y.; Ma, J.; Li, X.; Fang, J.; Chen, L. Influence of pH on the formation of sulfate and hydroxyl radicals in the UV/peroxymonosulfate system. Environ. Sci. Technol. 2011, 45, 9308–9314. [Google Scholar] [CrossRef] [PubMed]
  20. Fang, J.; Fu, Y.; Shang, C. The roles of reactive species in micropollutant degradation in the UV/free chlorine system. Environ. Sci. Technol. 2014, 48, 1859–1868. [Google Scholar] [CrossRef] [PubMed]
  21. Watts, M.J.; Linden, K.G. Chlorine photolysis and subsequent OH radical production during UV treatment of chlorinated water. Water Res. 2007, 41, 2871–2878. [Google Scholar] [CrossRef] [PubMed]
  22. Zehavi, D.; Rabani, J. Oxidation of aqueous bromide ions by hydroxyl radicals. Pulse radiolytic investigation. J. Phys. Chem. 1972, 76, 312–319. [Google Scholar] [CrossRef]
  23. Kläning, U.K.; Wolff, T. Laser flash photolysis of HCIO, CIO, HBrO, and BrO in aqueous solution. Reactions of Cl and Br Atoms. Berichte der Bunsengesellschaft für Physikalische Chemie 1985, 89, 243–245. [Google Scholar] [CrossRef]
  24. Sun, P.; Lee, W.; Zhang, R.; Huang, C. Degradation of DEET and caffeine under UV/Chlorine and simulated sunlight/chlorine conditions. Environ. Sci. Technol. 2016, 50, 13265–13273. [Google Scholar] [CrossRef] [PubMed]
  25. Buxton, G.V.; Greenstock, C.L.; Helman, W.P.; Ross, A.B. Critical review of rate constants for reactions of hydrated electrons, hydrogen atoms and hydroxyl radicals (•OH/•O) in aqueous solution. J. Phys. Chem. Ref. Data 1988, 17, 513–886. [Google Scholar] [CrossRef]
  26. Molina, M.J.; Ishiwata, T.; Molina, L.T. Production of hydroxyl from photolysis of hypochlorous acid at 307–309 nm. J. Phys. Chem. 1980, 84, 821–826. [Google Scholar] [CrossRef]
  27. Kläning, U.K.; Sehested, K.; Wolff, T. Ozone formation in laser flash photolysis of oxoacids and oxoanions of chlorine and bromine. J. Chem. Soc. Faraday Trans. 1984, 80, 2969–2979. [Google Scholar] [CrossRef]
  28. Jayson, G.; Parsons, B.; Swallow, A.J. Some simple, highly reactive, inorganic chlorine derivatives in aqueous solution. Their formation using pulses of radiation and their role in the mechanism of the Fricke dosimeter. J. Chem. Soc. Faraday Trans. 1973, 69, 1597–1607. [Google Scholar] [CrossRef]
  29. Grigor’ev, A.; Makarov, I.; Pikaev, A. Formation of Cl2 in the bulk of solution during radiolysis of concentrated aqueous solutions of chlorides. Khimiya Vysokikh Ehnergij 1987, 21, 99–102. [Google Scholar]
  30. Grebel, J.E.; Pignatello, J.J.; Mitch, W.A. Effect of halide ions and carbonates on organic contaminant degradation by hydroxyl radical-based advanced oxidation processes in saline Waters. Environ. Sci. Technol. 2010, 44, 6822–6828. [Google Scholar] [CrossRef] [PubMed]
  31. Zuo, Z.; Katsumura, Y.; Ueda, K.; Ishigure, K. Reactions between some inorganic radicals and oxychlorides studied by pulse radiolysis and laser photolysis. J. Chem. Soc. Faraday Trans. 1997, 93, 1885–1891. [Google Scholar] [CrossRef]
  32. Kuhlich, P.; Göstl, R.; Teichert, P.; Piechotta, C.; Nehls, I. Transformations of polycyclic musks AHTN and HHCB upon disinfection with hypochlorite: Two new chlorinated disinfection by-products (CDBP) of AHTN and a possible source for HHCB-lactone. Anal. Bioanal. Chem. 2011, 399, 3579–3588. [Google Scholar] [CrossRef] [PubMed]
  33. Radjenovic, J.; Godehardt, M.; Hein, A.; Farre, M.; Jekel, M.; Barcelo, D. Evidencing generation of persistent ozonation products of antibiotics roxithromycin and trimethoprim. Environ. Sci. Technol. 2009, 43, 6808–6815. [Google Scholar] [CrossRef] [PubMed]
  34. Chen, P.; Linden, K.G.; Hinton, D.E.; Kashiwada, S.; Rosenfeldt, E.J.; Kullman, S.W. Biological assessment of bisphenol A degradation in water following direct photolysis and UV advanced oxidation. Chemosphere 2006, 65, 1094–1102. [Google Scholar] [CrossRef] [PubMed]
  35. Alfassi, Z.B.; Huie, R.E.; Mosseri, S.; Neta, P. Kinetics of one-electron oxidation by the ClO radical. Int. J. Radiat. Appl. Instrum. C 1988, 32, 85–88. [Google Scholar] [CrossRef]
  36. von Sonntag, C. Advanced oxidation processes: Mechanistic aspects. Water Sci. Technol. 2008, 58, 1015–1021. [Google Scholar] [CrossRef] [PubMed]
  37. Cooper, W.J.; Cramer, C.J.; Martin, N.H.; Mezyk, S.P.; O’Shea, K.E.; Sonntag, C.V. Free radical mechanisms for the treatment of methyl tert-butyl ether (MTBE) via advanced oxidation/reductive processes in aqueous solutions. Chem. Rev. 2009, 109, 1302–1345. [Google Scholar] [CrossRef] [PubMed]
  38. Yang, Y.; Pignatello, J.J.; Ma, J.; Mitch, W.A. Comparison of halide impacts on the efficiency of contaminant degradation by sulfate and hydroxyl radical-based advanced oxidation processes (AOPs). Environ. Sci. Technol. 2014, 48, 2344–2351. [Google Scholar] [CrossRef] [PubMed]
  39. Wu, Z.; Fang, J.; Xiang, Y.; Shang, C.; Li, X.; Meng, F.; Yang, X. Roles of reactive chlorine species in trimethoprim degradation in the UV/chlorine process: Kinetics and transformation pathways. Water Res. 2016, 104, 272–282. [Google Scholar] [CrossRef] [PubMed]
  40. Bard, A.J.; Parsons, R.; Jordan, J. (Eds.) Standard Potentials in Aqueous Solution, 1st ed.; Marcel Dekker: New York, NY, USA, 1985; pp. 127–413. ISBN 0-8247-7291-1. [Google Scholar]
  41. Neta, P.; Huie, R.E.; Ross, A.B. Rate constants for reactions of inorganic radicals in aqueous solution. J. Phys. Chem. Ref. Data 1988, 17, 1027–1284. [Google Scholar] [CrossRef]
  42. Guo, K.; Wu, Z.; Shang, C.; Yao, B.; Hou, S.; Yang, X.; Song, W.; Fang, J. Radical chemistry and structural relationships of PPCP degradation by UV/Chlorine treatment in simulated drinking water. Environ. Sci. Technol. 2017, 51, 10431–10439. [Google Scholar] [CrossRef] [PubMed]
  43. Piscopo, A.; Robert, D.; Weber, J.V. Influence of pH and chloride anion on the photocatalytic degradation of organic compounds. Appl. Catal. B Environ. 2001, 35, 117–124. [Google Scholar] [CrossRef]
  44. Abe, K.; Tanaka, K. Effect of Fe3+ on UV-illuminated ozonation of nitrophenolic compounds. Chemosphere 1999, 38, 2747–2752. [Google Scholar] [CrossRef]
  45. Wang, H.; Yao, H.; Sun, P.; Li, D.; Huang, C. Transformation of tetracycline antibiotics and Fe (II) and Fe (III) species induced by their complexation. Environ. Sci. Technol. 2015, 50, 145–153. [Google Scholar] [CrossRef] [PubMed]
Figure 1. Degradation efficiency of tonalide (AHTN) by UV photolysis, chlorine, and UV/FC ([AHTN]0 = 1.0 mg·L−1, pH = 7.0, 25 ± 1 °C, and UV dose 60 mJ·cm−2).
Processes 07 00095 g001
Figure 2. Degradation of AHTN by UV/FC—(a) first-order kinetic fitting and (b) contribution analysis of relevant contributors ([AHTN]0 = 1.0 mg·L−1; pH = 7.0; 25 ± 1 °C; [FC]0 = 3.28 mg·L−1; [ Cl ]0 = 0.02 mM; and UV fluence rate 0.067 mW·cm−2).
Processes 07 00095 g002
Figure 3. Derivative electron paramagnetic resonance (EPR) spectra of samples collected from (a) control blank (1 g·L−1 DMPO solution) and (b) UV/FC system ([AHTN]0 = 1.0 mg·L−1; [FC]0 = 3.28 mg·L−1; pH = 7.0; and 25 ± 1 °C).
Processes 07 00095 g003
Figure 4. Mass balance of chlorine element during AHTN degradation by UV/FC ([AHTN]0 = 1.0 mg·L−1; [FC]0 = 3.28 mg·L−1; pH = 7.0; and 25 ± 1 °C).
Processes 07 00095 g004
Figure 5. Toxicity evolution for AHTN degradation by UV, FC, and UV/FC ([AHTN]0 = 1.0 mg·L−1; pH = 7.0; 25 ± 1 °C; and [FC]0 = 3.28 mg·L−1).
Processes 07 00095 g005
Figure 6. Degradation pathway of AHTN by UV/chlorine process ([AHTN]0 = 1.0 mg·L−1; pH = 7.0; 25 ± 1 °C; and [FC]0 = 3.28 mg·L−1).
Processes 07 00095 g006
Figure 7. ∆[ Cl ] + ∆[ ClO 2 ] + ∆[ ClO 3 ] versus ∆[FC] during AHTN degradation by UV/FC ([AHTN]0 = 1.0 mg·L−1; [FC]0 = 3.28 mg·L−1; pH = 7.0; and 25 ± 1 °C).
Processes 07 00095 g007
Figure 8. Degradation of AHTN by UV/FC under conditions relevant to tap water ([AHTN]0 = 1.0 mg·L−1; pH = 7.0; 25 ± 1 °C; and [FC]0 = 3.28 mg·L−1).
Processes 07 00095 g008
Figure 9. Redundancy analysis (RDA) analysis of influence of investigated water matrices.
Processes 07 00095 g009
Table 1. Principal reactions in the ultraviolet irradiation of free chlorine (UV/FC) system.
EquationsReactionRate ConstantReference
(I)HOCl ⇌ OCl + H + pKa1 = 7.5[20]
(II)HOCl + hv → HO• + Cl•ΦHO• = 1.45[21]
(III) OCl + hv O + Cl•ΦOCl− = 0.97[20]
(IV) OCl + hv → O(1D) + ClΦO(1D) = 0.133[10]
(V) OCl + hv → O(3P) + ClΦO(3P)• = 0.074[10]
(VI)HO• → O + H + pKa1 = 11.9[20]
(VII)HO• + HOCl → ClO• + H2Ok7 = 2.0 × 10⁹ M−1·s−1[20]
(VIII)HO• + OCl → ClO• + OH k8 = 8.8 × 10⁹ M−1·s−1[20]
(IX)HO• + Cl ClOH k9 = 4.3 × 10⁹ M−1·s−1[10]
(X)HO• + OH O + H2Ok10 = 1.3 × 10¹⁰ M−1·s−1[20]
(XI)Cl• + HOCl → ClO• + H + + Cl k11 = 3.0 × 10⁹ M−1·s−1[20]
(XII)Cl• + OCl → ClO• + Cl k12 = 8.2 × 10⁹ M−1·s−1[22]
(XIII)Cl• + Cl Cl 2 k13 = 6.5 × 10⁹ M−1·s−1[23]
(XIV)Cl• + H2O → ClOH + H + k14 = 4.5 × 10³ M−1·s−1[24]
(XV) O + H2O → HO• + OH k15 = 1.8 × 10⁶ M−1·s−1[25]
(XVI)O(1D) + H2O → 2 HO•k16 = 1.2 × 10¹¹ M−1·s−1[26]
(XVII)O(3P) + O2 →O3k17 = 4.0 × 10⁹ M−1·s−1[27]
(XVIII)O(3P) + OCl ClO 2 k18 = 9.4 × 10⁹ M−1·s−1[27]
(XIX) Cl 2 → Cl• + Cl K19 = 1.1 × 10⁵ M−1·s−1[28]
(XX) ClOH → HO• + Cl k20 = 6.1 × 10⁹ M−1·s−1[23]
(XXI) ClOH + Cl Cl 2 + OH k21 = 1.0 × 10⁵ M−1·s−1[29]
(XXII) ClOH + H + → Cl• + H2OK22 = 2.1 × 10¹⁰ M−1·s−1[23]
(XXIII)2ClO• + H2O →HOCl + H + + ClO 2 k23 = 2.5 × 10⁹· s−1[23]
(XXIV)HO• + CO 3 2 CO 3 + OH k24 = 3.9 × 10⁸ M−1·s−1[30]
(XXV)HO• + HCO 3 CO 3 + H2Ok25 = 8.6 × 10⁶ M−1·s−1[25]
(XXVI)HO• + ClO 2 ClO 2 + OH k26 = 6.3 × 10⁹ M−1·s−1[31]
(XXVII)HO• + ClO 2 ClO 3 + H + k27 = 4.0 × 10⁹ M−1·s−1[31]
Table 2. Water quality of the waters collected from filtered water (FW).
Water MatricesUnitsFW1#FW2#FW3#
pH--7.156.687.47
TOCmg·L−11.934.008.77
HCO 3 mg·L−17.895.8912.83
PO 4 3 mg·L−1NDNDND
Cl mg·L−115.718.9134.69
NO 3 mg·L−19.398.493.90
UV254cm−1·(mg·L−1)−10.0150.0030.029
SO 4 2 mg·L−118.3311.3522.41
Ca 2 + mg·L−17.229.5210.36
Mn 2 + mg·L−10.0120.0070.006
Cu 2 + mg·L−10.0760.001ND
Zn 2 + mg·L−11.230.0340.022
Total Femg·L−10.160.140.061
Table 3. Pseudo-first-order rate constants for AHTN degradation by UV/FC under various conditions.
Varying ParametersConcentration* Ionic Strength (×10−5 M)∆pHk (s−1)R2
Ca 2 + (mM, as CaCl)0.2600.010.00140.997
1.03000.010.00130.997
2.09000.010.00140.999
Cl (mM, as NaCl)0.5500.010.00140.999
1.01000.010.00130.998
4.04000.010.00140.999
Cu 2 + (μM, as CuCl2)0.60.180.010.00150.994
1.80.540.010.00140.997
3.00.90.010.00150.998
NOM (mg·L−1)0.500.00120.999
1.000.00110.998
2.000.00100.999
5.000.00070.997
Fe 2 + (mM, as FeCl2)0.0010.30.010.00150.998
0.0020.60.010.00140.998
0.0041.20.010.00140.999
Fe 3 + (mM, as FeCl3)0.0010.60.010.00150.999
0.0021.2−0.040.00130.996
0.0042.40.010.00120.995
HCO 3 (mM, as NaHCO3)0.1100.010.00130.998
0.5500.010.00120.994
1.01000.010.00120.993
2.02000.010.00130.998
4.04000.010.00130.990
10.010000.010.00090.996
Mn 2 + (μM, as MnCl2)0.50.150.010.00150.999
1.00.30.010.00140.998
2.00.60.010.00140.999
NO 3 (mM, as NaNO3)0.0550.010.00150.996
0.1100.010.00120.998
0.15150.010.00130.999
1.01000.010.00130.999
PO 4 3 (μM, as Na3PO4)0.10.060.010.00130.999
0.20.120.010.00140.998
0.40.240.010.00140.997
1.00.60.010.00100.996
SO 4 2 (mM, as Na2SO4)0.2600.010.00130.996
0.41200.010.00140.998
0.61800.010.00120.997
1.03000.010.00100.994
Zn 2 + (μM as ZnCl2)4.01.20.010.00130.998
8.02.40.010.00140.998
12.03.60.010.00140.999
* Ionic strength of borate buffer (54 mM) is not included.
Table 4. Scavenging rate of hydroxyl radical (HO•) by AHTN and water matrices.
Water MatricesConcentration (C)Reaction Rate Constant with HO• (k)Scavenging Rate (C × k)
AHTN1.0 mg·L−18.3 × 10⁹ M−1·s−1 (this work)3.2 × 10⁴ s−1
Cl 0.4–4 mM1.4 × 109 M−1·s−1 ([10])(0.6–5.6) × 106 s−1
PO 4 3 *0.1–1000 μM1.5 × 105 M−1·s−1 (HPO42−, [25])(0.007–1.0) s−1
2.0 × 10⁴ M−1·s−1 (H2PO4, [25])
NO 3 0.05–1 mM< 1.0 × 10⁵ M−1·s−1<(0.05–1.0) × 102 s−1
HCO 3 **0.1–4 mM8.6 × 106 M−1·s−1 ( HCO 3 , [41])(0.07–2.9) × 104 s−1
<1.0 × 10⁶ M−1·s−1 ( H 2 CO 3 , [25])
SO 4 2 0.2–1 mM6.9 × 105 M−1·s−1 ( HSO 4 2 , [25])≤ ~102 s−1
NOM0.5–5 mg·L−12.5 × 10⁴ (mg·L−1)−1·s−1 ([42])(1.3–13) × 104 s−1
Cu 2 + 0.6–3 μM3.5 × 108 M−1·s−1 ([25])(0.21–1.1) × 103 s−1
Fe 2 + 1–3 μM3.2 × 108 M−1·s−1 ([25])(3.2–9.6) × 102 s−1
Fe 3 + 1–4 μMNA
Mn 2 + 0.5–2 μM2.9 × 107 M−1·s−1 ([25])(1.5–5.8) × 101 s−1
Zn 2 + 4–12 μM<5.0 × 10⁵ M−1·s−1 ([25])<(2–6) s−1
Ca 2 + 0.2–3 mMNA
HOCl ***46.2 μM2.0 × 109 M−1·s−1 (HOCl, [20])1.7 × 10⁵ M−1·s−1
8.8 × 10⁹ M−1·s−1 (OCl, [20])
* 61.7% HPO 4 2 and 38.3% H 2 PO 4 at pH = 7; ** 81.7% HCO 3 and 18.3% H 2 CO 3 at pH = 7; and *** 76.0% HOCl and 24.0% OCl at pH = 7.

