Article

Experimental Study on Mixed Mode Fracture Behavior of Sandstone under Water–Rock Interactions

1
MOE Key Laboratory of Deep Earth Science and Engineering, College of Architecture and Environment, Sichuan University, Chengdu 610065, China
2
Failure Mechanics and Engineering Disaster Prevention and Mitigation Key Laboratory of Sichuan Province, Sichuan University, Chengdu 610065, China
*
Author to whom correspondence should be addressed.
Processes 2019, 7(2), 70; https://doi.org/10.3390/pr7020070
Submission received: 24 December 2018 / Revised: 25 January 2019 / Accepted: 26 January 2019 / Published: 1 February 2019
(This article belongs to the Special Issue Fluid Flow in Fractured Porous Media)

Abstract

:
Water–rock interactions can significantly deteriorate the physical and mechanical properties of rocks, and it has been identified as one of the significant factors influencing the stability and safety of structures in rock–soil engineering. In this study, the fracture mechanical properties of sandstone under periodic water–rock interactions and long-term immersion have been studied with central cracked Brazilian disk specimens. The degradation mechanism of water–rock interactions was also studied using a scanning electron microscope (SEM). Finally, the generalized maximum tangential stress and generalized maximum tangential strain criteria were adopted to evaluate the experimental results. The results show that periodic water–rock interactions can remarkably affect the fracture resistance of sandstone. With the increase in the number of cycles, the pure mode I, pure mode II, and mixed mode fracture toughness decreases greatly, however, the values of KIf/KIC and KIIf/KIC decrease slightly. Furthermore, the fracture resistance of sandstone influenced by cyclic wetting–drying is more significant than long-term immersion. Moreover, the fracture criteria, which considers the effect of T-stress, can reproduce the test results very well.

1. Introduction

In engineering practices, such as tunneling, mining, oil and gas exploration, and excavation, the deformation and failure of rock materials is generally accompanied with water. These failures are strongly associated with water–rock interactions, such that many geological disasters like earthquakes, debris flow, landslides, and ground subsidence, have occurred in recent years. Water–rock interactions can significantly deteriorate the physical and mechanical properties of rocks, and they have been identified as one of the significant factors influencing the stability and safety of structures in rock–soil engineering and tunnel engineering [1,2,3].
In recent years, several studies on water content affecting the mechanical properties of different types of rocks, including uniaxial compressive strength, cohesion resistance, tensile strength, and fracture resistance, have been conducted by researchers [4,5,6,7,8,9,10,11,12]. The results showed that even if the water content had a small increment, it might make the strength and stiffness of the rocks reduce remarkably, which means that the water content could significantly degrade the mechanical properties of rock materials. Furthermore, the subcritical crack growth of sandstone and igneous rock affected by the relative humidity was studied by Nara et al. [13,14]. Tang et al. [15] performed numerous fracture tests with three-point bending samples so as to investigate the change of rules of the mode I fracture resistance of different types of rocks after soaking in a hydrochemical solution. Li et al. [16] also studied the deformation and strength properties of rock in an acid solution, and proposed a chemical damage model to predict the degradation of the rock strength and deformability.
In addition to the short or long term immersion, rock masses may also be subjected to periodic drying and wetting because of rain or changes in the groundwater level. Therefore, several experimental studies on periodic wetting–drying affecting the physical and mechanical properties of rocks have been performed in recent decades [17,18,19,20,21,22,23,24,25,26]. In addition, Yuan and Ma [27], and Zhou et al. [28,29] studied the dynamic mechanical behavior of selected sandstones under cyclic wetting–drying. The cyclic wetting–drying and freezing–thawing effects on some of the mechanical parameters of the selected rock materials were studied by Hale and Shakoor [30], Khanlari and Abdilor [31], and Özbek [32]. Moreover, Li and Zhang [33] proposed a damage model, which considered the wetting and drying effect, to characterize the variation in the uniaxial compressive stress–strain for sandstone. Liu et al. [34] analyzed the strength deterioration and the variations in the micro-structures of the shaly sandstone samples under wetting–drying cycles by using the PFC2D (particle flow code in two-dimensions) software. More recently, Zhao et al. [35] performed Brazilian disk splitting tests to study the influence of long-term soaking and periodic wetting and drying on the tensile strength of a selected rock.
It was found that the deterioration effects of periodic wetting–drying on different mechanical parameters for the same rock were significantly different. However, there was a common viewpoint that the strength of the rock would degrade after periodic wetting–drying, and the damage to the rocks was irreversible and progressive. The mechanical parameters in the aforementioned studies were mainly compressive strength, cohesion resistance, tensile strength, shear strength, and so on. However, studies on the fracture mechanical properties of the rocks affected by periodic water–rock interactions and long-term immersion are scarce [1,2,3,9,15,36]. It has not yet been incompletely understood how the mixed mode fracture behavior of rocks is influenced by periodic water–rock interactions and long-term immersion. In particular, the differences between the degradation effects of these two occurrences have not been entirely clarified.
The purpose of this study is to examine how the mixed mode fracture resistance of sandstone is influenced by periodic water–rock interactions and long-term immersion using central cracked Brazilian disk (CCBD) specimens. The degradation mechanism of water–rock interactions was also studied using a scanning electron microscope (SEM) in this research. Furthermore, the generalized maximum tangential stress (GMTS) and generalized maximum tangential strain (GMTSN) criteria were adopted to evaluate the experimental results.

2. Materials and Methods

There are many experimental methods and test configurations to determine the fracture resistance of brittle or quasi-brittle materials. Some well-known test configurations are the CCBD specimen, semi-circular bend specimen, compact tension shear specimen, edge cracked four-point bend beam specimen, notched three-point bend specimen, inclined center crack plate, and so on. Among these specimens, the CCBD specimen is frequently used to conduct mixed mode fracture tests on rock materials, owing to the existence of analytical expressions for stress intensity factors and the easy realization of complete mode combinations of mode I and mode II [37,38,39]. In addition, the cracked chevron notched Brazilian disc specimen, which is one of the CCBD specimens, has been suggested by the International Society for Rock Mechanics (ISRM) for determining the pure mode I fracture toughness of rocks [40]. In this research, the CCBD specimen is employed for measuring the mixed mode fracture resistance of sandstone under cyclic wetting–drying and long-term immersion conditions.

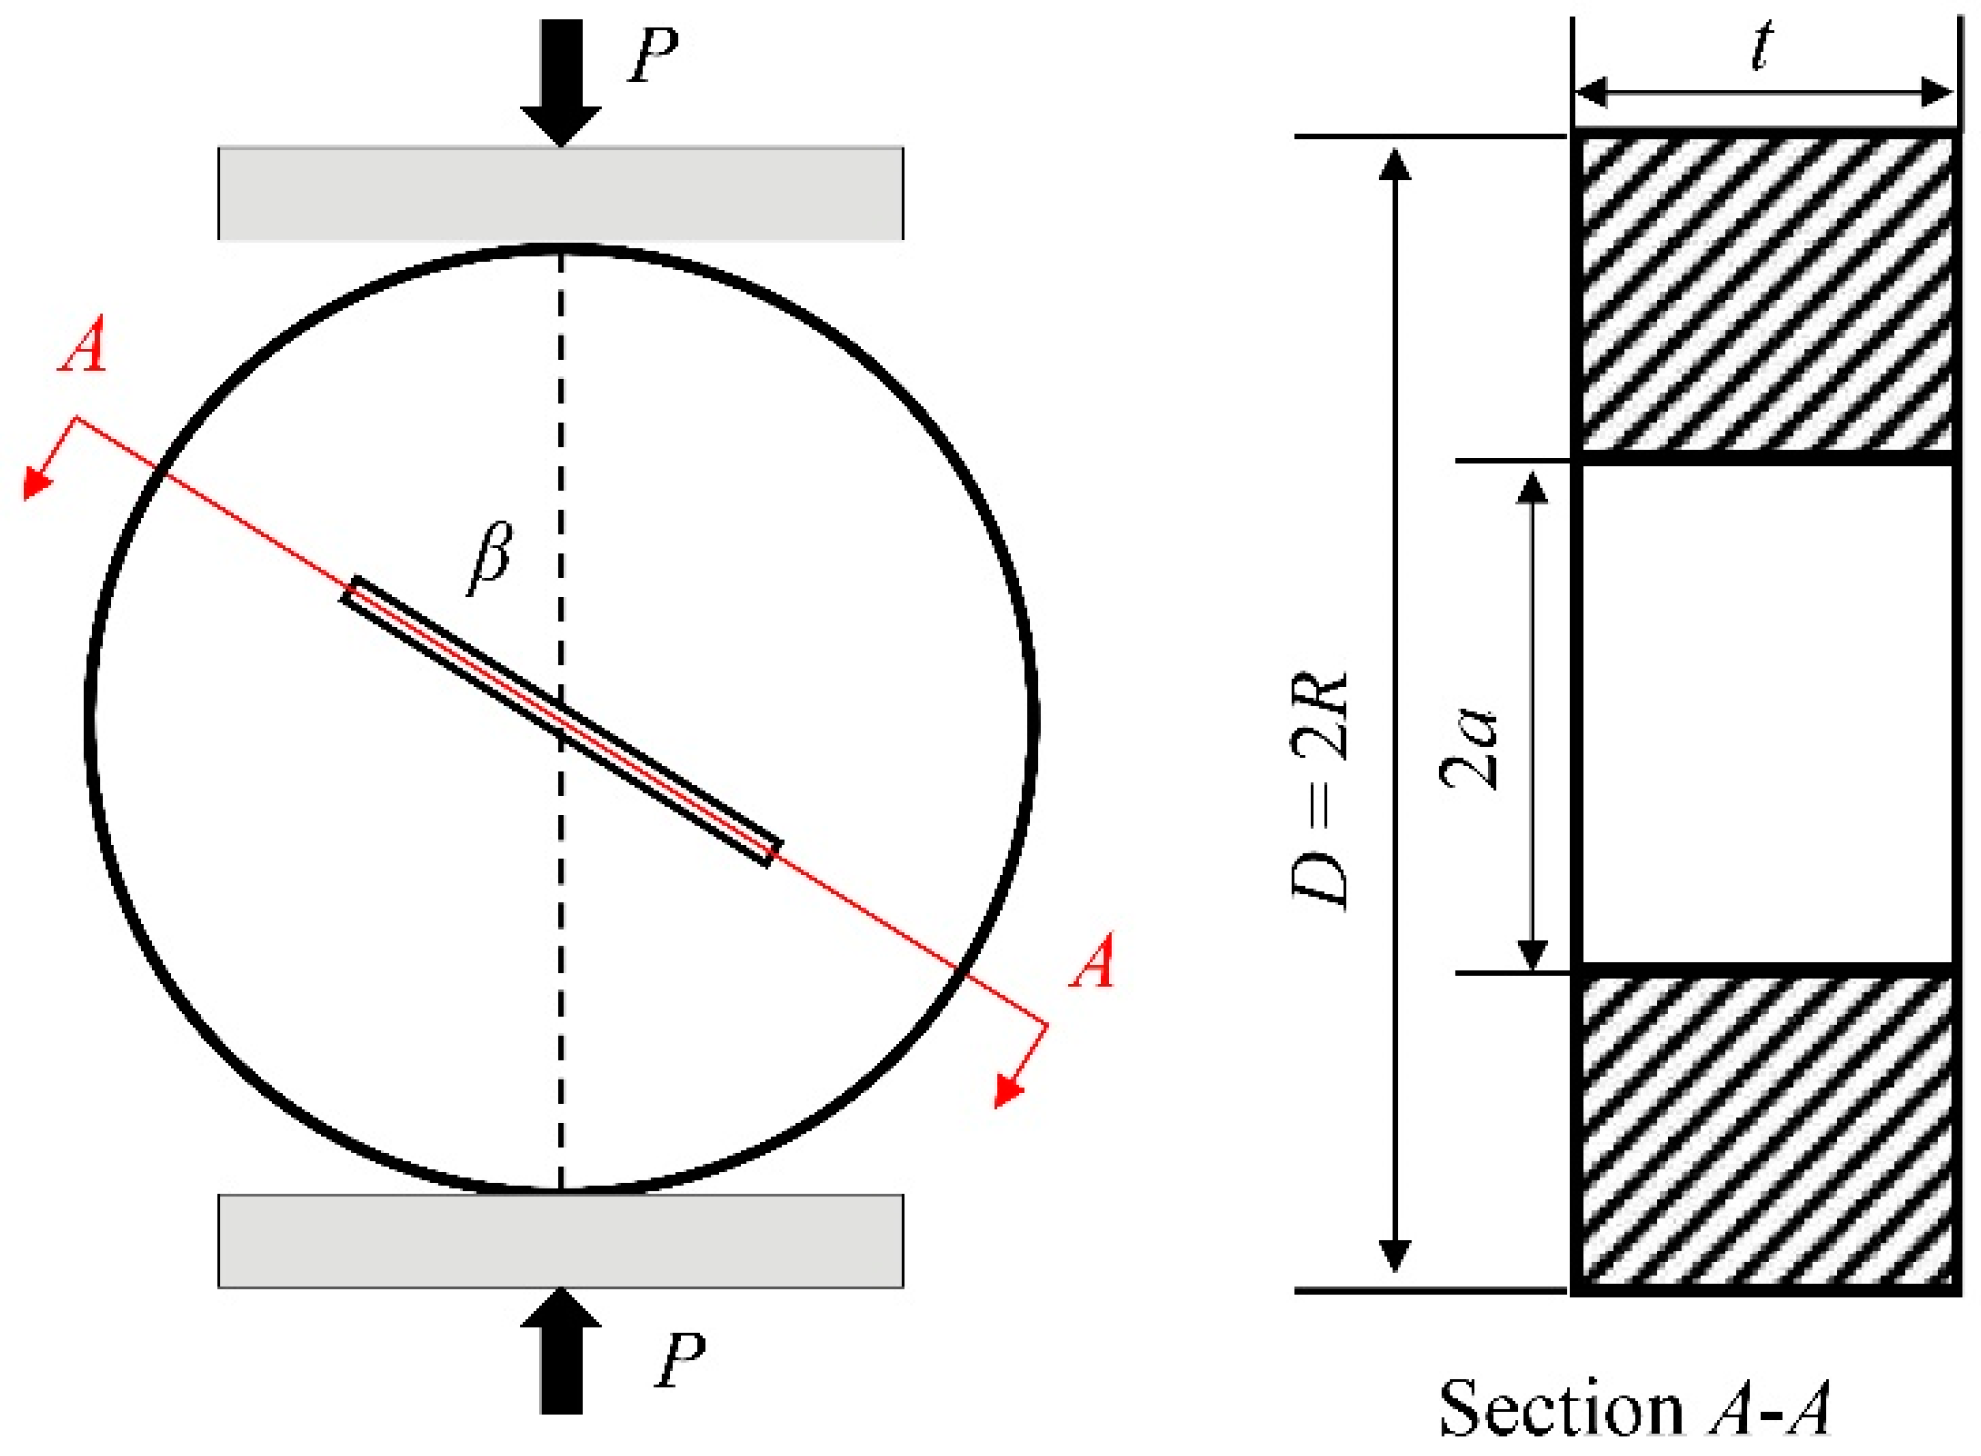
2.1. Stress Intensity Factors for the CCBD Specimens

Figure 1 represents a diagram of the CCBD specimen with thickness t and diameter D subjected to radial load P. The initial crack length in the Brazilian disk is represented by 2a, and the loading angle is β. The analytical expressions of the mode I and mode II stress intensity factors KI and KII were deduced by Dong et al. [41], as follows:
K I = σ π a Y I = σ π a [ f 11 + 2 i = 1 n A 1 i f 1 i α 2 ( i 1 ) ]
K II = σ π a Y II = σ π a [ 2 i = 1 n A 2 i f 2 i α 2 ( i 1 ) ]
where α = a/R; σ = P/(πtR); and YI, YII are the normalized forms of KI and KII, respectively. The coefficients fji and Aji (i = 1, 2, 3, ⋯n; j = 1, 2) in the above expressions can be found in the paper by Dong et al. [41]. According to the authors of [1,41], the sum coefficient n = 100 is adopted to ensure the calculating precision of stress intensity factors in this paper.

2.2. Sample Preparation and Testing Procedure

In this study, all of the sandstone specimens were extracted from the same rock mass with fine particles and good homogeneity, which came from Ziyang City, Sichuan Province, China. The main mineralogical compositions of the selected sandstone were quartz, clinochlore, albite, and gordonite, according to the X-ray diffraction (XRD, PANalytical B.V., Almelo, The Netherlands) analyses. The sandstone had a moisture content of 1.20%, dry density of 2.24 g/cm3, water absorption of 6.18%, Poisson’s ratio of 0.21, and tensile strength of 2.68 MPa. In addition, the microstructure of the intact sandstone was observed using SEM (JEOL, Tokyo, Japan). It showed many pores, faults, and micro-cracks in the intact sandstone (Figure 2), which enabled the occurrence of water–rock interactions [3].
The CCBD specimen was employed for measuring the mixed mode fracture resistance of sandstone under water–rock interactions. The nominal diameter and thickness of the CCBD specimen were 75 mm and 25 mm, respectively. According to the analysis of Dong [42], a relative crack length a/R ranging from 0.4 to 0.6, is recommended to conduct a fracture test with a CCBD specimen. Therefore, a relative crack length of 0.5 for all the CCBD specimens was considered. According to Dong et al. [41], the pure mode I crack could be achieved when the loading angle was 0°. Moreover, the loading angle was 23° for a pure mode II crack when a/R = 0.5. Hence, when adjusting the loading angle from 0° to 23°, the complete mode combinations of mode I and mode II can be conveniently obtained. In this study, four different scenarios with the CCBD specimens loaded by 0°, 10°, 15°, and 23° were considered for the fracture tests.
Water–rock interactions were performed under the following two different treatment conditions: cyclic wetting–drying and long-term immersion. In each wetting–drying cycle, the sandstone samples were completely submerged in water for two days in order to reach the saturated state at atmospheric conditions. The specimens were then removed and heated in an oven at 105 °C for one day, and subsequently, the samples were cooled to an atmospheric temperature [3,22,30]. However, for the long-term immersion, it was considered as a single cycle when the sandstone samples were completely soaked in water for three days. The sandstone specimens were subjected to three and seven cycles with these two treatment approaches, respectively. After the samples underwent the required number of cycles, they were once again completely submerged in water for two days for fracture tests. It should be noted that the intact sandstone specimens soaked in water for only two days were considered to have undergone no cycle. In addition, the intact sandstone samples that did not undergo any treatment were also measured in this study.
The fracture experiments were performed with an electronic universal material testing machine (Shenzhen Reger Instrument, Shenzhen, China) for loading at a rate of 0.05 mm/min for all of the samples [43,44,45,46]. At least four CCBD specimens of sandstone in each group were successfully measured. During each test, the load–deformation behavior of the sandstone specimen from initial loading to final failure were completely recorded by the testing system. Figure 3 represents the failure modes of some of the sandstone specimens after undergoing water–rock interactions. It is observed that the crack propagation path is always along the initial crack line when the loading angle is 0° (pure mode I). However, when the CCBD specimens are under pure mode II or mixed mode loading, the crack extends in the direction deviating from the initial crack.

3. Experimental Results and Discussion

3.1. Water–Rock Interactions Affecting Fracture Resistance of Sandstone

Many fracture tests have been performed on sandstone under periodic water–rock interactions and long-term immersion with CCBD specimens. The fracture toughness of the sandstone samples determined from Equations (1) and (2) are listed in Table 1. Moreover, the averaged values of the pure mode I, pure mode II, and mixed mode fracture toughness of this sandstone are shown in Figure 4. It is observed that the mean values of the pure mode II fracture toughness are always greater than those of pure mode I for the sandstone samples under the same treatment conditions. This is very similar to the experimental results obtained with the CCBD specimens reported in the literature [43,47,48,49]. In addition, the pure mode I, pure mode II, and mixed mode fracture toughness of the intact sandstone are always larger than those of the sandstone after undergoing water–rock interactions. This is mainly because the sandstone samples are in a water-saturated state after undergoing water–rock interactions, and the water content within the sandstone is very high, which has been identified as an important factor for lowering the strength of rocks [8,9,10].
As observed in Figure 4, the pure mode I, pure mode II, and mixed mode fracture toughness of the sandstone samples decrease with the increase in the number of cycles under both cyclic wetting–drying and long-term immersion conditions. For the sandstone samples under cyclic wetting–drying, when the samples undergo none, three, and seven cycles, the mean values of the pure mode I and pure mode II fracture toughness are 0.232, 0.174, and 0.148 MPa m0.5; and 0.341, 0.246, and 0.204 MPa m0.5, respectively. The pure mode I fracture toughness decreases by 25.0% for the three-cycle case and 36.2% for the seven-cycle case compared with those of the saturated sandstone (no cycle). The pure mode II fracture toughness decreases by 27.9% and 40.2% after cyclic wetting–drying for the three-cycle and seven-cycle cases, respectively. This indicates that the pure mode II fracture toughness influenced by cyclic wetting–drying is more significant than the pure mode I fracture toughness.
For the sandstone samples under long-term immersion conditions, when the samples undergo three and seven cycles, the pure mode I fracture toughness is 0.187 and 0.173 MPa m0.5, respectively, which decrease by 19.4% and 25.4%, respectively, after water–rock interactions. However, the pure mode II fracture toughness corresponding to three and seven cycles are 0.267 and 0.247 MPa m0.5, respectively, which decrease by 21.7% and 27.6%, respectively. These values show that the effect on the pure mode II fracture toughness under long-term immersion is more significant, which is similar to the treatment condition of cyclic wetting–drying. After three cycles, the pure mode I and pure mode II fracture toughness of sandstone under long-term immersion decrease by 19.4% and 21.7%, respectively, which are smaller than the corresponding values of 25.0% and 27.9%, respectively, under cyclic wetting–drying. A similar phenomena is also observed when the number of cycles is seven. In conclusion, the fracture resistance of sandstone is more significantly affected by cyclic wetting–drying than long-term immersion.
In order to compare the mixed mode fracture toughness of sandstone conveniently, the concept of effective fracture toughness (Keff) is introduced, and it can be calculated by the following formula [3,50,51]:
K eff = K I 2 + K II 2
Figure 5 shows the effective fracture toughness of the sandstone samples under long-term immersion and cyclic wetting–drying conditions. As seen from Figure 5, the values of Keff for sandstone under four different loading angles always decrease with the increasing number of cycles in both cyclic wetting–drying and long-term immersion conditions. When the sandstone samples with a loading angle of 10° undergo none, three, and seven wetting–drying cycles, the effective fracture toughness values Keff are 0.283, 0.206, and 0.173 MPa m0.5, respectively, which are reduced by 27.3% and 38.8%, respectively, compared with the saturated sandstone. However, for the sandstone samples loaded by 15°, the values of Keff decrease by 26.0% and 37.3% after undergoing three and seven cycles, respectively. Furthermore, after seven wetting–drying cycles, when the loading angle changes from 0° (pure mode I), 10°, 15°, and 23° (pure mode II), the effective fracture toughness Keff decreases by 36.2%, 38.8%, 37.3%, and 40.2%, respectively. It shows that the degradation effect on pure mode II and mixed mode fracture toughness is more significant, which has also been reported by Hua et al. [3] for another type of rock.
For the sandstone samples with a loading angle of 10° under long-term immersion, the effective fracture toughness Keff corresponding to three and seven cycles are 0.215 and 0.197 MPa m0.5, respectively, which are reduced by 24.0% and 30.3%, respectively, when compared with the saturated sandstone. For the case of 15°, the values of Keff corresponding to three and seven cycles are reduced by 21.2% and 27.0%, respectively, for sandstone under long-term immersion. In addition, it is observed that the degradation effect of long-term immersion on pure mode I fracture toughness is the weakest, which is very similar to the cyclic wetting–drying process.
Moreover, in Figure 5, the values of Keff for sandstone under long-term immersion are always larger than that under cyclic wetting–drying for the same number of cycles (except for no cycle). For example, when the sandstone is loaded by 10°, the values of Keff for sandstone under long-term immersion and cyclic wetting–drying are 0.215 and 0.206 MPa m0.5, respectively, after undergoing three cycles each. Furthermore, for the case of 15°, the reduction of Keff for sandstone undergoing seven wetting–drying cycles is approximately 37.3%, which is larger than the corresponding value of 27.0% under long-term immersion. This behavior is similar for the other loading angles of 0° and 23°. Hence, we can conclude that the fracture resistance of sandstone influenced by cyclic wetting–drying is more significant when compared with the case of long-term immersion.

3.2. The Degradation Mechanism of Water–Rock Interactions

As we known, the mechanical properties of rocks are closely associated with the mineralogical compositions and microstructure [3,28,34]. SEM is used to observe the changing regularity of the microstructure of the sandstone samples under the two treatment conditions of long-term immersion and cyclic wetting–drying. Figure 6 shows the photomicrographs at ×500 magnification for the sandstone samples undergoing three and seven cycles under the two treatment conditions. As shown in Figure 6a, the pores between the mineral particles increased gradually, and some particle structures tended to be loose. The new secondary micro-cracks appeared along the boundary of the mineral particles after three cycles. Furthermore, the exfoliated particles increased and the pore size of the sandstone sample increased gradually after seven cycles, which is observed in Figure 6b. When the samples were immersed in an aqueous solution, the water molecules moved gradually towards the interior of the rock mass owing to the pores, micro-cracks, faults, and the contact surfaces between the mineral particles. Furthermore, the aqueous solution could dissolve some soluble minerals and cements of the sandstone, increase the porosity (or water content), and consequently reduce the cohesive force between the mineral particles.
The treatment procedure of cyclic wetting–drying in this experiment actually included not only wetting and drying, but also heating and cooling processes. After soaking, the sandstone samples were heated in an oven. Heating the sandstone samples directly might induce thermal damage to the sandstone, and this thermal damage to the rock was very large because of the higher water content in the sandstone after the wetting procedure. The presence of water in the rocks is considered a precondition for the occurrence of heating and cooling degradation [30]. The efficacy of heating degradation of the moisture-laden rock stems, in part, from the ability of the heated water to mobilize the soluble minerals towards the rock surface, resulting in the increased porosity of the rock. In addition, owing to the different thermal expansion coefficients of various minerals of sandstone, the mineral particles expanded and squeezed with each other when the sandstone samples were heated, however, the mineral particles contracted during the cooling process [3]. These processes led to the propagation of the micro-cracks and pores between the mineral particles, or produced new secondary micro-cracks (see Figure 6c,d).
It can be also found from Figure 6 that the size and quantity of the micro-cracks (or pores) between the mineral particles under the treatment condition of cyclic wetting–drying increased more significantly when compared with long-term immersion with the same number of cycles. This indicates that the degradation effect of cyclic wetting–drying was more remarkable than the long-term immersion, which is completely consistent with the test results. In short, the water–rock interaction was a gradual process of physical and chemical damage accumulation, which dissolved some soluble minerals and cements, reduced the adhesive forces between the mineral particles, made the micro-cracks and pores between the mineral particles propagate or produce new secondary micro-cracks, and consequently changed the microstructure of the sandstone. These changes in the microstructure characteristics were the basic reasons for the weakening of the fracture resistance of the sandstone.

4. Analysis According to the GMTSN Criterion

The GMTSN criterion was developed by considering the influence of T-stress on the maximum tangential strain (MTSN) criterion [52], which was primitively put forward by Ayatollahi and Abbasi [53]. Mirsayar [54] proposed a similar strain-based criterion and employed it to evaluate the fracture mechanical behavior of polymethyl methacrylate. Hua et al. [50] extended the GMTSN criterion by considering both plane strain and plane stress conditions, and made use of it to evaluate the brittle fracture behaviors of the CCBD specimens made of graphite and rock materials. More recently, the GMTSN criterion has been frequently employed to evaluate the onset of the fracture of different materials [51,55,56,57]. Based on the GMTSN criterion [50,53,54], the crack initiation angle (θ0) can be calculated using the following formula:
Y I [ ( 5 8 κ ) sin θ 0 2 3 sin 3 θ 0 2 ] + Y II [ ( 5 8 κ ) cos θ 0 2 9 cos 3 θ 0 2 ] + 8 2 r 0 a T * sin 2 θ 0 = 0
Here, YI and YII are the normalized forms of KI and KII, respectively; T * = T / σ is the normalized T-stress; a is half of the crack length; and r0 is the critical distance around the crack tip. Moreover, κ is a coefficient for distinguishing the plane strain or plane stress condition, which is associated with the Poisson’s ratio ν. For the plane stress problems, the value of the coefficient κ is equal to 1/(1 + ν), whereas its value is 1 − ν for the plane strain problems [50]. Similarly, based on the GMTSN criterion [50], the onset of brittle fracture can be determined from the following equations:
K If K IC = ( 2 κ 1 ) + T I * Y I 0 2 r 0 a ( κ 1 ) f 1 ( θ 0 ) + Y II Y I f 2 ( θ 0 ) + T * Y I 2 r 0 a f 3 ( θ 0 )
K IIf K IC = ( 2 κ 1 ) + T I * Y I 0 2 r 0 a ( κ 1 ) Y I Y II f 1 ( θ 0 ) + f 2 ( θ 0 ) + T * Y II 2 r 0 a f 3 ( θ 0 )
with
{ f 1 ( θ ) = 1 4 [ ( 8 κ 5 ) cos θ 2 + cos 3 θ 2 ] f 2 ( θ ) = 1 4 [ ( 8 κ 5 ) sin θ 2 + 3 sin 3 θ 2 ] f 3 ( θ ) = ( κ cos 2 θ )
where YI0 and T I * are the normalized stress intensity factor and T-stress for pure mode I loading, respectively. For the CCBD specimens, the values of YI and YII can be easily calculated according to Equations (1) and (2), and the T-stress can also be obtained by an analytical formula developed by Hua et al. [58]. In this study, when the CCBD specimens with a/R = 0.5 are loaded by 0°, 10°, 15°, and 23°, the corresponding dimensionless T-stresses are −5.790, −4.634, −3.465, and −1.483, respectively. If the values of YI, YII, T*, r0, and ν are known, one can obtain the crack initiation angle (θ0) from Equation (4), and the corresponding ratios of KIf/KIC and KIIf/KIC can be also calculated according to Equations (5) and (6). It is noteworthy that the strain-based GMTSN criterion can be simplified to the stress-based GMTS criterion when the Poisson’s ratio is v = 0 [50].
In order to use the GMTSN criterion, it is necessary to know the value of the critical distance around the crack tip r0. This value is associated with the tensile strength σt and pure mode I fracture resistance KIC, and can be calculated as follows [3,48,59]:
r 0 = 1 2 π ( K IC σ t ) 2
For obtaining the critical distance r0, the tensile strength of this sandstone was measured by the Brazilian splitting method. Before measurement, the treatment process of the Brazilian disk samples was completely consistent with that of the CCBD specimens. At least four Brazilian disk samples were successfully tested in each group, and the averaged values of the tensile strength σt are summarized in Table 2. Furthermore, the values of the critical distance r0 determined according to Equation (8) are also shown in Table 2, which would be used to compute the values of θ0, KIf/KIC, and KIIf/KIC according to Equations (4)–(6).
Figure 7 represents the comparison of the experimental values and theoretical predictions based on the fracture criteria. As observed from Figure 7, the test values are always larger than the theoretical predictions according to the conventional maximum tangential stress (MTS) and the MTSN criteria. This is because the MTSN and MTS criteria only consider the stress intensity factors and neglect the influence of T-stress. Moreover, the test results agree well with the theoretical predictions according to the GMTSN and GMTS criteria, which consider the influence of T-stress. For example, when the sandstone samples with a loading angle of 10° undergo none, three, and seven wetting-drying cycles, the test values of KIf/KIC are 0.803, 0.784, and 0.772, and the values of KIIf/KIC are 0.917, 0.885, and 0.880, respectively. Based on the GMTSN criterion, the theoretical predictions of KIf/KIC are 0.815, 0.807, and 0.802, and those of KIIf/KIC are 0.935, 0.926, and 0.919, corresponding to none, three, and seven wetting–drying cycles, respectively. According to the GMTS criterion, the theoretical predictions of KIf/KIC are 0.783, 0.776, and 0.772, and those of KIIf/KIC are 0.898, 0.890, and 0.885, corresponding to none, three, and seven wetting–drying cycles, respectively. The relative errors between the experimental values and the theoretical predictions based on the GMTSN and GMTS criteria are less than 5.0%. Furthermore, for the sandstone samples subjected to long-term immersion for three cycles, the measured values of KIf/KIC and KIIf/KIC are 0.762 and 0.860, respectively. According to the GMTSN and GMTS criteria, the theoretical values of KIf/KIC and KIIf/KIC are 0.806 and 0.775, and 0.924 and 0.889, respectively. These results show that both the GMTSN and GMTS criteria can evaluate the experimental results very well. In addition, the experimental results indicate that the values of KIf/KIC and KIIf/KIC decrease slightly with the increasing number of cycles under the conditions of cyclic wetting–drying and long-term immersion.
As shown in Figure 7, variations still exist between the experimental values and theoretical predictions of KIIC/KIC based on the GMTS criterion when approaching the pure mode II loading condition. To discuss the pure mode II case, the theoretical and experimental values of KIIC/KIC are summarized in Table 3. We observed that the theoretical predictions according to the GMTSN criterion are closer to the testing values as compared with the GMTS criterion, which indicates that the GMTSN criterion can provide a better prediction for pure mode II. For instance, the ratio of KIIC/KIC is 1.468 for the water-saturated sandstone, and 1.395 and 1.163 according to the GMTSN and GMTS criteria, respectively. This phenomenon can be also observed for sandstone under other treatment conditions. Further study shows that the maximum relative error between the experimental values and theoretical predictions according to the GMTSN criterion is less than 7.0%. Compared with the GMTS criterion, the GMTSN criterion considers not only the influences of multiple stress components (σr, σθ, and σz) around the crack tip, but also the Poisson’s ratio. Nevertheless, the GMTS criterion only takes into account the tangential stress component at the crack tip and ignores the effect of Poisson’s ratio. Aliha and Saghafi [60] reported that the stress intensity factors and T-stress are significantly affected by Poisson’s ratio. Moreover, Poisson’s ratio is one of the important parameters for evaluating the onset of the fracture of brittle materials in the GMTSN criterion, and is the key factor to distinguish between stress- or strain-based criteria [50].

5. Conclusions

(1)
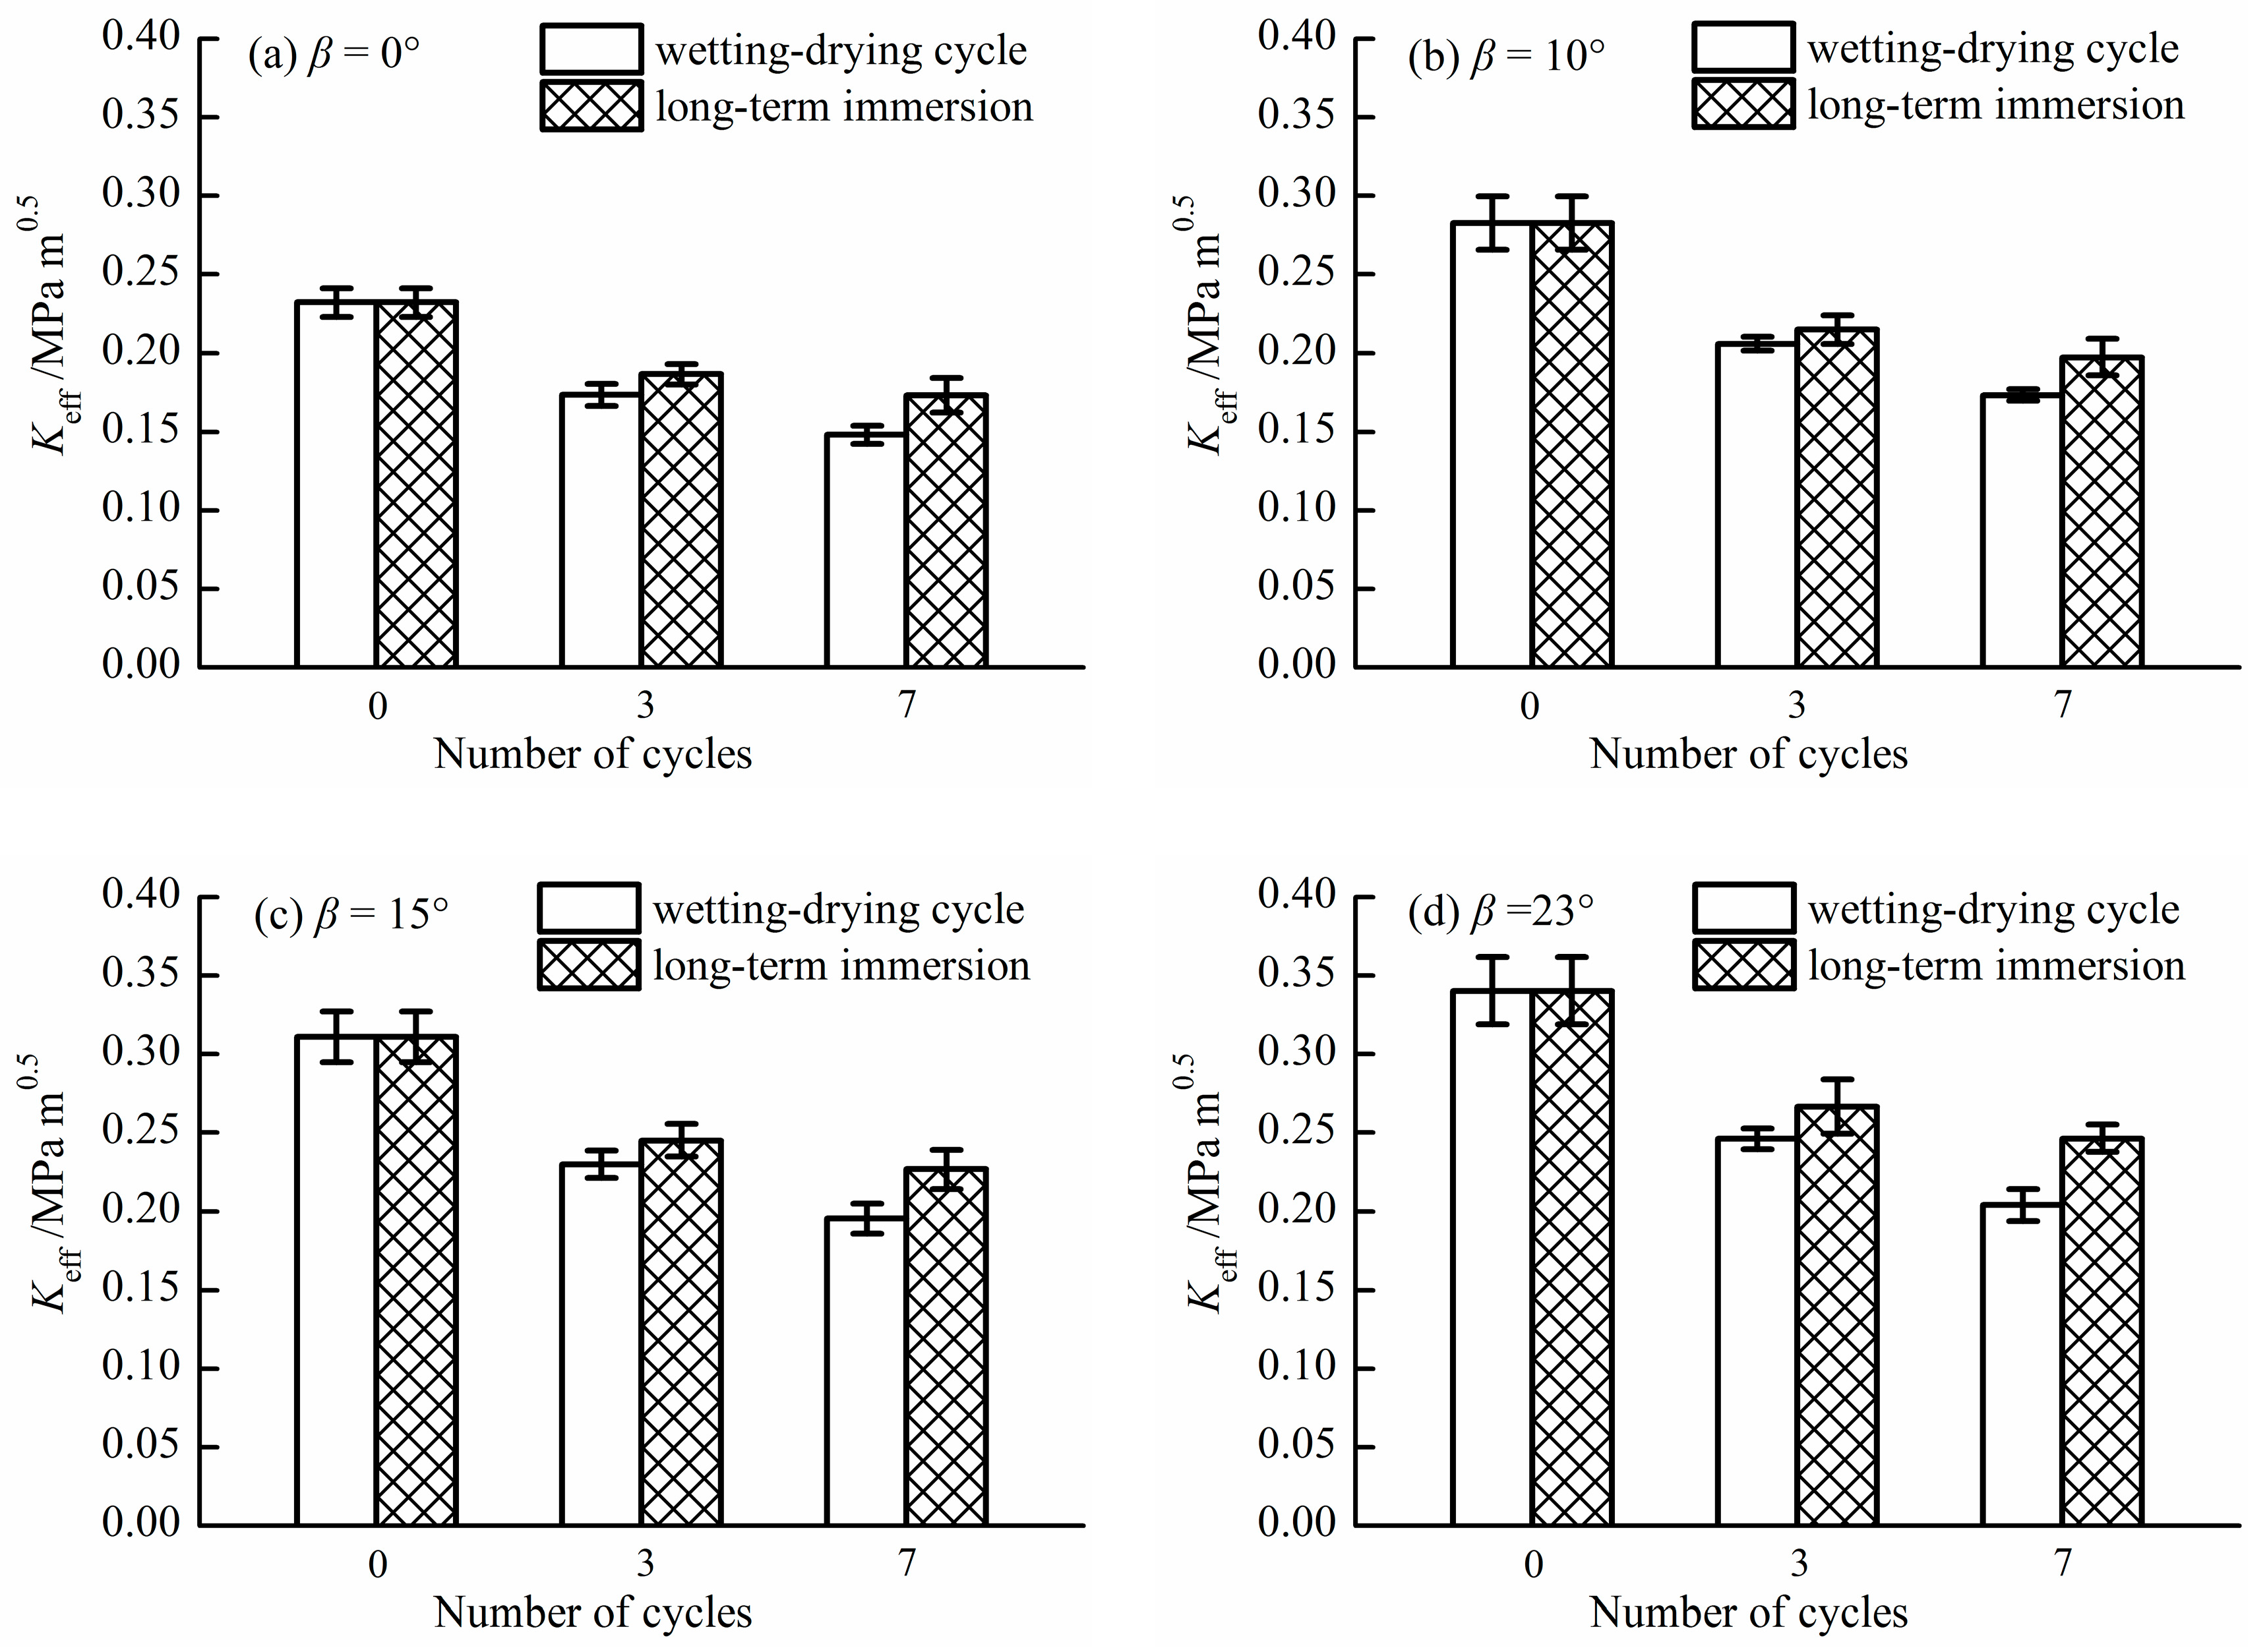
Water–rock interactions can significantly influence the mixed mode fracture resistance of sandstone. The pure mode I, pure mode II, and mixed mode fracture toughness of sandstone decrease with the increase in the number of cycles.
(2)
The values of KIf/KIC and KIIf/KIC decrease slightly with the increasing number of cycles under the conditions of cyclic wetting–drying and long-term immersion.
(3)
The degradation effect of cyclic wetting–drying on the fracture resistance of rock materials is more significant when compared with long-term immersion.
(4)
Both the GMTSN and GMTS criteria, which consider the effect of T-stress, can evaluate the experimental results very well. Moreover, the GMTSN criterion may be better than the GMTS criterion for pure mode II loading.

Author Contributions

W.H. and S.D. conceived the experiments; W.H., J.L., and X.P. designed and performed the experiments; W.H. and J.L. analyzed the data; W.H. and S.D. wrote the manuscript.

Funding

This research was funded by the National Natural Science Foundation of China (grant No. 11872042), the Sichuan Science and Technology Program (No. 2018JY0024 & 2019YJ0156), and the Postdoctoral Research Foundation of Sichuan University.

Conflicts of Interest

The authors declare no conflict of interest.

References

  1. Hua, W.; Dong, S.; Li, Y.; Xu, J.; Wang, Q. The influence of cyclic wetting and drying on the fracture toughness of sandstone. Int. J. Rock Mech. Min. Sci. 2015, 78, 331–335. [Google Scholar] [CrossRef]
  2. Hua, W.; Dong, S.; Li, Y.; Wang, Q. Effect of cyclic wetting and drying on the pure mode II fracture toughness of sandstone. Eng. Fract. Mech. 2016, 153, 143–150. [Google Scholar] [CrossRef]
  3. Hua, W.; Dong, S.; Peng, F.; Li, K.; Wang, Q. Experimental investigation on the effect of wetting-drying cycles on mixed mode fracture toughness of sandstone. Int. J. Rock Mech. Min. Sci. 2017, 93, 242–249. [Google Scholar] [CrossRef]
  4. Erguler, Z.A.; Ulusay, R. Water-induced variations in mechanical properties of clay-bearing rocks. Int. J. Rock Mech. Min. Sci. 2009, 46, 355–370. [Google Scholar] [CrossRef]
  5. Török, Á.; Vásárhelyi, B. The influence of fabric and water content on selected rock mechanical parameters of travertine, examples from hungary. Eng. Geol. 2010, 115, 237–245. [Google Scholar] [CrossRef]
  6. Vásárhelyi, B.; Ván, P. Influence of water content on the strength of rock. Eng. Geol. 2006, 84, 70–74. [Google Scholar] [CrossRef]
  7. Wang, M.; Cao, P.; Li, R.; Fan, X. Effect of water absorption ratio on tensile strength of red sandstone and morphological analysis of fracture surfaces. J. Cent. South Univ. 2017, 24, 1647–1653. [Google Scholar] [CrossRef]
  8. Wong, L.N.Y.; Maruvanchery, V.; Liu, G. Water effects on rock strength and stiffness degradation. Acta Geotech. 2016, 11, 713–737. [Google Scholar] [CrossRef]
  9. Zhou, Z.; Cai, X.; Ma, D.; Cao, W.; Chen, L.; Zhou, J. Effects of water content on fracture and mechanical behavior of sandstone with a low clay mineral content. Eng. Fract. Mech. 2018, 193, 47–65. [Google Scholar] [CrossRef]
  10. Vasarhelyi, B. Statistical analysis of the influence of water content on the strength of the miocene limestone. Rock Mech. Rock Eng. 2004, 38, 69–76. [Google Scholar] [CrossRef]
  11. Roy, D.G.; Singh, T.N.; Kodikara, J.; Das, R. Effect of water saturation on the fracture and mechanical properties of sedimentary rocks. Rock Mech. Rock Eng. 2017, 50, 2585–2600. [Google Scholar] [CrossRef]
  12. Kim, E.; Changani, H. Effect of water saturation and loading rate on the mechanical properties of red and buff sandstones. Int. J. Rock Mech. Min. Sci. 2016, 88, 23–28. [Google Scholar] [CrossRef]
  13. Nara, Y.; Morimoto, K.; Hiroyoshi, N.; Yoneda, T.; Kaneko, K.; Benson, P.M. Influence of relative humidity on fracture toughness of rock: Implications for subcritical crack growth. Int. J. Solids Struct. 2012, 49, 2471–2481. [Google Scholar] [CrossRef] [Green Version]
  14. Nara, Y.; Morimoto, K.; Yoneda, T.; Hiroyoshi, N.; Kaneko, K. Effects of humidity and temperature on subcritical crack growth in sandstone. Int. J. Solids Struct. 2011, 48, 1130–1140. [Google Scholar] [CrossRef] [Green Version]
  15. Tang, L.; Zhang, P.; Wang, S. Testing study on effects of chemical action of aqueous solution on crack propagation in rock. Chin. J. Rock Mech. Eng. 2002, 21, 822–827. [Google Scholar]
  16. Li, N.; Zhu, Y.; Su, B.; Gunter, S. A chemical damage model of sandstone in acid solution. Int. J. Rock Mech. Min. Sci. 2003, 40, 243–249. [Google Scholar] [CrossRef]
  17. Zhang, Z.; Jiang, Q.; Zhou, C.; Liu, X. Strength and failure characteristics of jurassic red-bed sandstone under cyclic wetting–drying conditions. Geophys. J. Int. 2014, 198, 1034–1044. [Google Scholar] [CrossRef]
  18. Qin, Z.; Chen, X.; Fu, H. Damage features of altered rock subjected to drying-wetting cycles. Adv. Civ. Eng. 2018, 2018, 5170832. [Google Scholar] [CrossRef]
  19. Razouki, S.S.; Salem, B.M. Frequency effect of cyclic soaking and drying on the resilient modulus of gypsum-rich roadbed sand. Transp. Geotech. 2016, 7, 13–20. [Google Scholar] [CrossRef]
  20. Nara, Y.; Tanaka, M.; Harui, T. Evaluating long-term strength of rock under changing environments from air to water. Eng. Fract. Mech. 2017, 178, 201–211. [Google Scholar] [CrossRef]
  21. Jia, X.; Zhao, E. Experimental study on the influence of wetting-drying cycle on the strength characteristics of expansive rock. In Proceedings of the International Conference on Energy and Environmental Protection, Zhuhai, China, 29–30 June 2017; Advances in Engineering Research: Zhuhai, China, 2017; pp. 242–245. [Google Scholar]
  22. Sumner, P.D.; Loubser, M.J. Experimental sandstone weathering using different wetting and drying moisture amplitudes. Earth Surf. Proc. Land. 2008, 33, 985–990. [Google Scholar] [CrossRef]
  23. Zhao, Y.; Ren, S.; Jiang, D.; Liu, R.; Wua, J.; Jiang, X. Influence of wetting-drying cycles on the pore structure and mechanical properties of mudstone from simian mountain. Constr. Build. Mater. 2018, 191, 923–931. [Google Scholar] [CrossRef]
  24. Zhu, D.; Jing, H.; Yin, Q.; Han, G. Experimental study on the damage of granite by acoustic emission after cyclic heating and cooling with circulating water. Processes 2018, 6, 101. [Google Scholar] [CrossRef]
  25. Huang, S.; Wang, J.; Qiu, Z.; Kang, K. Effects of cyclic wetting-drying conditions on elastic modulus and compressive strength of sandstone and mudstone. Processes 2018, 6, 234. [Google Scholar] [CrossRef]
  26. Sun, Q.; Zhang, Y. Combined effects of salt, cyclic wetting and drying cycles on the physical and mechanical properties of sandstone. Eng. Geol. 2019, 248, 70–79. [Google Scholar] [CrossRef]
  27. Yuan, P.; Ma, Q. Energy analyses of uniaxial compressive tests for coalmine sandstone after cyclic wetting and drying. In Proceedings of the 2014 ISRM European Regional Symposium on Rock Engineering and Rock Mechanics: Structures in and on Rock Masses, EUROCK 2014, London, UK, 27–29 May 2014; pp. 101–105. [Google Scholar]
  28. Zhou, Z.; Cai, X.; Chen, L.; Cao, W.; Zhao, Y.; Xiong, C. Influence of cyclic wetting and drying on physical and dynamic compressive properties of sandstone. Eng. Geol. 2017, 220, 1–12. [Google Scholar] [CrossRef]
  29. Zhou, Z.; Cai, X.; Ma, D.; Chen, L.; Wang, S.; Tan, L. Dynamic tensile properties of sandstone subjected to wetting and drying cycles. Constr. Build. Mater. 2018, 182, 215–232. [Google Scholar] [CrossRef]
  30. Hale, P.A.; Shakoor, A. A laboratory investigation of the effects of cyclic heating and cooling, wetting and drying, and freezing and thawing on the compressive strength of selected sandstones. Environ. Eng. Geosci. 2003, 9, 117–130. [Google Scholar] [CrossRef]
  31. Khanlari, G.; Abdilor, Y. Influence of wet–dry, freeze–thaw, and heat–cool cycles on the physical and mechanical properties of upper red sandstones in central Iran. Bull. Eng. Geol. Environ. 2014, 74, 1287–1300. [Google Scholar] [CrossRef]
  32. Özbek, A. Investigation of the effects of wetting–drying and freezing–thawing cycles on some physical and mechanical properties of selected ignimbrites. Bull. Eng. Geol. Environ. 2014, 73, 595–609. [Google Scholar] [CrossRef]
  33. Li, K.; Zhang, Y. Damage constitutive model for rock considering cyclic drying-wetting effect and its experimental validation. Electron. J. Geotech. Eng. 2016, 21, 277–286. [Google Scholar]
  34. Liu, X.; Jin, M.; Li, D.; Zhang, L. Strength deterioration of a shaly sandstone under dry–wet cycles: A case study from the three gorges reservoir in China. Bull. Eng. Geol. Environ. 2017, S3, 1–15. [Google Scholar] [CrossRef]
  35. Zhao, Z.; Yang, J.; Zhang, D.; Peng, H. Effects of wetting and cyclic wetting–drying on tensile strength of sandstone with a low clay mineral content. Rock Mech. Rock Eng. 2016, 50, 485–491. [Google Scholar] [CrossRef]
  36. Hou, P.; Gao, F.; Gao, Y.N.; Yang, Y.G.; Cai, C.Z. Effect of pore pressure distribution on fracture behavior of sandstone in nitrogen fracturing. Energ. Explor. Exploit. 2017, 35, 609–626. [Google Scholar] [CrossRef] [Green Version]
  37. Atkinson, C.; Smelser, R.E.; Sanchez, J. Combined mode fracture via the cracked Brazilian disk test. Int. J. Fract. 1982, 18, 279–291. [Google Scholar] [CrossRef]
  38. Hua, W.; Xu, J.; Dong, S.; Song, J.; Wang, Q. Effect of confining pressure on stress intensity factors for cracked Brazilian disk. Int. J. Appl. Mech. 2015, 7, 1550051. [Google Scholar] [CrossRef]
  39. Meng, T.; Bao, X.; Zhao, J.; Hu, Y. Study of mixed mode fracture toughness and fracture characteristic in gypsum rock under brine saturation. Environ. Earth Sci. 2018, 77. [Google Scholar] [CrossRef]
  40. Fowell, R.J. Suggested method for determining mode I fracture toughness using cracked chevron notched Brazilian disc (CCNBD) specimens. Int. J. Rock Mech. Min. Sci. Geomech. Abstr. 1995, 32, 57–64. [Google Scholar] [CrossRef]
  41. Dong, S.; Wang, Y.; Xia, Y. Stress intensity factors for central cracked circular disk subjected to compression. Eng. Fract. Mech. 2004, 71, 1135–1148. [Google Scholar] [CrossRef]
  42. Dong, S.M. Theoretical analysis of the effects of relative crack length and loading angle on the experimental results for cracked Brazilian disk testing. Eng. Fract. Mech. 2008, 75, 2575–2581. [Google Scholar] [CrossRef]
  43. Hua, W.; Dong, S.; Xu, J. Experimental study on the fracture toughness of rust stone under mixed mode loading condition. Mater. Res. Innov. 2015, 19, 531–536. [Google Scholar] [CrossRef]
  44. Khan, K.; Al-Shayea, N.A. Effect of speciment geometry testing method on mixed mode fracture toughness of limestone rock from Saudi Arabia. Rock Mech. Rock Eng. 2000, 33, 179–206. [Google Scholar] [CrossRef]
  45. Aliha, M.R.M.; Ayatollahi, M.R. Mixed mode I/II brittle fracture evaluation of marble using SCB specimen. Proc. Eng. 2011, 10, 311–318. [Google Scholar] [CrossRef] [Green Version]
  46. Hua, W.; Dong, S.; Fan, Y.; Pan, X.; Wang, Q. Investigation on the correlation of mode II fracture toughness of sandstone with tensile strength. Eng. Fract. Mech. 2017, 184, 249–258. [Google Scholar] [CrossRef]
  47. Al-Shayea, N.A.; Khan, K.; Abduljauwad, S.N. Effects of confining pressure and temperature on mixed-mode (I–II) fracture toughness of a limestone rock. Int. J. Rock Mech. Min. Sci. 2000, 37, 629–643. [Google Scholar] [CrossRef]
  48. Hou, C.; Wang, Z.; Liang, W.; Li, J.; Wang, Z. Determination of fracture parameters in center cracked circular discs of concrete under diametral loading: A numerical analysis and experimental results. Theor. Appl. Fract. Mech. 2016, 85, 355–366. [Google Scholar] [CrossRef]
  49. Ayatollahi, M.R.; Sistaninia, M. Mode II fracture study of rocks using brazilian disk specimens. Int. J. Rock Mech. Min. Sci. 2011, 48, 819–826. [Google Scholar] [CrossRef]
  50. Hua, W.; Dong, S.; Pan, X.; Wang, Q. Mixed mode fracture analysis of CCBD specimens based on the extended maximum tangential strain criterion. Fatigue Fract. Eng. Mater. Struct. 2017, 40, 2118–2127. [Google Scholar] [CrossRef]
  51. Mirsayar, M.M. On fracture analysis of dental restorative materials under combined tensile-shear loading. Theor. Appl. Fract. Mech. 2018, 93, 170–176. [Google Scholar] [CrossRef]
  52. Chang, K.J. On the maximum strain criterion-a new approach to the angled crack problem. Eng. Fract. Mech. 1981, 14, 107–124. [Google Scholar] [CrossRef]
  53. Ayatollahi, M.R.; Abbasi, H. Prediction of fracture using a strain based mechanism of crack growth. Build. Res. J. 2001, 49, 167–180. [Google Scholar]
  54. Mirsayar, M.M. Mixed mode fracture analysis using extended maximum tangential strain criterion. Mater. Des. 2015, 86, 941–947. [Google Scholar] [CrossRef]
  55. Wei, M.D.; Dai, F.; Xu, N.W.; Liu, Y.; Zhao, T. A novel chevron notched short rod bend method for measuring the mode I fracture toughness of rocks. Eng. Fract. Mech. 2018, 190, 1–15. [Google Scholar] [CrossRef]
  56. Mirsayar, M.M.; Razmi, A.; Aliha, M.R.M.; Berto, F. EMTSN criterion for evaluating mixed mode I/II crack propagation in rock materials. Eng. Fract. Mech. 2018, 190, 186–197. [Google Scholar] [CrossRef]
  57. Ghouli, S.; Ayatollahi, M.R.; Bushroa, A.R. Fracture characterization of ceria partially stabilized zirconia using the gmtsn criterion. Eng. Fract. Mech. 2018, 199, 647–657. [Google Scholar] [CrossRef]
  58. Hua, W.; Li, Y.; Dong, S.; Li, N.; Wang, Q. T-stress for a centrally cracked brazilian disk under confining pressure. Eng. Fract. Mech. 2015, 149, 37–44. [Google Scholar] [CrossRef]
  59. Ayatollahi, M.R.; Aliha, M.R.M. On the use of brazilian disc specimen for calculating mixed mode I–II fracture toughness of rock materials. Eng. Fract. Mech. 2008, 75, 4631–4641. [Google Scholar] [CrossRef]
  60. Aliha, M.R.M.; Saghafi, H. The effects of thickness and poisson’s ratio on 3D mixed-mode fracture. Eng. Fract. Mech. 2013, 98, 15–28. [Google Scholar] [CrossRef]
Figure 1. Diagram of a central cracked Brazilian disk (CCBD) specimen under compression.
Processes 07 00070 g001
Figure 2. The typical microstructure photograph of the intact sandstone sample.
Processes 07 00070 g002
Figure 3. Failure modes of some sandstone specimens.
Processes 07 00070 g003
Figure 4. Fracture toughness of sandstone under different water–rock interaction conditions.
Processes 07 00070 g004
Figure 5. Effective fracture toughness of sandstone under water–rock interactions with a different number of cycles.
Processes 07 00070 g005
Figure 6. Scanning electron microscope (SEM) photomicrographs of sandstone samples after water–rock interactions.
Processes 07 00070 g006
Figure 7. Comparison of the experimental values and theoretical predictions based on the fracture criteria.
Processes 07 00070 g007
Table 1. Test values of fracture toughness for sandstone under different water–rock interaction conditions.
Treatment ConditionsNumber of CyclesFracture Toughness K/MPa m0.5
KIC
(β = 0°)
KIf
(β = 10°)
KIIf
(β = 10°)
KIf
(β = 15°)
KIIf
(β = 15°)
KIIC
(β = 23°)
Intact-0.3320.2640.2980.1880.4430.502
0.3270.2750.3120.1710.4040.509
0.3480.2720.3080.1850.4340.498
0.3440.2570.2910.1770.4150.485
Saturation00.2240.1810.2060.1190.2850.337
0.2310.1740.1990.1270.3040.372
0.2450.1990.2280.1220.2910.327
0.2290.1910.2180.1130.2680.326
Cyclic wetting and drying30.1730.1360.1520.0890.2110.246
0.1800.1360.1550.0850.2030.239
0.1640.1410.1580.0880.2120.255
0.1770.1330.1510.0920.2230.245
70.1450.1150.1310.0770.1850.198
0.1430.1140.1300.0720.1720.210
0.1560.1110.1270.0800.1900.215
0.1480.1170.1330.0730.1740.193
Long-term immersion30.1800.1480.1680.0910.2150.250
0.1830.1440.1620.0970.2320.290
0.1950.1340.1510.0940.2210.258
0.1880.1440.1620.0990.2360.268
70.1800.1330.1510.0860.2040.235
0.1840.1230.1390.0820.1970.251
0.1590.1260.1430.0930.2240.245
0.1710.1400.1590.0890.2120.255
Table 2. The values of critical distance r0 for sandstone under different water–rock interaction conditions.
Treatment ConditionsNumber of CyclesTensile Strength σt/MPaMode I Fracture Toughness KIC/MPa m0.5Critical Distance r0/mm
Intact-2.6770.3382.54
saturation01.8970.2322.38
Cyclic wetting and drying31.4830.1742.17
71.3120.1482.03
Long-term immersion31.6210.1872.12
71.5360.1732.02
Table 3. The theoretical and experimental values of KIIC/KIC for sandstone under different treatment conditions. GMTSN—generalized maximum tangential strain; GMTS—generalized maximum tangential stress; MTSN—maximum tangential strain; MTS—maximum tangential stress.
Treatment ConditionsNumber of CyclesKIIC/KIC
Test DataGMTSNGMTSMTSNMTS
Intact-1.4751.4241.1760.6300.866
saturation01.4681.3951.1630.6300.866
Cyclic wetting and drying31.4151.3541.1470.6300.866
71.3781.3271.1360.6300.866
Long-term immersion31.4251.3441.1430.6300.866
71.4241.3241.1350.6300.866

