Article

Process Modeling and Evaluation of Plasma-Assisted Ethylene Production from Methane

by
Evangelos Delikonstantis
,
Marco Scapinello
and
Georgios D. Stefanidis
*
Process Engineering for Sustainable Systems (ProcESS), Department of Chemical Engineering, KU Leuven, Celestijnenlaan 200F, 3001 Leuven, Belgium
*
Author to whom correspondence should be addressed.
Processes 2019, 7(2), 68; https://doi.org/10.3390/pr7020068
Submission received: 14 January 2019 / Revised: 28 January 2019 / Accepted: 28 January 2019 / Published: 1 February 2019
(This article belongs to the Special Issue Plasma-Based Processes for Improved Energy Efficiency)

Abstract

:
The electrification of the petrochemical industry, imposed by the urgent need for decarbonization and driven by the incessant growth of renewable electricity share, necessitates electricity-driven technologies for efficient conversion of fossil fuels to chemicals. Non-thermal plasma reactor systems that successfully perform in lab scale are investigated for this purpose. However, the feasibility of such electrified processes at industrial scale is still questionable. In this context, two process alternatives for ethylene production via plasma-assisted non-oxidative methane coupling have conceptually been designed based on previous work of our group namely, a direct plasma-assisted methane-to-ethylene process (one-step process) and a hybrid plasma-catalytic methane-to-ethylene process (two-step process). Both processes are simulated in the Aspen Plus V10 process simulator and also consider the technical limitations of a real industrial environment. The economically favorable operating window (range of operating conditions at which the target product purity is met at minimum utility cost) is defined via sensitivity analysis. Preliminary results reveal that the hybrid plasma-catalytic process requires 21% less electricity than the direct one, while the electric power consumed for the plasma-assisted reaction is the major cost driver in both processes, accounting for ~75% of the total electric power demand. Finally, plasma-assisted processes are not economically viable at present. However, future decrease in electricity prices due to renewable electricity production increase can radically affect process economics. Given that a break-even electricity price of 35 USD/MWh (without considering the capital cost) is calculated for the two-step plasma process and that current electricity prices for some energy intensive industries in certain countries can be as low as 50 USD/MWh, the plasma-assisted processes may become economically viable in the future.

Graphical Abstract

1. Introduction

In view of preventing a global temperature rise of 2 °C [1], efforts should be pursued to mitigate the greenhouse gas emissions (GHGs) [2]. Decarbonization of the chemical industry would majorly contribute to GHGs mitigation as approximately one quarter of the GHGs emitted worldwide result from industrial activity, with CO2 being the most abundant GHG [3]. In the chemical industry, significant CO2 emissions result from ethylene production, being the second most polluting high-volume commodity chemical after ammonia [4] and accounting for ~10% of the chemical industry GHGs [3]. Due to high GHGs share the ethylene industry possesses among the other chemical processes, decarbonization of ethylene production processes could significantly impact the chemical industry’s carbon footprint.
It has been estimated that technological advances in the chemical industry can lead up to a 25% reduction in energy intensity [5] and thereby lower GHGs. Deep decarbonization of the ethylene industry can only be achieved via carbon capture and storage, use of bio-based feedstock, increase in the recycling of plastics, and shifting to zero-carbon electricity [6,7,8,9]. However, the concurrent rapid cost reduction and the increasing prevalence of renewable electricity generation, mainly solar and wind, suggest that the latter path is the most promising one to reduce GHGs [3]. In conventional ethylene production process, GHGs are primarily sourced from the fuel and other off-gases (formed in ethylene production process), which are burned to provide the heat required for the oil-based feedstock cracking in high-temperature pyrolytic furnaces. Switching from the conventional thermally driven furnaces to electricity-driven reactors, and thus, from fuels combustion for heat generation to zero-carbon electricity for electron-impact reactions activation may be the solution towards CO2-neutral ethylene production.
Plasma reactors are deemed as a promising alternative technology [10], avoiding the fuel combustion, and thus, GHGs. In plasma reactors, high energy electrons generated in the plasma zone effectively generate a large amount of chemically active species (radicals, ions, and excited species) via electron-molecule collisions, which can further form other species under mild temperature (<1000 °C) and pressure conditions (~1 bar). Moreover, plasma reactors are compatible with the renewable electricity generation technologies due to their fast response to fluctuating and intermittent electricity supply. Nanosecond pulsed discharge (NPD) reactors, a relatively new technology of non-equilibrium plasma, are currently of great interest due to their high energy efficiency [10]. Ethylene can be produced as major product from methane in NPD reactors: (i) In one-step process, operating at elevated pressures (5 bar) [11], (ii) in two-step process, at atmospheric pressure, employing hybrid plasma-catalytic reactors, in which the acetylene produced in the plasma zone is subsequently hydrogenated to ethylene by a hydrogenation catalyst placed in the post-plasma zone at no additional cost [12]; this is because both heat and hydrogen required for the hydrogenation reaction are provided by methane cracking that takes place upstream, inside the plasma zone.
Given the heat integration applied in the conventional thermally-driven ethylene production process, the replacement of thermal energy by electricity may necessitate further adaptations to downstream processes as less heat will be produced in the latter case; heat is used as hot utility in the separation units. Further, the relatively low maturity of some non-thermal plasma reactor technologies (successfully tested at lab scale, but not commercially available at large scale yet), the relatively high electricity prices and the uncertainty regarding long-term stability of plasma reactors performance may inhibit technology acceptance. Plant-wide process modelling of plasma-assisted processes at large scale can be used as a tool to (1) identify challenges arising from the integration of plasma reactors with existing downstream processing systems and cost drivers that should be further optimized, and (2) estimate total energy requirements. Nonetheless, works in this field are rather limited and are not relevant to ethylene production [13,14,15,16].
In this work, ethylene production via plasma-assisted non-oxidative methane coupling at kton scale is investigated. Two process alternatives are conceptually designed to deliver high purity ethylene (≥99% v/v): (i) A one-step plasma-assisted methane-to-ethylene route operating at 5 bar, and (ii) a hybrid plasma-catalytic methane-to-ethylene route operating at atmospheric pressure. The proof of concept of both processes has been successfully demonstrated in our lab [11,12]. Both process alternatives are simulated and also consider the technical limitations of the real industrial environment, while the economically favorable operating window (range of operating conditions at which the target product purity is met at minimum utility cost) is defined via sensitivity analysis using the Aspen Plus V10 process simulator. Heat integration is applied and the most energy intensive steps of the process are defined. Collectively, a thorough comparison between the two plasma-assisted processes is presented and conclusions on the feasibility of integration of a plasma reactor into a conventional ethylene production process flow diagram are drawn.

2. Plasma-Assisted Non-Oxidative Methane Coupling

Plasma-assisted non-oxidative CH4 coupling to C2H4 was first performed in a tubular reactor consisted of an inner, axial (2.2 mm diameter) copper-made wire which served as high voltage (HV) electrode and an outer, co-axial (7 and 10 mm internal and external diameter, respectively) stainless-steel tube which served as ground electrode (GE). The discharge gap (distance between the HV and GE electrodes) was 2.4 mm and the coaxial plasma reactor length was 25 cm. The plasma reactor was powered by a nanosecond pulsed power supply (NPG-24/2500, Megaimpulse Ltd., St. Petersburg, Russia) which was triggered by a waveform generator (33220A, Keysight Technology, Calabasas, CA, USA) at 3 kHz pulse frequency. High-voltage probes were employed to measure the applied voltage (P6015A, Tektronix, Berkshire, UK) and discharge current (CT-D-1.0, Magnelab, Longmont, CO, USA). A digital oscilloscope (Wavesurfer 10, Teledyne Lecroy, Chestnut Ridge, NY, USA) was also used to record voltage and current signals with a sampling frequency of 10 GS/s, whereas the discharge energy input was estimated as in Reference [17]. Three mass flow controllers (GF40 Series, Brooks Instrument, Hatfield, PA, USA) were employed to control reactants feed flowrates namely, CH4:H2 = 1:1 v/v mixture, C2H6 and CO2. H2 was cofed with CH4 to suppress carbon formation [11] and facilitate longer and stable operation, while C2H6 and CO2 were added to simulate shale gas composition. Detailed description of the experimental setup and plasma reactor performance optimization are reported in our previous works [11,12].
The numerous active species (ions, radicals and excited species) that are present in the plasma and the electron energy distribution within the plasma zone render the plasma chemistry complicated. Specifically, in (nanosecond) pulsed discharges, the distinction between radical species formation when the discharge is on, and recombination reactions evolution when the discharge is off, is possible. Thus, two different reaction schemes are usually developed (one for each phase) to describe the global reaction path [18,19]. Further, the plasma reactor pressure can significantly affect the discharge temperature. Elevated plasma reactor pressures lead to higher discharge temperatures [18], and subsequently, the final product distribution may change since recombination reactions constants change. It has been observed that when operating at ambient pressure, C2H2 was the major product through CH4 coupling to C2H6 in gas phase, followed by stepwise dehydrogenation of C2H6 to C2H2 (C2H6 → C2H5 → C2H4 → C2H3 → C2H2). C2H2 can further be hydrogenated to C2H4 downstream of the plasma zone using suitable catalyst (two-step process). When operating at higher pressures (>3 bar), C2H2 was formed via the same path but due to higher bulk gas temperature, gas phase CH4 coupling to C2H4 and C2H2 hydrogenation to C2H4, catalyzed by the plasma reactor HV copper-based electrode, were activated. Eventually, due to these two reaction paths, product selectivity was shifted from C2H2 to C2H4 at higher pressures (one-step process). The global non-oxidative methane coupling reaction mechanism in a nanosecond pulsed discharge reactor at different operating pressures is schematically presented in Figure 1, while a detailed study and discussion can be found in our recently published work [18].

3. Process Model

Considering that plasma-assisted ethylene production processes have not been launched on a large scale and NPD reactors are a relatively new technology, the dynamics of plasma reactors integrated with other downstream technologies used in the process are unknown. To deliver a valid and realistic plant-wide process model, the state-of-the-art technology for ethylene separation and purification is selected for simulation. Moreover, it is the purpose of this work to draw conclusions on the integration of plasma reactors with the existing ethylene production network. The economically favorable operating window for the downstream processing step is established through sensitivity analysis. Further, replacement of conventional furnaces by plasma reactors will certainly reduce the heat generated in the process; this heat is further used in other process steps. Therefore, heat integration is applied. A fully electrified refrigeration cycle and process water are used as external cold and hot utility, respectively, making the new process solely electricity-driven.

3.1. Modeling Inputs and Assumptions

While the simulation of all process steps involved in plasma-assisted ethylene production are based on experimental data published in the literature and chemical and thermodynamic equilibria, the process model development and the mass and energy balance calculation for both process alternatives (Supplementary Material; Table S2 and Table S7) are based on the following design inputs and assumptions:
-
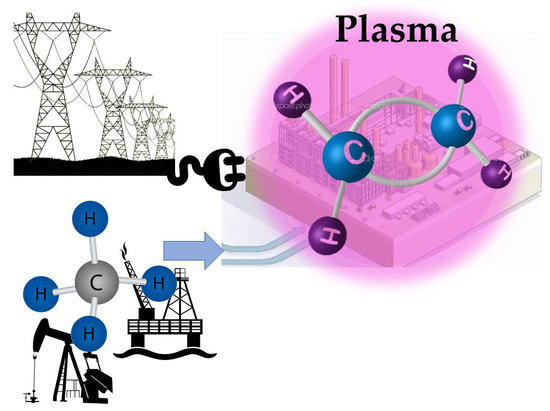
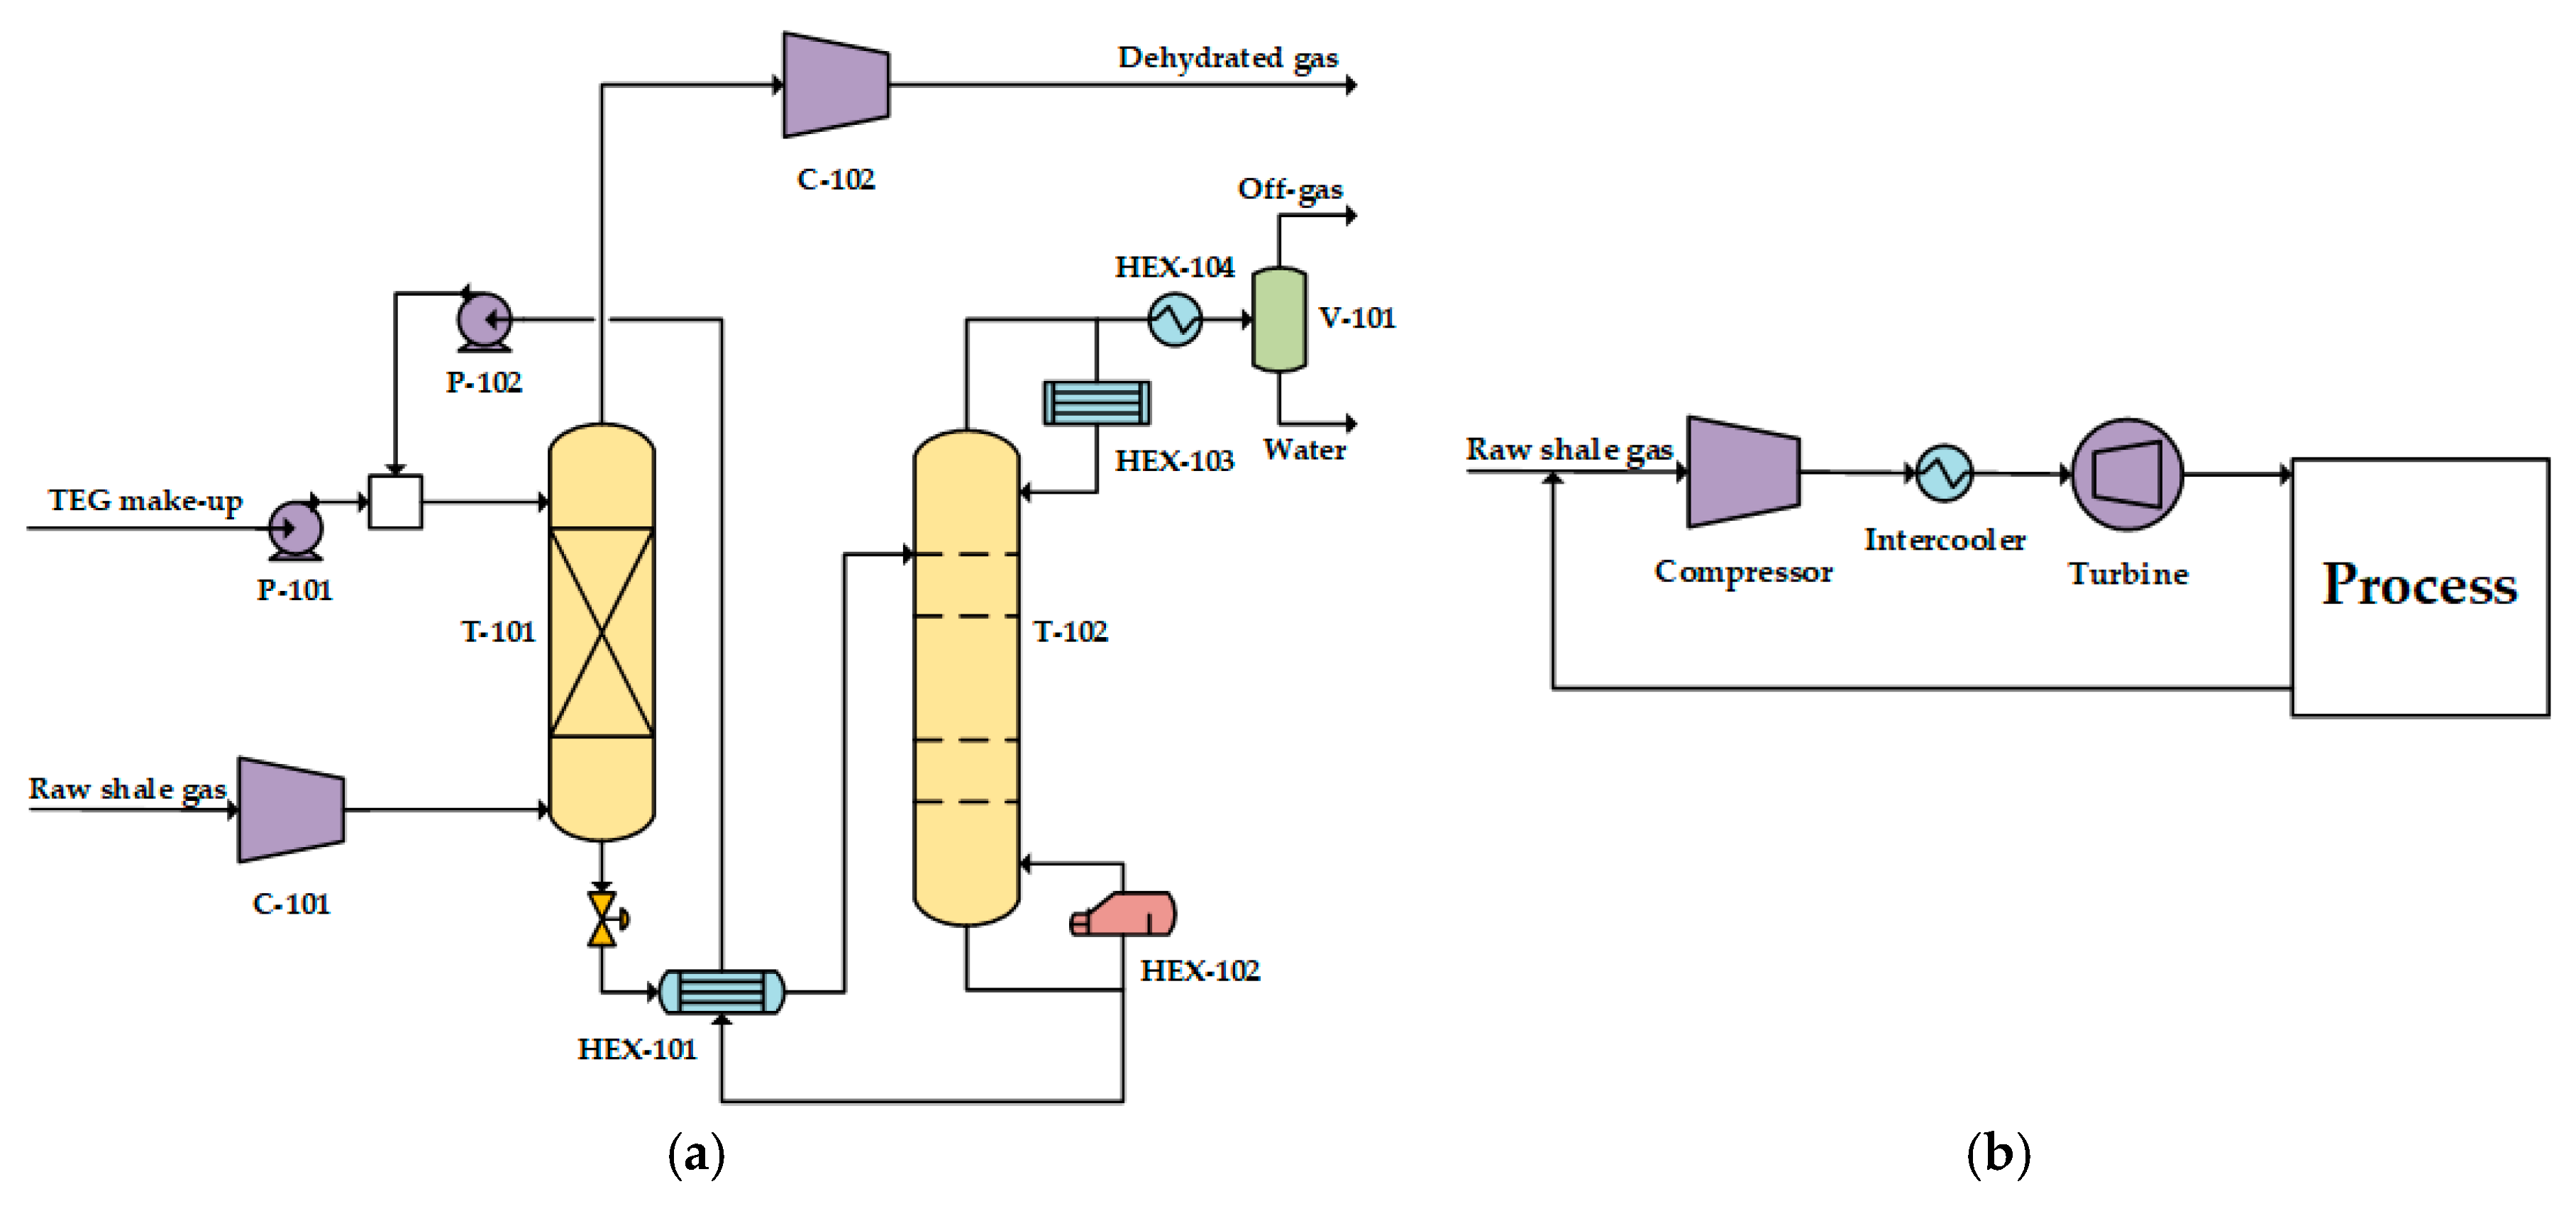
Shale gas, a major source of natural gas rich-in methane, is considered as the main feedstock for ethylene production. The composition of shale gas varies depending on the extraction region [20], thus a stream containing 79% CH4, 15% C2H6, 3% CO2, and 3% H2O on a molar basis is considered as feedstock for the simulation. N2 and H2S impurities are not taken into consideration since they are usually present in negligible amounts. The plasma activity and high dilution with H2 (CH4:H2 = 1:1 mol) in the inlet plasma reactor stream guarantee that the feed stream meets the pipeline, safety, and quality standards [21,22].
-
Oil, natural gas liquids (NGLs), and most of the water, which natural gas is mixed with in the reservoir, are most often separated in equipment installed at or near the wellhead. Therefore, system boundaries include the dehydration step required prior to the plasma reactor and the plasma-assisted ethylene production process itself. Unlike the thermally driven processes, gas sweetening is not required since plasma reactors operation is robust in CO2 and other impurities presence. In addition, the concentration of impurities may be reduced via electron-impact dissociation reactions occurring in the plasma zone [23].
-
The Peng-Robinson (PR) equation of state is employed to calculate the vapor-liquid equilibria and the chemical compounds thermodynamic properties. The PR equation is commonly applied to hydrocarbon mixture systems and are specifically used for hydrocarbon fluids found in underground reservoirs [24].
-
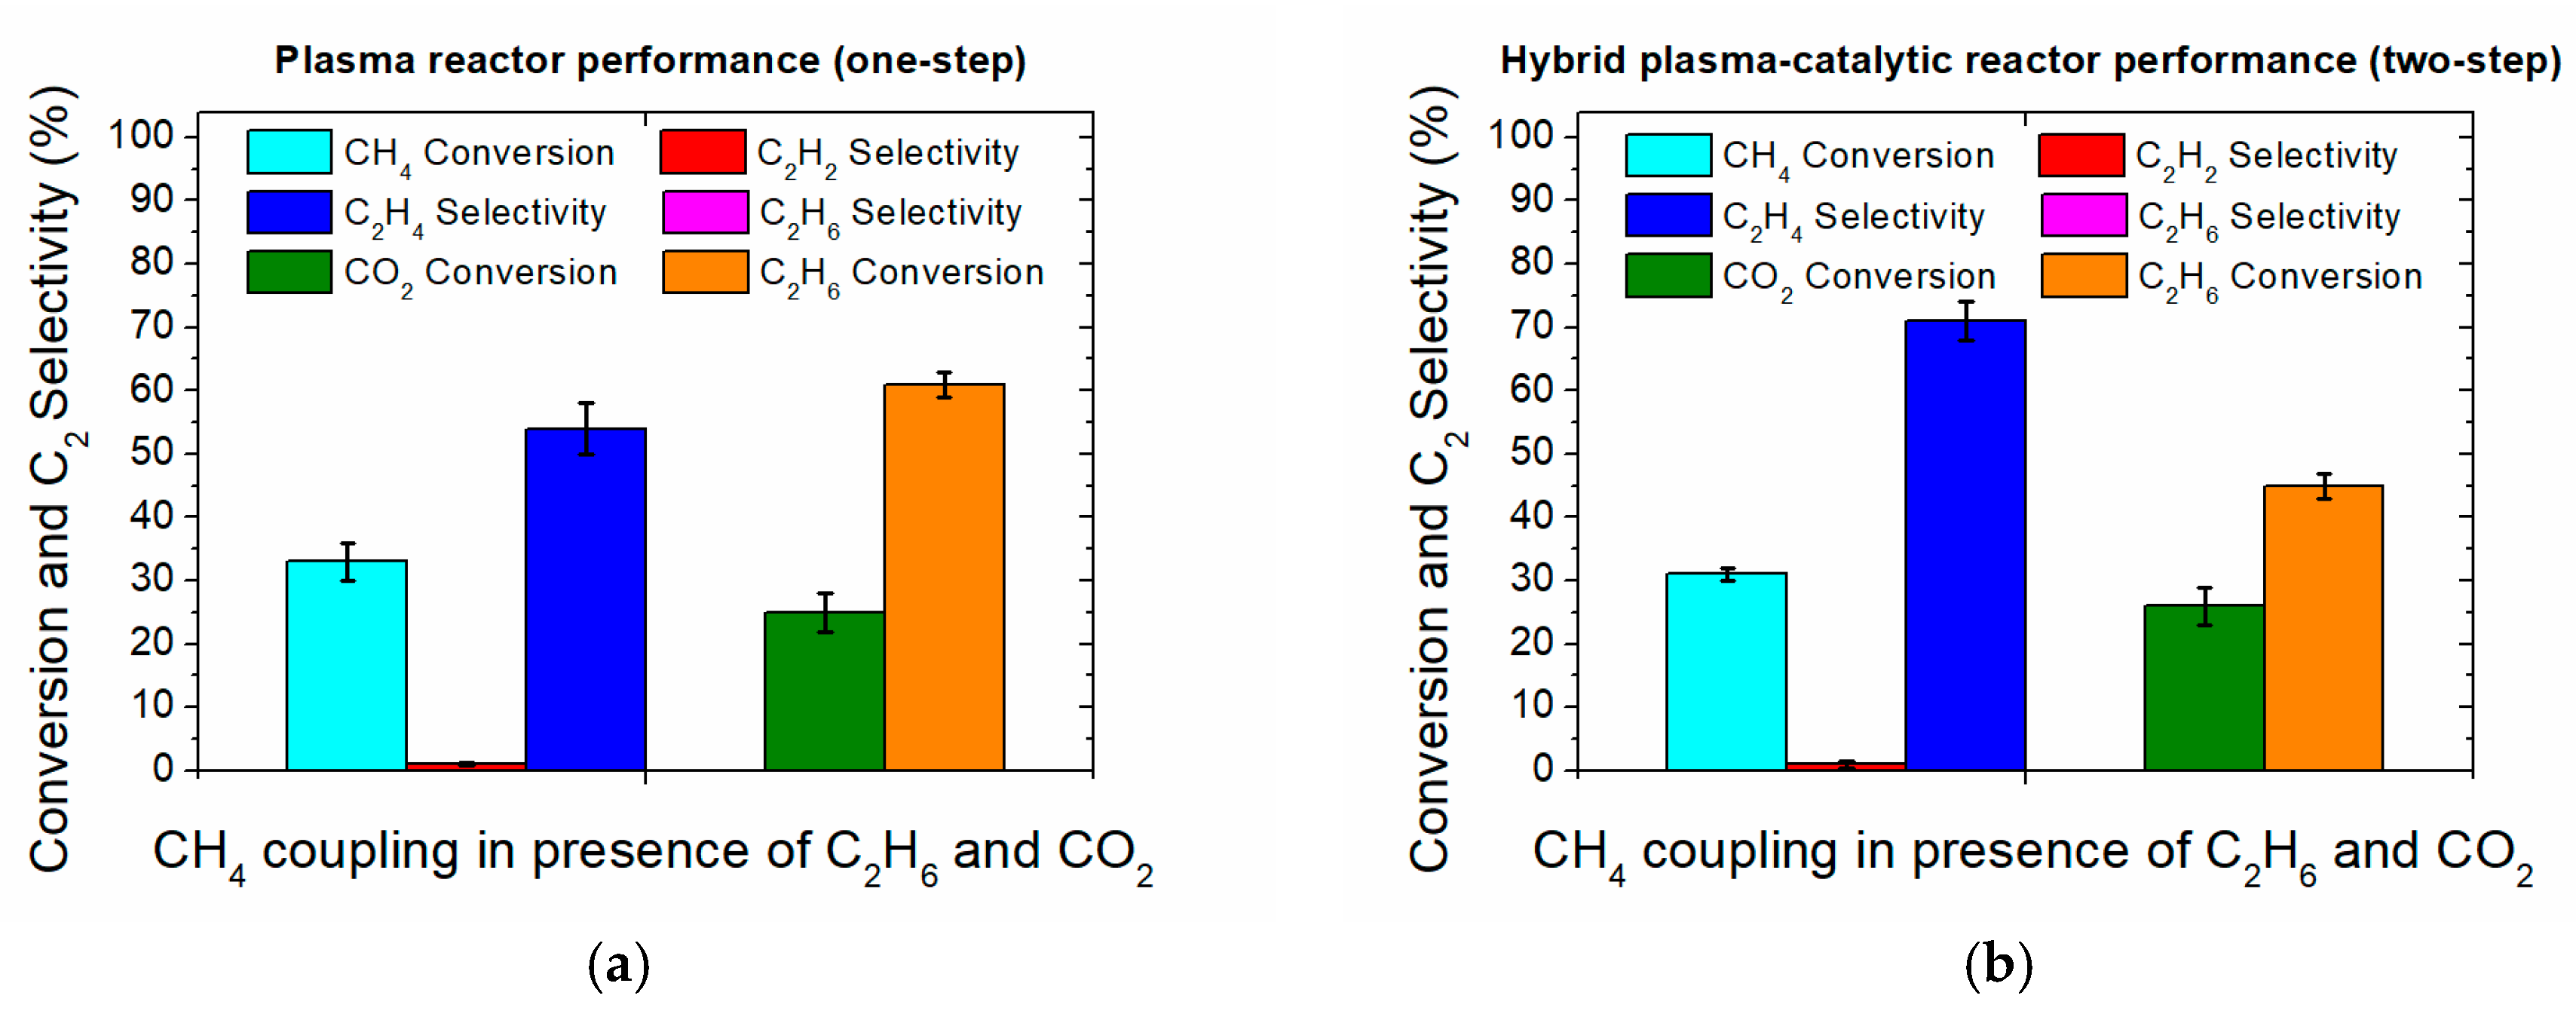
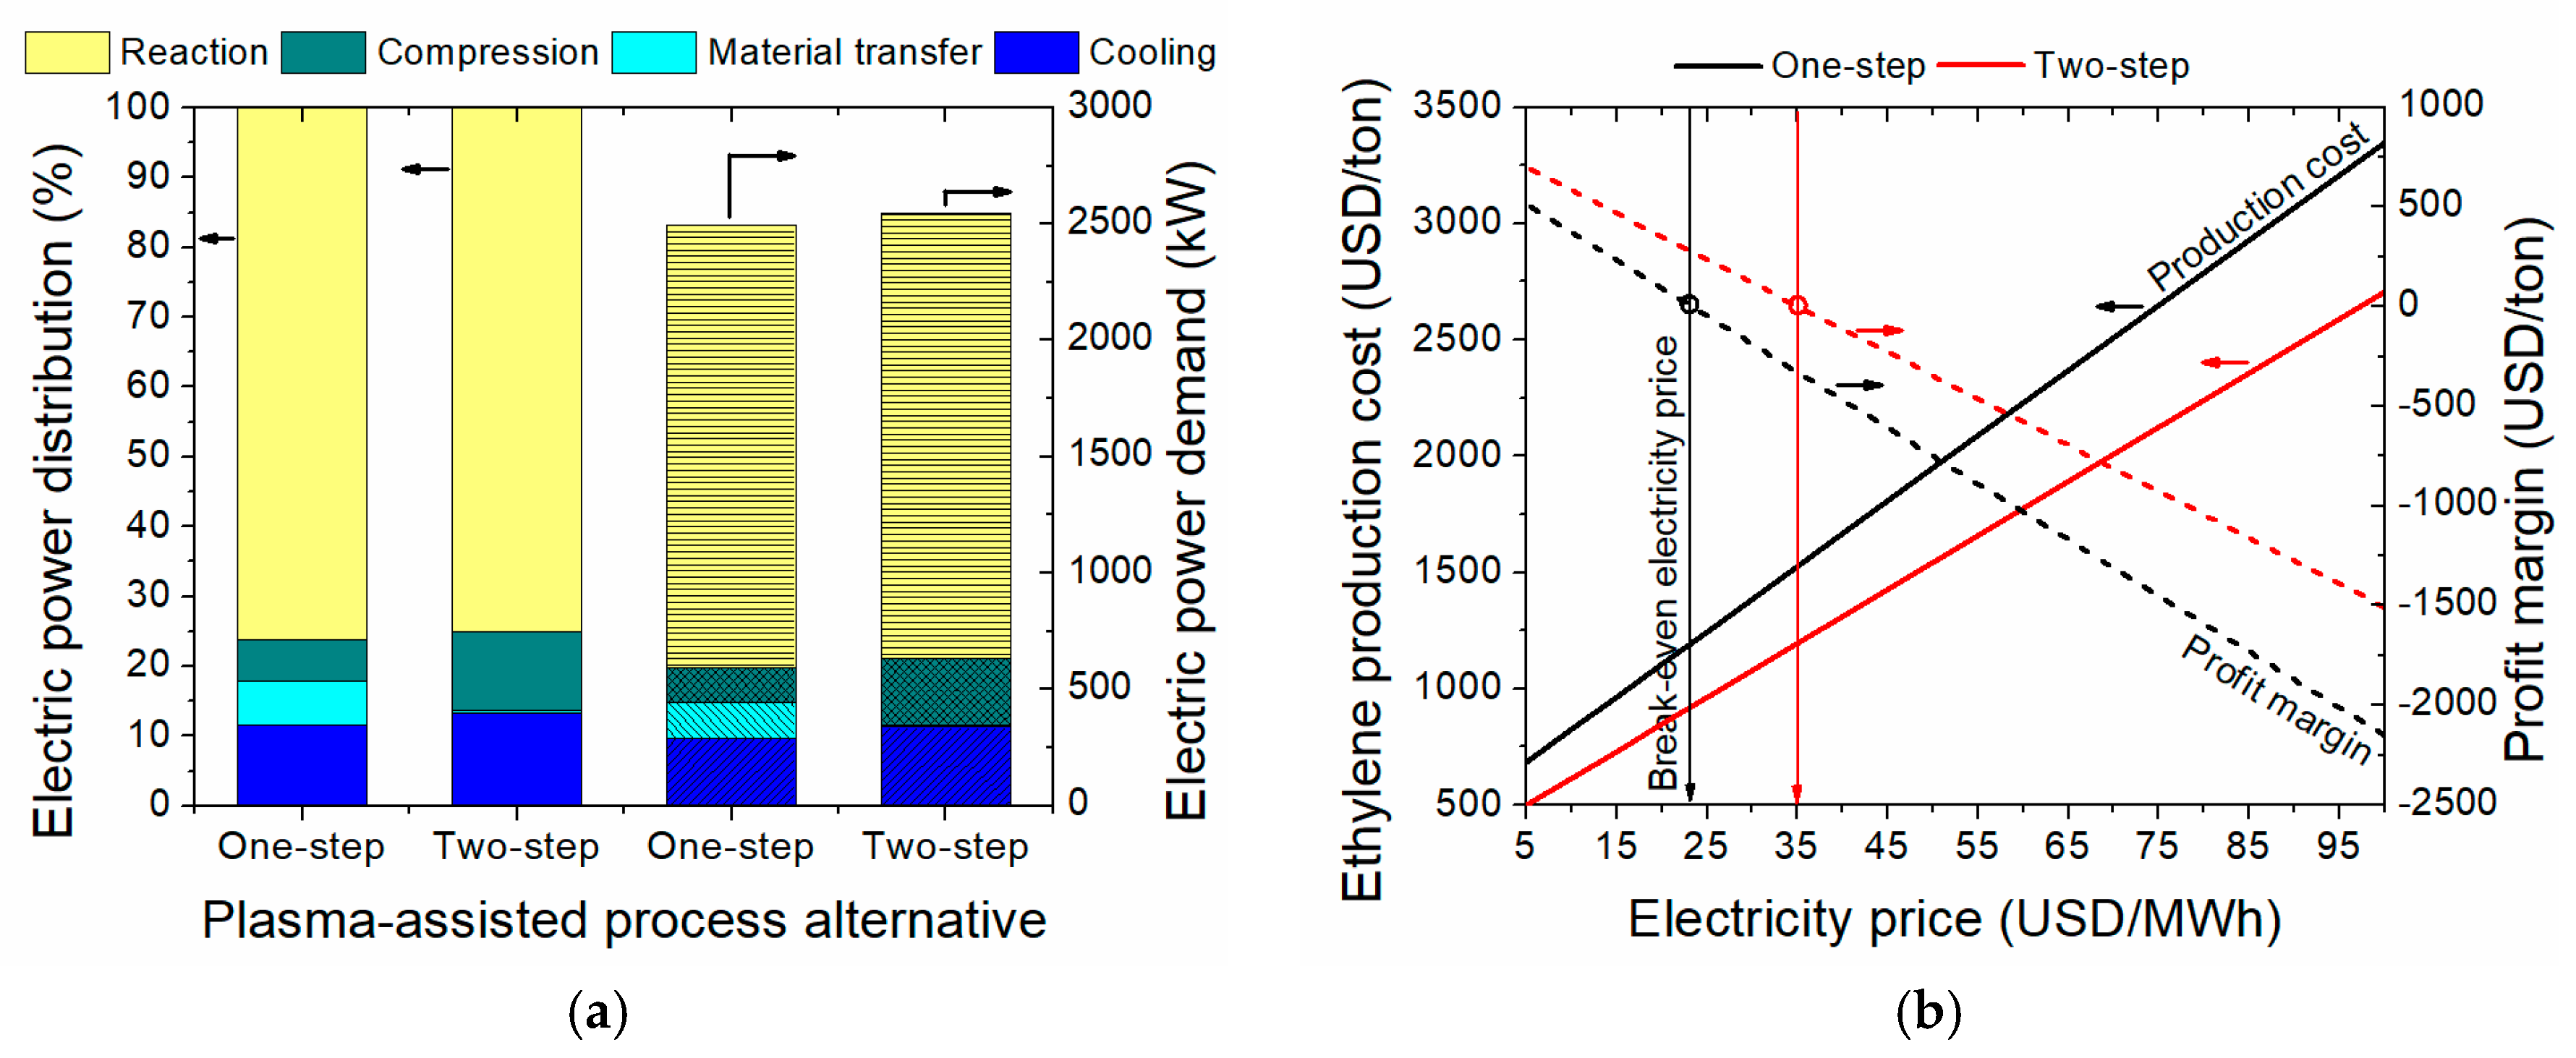
The reactants conversion and products selectivity set in the simulation of plasma reactors for both process alternatives are based on linear extrapolation of the experimental data shown in Figure 2. The experiments reported in our previous works [11] and [12] were repeated by co-feeding C2H6 and CO2, the most important compounds, after methane, in shale gas reservoirs, to simulate a more realistic case. A feed stream containing 82% CH4, 15% C2H6, and 3% CO2 on a molar basis, which is aligned with the composition attained after the dehydration unit in the simulation, was fed into the NPD reactor. The plasma-assisted reaction was run at the optimum operating window, as is also defined in the reference works [11,12]. No essential differences are observed in the NPD reactor performance after C2H6 and CO2 addition. Moreover, C2H6 and CO2 concentrations decrease as they are cracked in the plasma zone. CH4, C2H6, and CO2 conversions of ~35%, ~60%, and ~25%, respectively, and C2H4 selectivity of ~54% are attained in the one-step process consuming ~2020 kJ/molC2H4 electric energy. CH4, C2H6, and CO2 conversions of ~33%, ~45%, and ~25%, respectively, and C2H4 selectivity of ~74% are attained in the two-step process consuming ~1642 kJ/molC2H4 electric energy.
However, carbon formed and deposited on the electrodes over time gradually decreases the NPD reactor performance, mainly affecting CH4 conversion. Thus, lower C2H4 yields are attained over the course of reactor operation, as shown in Figure 3, until the reactor is cleaned again. In order for a realistic simulation, a decreased ethylene yield by one-third (lower CH4 conversion by 33%, but constant C2 selectivity) is considered, as compared to the actual ethylene yield shown in Figure 2 corresponding to the first operating cycle in which the reactor is clean, i.e., before the first decoking operation.
Since not all hydrocarbons produced in the plasma zone have been identified and quantified, the remaining carbon lack is solely attributed to carbon formation. In the case of C2H6 and CO2 addition, C2H6 is both the reactant and product. However, it is only considered as a reactant in the simulation as the amount that is co-fed is one order of magnitude higher than that produced in the NPD reactor. The amount of C2H4 contained in the recycling stream is assumed to be cracked to C(s) and H2 in order to be consistent with the experiments performed with CH4 containing C2H6 and CO2. CO2 and C2H6 are cracked to CO and C2H4 with 100% selectivity in the simulation. Collectively, the reactions presented in Table 1 are considered for the simulation. The respective fractional conversion that was set in the reactor model to simulate the experimental results is also presented in Table 1.
-
The stochiometric reactor (RSTOIC) model is used to simulate the plasma reactor at steady state in the Aspen Plus process simulator (Version 10, AspenTech, Bedford, MA, USA) since the stoichiometry and molar extent of the reactions taking place have been defined by the experiments.
-
Numbering up the small-scale NPD reactors is foreseen as the most possible way to achieve higher capacities. Current industrially launched plasma reactors are based on this approach [25]. Therefore, linear extrapolation of the experimental data is considered a valid assumption. The reactor feed used in the simulation corresponds to a rate ~104 higher than the one tested in our experiments. Given that the industrially launched units can host a bundle of ~750 plasma reactors, nine units placed in parallel would satisfy the selected capacity.
-
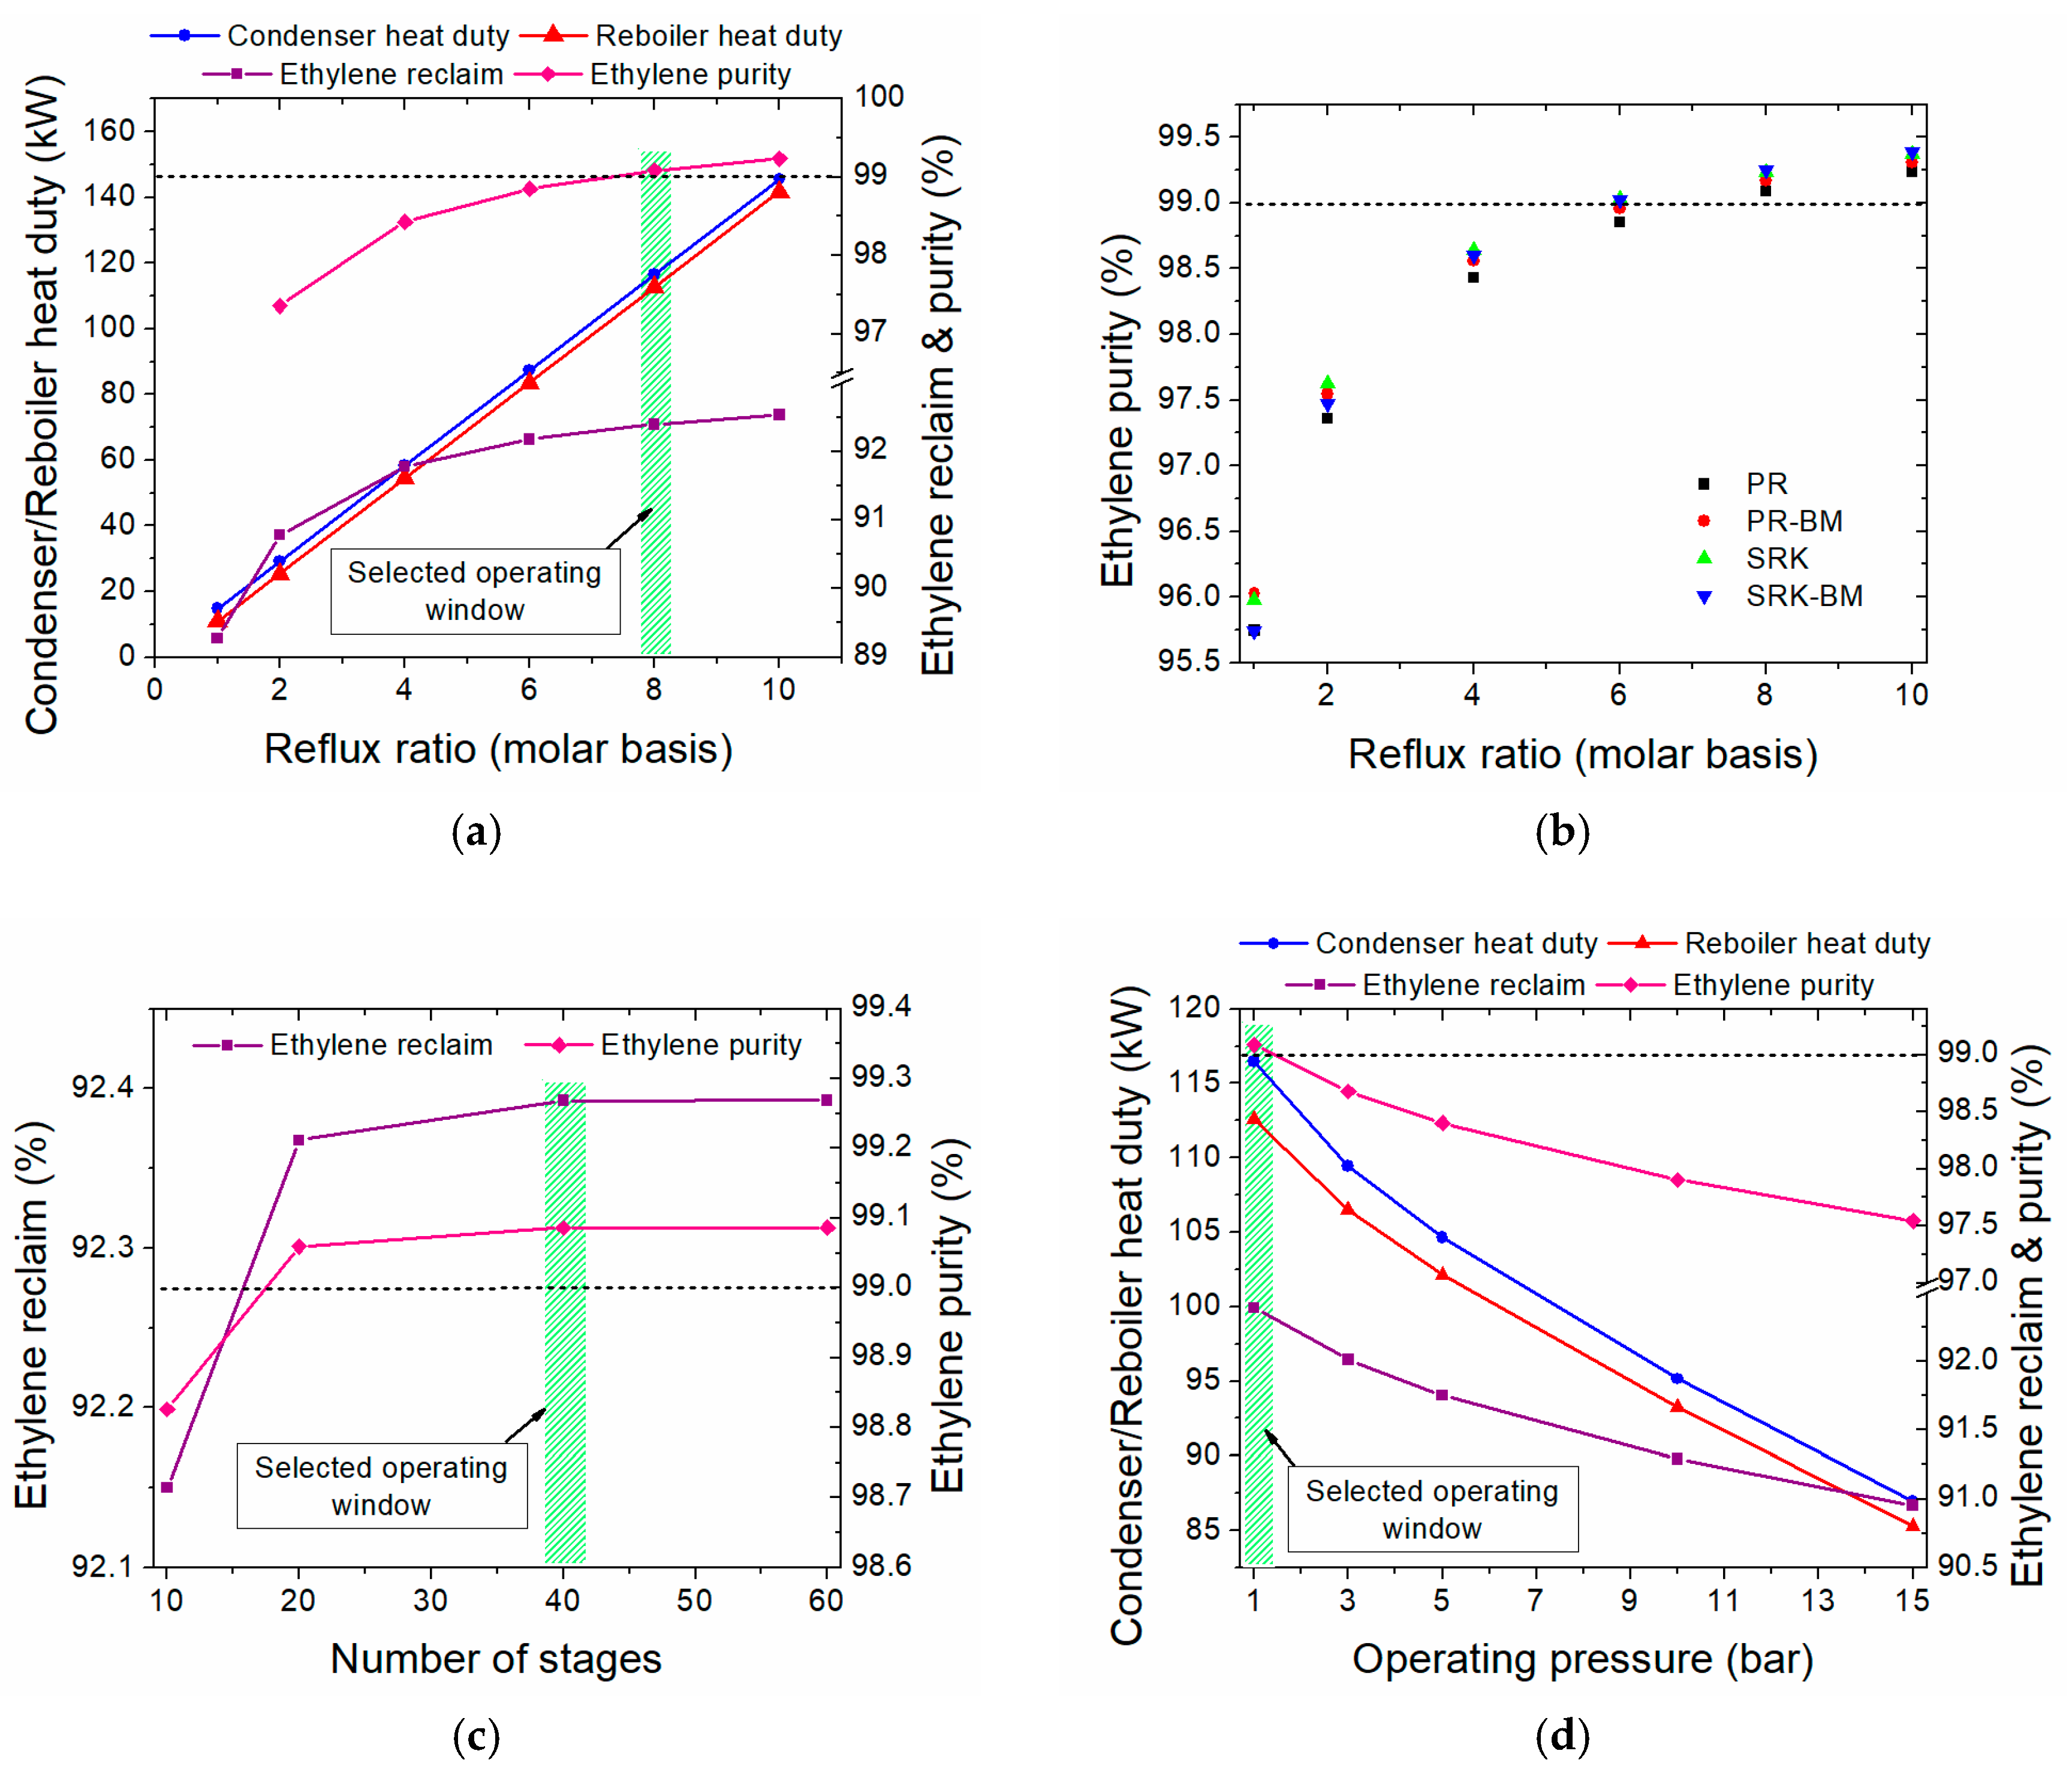
Ethylene for polymers production is aimed to be produced via the plasma-assisted process; thus, polymer-grade ethylene (≥99% mol purity [26]) is delivered.
-
While polymerization is hardly activated at mild temperature conditions in the absence of catalyst, compressors outlet stream temperature does not exceed 120 °C to prevent olefins polymerization.
-
Compressors inlet stream is free of carbon particles to prevent cylinder lubrication removal and excessive wear [21]. Moreover, neither condensates, nor liquids are contained to avoid major compressor damages (i.e., slug flow, carryover from interstage coolers and flow changes [27]) and valves failure [28]).
-
Liquified shale gas of −162 °C is used as cooling medium, which turns to the gas phase after heat exchange with the hot streams. To maintain sufficient heat exchange rates, temperatures <−125 °C are never reached.
Taking into account the scope of the current work and the abovementioned assumptions, the process development of both plasma-assisted process alternatives is based on the block diagram presented in Figure 4. The block diagram simply describes the basic process steps involved in polymer-grade ethylene production from shale gas employing NPD reactors.
While most of the free water coming from the hydraulic fracturing extraction process [29] is removed by simple separation methods at the wellhead, raw shale gas delivered as feedstock still contains water vapor dissolved in natural gas [30]. Therefore, a dehydration step is usually involved in the pre-processing of the extracted shale gas to remove the remaining water content and increase the gas heating value. Triethylene glycol (TEG) is used as a dehydration agent [31]. The dehydrating process step is presented in Figure 5a. The wet shale gas, which enters from the bottom of the absorber tower T-101, comes into contact with the lean (pure) TEG, which enters from the top and flows down, counter-currently to the wet gas flow. The water is absorbed by the TEG, while the free-of-water gas escapes from the top and is subsequently fed into the plasma reactor. The absorber operates at 5 bar to enhance mass transfer. The rich TEG is stripped of the water in the stripping column T-102 at atmospheric pressure and the lean TEG is recycled to the absorber. A TEG make-up stream is added to replace the amount of TEG lost in the stripping unit. The hot regenerated lean TEG exchanges heat with the rich TEG that flows out of the absorber prior to the stripper. Mass and energy balance of the dehydration unit are presented in Supplementary Material; Table S1.
In both plasma-assisted processes, water is used as external hot utility since the supplied and targeted process streams temperatures are below 0 °C. The water is supplied at 25 °C and a temperature decrease of 5 °C is considered in the simulation. The low temperatures required in cryogenic separations in both process alternatives are attained through refrigeration cycles utilizing shale gas as a refrigeration medium. The refrigeration cycle is presented in Figure 5b. An auxiliary shale gas stream is compressed at 60 bar and cooled down to −28 °C before it expands back to atmospheric pressure [32]. A cold liquified shale gas stream of −162 °C is attained through this operation and is further used as coolant in the process. The gaseous auxiliary shale gas stream (after the contact with the process streams) is recycled to the compressor.

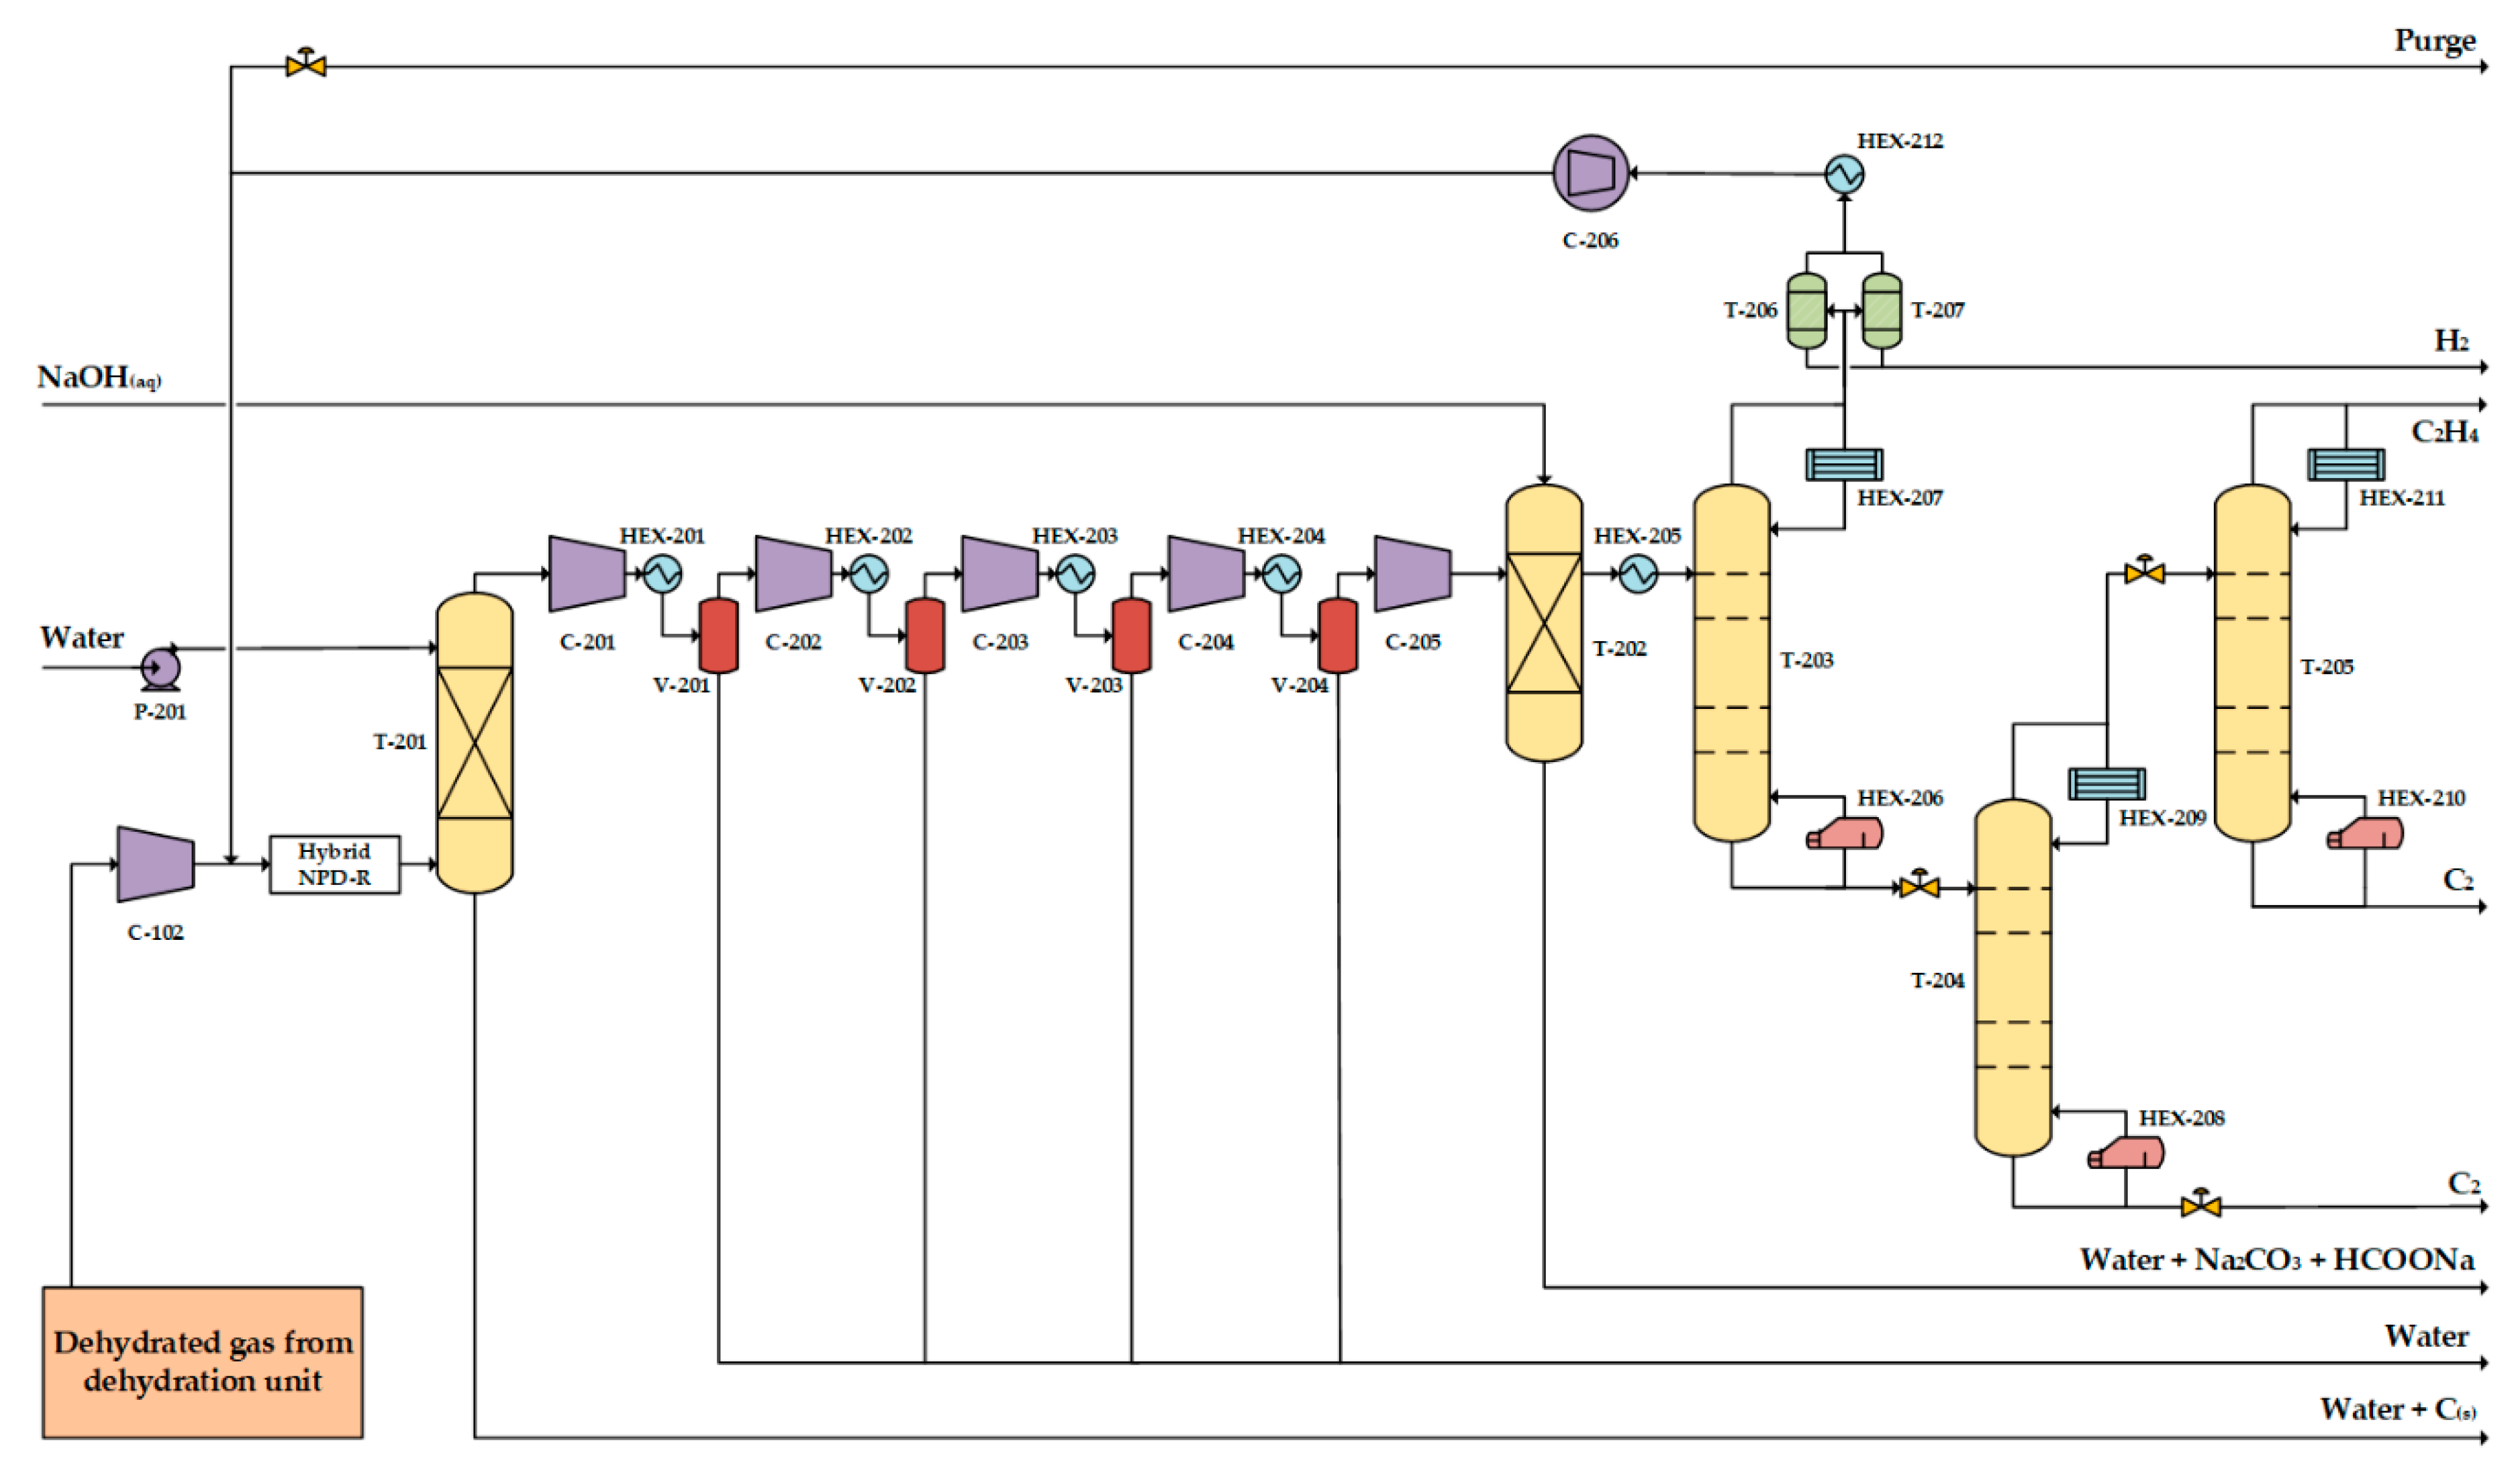
3.2. One-Step Process

The process flow diagram (PFD) of the one-step plasma-assisted process, which delivers polymer-grade ethylene from shale gas, is presented in Figure 6. The free-of-water shale gas coming out of the dehydration unit is fed in the nanosecond pulsed discharge reactor (NPD-R) which operates at 5 bar. The NPD-R effluent, composed of CH4, H2, C2H6, C2H4, C2H2, CO2, CO, O2, and C(s), is driven to the washing column T-201 in which solid carbon and possibly higher hydrocarbons are removed.
The free-of-solids gas stream exits from the top of T-201 and is compressed up to 31 bar to facilitate CH4 and H2 reclaim [33]. A three-stage compression is employed: 5 to 12, 12 to 23, and 23 to 31 bar at the first (C-201), second (C-202) and third (C-203) stage, respectively. The intercoolers (HEX-201, HEX-202 and HEX-203) maintain the gas temperature below 120 °C to inhibit possible olefins polymerization.
The formed CO and unreacted CO2 are removed in the caustic tower (T-202). Aqueous NaOH solution (22 wt% [34]) comes into contact with the gas stream, which enters from the bottom, as it flows down and reacts with CO and CO2, according to the following chemical reactions:
2NaOH + CO2 → Na2CO3 + H2O
NaOH + CO → HCOONa
Na2CO3, which can also be formed by HCOONa dissociation [35], also reacts with CO to form Na2C2O4. For simplicity of the simulation, only the abovementioned reactions are considered. In the same unit, the free-of-acid gases stream is further deoxygenated [36] and the clean gas escapes from the caustic tower top.
The clean gas stream is cooled in HEX-204 down to −115 °C and liquified prior to de-methanizer (T-203), in which CH4 and H2 are separated from the C2 species. The established economically favorable design and operating window of the de-methanizer is explicitly discussed in Section 3.2.1. The top product, rich in CH4 and H2, is driven through a pressure swing adsorption (PSA) unit to remove a part of H2 [37] prior to its recycling to the NPD-R. The H2 amount removed in PSA unit is set in such a way that CH4:H2 = 1:1 (on molar basis) in the NPD-R feed stream, after CH4 and H2 recycling and mixing with fresh dehydrated shale gas. A turbine is also used to produce work from the gas expansion of the recycle stream. A purge stream prevents any chemical substance accumulation.
The de-methanizer bottom product, rich in C2 species, is driven to de-ethanizer (T-204) to reclaim C2H4. The established economically favorable design and operating window of the de-ethanizer is explicitly discussed in Section 3.2.1. Ethylene of 92.3% purity is attained as top product while C2H6 is reclaimed at the bottom. Finally, C2H4 is fed to the purifier in which polymer-grade C2H4 is attained after an intensive cryogenic separation. The purifier economically favorable operating conditions and design are discussed in Section 3.2.1.

3.2.1. Process Design of the One-Step Process

Economically favorable equipment design (minimum required stage number) and operating window (reflux ratio and operating pressure) of the three columns (de-methanizer, de-ethanizer, and purifier), required to attain polymer-grade C2H4 as final product, are established via sensitivity analyses. Maximum C2H4 reclaim ratio (C2H4 reclaimed after the separation/C2H4 produced in NPD-R), >99% C2H4 purity and minimum hot and cold utilities requirement are set as key performance indicators (KPIs).
Elevated reflux ratios promote higher separation efficiency by means of C2H4 reclaim and purity. The condensed C2H4 that flows back to the column directly affects the column temperature profile: Higher C2H4 reflux ratios impose (1) higher temperatures in the column stripping section, which subsequently lead to decreased C2H4 (volatile compound) condensation rates (lesser C2H4 ends up in the bottom stream; higher C2H4 reclaim); (2) lower temperatures in rectifying column section which subsequently lead to enhanced C2H6 (heavy compound) condensation rates (lesser C2H6 ends up in the top stream; higher C2H4 purity). A relevant example of the one-step de-methanizer temperature profile at different reflux ratios is presented in the Supplementary Material; Figure S1. Higher reflux ratios also promote higher contact times between vapor and liquid phases, enhancing heat and mass transfer rates, and thus, further improving the separation efficiency. However, when the reflux ratio exceeds a certain value, no substantial differences in column temperature profile are imposed, as shown in Supplementary Material; Figure S1 for reflux ratios >0.8. Considering that the separation degree is driven by the vapor-liquid equilibrium (VLE), which only depends on the temperature for a certain mixture and fixed pressure, changes in VLE equilibrium, and consequently, in vapor and liquid phase composition will be trivial for reflux ratios >0.8, only marginally affecting the separation efficiency. In addition, high reflux ratios are associated with high liquid and vapor amounts that may cause operation problems, such as flooding or weeping. Finally, high reflux ratios increase the re-boiler and condenser heat duty, increasing the separation cost.
In an effort to avoid high reflux ratios, a sensitivity analysis is performed and presented in Figure 7a: The impact of de-methanizer reflux ratio on C2H4 reclaim and purity as well as re-boiler and condenser heat duty is studied. A reflux ratio within the range 0.6–0.8 is considered economically preferable. Below that range, low C2H4 reclaim and purity are attained. Higher than this range, reflux ratios result in slightly higher C2H4 reclaim and purity, but significantly higher condenser and re-boiler heat duties. For instance, when operating at reflux ratio three instead of 0.8, an increase of 0.05% and 0.12% in C2H4 reclaim and purity is attained, respectively, consuming 2.5 and 2.7 times more cold and hot utility, respectively, as shown in Figure 7a (the marginal C2H4 reclaim and purity increase when operating reflux ratio >0.8 is not clear due to axis scale). The same trends have also been observed as relevant for cryogenic distillation design works [38,39].
Separation efficiency is also affected by the number of stages used in the separation unit since higher contact times between the vapor and the liquid phase are achieved. For compounds with close relative volatilities (like in the current case), a high number of stages is required, which directly impacts the column capital cost [39]. In order to identify an economically favorable design, the impact of stages number on C2H4 reclaim and purity was also studied. An increase in the number of stages results in higher C2H4 reclaim and purity, as shown in Figure 7b. However, beyond the 15th stage, only marginal improvements in C2H4 reclaim and purity are attained (0.001% increase by adding 25 stages more). Vapor and liquid phase compositions are very close to the equilibrium for the given operating conditions, and thus, additional stages do not significantly enhance the separation, but increase the column capital cost, eventually increasing the specific cost of the separation. Finally, a fifteen-stage column (T-203) operating at 31 bar [33] with reflux ratio 0.8 is selected for CH4 and H2 reclaim.
Economically favorable values for the one-step process de-ethanizer (T-204) reflux ratio, stage number, and operating pressure are defined via the sensitivity analysis presented in Figure 8. Operating at reflux ratio 6, 94% and 92% C2H4 reclaim and purity are attained, respectively, whereas hot and cold utility demand remains relatively low (Figure 8a). Further reflux ratio increase (i.e., operating at 10) does not significantly affect the column temperature (consequently not VLE either), thus improvements in C2H4 reclaim and purity are trivial (when operating at reflux ratio 10, instead of 6.0, C2H4 reclaim and purity increase by 0.6%, while 66.5% and 66% more hot and cold utility demand, respectively, are required). Stages addition significantly affects the purity of C2H4 obtained as top product. Beyond the 25th stage, no substantial C2H4 purity increase is attained, as presented in Figure 8b, since vapor and liquid compositions approach the thermodynamic limit and the separation driving force considerably drops. Only 0.03% increase in C2H4 purity is attained by adding 25 more stages. The column pressure strongly affects both C2H4 reclaim and purity, as presented in Figure 8c, since the VLE changes. While operating pressures lower than the de-methanizer one (31 bar) enhance the separation of C2H4 from C2H6 and C2H2, when pressure falls below 10 bar, the condenser heat duty notably increases due to the boiling point decrease. Therefore, a 10 bar operating pressure offers a fair trade-off between high C2H4 reclaim and purity (94% and 93%, respectively) and moderate cold duty demand. Eventually, a twenty-five-stage column (T-204) operating at 10 bar and reflux ratio 6 facilitates an efficient C2H4 separation from C2H6 and C2H2 at this step.
High C2H4 purity (≥99%) requires an energy demanding separation of C2 compounds. In the case of ethylene and ethane separation, large distillation columns with high reflux ratios are necessary [40]. In an effort to reduce the utility demand and the column size, reflux ratio, stage number, and operating pressure values of the one-step process purifier (T-205) are established via the sensitivity analysis presented in Figure 9. The separation intensity is reflected on the high reflux ratio and number of stages required to reach ≥99% C2H4 purity. When operating at reflux ratios ≥8.0, the C2H4 reclaim ratio remains high (>92%), while purity exceeds 99%, as shown in Figure 9a. Depending on the equation of state (EOS) used to calculate the thermodynamic properties of the system, the targeted C2H4 purity may also be reached by lower reflux ratios (i.e., 6.0). A sensitivity analysis on the reflux ratio impact on C2H4 purity using the most common in oil and gas field EOS is presented in Figure 9b. While C2H4 purity slightly changes over the different EOS, reflux ratios >6.0 always suffice to reach the targeted C2H4 purity. However, reflux ratio 8 offers a trade-off between ≥99% C2H4 purity and moderate utility demand (Figure 9a). Comparable reflux ratio values have been used in other works (8.2–9.6 [41] and 6.0 [42]). Higher reflux ratios may increase the risk of flooding or weeping, as previously discussed. Regarding the column size, 40 stages can facilitate an efficient ethylene/ethane separation, attaining ≥99% C2H4 purity, as shown in Figure 9c. Higher number of stages will significantly increase the column size and subsequently the capital cost without majorly improving the separation degree. Performing the final C2H4 purification at low pressure, both C2H4 reclaim and purity are enhanced. The targeted C2H4 purity is only attained when operating at atmospheric pressure, as shown in Figure 9d. As pressure increases, the ethylene and ethane boiling points are shifted and the relative volatility increases, promoting a higher degree of separation at the expense of higher utility demand (Figure 9d). It is worth mentioning that reflux ratio and operating pressure appear to have higher impact on C2H4 reclaim and purity than the number of stages. Therefore, the former two variables are investigated first. Collectively, a forty-stage column (T-205) is employed for the final C2H4 purification, operating at reflux ratio 8 and atmospheric pressure in order to deliver ≥99% C2H4 purity (top product).

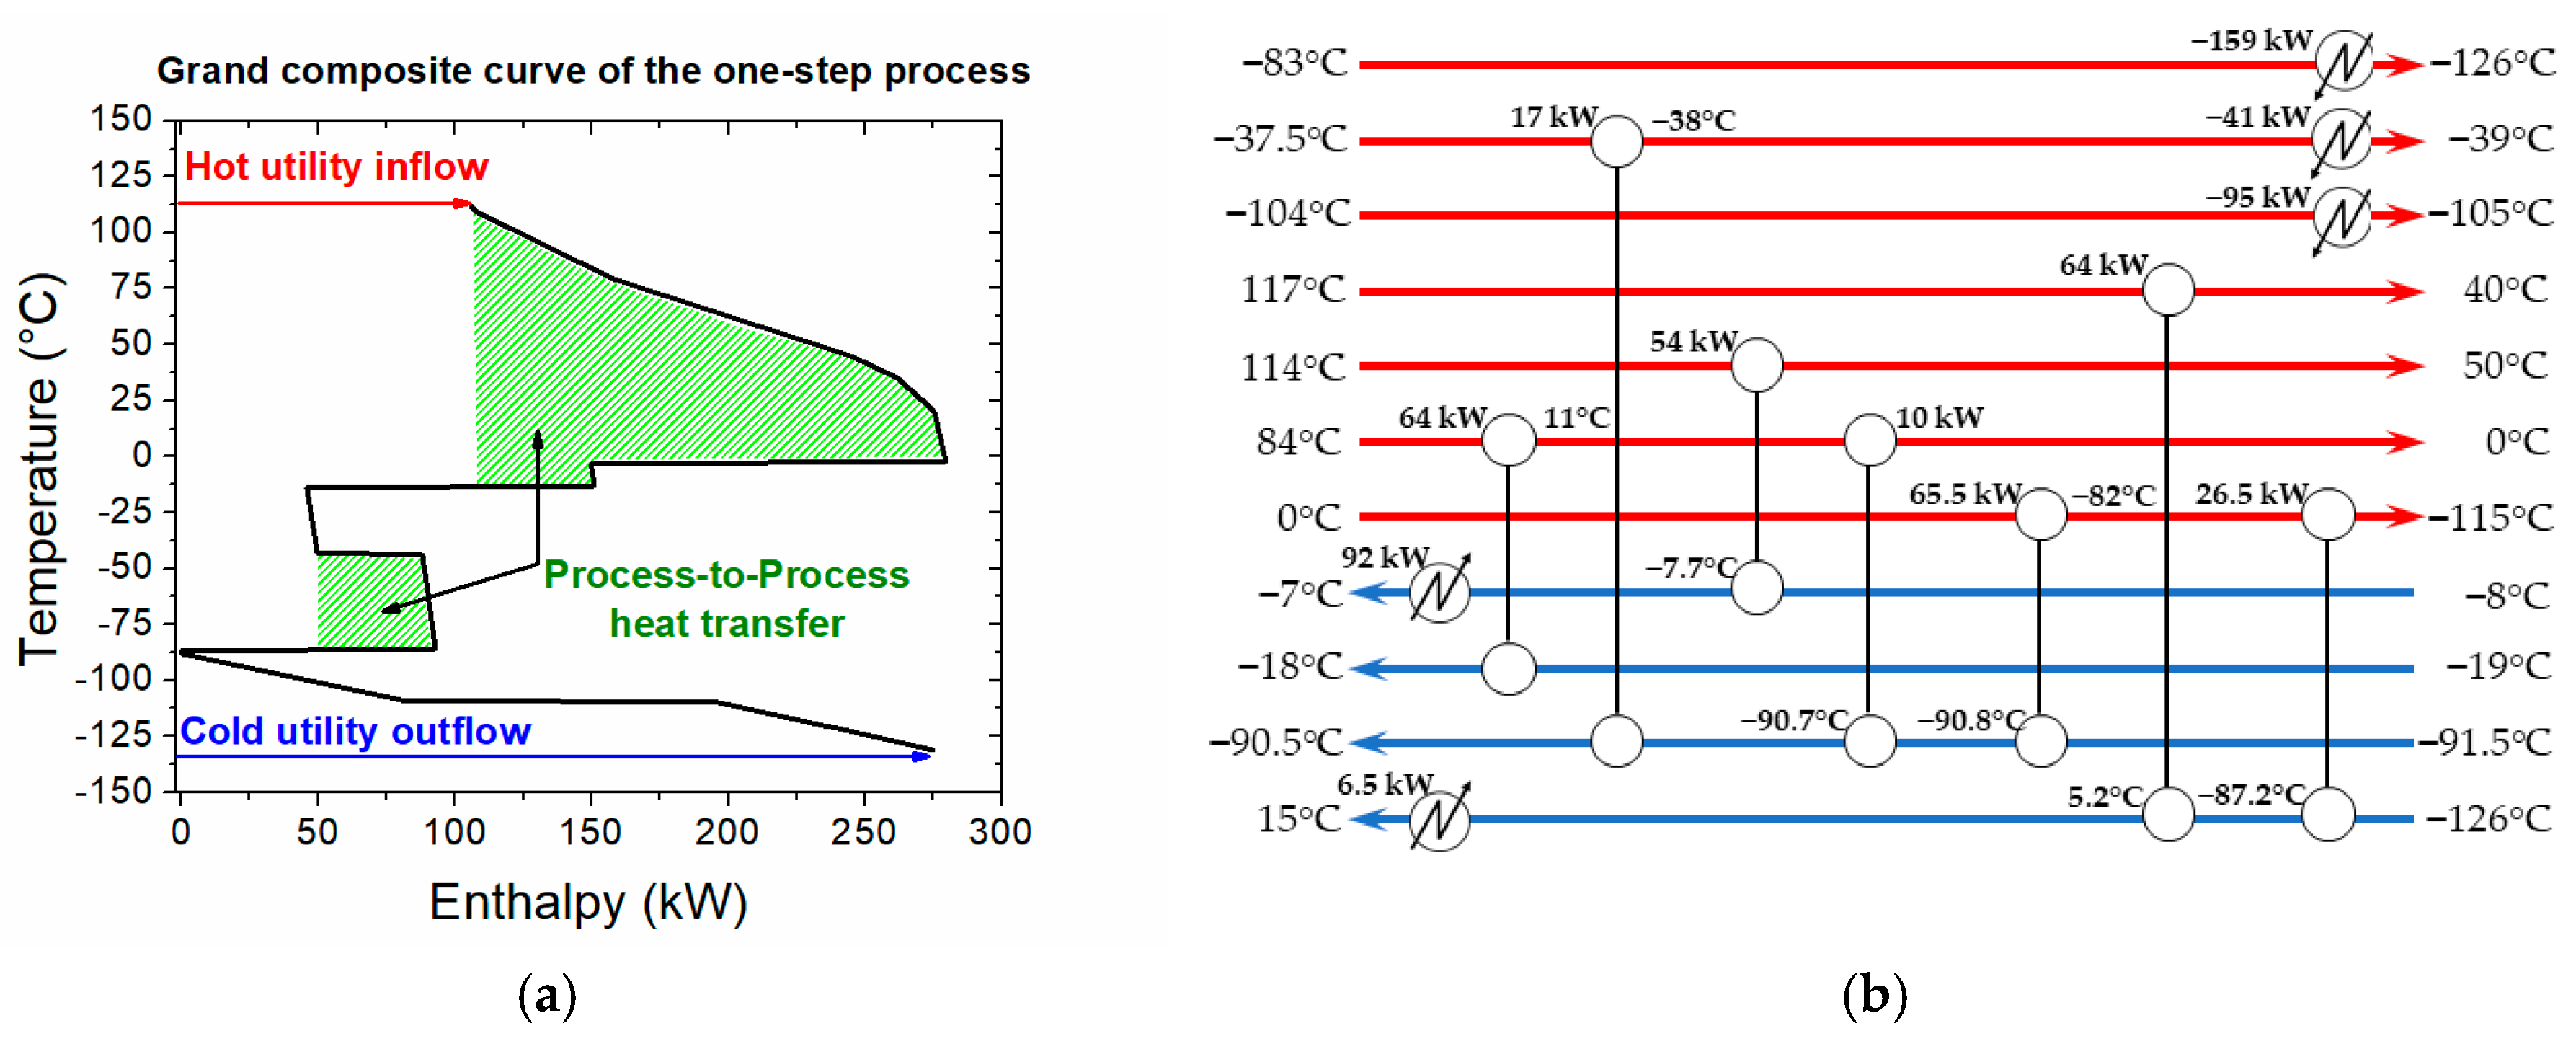
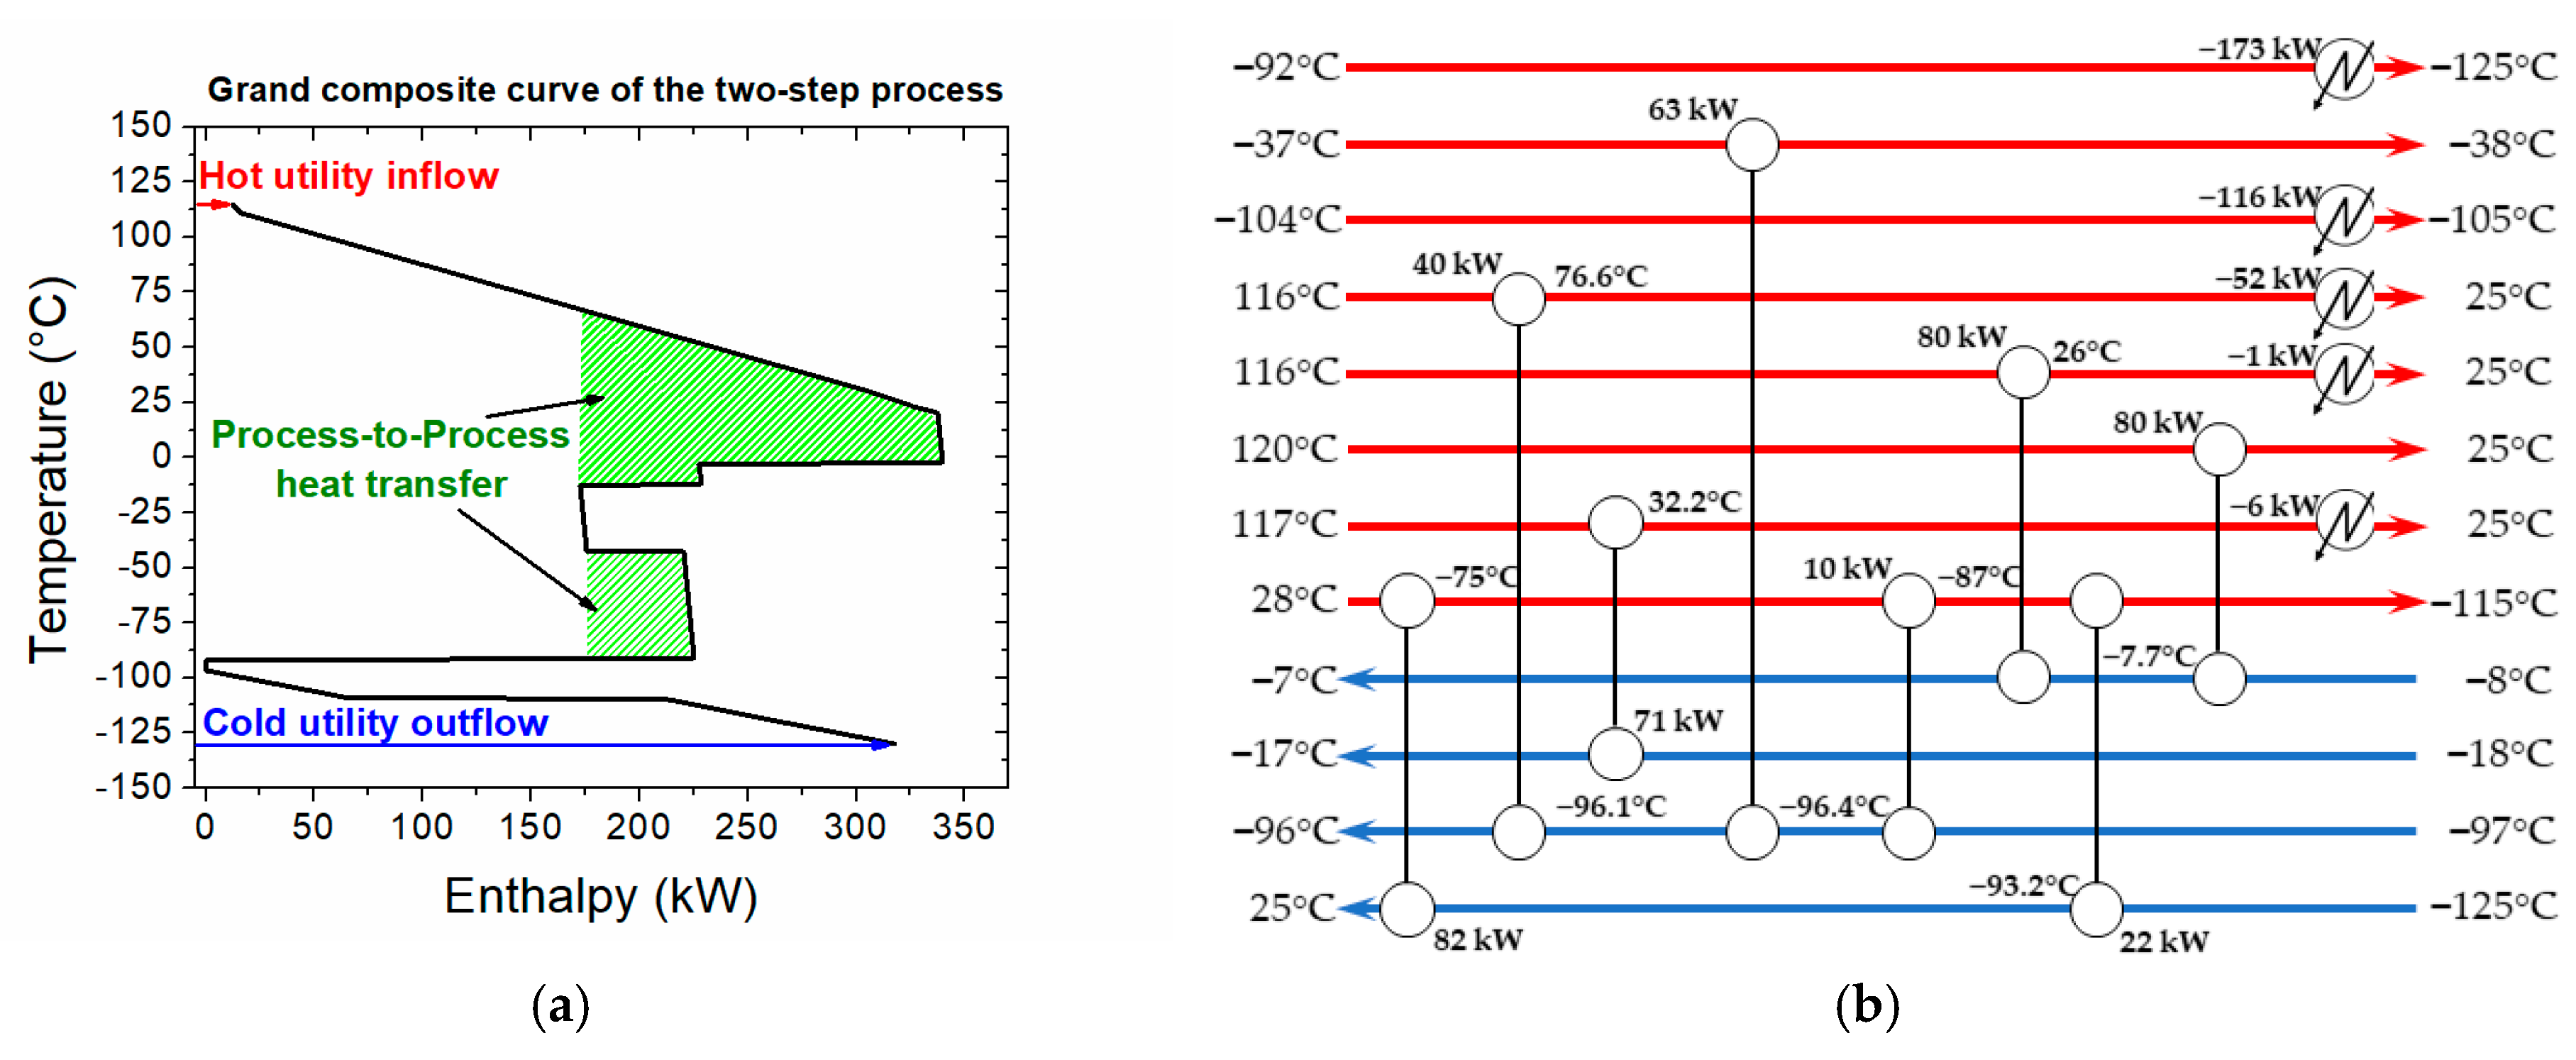
3.2.2. Heat Integration in the One-Step Process

To simulate a more relevant industrial environment, the heat contained in the one-step process is valorized via process stream heat integration prior to external utility supply. A heat exchanger network is first designed with respect to pinch analysis principles, and then, hot and cold utility demand is minimized. The pinch analysis is based in the following inputs:
-
The minimum temperature difference (ΔΤmin) is set at 10 °C
-
The streams enthalpy is based on the energy balances obtained by the process simulation.
-
For the streams in which phase change occurs (i.e., condensers and reboilers), a pseudo CPM is calculated, accounting for both the latent and sensible heat; for the latter, a temperature difference of 1 °C is always considered.
In the one-step process, seven hot and four cold process streams (Supplementary Material; Table S3) are matched to achieve lower external utility demand. High amount of energy is contained in the process (Supplementary Material; Table S4), which can be utilized to heat up the cold process streams, as shown in Figure 10a. The lower targeted temperatures of the cold streams as compared to those of the hot streams permit sufficient heat exchange among the process streams, and thus, high-energy recovery. Given the process streams temperature restrictions, the heat exchanger network presented in Figure 10b is proposed to reduce the external hot and cold utility demand. Finally, 75% and 51% reduction in hot and cold utility demand, respectively, is achieved after heat integration (Table 2).

3.3. Two-Step Process

The PFD of the two-step plasma-assisted process for polymer-grade ethylene formation from shale gas is presented in Figure 11. The dehydrated shale gas is fed in the hybrid (NPD) plasma-catalytic reactor (hybrid NPD-R), which operates at atmospheric pressure. The hybrid NPD-R outlet stream, which contains the same species as the NPD-R, although in different ratios since the performance is different, is treated in the washing column T-201 prior to downstream processing. Carbon particles and higher hydrocarbons, typically formed in the plasma reactor, are removed by the counter-current water flow in the washing column.
The clean gas stream is further compressed in a multi-stage compression unit up to 31 bar, enhancing CH4 and H2 removal from C2 species [33]. To reduce the compression stages, water condensates, formed by the compression and intercooling (required to keep olefins temperature below 120 °C), are removed after each compression stage in flash drums. Eventually, a five-stage compression unit (1 to 2.4, 2.4 to 5.5, 5.5 to 13, 13 to 30 and 30 to 31 bar at the first (C-201), second (C-202), third (C-203), fourth (C-204), and fifth (C-205) stage, respectively), equipped with four intercoolers (HEX-201, HEX-202, HEX-203 and HEX-204) and four flash vessels (V-201, V-202, V-203, and V-201) are used.
Other gases such as CO, unreacted CO2 and O2 are removed in the caustic tower (T-202) by adding aqueous NaOH solution (22 wt% [34]), as in the one-step process, before the gas stream gets cooled in HEX-205 down –115 °C and liquified prior to de-methanizer (T-203). The established economically favorable design and operating window of the de-methanizer is explicitly discussed in Section 3.3.1. A part of H2 is first removed from the de-methanizer top product in a PSA unit to obtain a ratio of CH4:H2 = 1:1 (on molar basis) in the hybrid NPD-R feed stream, after the recycling and fresh dehydrated shale gas feed mixing. A turbine is employed to produce work from the recycling gas stream expansion, while a heater (HEX-212) is used to prevent the presence of condensates in the turbine suction. Chemical substances accumulation is avoided by a purge stream.
The bottom product is further processed in the de-ethanizer (T-204) to remove C2H6 and obtain the produced C2H4. The economically favorable design and operating window of the de-ethanizer is discussed in Section 3.3.1. The de-ethanizer top product (91.1% C2H4 purity) is further processed in a purifier to obtain polymer-grade C2H4. The economically favorable operating conditions and design for the purifier are discussed in Section 3.3.1.

3.3.1. Process Design of the Two-Step Process

Herein, economically favorable equipment design (minimum required number of stages) and operating window (reflux ratio and operating pressure) of the three columns (de-methanizer, de-ethanizer and purifier) used in the two-step process to attain polymer-grade C2H4 as the final product are established via sensitivity analyses. As mentioned, the maximum C2H4 reclaim ratio (C2H4 reclaimed after the separation/C2H4 produced in the hybrid NPD-R) and C2H4 purity consuming the minimum hot and cold utilities are the KPIs of the sensitivity analyses.
The impact of the reflux ratio and stage number of the de-methanizer (T-203) of the two-step process on the KPIs is presented in Figure 12. At reflux ratio 1, 97% and 75% C2H4 reclaim and purity are attained, respectively, whereas re-boiler and condenser duties do not exceed 180 kW. Operating at higher reflux ratios, the column operating conditions are not substantially affected and consequently, neither is the VLE. Therefore, the separation degree is practically constant. Indicatively, when operating at reflux ratio 5 instead of 1.0, 0.12% increase in C2H4 reclaim and purity is attained spending 3.7 and 4.0 times more hot and cold utility, respectively. Operating at reflux ratio 1 is preferable, not only from an economic side, but also from the operational perspective, since flooding and weeping are prevented.
To attain 97% and 75% C2H4 reclaim and purity, respectively, at the de-methanizer, at least 15 stages are required. Further stages addition (i.e., 15 stages more) will only slightly improve C2H4 purity and reclaim (~1% increase), as shown in Figure 12b. Vapor and liquid phase compositions approach those determined by VLE already at the 15th stage. Beyond that, the driving force of the separation gets very small and only marginal improvements are attained thus, the separation degree remains practically constant. A fifteen-stage column (T-203) operating at 31 bar [33] with reflux ratio 1 can facilitate a sufficient separation of CH4 and H2 from C2.
The sensitivity analysis to define the economically favorable reflux ratio, stage number, and operating pressure of the two-step process de-ethanizer (T-204) is presented in Figure 13. High C2H4 reclaim and purity (97% and ~91%, respectively) are attained when operating at reflux ratio 5, while hot and cold duty do not exceed 75 kW. Further reflux ratio increase does not strongly affect the VLE, so C2H4 reclaim and purity are not considerably improved, but utility demand increases. For instance, when operating at reflux ratio 10 instead of 5, negligible increase in C2H4 reclaim and purity is reached, but almost twofold hot and cold utility is required, as shown in Figure 13. Both from the economic and operational point of view, the lowest possible reflux ratio is preferable. Stage number also affects the separation efficiency up to the 25th stage; beyond that, the separation efficiency is only slightly improved by further stage addition (Figure 13b) due to negligible separation driving force. Using more than 25 stages, the separation cost rises. The column pressure can also affect the VLE, and consequently, the separation degree. When operating at pressures <31 bar (de-methanizer pressure), both C2H4 reclaim and purity are improved at the expense of reboiler and condenser duty, as shown in Figure 13c. However, when operating at pressures <15 bar, negligible C2H4 reclaim and purity improvement is obtained, while cold and hot utility demand increases (10% and 8%, respectively). Thus, a twenty-five-stage column (T-204) operating at 15 bar and reflux ratio 5 can efficiently remove C2H6 and C2H2 from C2H4 at this step.
As discussed in Section 3.2.1, high purity (≥99%) C2H4 is attained in the energy intensive purification step, employing a large column with many stages and high reflux ratio. Therefore, the two-step process purifier (T-205) reflux ratio, stage number, and operating pressure, which determine the separation cost, are selected based on the sensitivity analysis presented in Figure 14. The same economically favorable design as in the one-step process, comprising reflux ratio 8 (Figure 14a), 40 stages (Figure 14c) and atmospheric operating pressure (Figure 14d) is used, since (1) high C2H4 reclaim and the targeted purity are attained, irrespective of the EOS used for the VLE (Figure 14b); (2) the smallest possible column is used; (3) moderate amount of hot and cold utility is spent; and (4) flooding and weeping are prevented. Considering that higher C2H4 yield is attained in the hybrid NPD-R as compared to the NPD-R, higher flows are handled by the purifier T-205 in the two-step process; thus, a higher amount of hot and cold utility is required.

3.3.2. Heat Integration of the Two-Step Process

In the two-step process, eight hot and four cold process streams (Supplementary Material; Table S8) can be integrated in a heat exchanger network to reduce the external hot and cold utility consumption. As shown in the Supplementary Material (Table S9) and confirmed by Figure 15a, considerable energy pockets (generated by the hot process streams) appear in the two-step process and can be valorized in cold streams heating. Given the pinch analysis assumptions set in Section 3.2.2 and process streams temperature restrictions, the proposed heat exchanger network is presented in Figure 15b. Application of heat integration shows that (1) no external heat is required for the cold streams heating up and (2) 56% saving in cold utility can be achieved, as reported in Table 3.

4. Evaluation of the Plasma-Assisted Process Alternatives

Both electrified processes designed above are considered promising process alternatives for polymer-grade ethylene production. Due to different advantages and disadvantages of each process alternative, conclusions on the superiority of one over the other is not simple. Therefore, indicators related to process economics are also taken into consideration next to the technological features.
A considerable advantage of the one-step process is that no catalyst is involved in the reaction, unlike in the two-step process. All reactions take place in the NPD-R occur in gas phase or catalyzed by the reactor fabrication material [18]. Therefore, challenges associated with catalyst utilization such as catalyst activation, regeneration, poisoning and aging do not disturb the continuous operation. In the two-step process, the hydrogenation catalyst clogging by carbon or other viscous hydrocarbons necessitates frequent regeneration, while impurities contained in shale gas may also affect the catalyst lifetime, and eventually, lead to lower performance. Further, a more complicated design, including filtering units and additional units to enable cyclic operation, is required in the two-step process as compared to the one-step alternative. Both NPD-R and hybrid NPD-R should operate in a cyclic mode due to carbon formation and accumulation; one unit will be in operation, while the other one will be in decoking process mode and vice versa. However, catalyst regeneration cycles are usually longer than the operating cycle of NPD-R, which makes the continuous production even more complicated.
Reactor performance is another crucial indicator. Hybrid NPD-R attains higher ethylene yield and, subsequently, higher shale gas conversion and ethylene production per single pass than the NPD-R. Consequently, lower material volume must be reclaimed and recycled in the two-step process (Figure 16a; Material transfer), but higher material volume should be treated downstream (in de-ethanizer T-204 and purifier T-205). Therefore, more electric power is required in the two-step process as shown by the cooling requirements (Figure 16a; Cooling). The plasma-assisted reaction is the most energy intensive step in both processes, accounting for ~75% of the total electric power demand (Figure 16a; Reaction), independent of the process design. Finally, the electric power demand for the reactor effluent compression, prior to downstream processing, is slightly higher in the two-step process (Figure 16a; Compression). Compression from atmospheric pressure to de-methanizer operating pressure (31 bar) is needed, whereas a pressure increase from 5 to 31 bar is necessary in the one-step process. Collectively, slightly higher electric power (~2%) is required in the two-step process. However, given that 7% higher C2H4 yield per single pass is attained in the two-step process, 21% less electricity is required, as compared to the one-step alternative, for the same amount (kton) of ethylene production. Detailed breakdowns of the total electric power and electricity demand of the one-step and two-step processes are shown in Supplementary Material; Table S5 and Table S10, respectively.
The electric power demand is the main driver of the economics of electrified processes. Considering that the current industrial electricity prices are 50–120 USD/MWh [43], depending on the location and source it is generated from, plasma-assisted ethylene production cannot be considered economically viable at present. However, the incessant renewable electricity growth will possibly lead to electricity price reduction [44]. In view of cheaper electricity supply scenarios, electrified processes can be turned into economically viable ventures in the future as shown in Figure 16b. Under the assumption of electricity price being the only cost driver (since the downstream process equipment may exist and assuming that the capital cost of NPD reactor is low in comparison to the operating cost) and considering average ethylene and gas market prices of 1200 USD/ton and 0.15 USD/m3, respectively, break-even electricity prices of 35 and 23 USD/MWh are calculated for the two-step process (Supplementary Material; Table S11) and one-step process (Supplementary Material; Table S6), respectively. Lower electricity prices than the break-even ones result in positive profit margins as presented in Figure 16b. Given that electricity prices can currently be even lower than 50 USD/MWh for energy intensive industries in some places [45], the scenario of plasma-driven process may become realistic in the future.

5. Conclusions

Plasma-assisted processes for high purity ethylene production are feasible. Two NPD reactor concepts have been investigated: (i) an NPD reactor which operates at elevated pressure (one-step process) and, (ii) a hybrid NPD reactor, in which catalyst is used to hydrogenate acetylene formed in the plasma zone to ethylene (two-step process). Both electrified process alternatives are robust to shale gas impurities and other substances are present. Their process flow diagrams are comparable and involve a de-methanizer, a de-ethanizer and a purifier to deliver polymer-grade ethylene. These units are also used in the conventional thermally-driven ethylene production process. Thus, integration of NPD reactors in existing ethylene production lines is feasible. The one-step process offers simple and robust operation since all reactions take place in gas phase, but requires higher electricity input. The two-step process attains higher ethylene yield than the one-step alternative, but challenges associated with catalyst utilization (catalyst activation, regeneration and poisoning) may disturb the continuous operation, or necessitate a complicated reactor design. While such electrified processes are not economically viable at present due to the relatively high electricity prices, decrease in electricity prices in the future, driven by the incessant growth of renewable electricity share, will radically affect the process economics. Considering that electricity is currently supplied at 50 USD/MWh in some places, while the calculated break-even price for the two-step process is 35 USD/MWh, the plasma-assisted process may become economically viable in the future.

Supplementary Materials

The following are available online at https://www.mdpi.com/2227-9717/7/2/68/s1, Table S1: Streams mass flow, composition, temperature and pressure conditions of the dehydration unit, Table S2: Streams mass flow, composition, temperature and pressure conditions; one-step process, Table S3: Process streams available for heat integration in the one-step plasma-assisted ethylene production process, Table S4: Heat balances for the temperature intervals and problem table algorithm of the on-step process, Table S5: Electric power demand distribution over the different process steps involved in the on-step process, Table S6: Profit margin of the one-step process as function of the electricity price, Table S7: Streams mass flow, composition, temperature and pressure conditions; two-step process, Table S8: Process streams available for heat integration in the two-step plasma-assisted ethylene production process, Table S9: Heat balances for the temperature intervals and problem table algorithm of the two-step process, Table S10: Electric power demand distribution over the different process steps involved in the two-step process, Table S11: Profit margin of the two-step process as function of the electricity price, Figure S1: One-step de-methanizer temperature profiles at reflux ratios 0.1, 0.8, 2 and 3. The column temperature profile remains practically constant for reflux ratios >0.8.

Author Contributions

The authors have equally contributed to this work.

Funding

This work has received funding from the European Union’s Horizon 2020 Research and Innovation Programme through project “Adaptable Reactors for Resource and Energy Efficient Methane Valorization” (ADREM) [No. 680777].

Conflicts of Interest

The authors declare no conflict of interest.

Glossary

HVHigh voltageGEGround electrode
GHGsGreenhouse gas emissionsNPDNanosecond pulsed discharge
NGLsNatural gas liquidsPRPeng-Robinson
TEGTriethylene glycolPFDProcess flow diagram
NPD-RNanosecond pulsed discharge reactorPSAPressure swing adsorption
HEXHeat exchangerKPIsKey performance indicators
ΔΤminMinimum temperature differenceCPMSpecific heat capacity content
VLEVapor-liquid equilibriumEOSEquation of state

References

  1. Convention on Climate Change: Climate Agreement of Paris; United Nations: Paris, France, 2015; pp. 1–27.
  2. Gao, Y.; Gao, X.; Zhang, X. The 2 °C Global Temperature Target and the Evolution of the Long-Term Goal of Addressing Climate Change—From the United Nations Framework Convention on Climate Change to the Paris Agreement. Engineering 2017, 3, 272–278. [Google Scholar] [CrossRef]
  3. De Pee, A.; Pinner, D.; Roelofsen, O.; Somers, K.; Speelman, E.; Witteveen, M. Decarbonization of Industrial Sectors: The Next Frontier; McKinsey & Company: Amsterdam, The Netherlands, 2018. [Google Scholar]
  4. Schiffer, Z.J.; Manthiram, K. Electrification and Decarbonization of the Chemical Industry. Joule 2017, 1, 10–14. [Google Scholar] [CrossRef]
  5. Edenhofer, O.; Pichs-Madruga, R.; Sokona, Y.; Farahani, E.; Kadner, S.; Seyboth, K.; Adler, A.; Baum, I.; Brunner, S.; Eickemeier, P. (Eds.) IPCC, 2014: Climate Change 2014: Mitigation of Climate Change. Contribution of Working Group III to the Fifth Assessment Report of the Intergovernmental Panel on Climate Change; Cambridge University Press: Cambridge, UK; New York, NY, USA, 2014; ISBN 9780444627483. [Google Scholar]
  6. Lechtenböhmer, S.; Nilsson, L.J.; Åhman, M.; Schneider, C. Decarbonising the energy intensive basic materials industry through electrification—Implications for future EU electricity demand. Energy 2016, 115, 1623–1631. [Google Scholar] [CrossRef]
  7. Bataille, C.; Åhman, M.; Neuhoff, K.; Nilsson, L.J.; Fischedick, M.; Lechtenböhmer, S.; Solano-Rodriquez, B.; Denis-Ryan, A.; Stiebert, S.; Waisman, H.; et al. A review of technology and policy deep decarbonization pathway options for making energy-intensive industry production consistent with the Paris Agreement. J. Clean. Prod. 2018, 187, 960–973. [Google Scholar] [CrossRef]
  8. Wesseling, J.H.; Lechtenböhmer, S.; Åhman, M.; Nilsson, L.J.; Worrell, E.; Coenen, L. The transition of energy intensive processing industries towards deep decarbonization: Characteristics and implications for future research. Renew. Sustain. Energy Rev. 2017, 79, 1303–1313. [Google Scholar] [CrossRef] [Green Version]
  9. Åhman, M.; Nilsson, L.J.; Johansson, B. Global climate policy and deep decarbonization of energy-intensive industries. Clim. Policy 2017, 17, 634–649. [Google Scholar] [CrossRef]
  10. Scapinello, M.; Delikonstantis, E.; Stefanidis, G.D. The panorama of plasma-assisted non-oxidative methane reforming. Chem. Eng. Process. Process Intensif. 2016, 117, 120–140. [Google Scholar] [CrossRef]
  11. Scapinello, M.; Delikonstantis, E.; Stefanidis, G.D. Direct methane-to-ethylene conversion in a nanosecond pulsed discharge. Fuel 2018, 222, 705–710. [Google Scholar] [CrossRef]
  12. Delikonstantis, E.; Scapinello, M.; Stefanidis, G.D. Low energy cost conversion of methane to ethylene in a hybrid plasma-catalytic reactor system. Fuel Process. Technol. 2018, 176, 33–42. [Google Scholar] [CrossRef]
  13. Van Rooij, G.J.; Akse, H.N.; Bongers, W.A.; Van De Sanden, M.C.M. Plasma for electrification of chemical industry: A case study on CO2 reduction. Plasma Phys. Control. Fusion 2018, 60, 014019. [Google Scholar] [CrossRef]
  14. Anastasopoulou, A.; Wang, Q.; Hessel, V.; Lang, J. Energy Considerations for Plasma-Assisted N-Fixation Reactions. Processes 2014, 2, 694–710. [Google Scholar] [CrossRef] [Green Version]
  15. Anastasopoulou, A.; Butala, S.; Patil, B.; Suberu, J.; Fregene, M.; Lang, J.; Wang, Q.; Hessel, V. Techno-Economic Feasibility Study of Renewable Power Systems for a Small-Scale Plasma-Assisted Nitric Acid Plant in Africa. Processes 2016, 4, 54. [Google Scholar] [CrossRef]
  16. Delikonstantis, E.; Scapinello, M.; Stefanidis, G.D. Investigating the plasma-assisted and thermal catalytic dry methane reforming for syngas production: Process design, simulation and evaluation. Energies 2017, 10, 1429. [Google Scholar] [CrossRef]
  17. Scapinello, M.; Martini, L.M.; Dilecce, G.; Tosi, P. Conversion of CH4/CO2 by a nanosecond repetitively pulsed discharge. J. Phys. D Appl. Phys 2016, 49, 075602. [Google Scholar] [CrossRef]
  18. Scapinello, M.; Delikonstantis, E.; Stefanidis, G.D. A study on the reaction mechanism of non-oxidative methane coupling in a nanosecond pulsed discharge reactor using isotope analysis. Chem. Eng. J. 2019, 360, 64–74. [Google Scholar] [CrossRef]
  19. Ravasio, S.; Cavallotti, C. Analysis of reactivity and energy efficiency of methane conversion through non thermal plasmas. Chem. Eng. Sci. 2012, 84, 580–590. [Google Scholar] [CrossRef]
  20. Bullin, K.; Krouskop, P. Composition Variety Complicates Processing Plans for US Shale Gas. In Proceedings of the Annual Forum; Gas Processors Association: Houston, TX, USA, 2008. [Google Scholar]
  21. Engineering Data Book, 13th ed.; Gas Processors Suppliers Association: Tulsa, Oklahoma, 2012.
  22. Laurenzi, I.J.; Jersey, G.R. Life cycle greenhouse gas emissions and freshwater consumption of marcellus shale gas. Environ. Sci. Technol. 2013, 47, 4896–4903. [Google Scholar] [CrossRef] [PubMed]
  23. Gusev, A.V.; Kornev, R.A.; Sukhanov, A.Y. Behavior of carbon-containing impurities during plasma synthesis of trichlorosilane. High Energy Chem. 2008, 42, 56–58. [Google Scholar] [CrossRef]
  24. Ashour, I.; Al-Rawahi, N.; Fatemi, A.; Vakili-Nezhaad, G. Applications of Equations of State in the Oil and Gas Industry. In Thermodynamics-Kinetics of Dynamic Systems; InTech: Rijeka, Croatia, 2011; pp. 165–178. ISBN 978-953-307-627-0. [Google Scholar]
  25. Kogelschatz, U. Dielectric-barrier discharges: Their History, Discharge Physics, and Industrial Applications. Plasma Chem. Plasma Process. 2003, 23, 1–46. [Google Scholar] [CrossRef]
  26. Petrochemical Industry Ethylene Plant. Process Gas Chromatography Application Note; SiemensAG: Karlsruhe, Germany, 2016; pp. 1–7.
  27. Bloch, H.P.; Hoefner, J.J. Reciprocating Compressors: Operation and Maintenance; Gulf Professional Publishing Co.: Houston, TX, USA, 1996. [Google Scholar]
  28. Bauer, F. The Influence of Liquids on Compressor Valves. Int. Compress. Eng. Conf. 1990, 647–653. [Google Scholar]
  29. Hoffman, A.; Gustaf, O.; Andreas, L. Shale Gas and Hydraulic Fracturing: Framing the Water Issue; Stockholm International Water Institute: Stockholm, Sweden, 2014; Volume 34, ISBN 9789198186017. [Google Scholar]
  30. Olds, R.H.; Sage, B.H.; Lacey, W.N. Phase Equilibria in Hydrocarbon Systems. Composition of the Dew-Point Gas of the Methane-Water System. Ind. Eng. Chem. 1942, 34, 1223–1227. [Google Scholar] [CrossRef]
  31. Petropoulou, E.G.; Voutsas, E.C. Thermodynamic Modeling and Simulation of Natural Gas Dehydration Using Triethylene Glycol with the UMR-PRU Model. Ind. Eng. Chem. Res. 2018, 57, 8584–8604. [Google Scholar] [CrossRef]
  32. Smith, R.M. Chemical Process: Design and Integration; John Wiley & Sons Ltd.: Chichester, UK, 2005; ISBN 0470011912. [Google Scholar]
  33. Zimmermann, H.; Walzl, R. Ethylene. Ullmann’s Encycl. Ind. Chem. 2012, 13, 62. [Google Scholar]
  34. Mamrosh, D.L.; McIntush, K.E.; Fisher, K. Caustic Scrubber Designs for H2S Removal from Refinery Gas Streams. In 2014 AFPM Annual Meeting; American Fuel & Petrochemical Manufacturers: Orlando, FL, USA, 2014; pp. 1–26. [Google Scholar]
  35. Boswell, M.C.; Dickson, J.V. The action of sodium hydroxide on carbon monoxide, sodium formate and sodium oxalate. J. Am. Chem. Soc. 1918, 40, 1779–1786. [Google Scholar] [CrossRef]
  36. Zhao, P.; Zhang, G.; Sun, Y.; Xu, Y. A review of oxygen removal from oxygen-bearing coal-mine methane. Environ. Sci. Pollut. Res. 2017, 24, 15240–15253. [Google Scholar] [CrossRef] [PubMed]
  37. Moon, D.K.; Kim, Y.H.; Ahn, H.; Lee, C.H. Pressure swing adsorption process for recovering H2 from the effluent gas of a melting incinerator. Ind. Eng. Chem. Res. 2014, 53, 15447–15455. [Google Scholar] [CrossRef]
  38. Li, X.; Li, J.; Yang, B. Design and control of the cryogenic distillation process for purification of synthetic natural gas from methanation of coke oven gas. Ind. Eng. Chem. Res. 2014, 53, 19583–19593. [Google Scholar] [CrossRef]
  39. Luyben, W.L. Optimum product recovery in chemical process design. Ind. Eng. Chem. Res. 2014, 53, 16044–16050. [Google Scholar] [CrossRef]
  40. Ren, T.; Patel, M.; Blok, K. Olefins from conventional and heavy feedstocks: Energy use in steam cracking and alternative processes. Energy 2006, 31, 425–451. [Google Scholar] [CrossRef] [Green Version]
  41. Salerno, D.; Arellano-Garcia, H.; Wozny, G. Ethylene separation by feed-splitting from light gases. Energy 2011, 36, 4518–4523. [Google Scholar] [CrossRef]
  42. Salgado, H.J.; Valbuena, G. Technical and economic evaluation of the separation of light olefins (ethylene and propylene) by using π-complexation with silver salts. CT F Cienc. Tecnol. Futuro 2011, 4, 73–88. [Google Scholar]
  43. Comparing Electricity Prices for Industry. An elusive task—illustrated by the German Case; Agora Energiewende: Berlin, Germany, 2014.
  44. Ilas, A.; Ralon, P.; Rodriguez, A.; Taylor, M. Renewable Power Generation Costs in 2017; International Renewable Energy Agency: Abu Dhabi, UAE, 2018. [Google Scholar]
  45. Industrial electricity prices. German Association of the Automotive Industry. Available online: www.vda.de/en/topics/economic-policy-and-infrastructure/energy/industrial-electricity-prices (accessed on 29 January 2019).
Figure 1. Global non-oxidative methane coupling reaction mechanism in a nanosecond pulsed discharge (NPD) reactor at (a) atmospheric pressure (two-step process; hydrogenation catalyst used) and (b) elevated (5 bar) pressure (one-step process; only gas phase). Product selectivity is shifted from C2H2 to C2H4 at higher pressure.
Processes 07 00068 g001
Figure 2. NPD reactor performance, by means of CH4 conversion and C2 selectivity, when CH4 with C2H6 and CO2 (to simulate shale gas composition) is used as feedstock: (a) NPD reactor performance when operating at 5 bar (one-step); and (b) hybrid (NPD) plasma-catalytic reactor performance at atmospheric pressure (two-step). The results correspond to the first operating cycle in which the reactor is clean, i.e., before the first decoking operation.
Processes 07 00068 g002
Figure 3. Temporal evolution of ethylene yield in the NPD reactor. Carbon formation and deposition on the electrodes results in decrease in ethylene yield, mainly due to CH4 conversion decrease.
Processes 07 00068 g003
Figure 4. Simplified block diagram of both plasma-assisted ethylene production processes. The basic process steps required to deliver polymer-grade ethylene and the basic chemical compounds handled in each step are presented.
Processes 07 00068 g004
Figure 5. Supplementary processes required in shale gas plasma-assisted conversion to ethylene: (a) Shale gas dehydration process step; and (b) refrigeration cycle to provide the required cold utility utilizing shale gas as a refrigerant.
Processes 07 00068 g005
Figure 6. Process flow diagram of the one-step plasma-assisted polymer-grade ethylene production process employing an NPD reactor (NPD-R) operating at elevated pressure (5 bar).
Processes 07 00068 g006
Figure 7. Economically favorable design and operating window for the de-methanizer of the one-step process with respect to C2H4 reclaim and purity maximization and hot and cold utilities minimization: (a) Selected reflux ratio; and (b) minimum stage number.
Processes 07 00068 g007
Figure 8. Economically favorable design and operating window for the de-ethanizer of the one-step process with respect to C2H4 reclaim and purity maximization and hot and cold utilities minimization: (a) Selected reflux ratio; (b) minimum stage number; and (c) selected operating pressure.
Processes 07 00068 g008
Figure 9. Economically favorable design and operating window for the purifier of the one-step process with respect to C2H4 reclaim and purity maximization and hot and cold utilities minimization: (a) Selected reflux ratio; (b) EOS impact (PR=Peng-Robinson, PR-BM=Peng-Robinson with Boston-Mathias modifications, SRK=Soave-Redlich-Kwong, SRK-BM=Soave-Redlich-Kwong with Boston-Mathias modifications) on simulation results (c) selected stage number; and (d) selected operating pressure.
Processes 07 00068 g009
Figure 10. One-step process heat integration: (a) Grand composite curve; considerable energy pockets are available for energy recovery; and (b) proposed heat exchanger network composed by twelve heat exchangers (seven process-to-process streams heat exchangers, three coolers, and two heaters).
Processes 07 00068 g010
Figure 11. Process flow diagram of the two-step plasma-assisted polymer-grade ethylene production process employing a hybrid (NPD) plasma-catalytic reactor (Hybrid NPD-R) operating at atmospheric pressure.
Processes 07 00068 g011
Figure 12. Economically favorable design and operating window for the de-methanizer of the two-step process with respect to C2H4 reclaim and purity maximization and hot and cold utilities minimization: (a) Selected reflux ratio; and (b) minimum stage number.
Processes 07 00068 g012
Figure 13. Economically favorable design and operating window for the de-ethanizer of the two-step process with respect to C2H4 reclaim and purity maximization and hot and cold utilities minimization: (a) Selected reflux ratio; (b) minimum stage number; and (c) selected operating pressure.
Processes 07 00068 g013
Figure 14. Economically favorable design and operating window for the purifier of the two-step process with respect to C2H4 reclaim and purity maximization and hot and cold utilities minimization: (a) Selected reflux ratio; (b) EOS impact (PR=Peng-Robinson, PR-BM=Peng-Robinson with Boston-Mathias modifications, SRK=Soave-Redlich-Kwong, SRK-BM=Soave-Redlich-Kwong with Boston-Mathias modifications) on simulation results (c) selected stage number; and (d) selected operating pressure.
Processes 07 00068 g014
Figure 15. Two-step process heat integration: (a) Grand composite curve; considerable energy pockets are available for energy recovery; and (b) proposed heat exchanger network composed of thirteen heat exchangers (eight process-to-process streams heat exchangers and five coolers; no external heating is required).
Processes 07 00068 g015
Figure 16. Energy and economic analysis of the plasma-assisted process alternatives: (a) Electric power demand (in kW) and percentile distribution over the unit operations involved in the process; and (b) sensitivity analysis of ethylene production cost and profit margin with respect to CO2-neutral electricity price.
Processes 07 00068 g016
Table 1. Reactions and fractional conversion considered in the simulation.
ReactionFractional Conversion (%)
One-StepTwo-Step
2CH4 → C2H4 + 2H212.817.5
2CH4 → C2H2 + 3H20.30.3
2CH4 → C2H6 + H21.81.2
CH4 → C(s) + 2H210.32.8
C2H4 → 2C(s) + 2H2 ¥100.0100.0
C2H6 → C2H4 + H250.045.0
CO2 → CO + ⅟2O220.020.0
¥ Reaction only for C2H4 contained in the recycle steam.
Table 2. Hot and cold utility demand of the one-step process before and after applying heat integration.
Utility (kW)Before Heat IntegrationAfter Heat IntegrationUtility Saving
Hot utility demand40099−75%
Cold utility demand−596−295−51%
Table 3. Hot and cold utility demand of the two-step process before and after applying heat integration.
Utility (kW)Before Heat IntegrationAfter Heat IntegrationUtility Saving
Hot utility demand4480−100%
Cold utility demand−797−348−56%

