Article

Investigating the In-Flow Characteristics of Multi-Operation Conditions of Cross-Flow Fan in Air Conditioning Systems

1
National Research Center of Pumps, Jiangsu University, Zhenjiang 212013, China
2
School of Energy and Power Engineering, Jiangsu University, Zhenjiang 212013, China
*
Author to whom correspondence should be addressed.
Processes 2019, 7(12), 959; https://doi.org/10.3390/pr7120959
Submission received: 10 November 2019 / Revised: 2 December 2019 / Accepted: 9 December 2019 / Published: 15 December 2019
(This article belongs to the Section Advanced Digital and Other Processes)

Abstract

:
Cross-flow fans are widely used in numerous applications such as low-pressure ventilation, household appliances, laser instruments, and air-conditioning equipment. Cross-flow fans have superior characteristics, including simple structure, small size, stable airflow, high dynamic pressure coefficient, and low noise. In the present study, numerical simulation and experimental research were carried out to study the unique secondary flow and eccentric vortex flow characteristics of the internal flow field in multi-operating conditions. To this end the vorticity and the circumferential pressure distribution in the air duct are obtained based on the performed experiments and the correlation between spectral characteristics of multiple operating conditions and the inflow state is established. The obtained results show that when the area of the airflow passage decreases while the area of the eccentric vortex area gradually increases, then the airflow of the cross-flow fan decreases, the outlet expands, and the flow pattern uniformity reduces. It was found that wakes form in the vicinity of the blade and the tail of the volute tongue, which generate pressure pulsation, and aerodynamic noise. The pressure distribution along the inner circumference shows that the total minimum pressure appears in the eccentric vortex near the volute tongue and the volute returns near the zone. Moreover, it was found that the total pressure near the eccentric vortex is significantly smaller than that of the main flow zone. As the flow rate decreases, the pressure pulsation amplitude of the eccentric vortex region significantly increases, while the static and total pressure pulsation amplitudes are gradually increased. Close to the eccentric vortex on the inner side of the blade in the volute tongue area, total pressure is low, total pressure on the outside of the blade is not affected, and pressure difference between the inner and outer sides is large. When the flow rate of the cross-flow fan is 0.4 Qd, there is no obvious peak at the harmonic frequency of the blade passage frequency. This shows that the aerodynamic noise is caused by the main unstable flow.

1. Introduction

Cross-flow fans are widely used in applications with low-pressure ventilation, including household appliances, laser instruments, and air-conditioning equipment, due to their simple structure, small size, stable airflow, high dynamic pressure coefficient, and low noise level. As shown in Figure 1 the air-conditioning equipment, due to the action of the cross-flow fan, the gas enters from the air inlet, flows through the heat exchanger, and finally exits from the outlet. In other words, an air cycle is formed, which changes the airflow temperature so that the indoor temperature can be adjusted.
For cross-flow fans in air-conditioning applications, secondary and eccentric eddy flow characteristics of the internal flow field originate from multi-operating conditions and system variations. This is more pronounced in low-flow conditions. It should be indicated that these fans differ from other industrial fans regarding flow phenomena and design methods.
With the continuous innovation of the industry technology and the improvement of life quality, higher requirements have been established for noise level. The broadband component in the noise spectrum is mainly caused by pulsating dynamics of random characteristics, such as the turbulence of the inlet flow. Studies show that the lifting pulsation of the blade surface is one of the main sources of the eddy current noise. Moreover, the aerodynamic noise source in the low velocity flow field is mainly the dipole caused by the surface pressure of the blade, including the cross-flow fan of the air-conditioning system. Therefore, an in-depth understanding of the pressure pulsation on the blade surface is of significant importance to predict and control the aerodynamic noise of the cross-flow fan [1,2]. Many studies have been focused on improving the pressure gradient distribution in the duct system and inflow characteristics of the cross-flow fan, reducing the influence of the eccentric vortex on the downstream flow and reducing the aerodynamic noise. However, due to the special geometry of the cross-flow fan, it a great challenge to measure the internal flow parameters through conventional experimental methods such as the pressure sensor and hot wire. Therefore, the simulation method has become a feasible method to study the internal flow field of the cross-flow fan.
Eck applied experimental and analytical methods to study the flow field characteristics of the cross-flow fan. He introduced the method of displaying the air flow in the cross-flow fan. In the proposed method, the flow field of the cross-flow fan was visualized, and an eccentric vortex was capable of controlling the air flow [3]. Porter et al. used a transparent water tank to observe the internal flow field of the cross-flow fan. They found that keeping the eccentric vortex inside the impeller close to the outside of the impeller can improve the performance of the fan, which can be achieved by improving the volute tongue and volute. Moreover, they found that as the flow rate changes, the total pressure coefficient remains stable. However, they found that as the static pressure coefficient changes, the resistance changes [4]. Fukutomi et al. studied the effects of the volute throat width and volute area on the performance of the cross-flow fan and the corresponding internal airflow. They observed the variation of the internal eccentric vortex core position for different flow rates and volute shapes. They showed that the ratio of the volute throat width to the arc length of the impeller is an important parameter that affects the performance of the cross-flow fan [5]. Hiromu and Tsurusaki [6] and Yoshinobu and Tsujimoto [7] used particle image velocimetry (PIV) measurements to investigate the flow field of the cross-flow fan and analyzed the influence of the flow coefficient of the cross-flow fan on the internal velocity field and the eccentric vortex. Yang and Zhong [8] utilized experimental methods to analyze different structural dimensions, including the impeller diameter and internal flow field variations of the cross-flow fan. Moreover, they theoretically analyzed eccentric vortex of cross-flow fans through several sets of experimental data. Furthermore, Tazuke et al. [9] applied experimental methods to study the internal eccentric vortex of the cross-flow fan and analyzed the formation and diffusion of these eccentric vortices. You et al. [10,11] employed flow visualization methods and showed that when there is no volute configuration, the eccentric vortex inside the cross-flow fan cannot be fixed at a certain position so that it cannot produce the cross-flow from the impeller inlet to the outlet. Akaike [12] used LDV and CFD methods to numerically investigate the unsteady flow of the internal eccentric vortex of the cross-flow fan of a car air conditioner with and without heat load. Then, he discussed the principle of the air supply in the cross-flow fan. Liu [13] analyzed and summarized the internal flow field of the cross-flow fan at different speeds. This study showed that the eccentric vortex has slight changes along the inner diameter of the impeller at different speeds. He found that when the flow rate increases, the eccentric vortex moves toward the volute tongue, but the change in the position of the vortex center is not significant. The steady and unsteady internal flow characteristics of cross-flow fans were studied, combining the characteristics of cross-flow fan noise sources and propagation characteristics, and a model for predicting the aerodynamic noise of cross-flow fans was proposed. Zhao [14] used the large eddy simulation method to study three-dimensional unsteady values at seven different rotational speeds and analyzed the sound pressure spectrum of a cross-flow fan. Moreover, he investigated the influence of different impeller speeds on the inflow and noise of the cross-flow fan. He observed that the sound pressure of noise in high impeller speed is larger than that with low impeller speed. There is a large difference between the noise measurement experiment and the simulated sound pressure value. The reason may be that the reflection and scattering effects of the noise between the fan casing and the blade were ignored. Liu [15] indicated that as the speed of the cross-flow fan increases, the static pressure of the whole flow channel changes remarkably. However, the position of the eccentric vortex core does not change with the rotational speed. The air volume of the indoor unit changes approximately linearly with the speed of the cross-flow fan. The air volume is determined by the fan speed or the peripheral speed of the impeller and has nothing to do with the eccentric vortex and other factors.
In summary, reviewing the literature indicates that there are few studies on the internal flow field and pressure fluctuation characteristics of cross flow fans under multiple operating conditions so far. Therefore, we intended to conduct numerical and experimental analyses to investigate the noise level of the cross-flow fan in the air-conditioning system. It should be indicated that the flow mechanism, internal flow characteristics, pressure pulsation mechanism, and vortex flow phenomenon will be studied in these regards. It is expected that the present study can provide a theoretical basis for improving the aerodynamic and aero-acoustic performance of the cross-flow fan.

2. Numerical Methods

2.1. Calculation Model

In the present study, the cross-flow fan of indoor air conditioning is considered as the research object. The performance and internal flow characteristics of the fan under different flow rates were analyzed. Since the internal flow of the cross-flow fan is a three-dimensional unsteady viscous flow, the Coriolis and centrifugal forces generated by the rotation of the impeller, and the curvature effect of the blade surface make the flow inside the impeller complex. In order to simulate the flow pattern and improve the simulation efficiency, the internal flow field of the cross-flow fan is divided into three areas, including the inlet flow field, internal flow field, and the exhaust flow field [13]. The inlet flow field mainly studies the inlet flow condition. Moreover, the flow field inside the impeller is generally used to analyze the mechanism of unstable vortices, and the corresponding influence on the flow pattern. The exhaust flow field is mainly used to study the characteristics of low-speed jets. In the present study, the existing model was applied to investigate the flow to indicate the corresponding structure. The axial length of the cross-flow fan was selected as the simulation research object, the structure of the indoor unit was simplified, and the guide vanes were removed. In other words, Figure 2 shows that the three-dimensional (3D) calculation model included an inlet section, an evaporator, a duct system, an impeller, and an outlet section. The impeller design rotates at n = 800 rpm and the design flow rate is Qd = 822 m3/h. Moreover, flow rates of the cross-flow fan are set to Q = 1.33 Qd, Q = 1.15 Qd, Q = 0.85 Qd, and Q = 0.4 Qd for simulation analysis and experimental verification. Table 1 and Table 2 show impeller specifications and operating parameters.

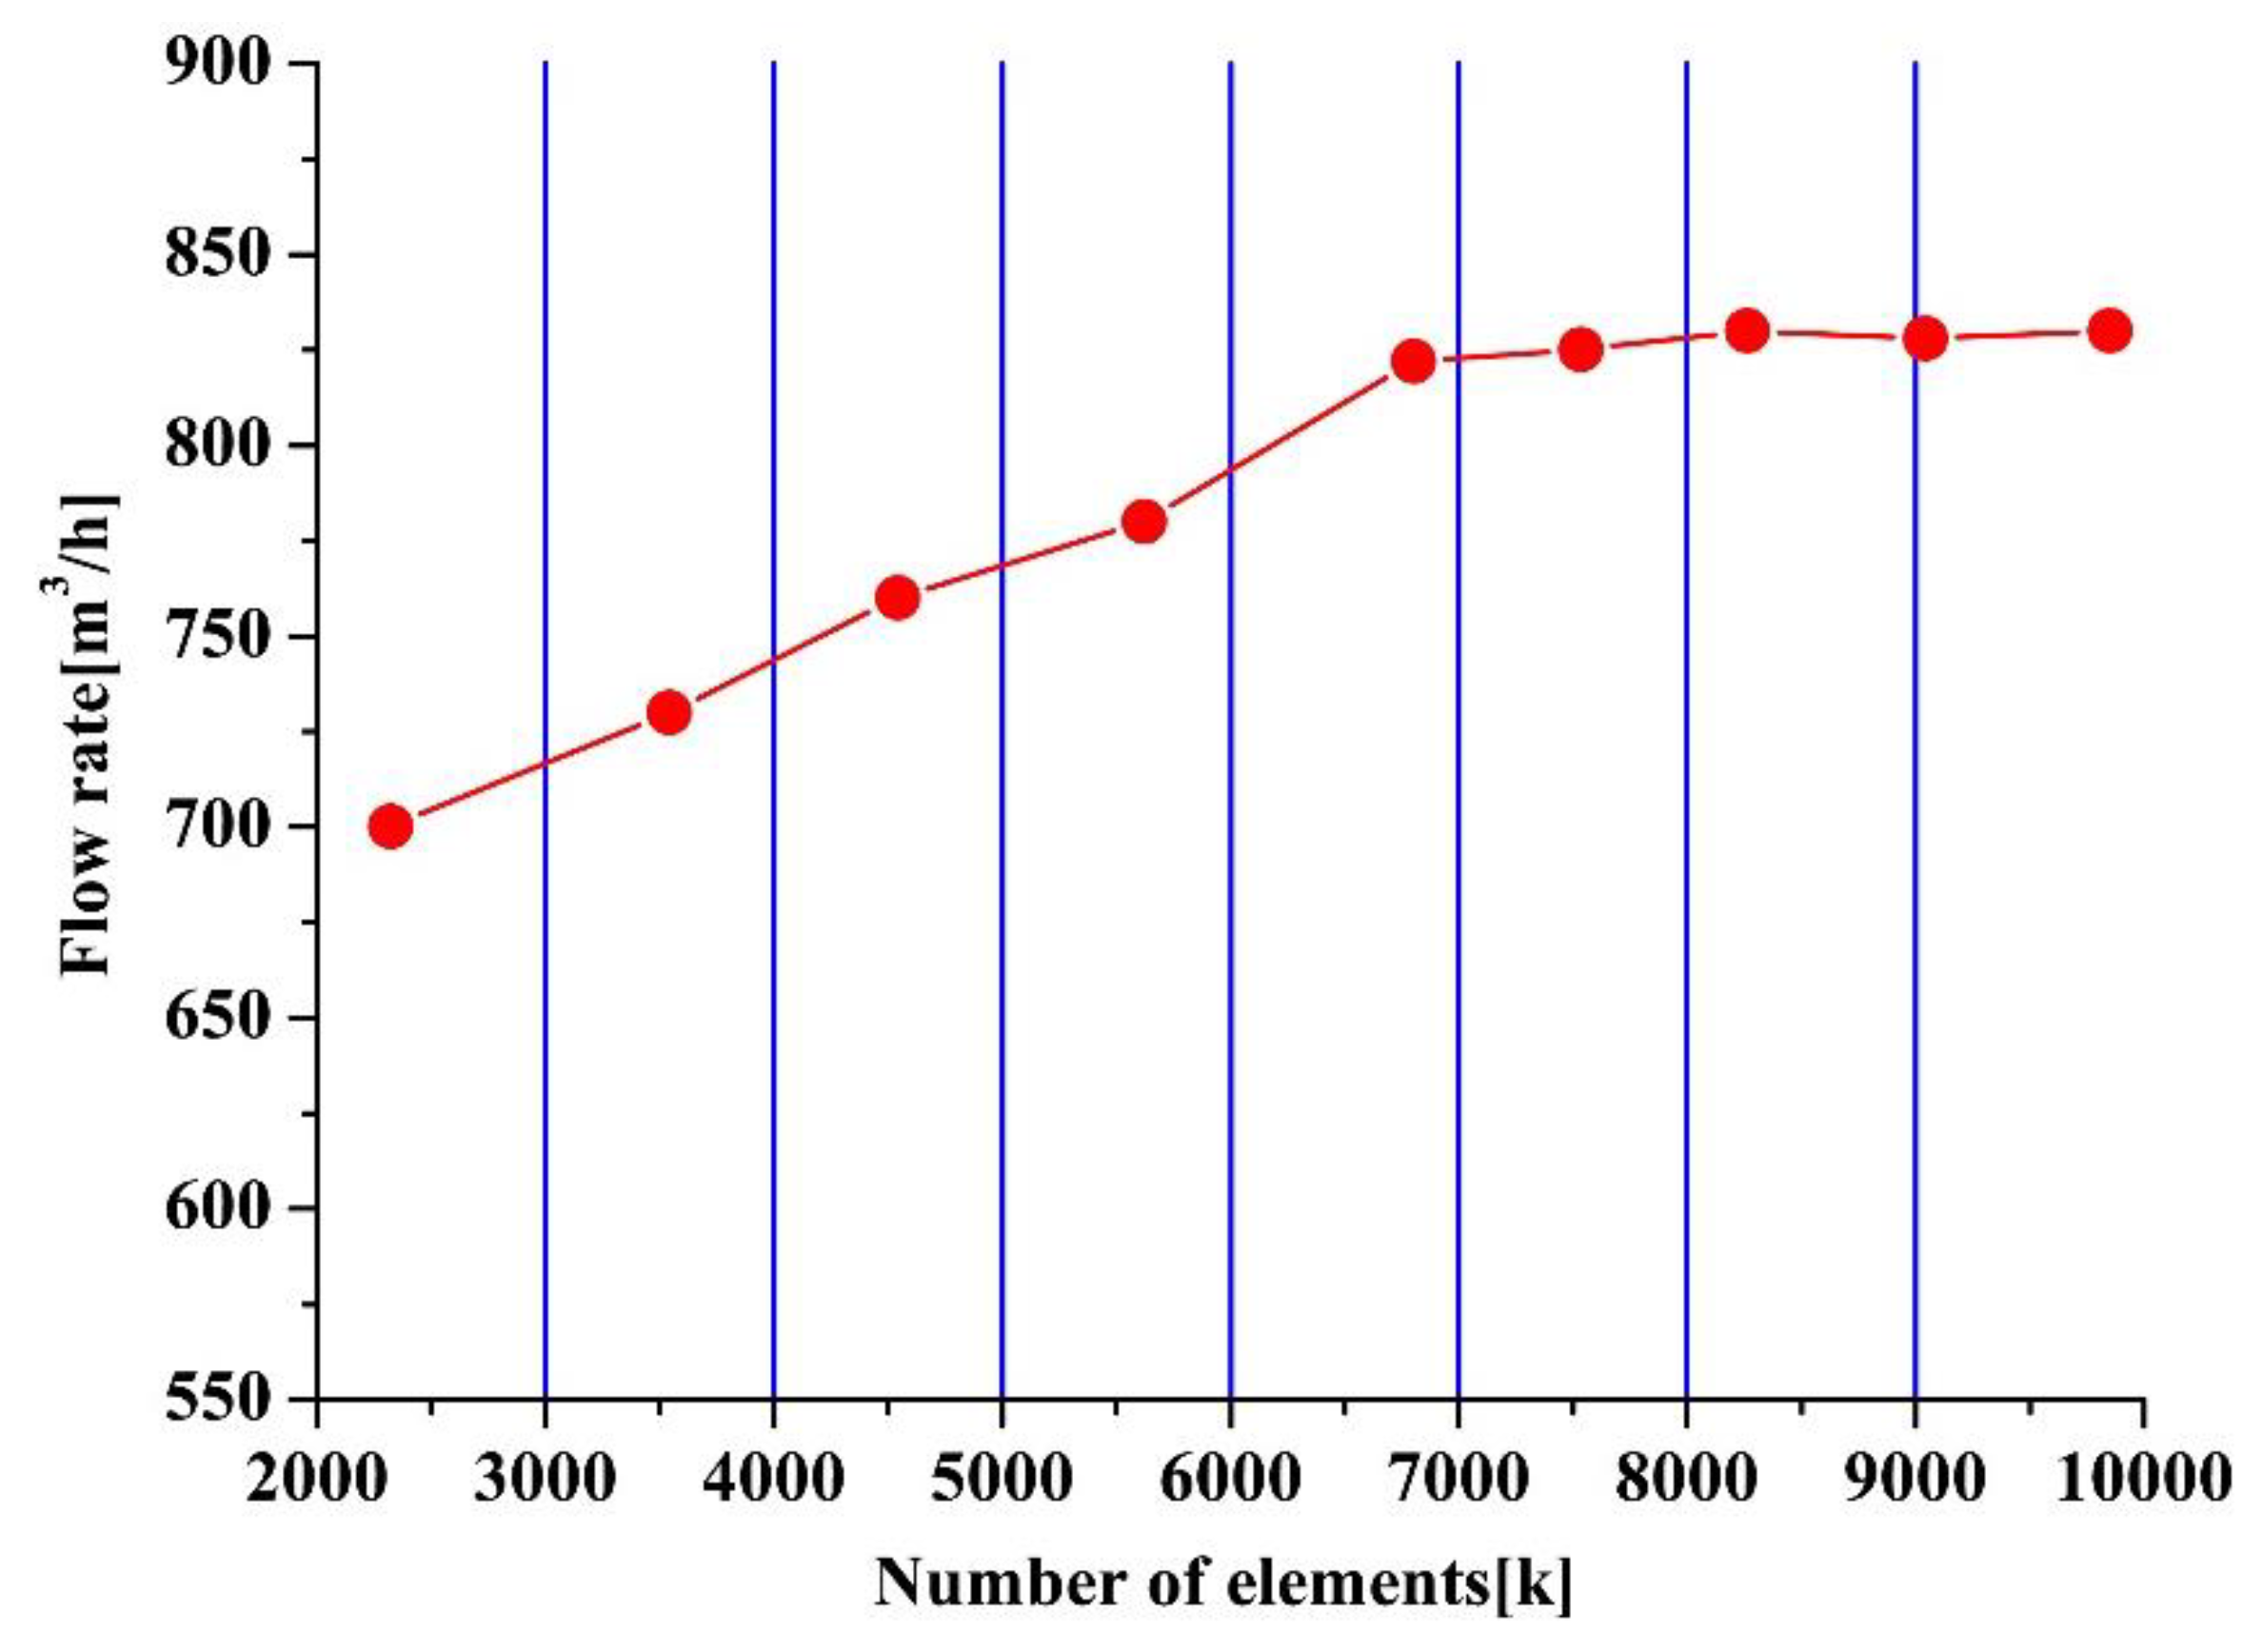
2.2. Grid Independence

The grid is not only a geometric representation, but also a carrier for numerical calculations [16]. The term grid-independent means that the monitored physical quantity does not change as the number of meshes changes. The number of currently selected meshes satisfies the solution requirements. After modeling in Cero 2.0 environment, the computational domain is imported into the ICEM CFD 14.5 for meshing. The study of the grid independency is achieved by solving nine models of different grid numbers, ranging from 2.32 million to 9.85 million. Figure 3 shows that the volumetric flow changes for nine different grid numbers. It was observed that the airflow increases as the number of grids increases. However, it was found that when the number of grids exceeds 6.82 million, the flow rate almost remains constant. Considering the simulation accuracy and computing resources, the total number of grids in the present study is set to 6.82 million.

2.3. Turbulence Model

The FLUENT module in ANSYS software is applied to simulate the three-dimensional steady state and unsteady internal flow fields. It should be indicated that the numerical analysis uses the Reynolds average Navier–Stokes (RANS) equation as the governing equation. Xing et al. [17] used two K-ε turbulence models to compare the flow field simulation of the cross-flow fan and compared the unsteady flow near the eccentric vortex. They compared the results of the RNG K-ε two-equation model with that of the standard K-ε model. They showed that the RNG K-ε model converges faster and the predicted internal vortex intensity of the impeller is larger than that of the standard K-ε model. However, they did not find meaningful difference in the volume occupied by vortices in two models. In the present study, the RNG K-ε two-equation model was applied for the turbulence model. Moreover, the flow near the wall was modified by the standard wall function. Considering the complexity of the flow path shape, the mesh was divided by the finite volume method and unstructured tetrahedral meshes were used in these regards. Steady state and unsteady calculations were performed in the same computational domain and steady state results were used as initial conditions for transient numerical simulations. It should be indicated that the impeller speed and the time step were set to 800 rpm and 7.17 × 10⁻⁴, respectively.

2.4. Boundary Conditions

The boundary condition is the relationship between the computational domain and the surrounding environment, or the variation of solution variables in the space and time. Boundaries of the simulated problem can be divided into rotating and stationary regions. The cross-flow blades and their internal fluid domain constitute rotating regions, which the rotating coordinate system is adopted from, while the remaining parts constitute the stationary region. Moreover, interface boundary conditions were used for connection between rotating and stationary regions. The given inlet boundary is the velocity inlet and the corresponding static pressure at the outlet is 0 Pa. When the residuals are less than 10−5, and the fan inlet and outlet flow errors are less than 10−5, the calculation of the current operating conditions is converged.

2.5. Monitoring Points
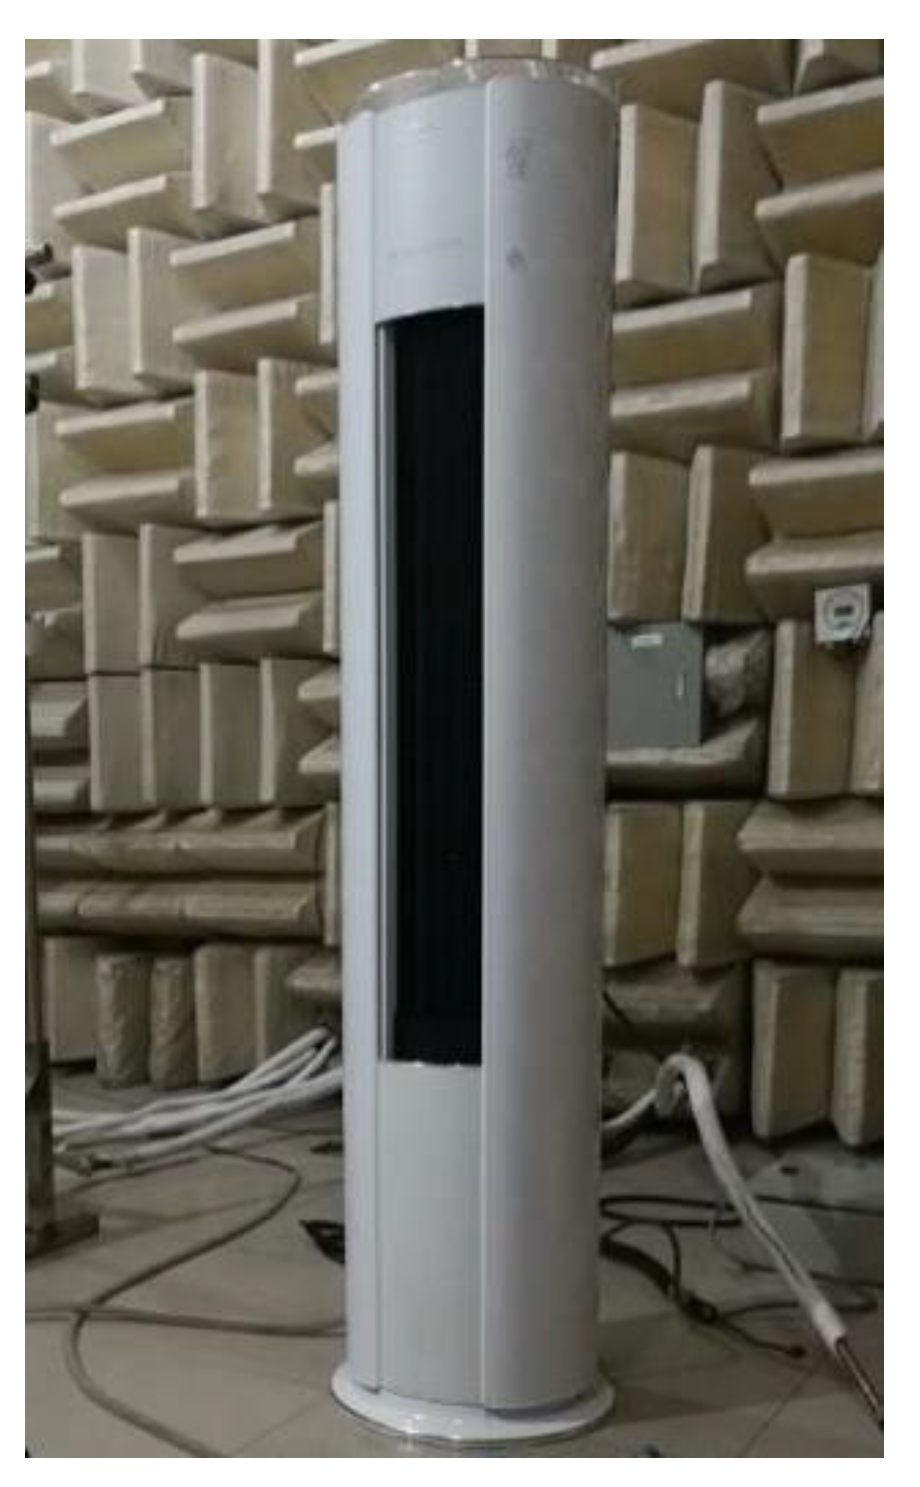
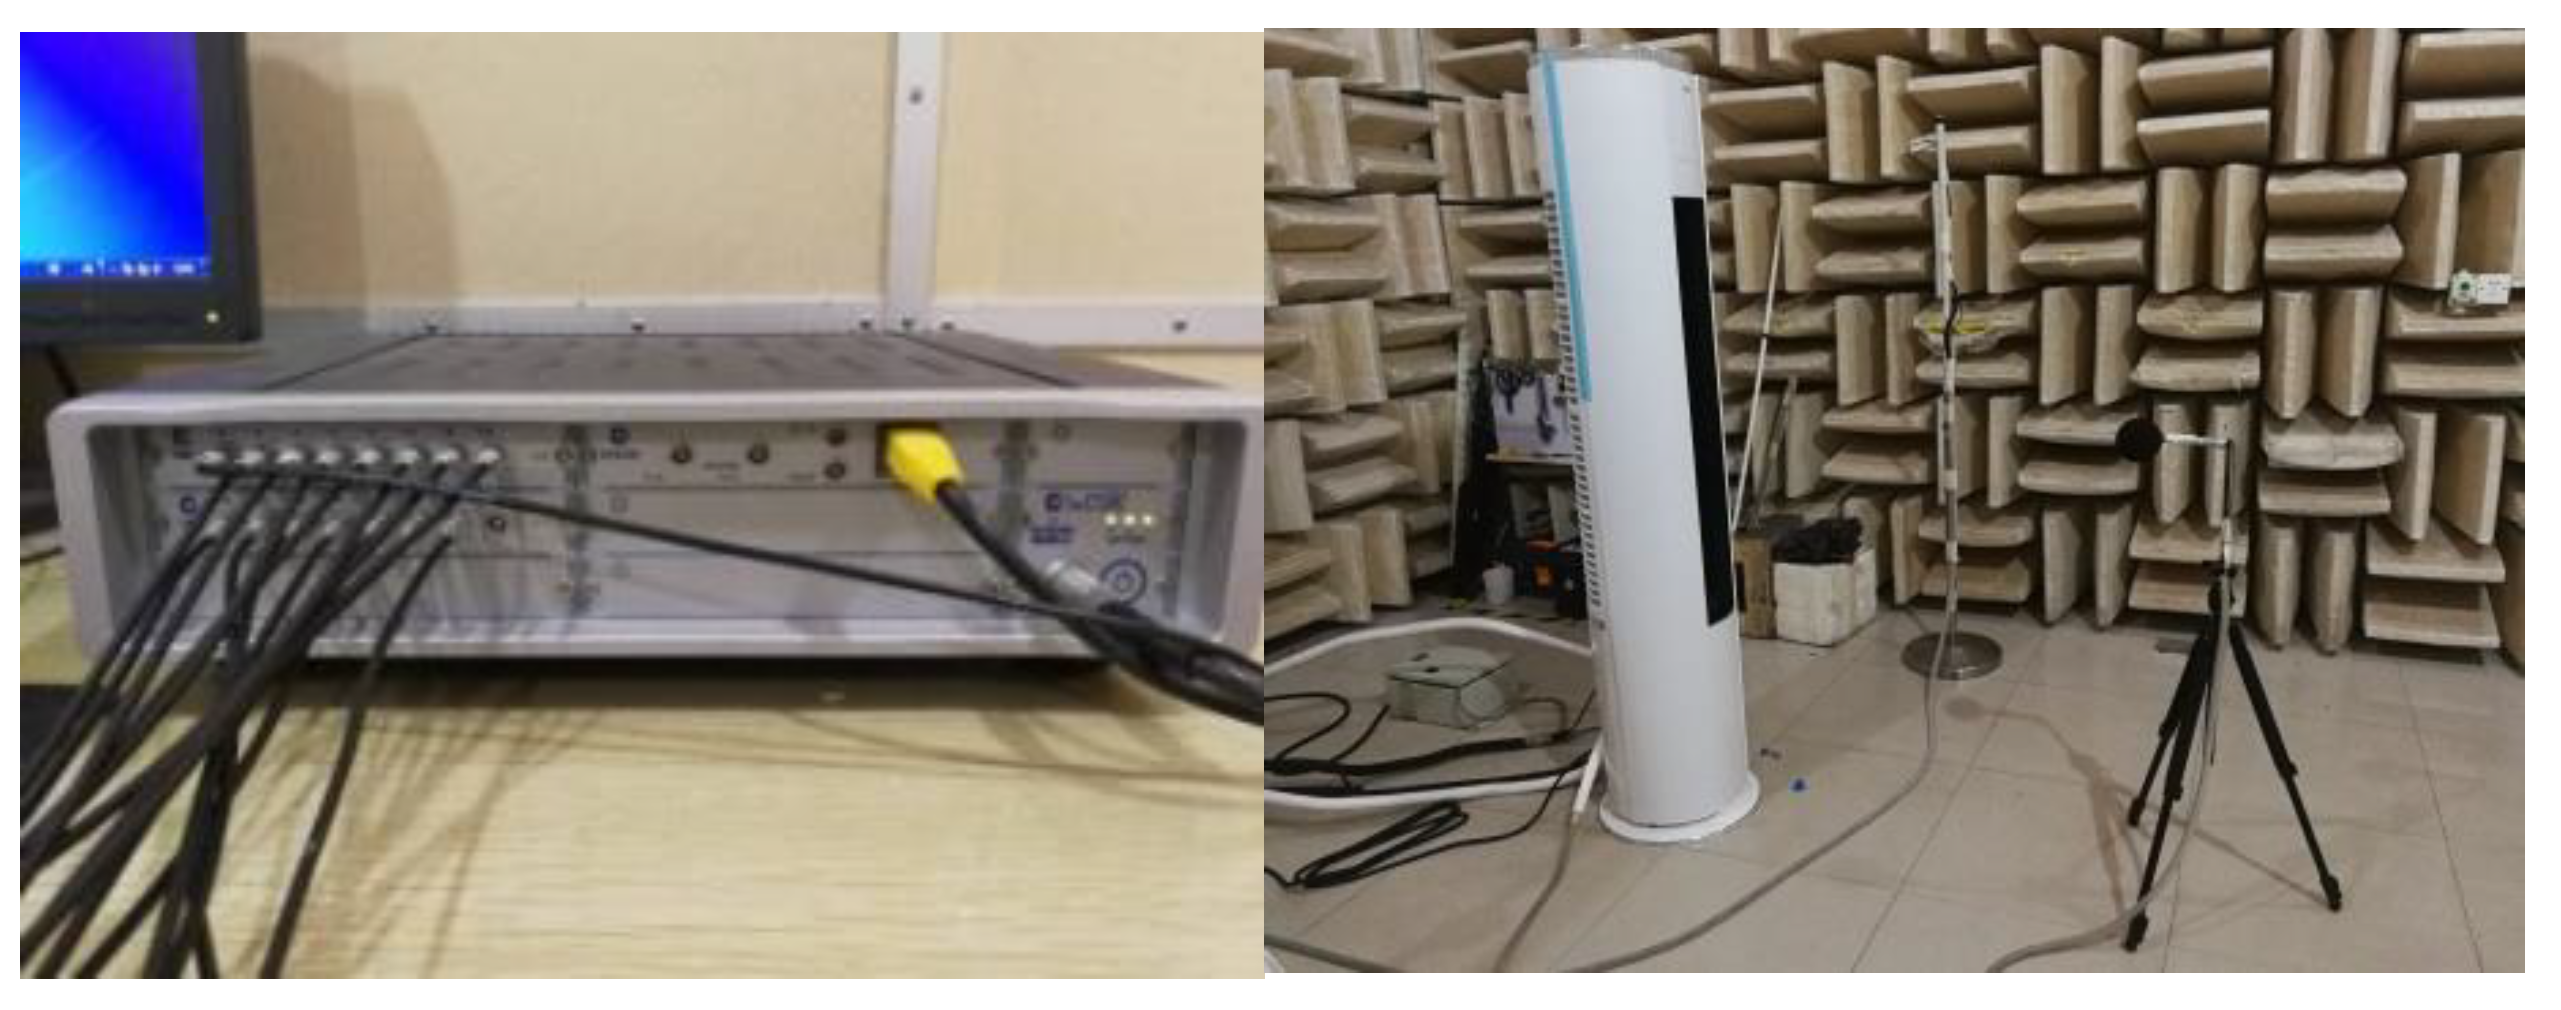
In order to analyze periodic pulsation characteristics of cross-flow blades, the axial cross-section with 24 and 12 monitoring points was considered in the inner and outer cross-flow blades. Figure 4 indicates that monitoring points are evenly distributed in the circumferential direction of the blade, where the cross-section diameter is D = 66 and D = 118 mm.

3. Experiment

3.1. Noise Test Rig

The noise test rig was built in accordance with the international standards GB6884-1986 “acoustic noise source sound power level determination anechoic chamber and semi-anechoic chamber precision method”. The sound-absorbing chamber and the floor are tested with a glass wool-tipped sound-absorbing material and a vibration-reducing floating structure, respectively. The background noise was 18 dB (A).
As shown in Figure 5, the noise signal was obtained through LMS acoustic measurement and appropriate analysis system. The system includes hardware and software parts. Hardware components include data acquisition front-end, the sound pressure sensor, sensor pre-amplifier, and the calibrator. These parts simultaneously acquire various dynamic signals such as vibration, noise, and pressure pulsation. The LMS software system uses a computer to display the collected dynamic signal data in real time. Moreover, the software uses the LMS test and lab spectral acquisition noise analysis module. The sound pressure spectrum is measured using 1/3 octave frequency and then converted to A level. Acoustic sensor is G.R.A.S Type 46AE Type 26CA. Furthermore, the sampling time and frequency were set to 600 s and 4096 Hz, respectively.

3.2. Test Rig of the Air Volume

The flow rate was obtained in accordance with the GB/T1236-2000 standard, entitled by “industrial fan with a standardized duct performance test”. Using a multi-nozzle flow test system, the principle of the performance test is that the fluid flows through the throttling device in the pipe, where the flow forms a local contraction at the throttling, thereby increasing the flow velocity and reducing the static pressure. Therefore, a differential pressure is generated before and after the throttling. The flow rate is estimated by measuring the differential pressure before and after the throttling as it flows through the throttling device. It should be indicated that the test system consists of a differential pressure gauge, hydrostatic meter, nozzle, a spherical probe, pneumatic plug, rectifier, temperature, and humidity sensor.

4. Results and Discussion

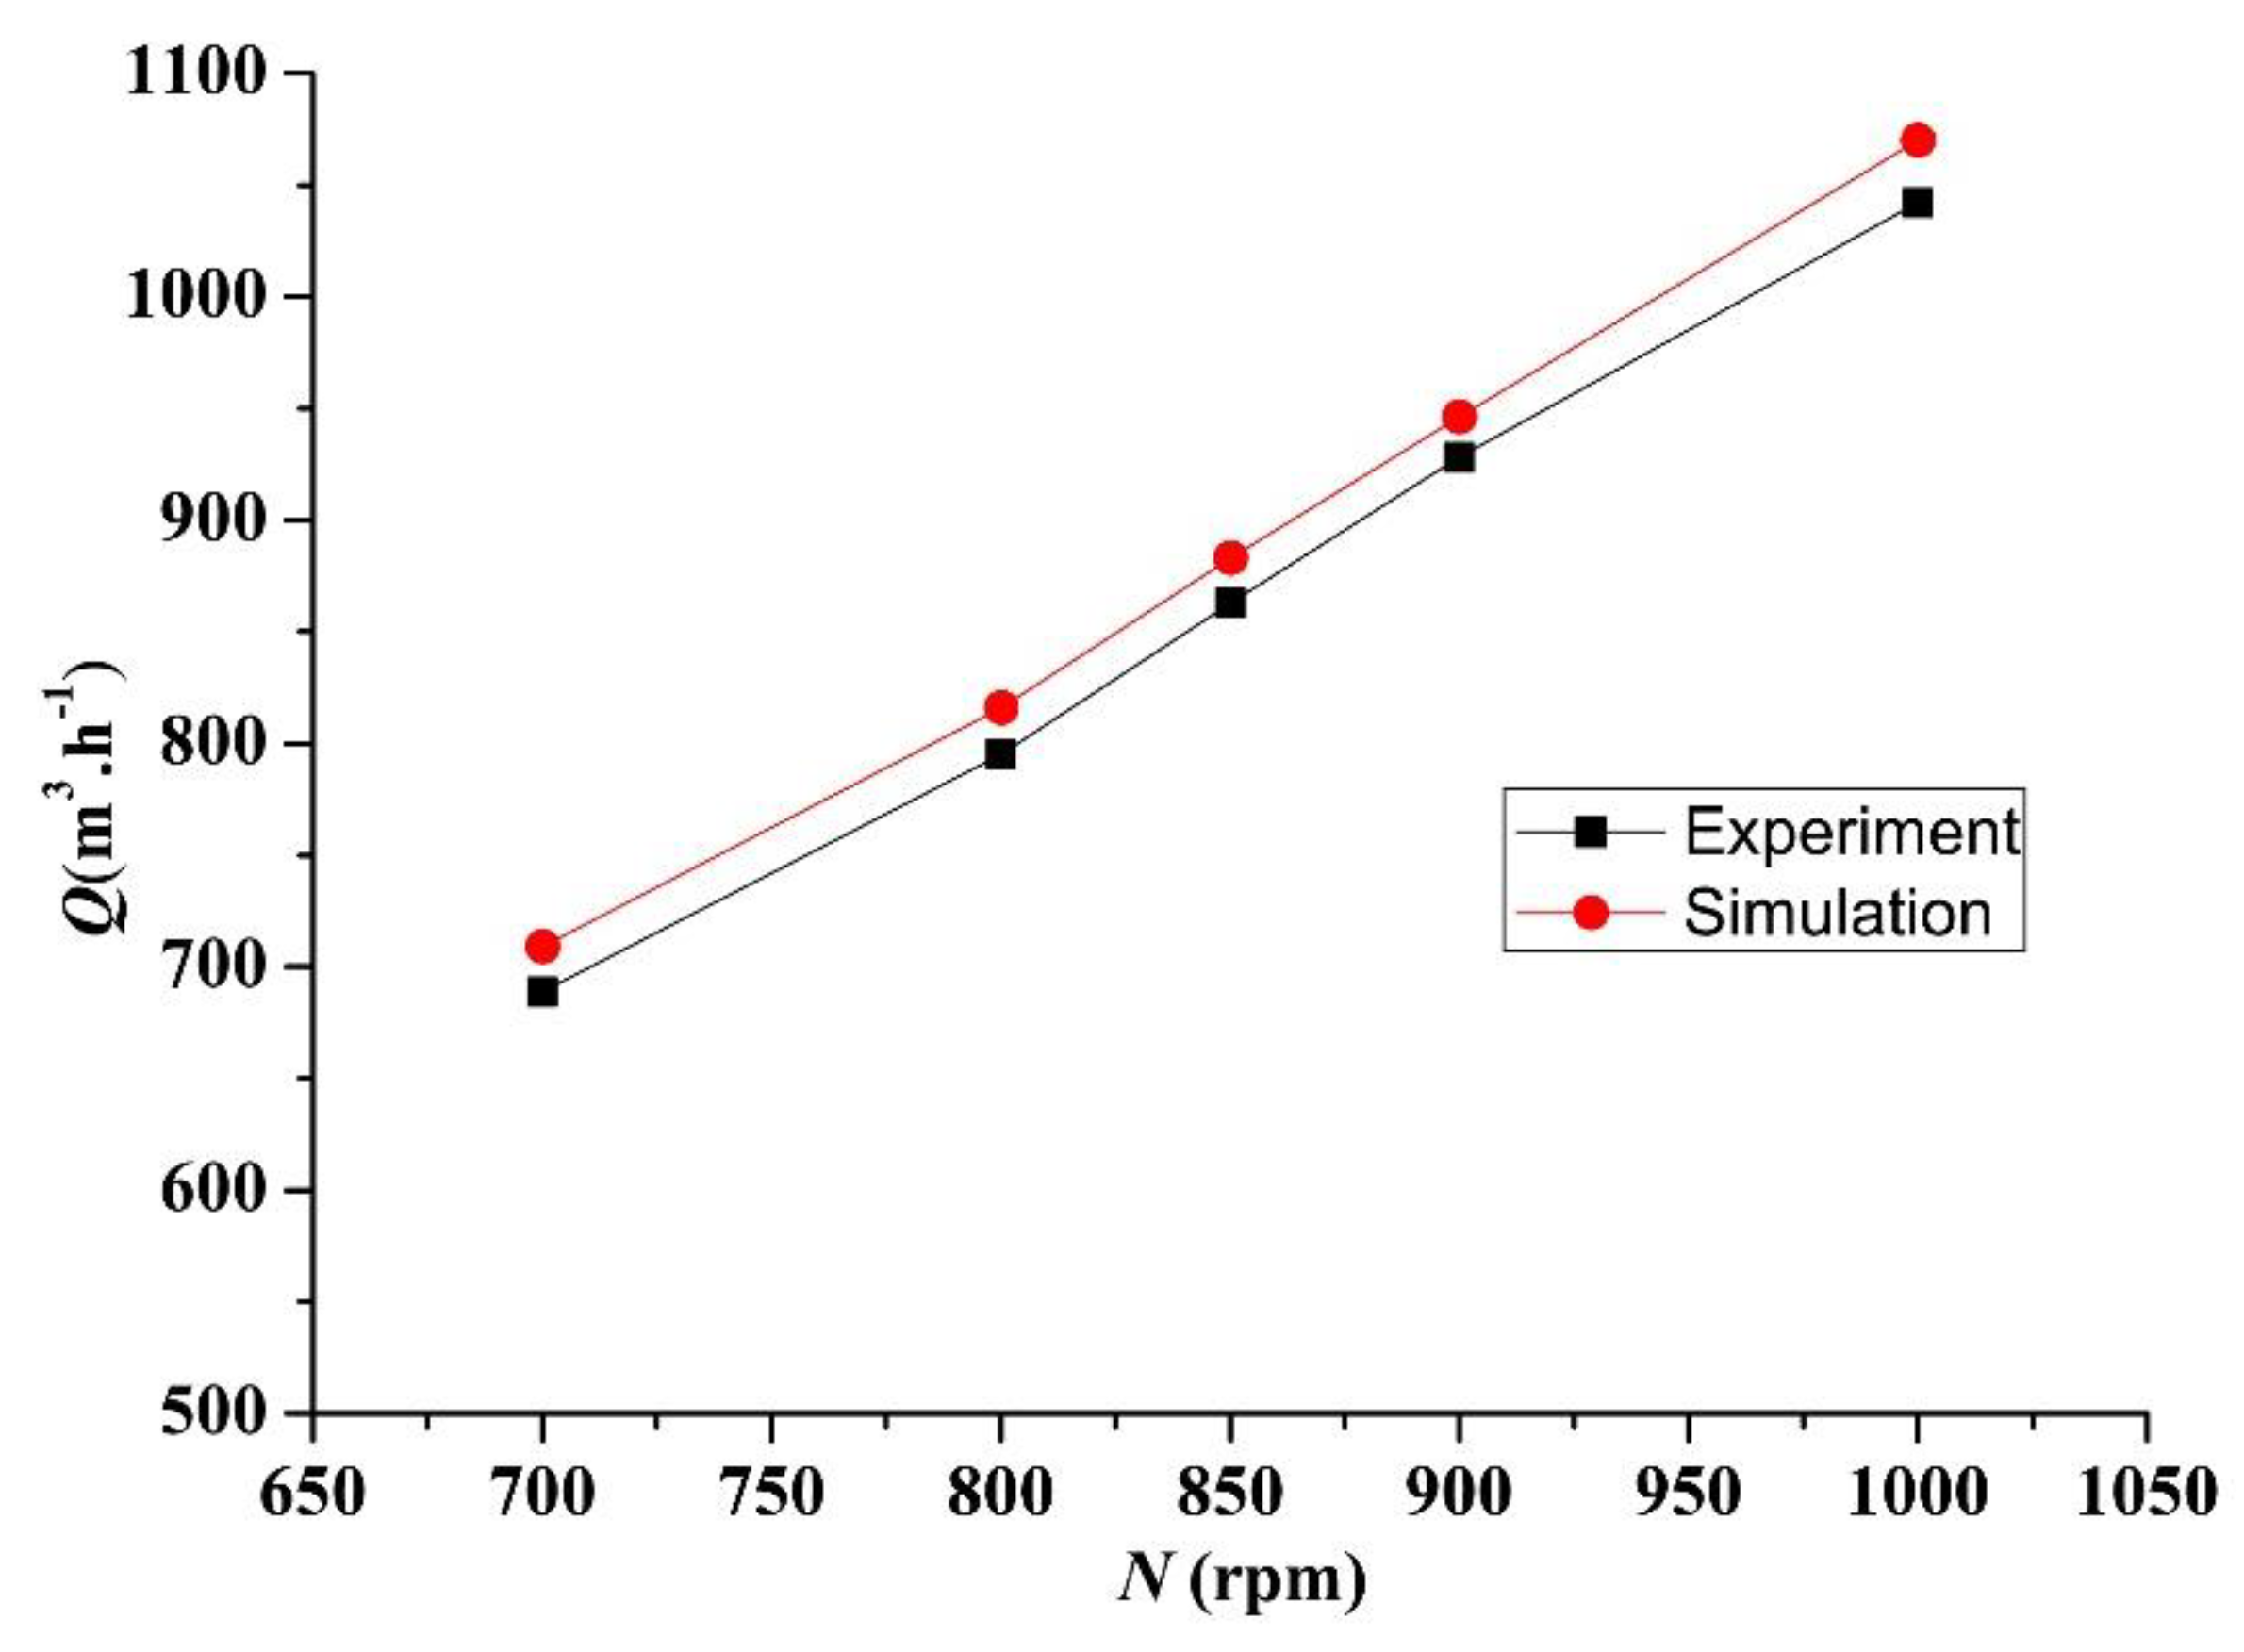
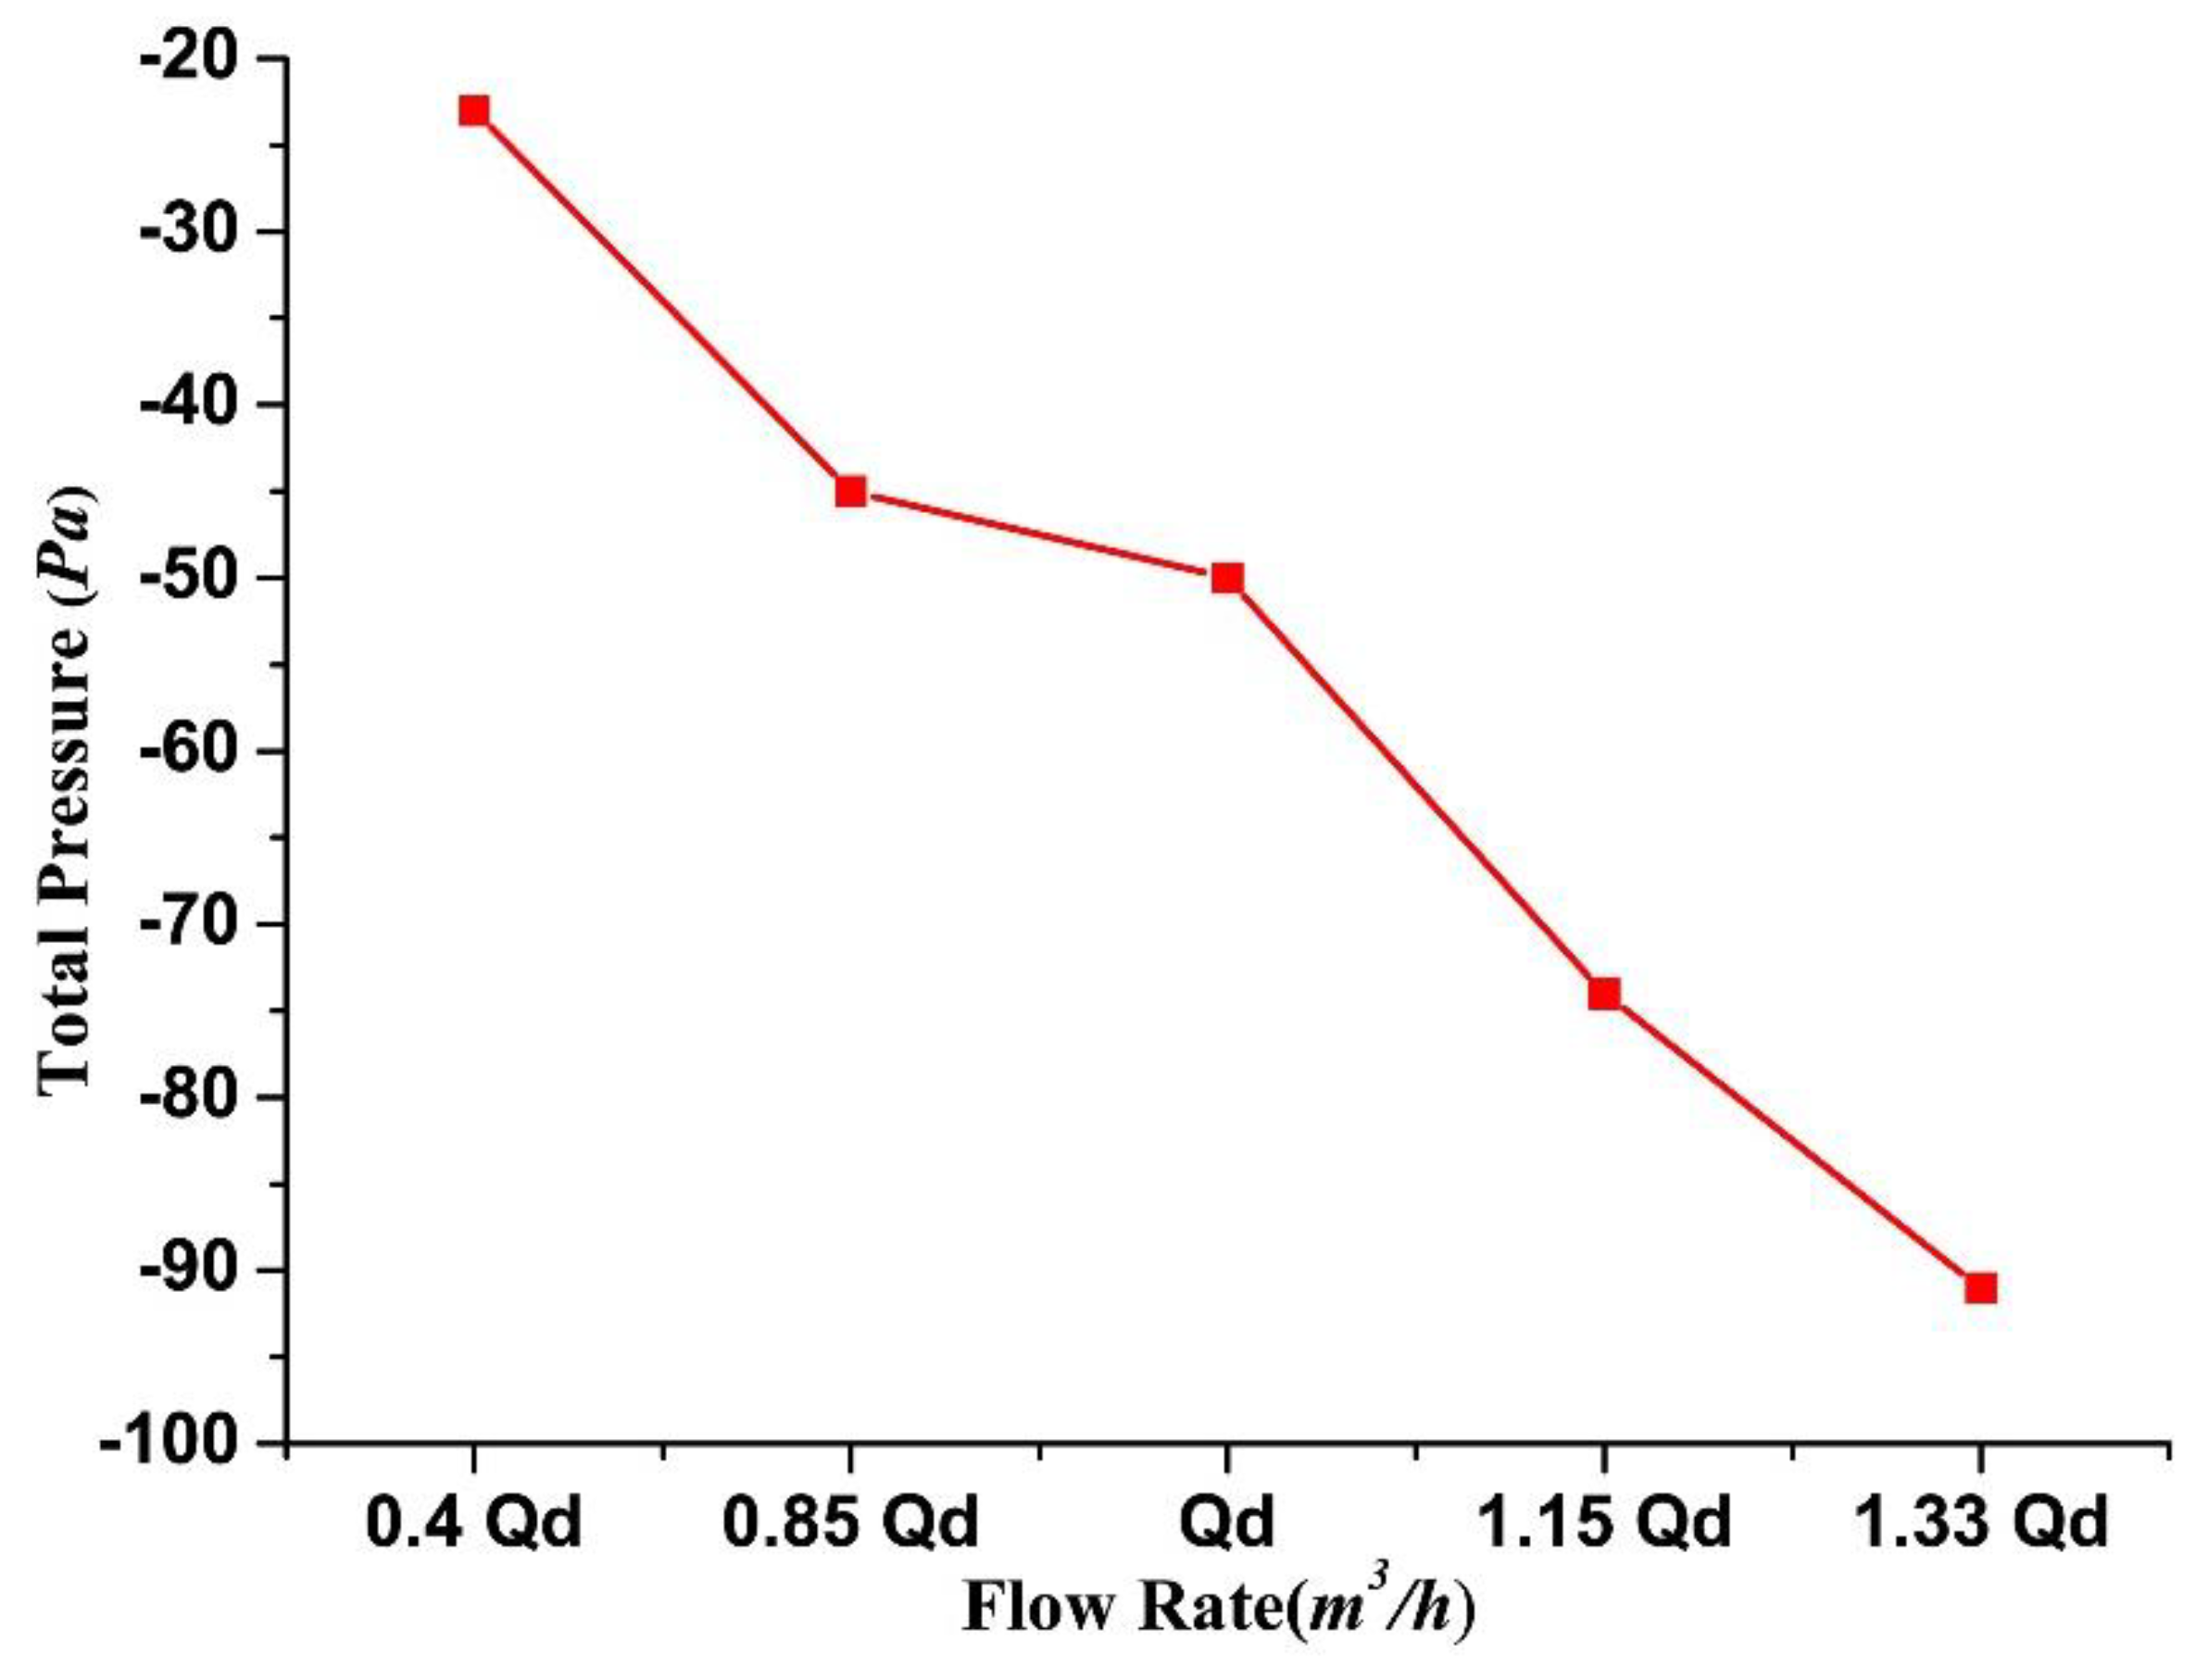
4.1. Comparison of External Characteristics between Simulation and Experiment

In order to verify the accuracy of the numerical simulation of the aerodynamic performance prediction of the cross-flow fan, the aerodynamic performance obtained by the numerical simulation was compared with the experimental performance. It should be indicated that the rotating speed of the motor-driven impeller was set to 800 rpm. Figure 6 shows that the motor speed is adjusted to obtain the flow rate of multiple operating points. It was found that the predicted flow rate by the numerical simulation is consistent with the trend of experimental results. The flow error of the experiment and simulation was less than 5%, which is within the acceptable range. The obtained results show that the numerical simulation is more accurate in predicting the performance of the cross-flow fan.
Figure 7 shows as the speed of the cross-flow fan increases continuously, the flow rate gradually increases. When the speed is n = 800 r/min, the flow rate is only 795 m3/h, while the flow rate for the rotating speed of 1000 r/min is 1042 m3/h. Therefore, it was concluded that the change in the flow rate was significant. In addition, the change in the flow rate had an almost linear correlation with the speed of the cross-flow fan. Moreover, when the structure of the evaporator and the volute was determined, the change in the air supply volume was determined by the rotational speed of the cross-flow fan.
In the present study, Figure 8 shows the sensitivity of the minimum total pressure was analyzed in the duct to increase the flow rate. It was found that as the air volume increases from 1 Qd to 1.15 Qd, the minimum total pressure remarkably changes, indicating that the minimum total pressure is the most sensitive parameter to the variation of the flow segment. On the other hand, when the air volume varies between 0.85 Qd and 1 Qd, the minimum total pressure slightly changes, indicating that the minimum total pressure is the less sensitive parameter to the variation of the flow segment.

4.2. Distribution of Pressure

4.2.1. Distribution of Static Pressure

The size, position, and formation mechanism of the eccentric vortex is determined from the static pressure diagram. The internal static pressure distribution of the impeller is different for different flow rates. It was observed that for five different flow conditions, a low-pressure zone was created in the internal tongue of the impeller, which is determined by unique characteristics of the cross-flow fan. When the gas first flows into the cascade of the cross-flow fan, the operation of the blade on the gas is hindered. This reduces the gas flow rate so that the dynamic pressure of the gas is converted into the static pressure. When the gas flows through the cascade for the second time, the gas velocity relative to the impeller increases so that the static pressure of the gas reduces. This mode of operation causes the static pressure inside the impeller to gradually decrease from top to bottom and the resulting pressure gradient causes the gas to flow through the impeller. Meanwhile, a part of the airflow is recirculated at the exit by the pressure gradient, thus forming an eccentric vortex, where the vortex core of the eccentric vortex has the lowest static pressure.
Figure 9 shows that as the system flow changes, the static pressure changes significantly and the larger the flow rate, the larger the negative pressure value. When the flow rate is H = 0.4 Qd, the static pressure range of the whole flow channel is −39~7 pa. Moreover, when H = 1.15 Qd and H = 1.33 Qd, the static pressure ranges are −92~22 Pa and −100~30 Pa, respectively.

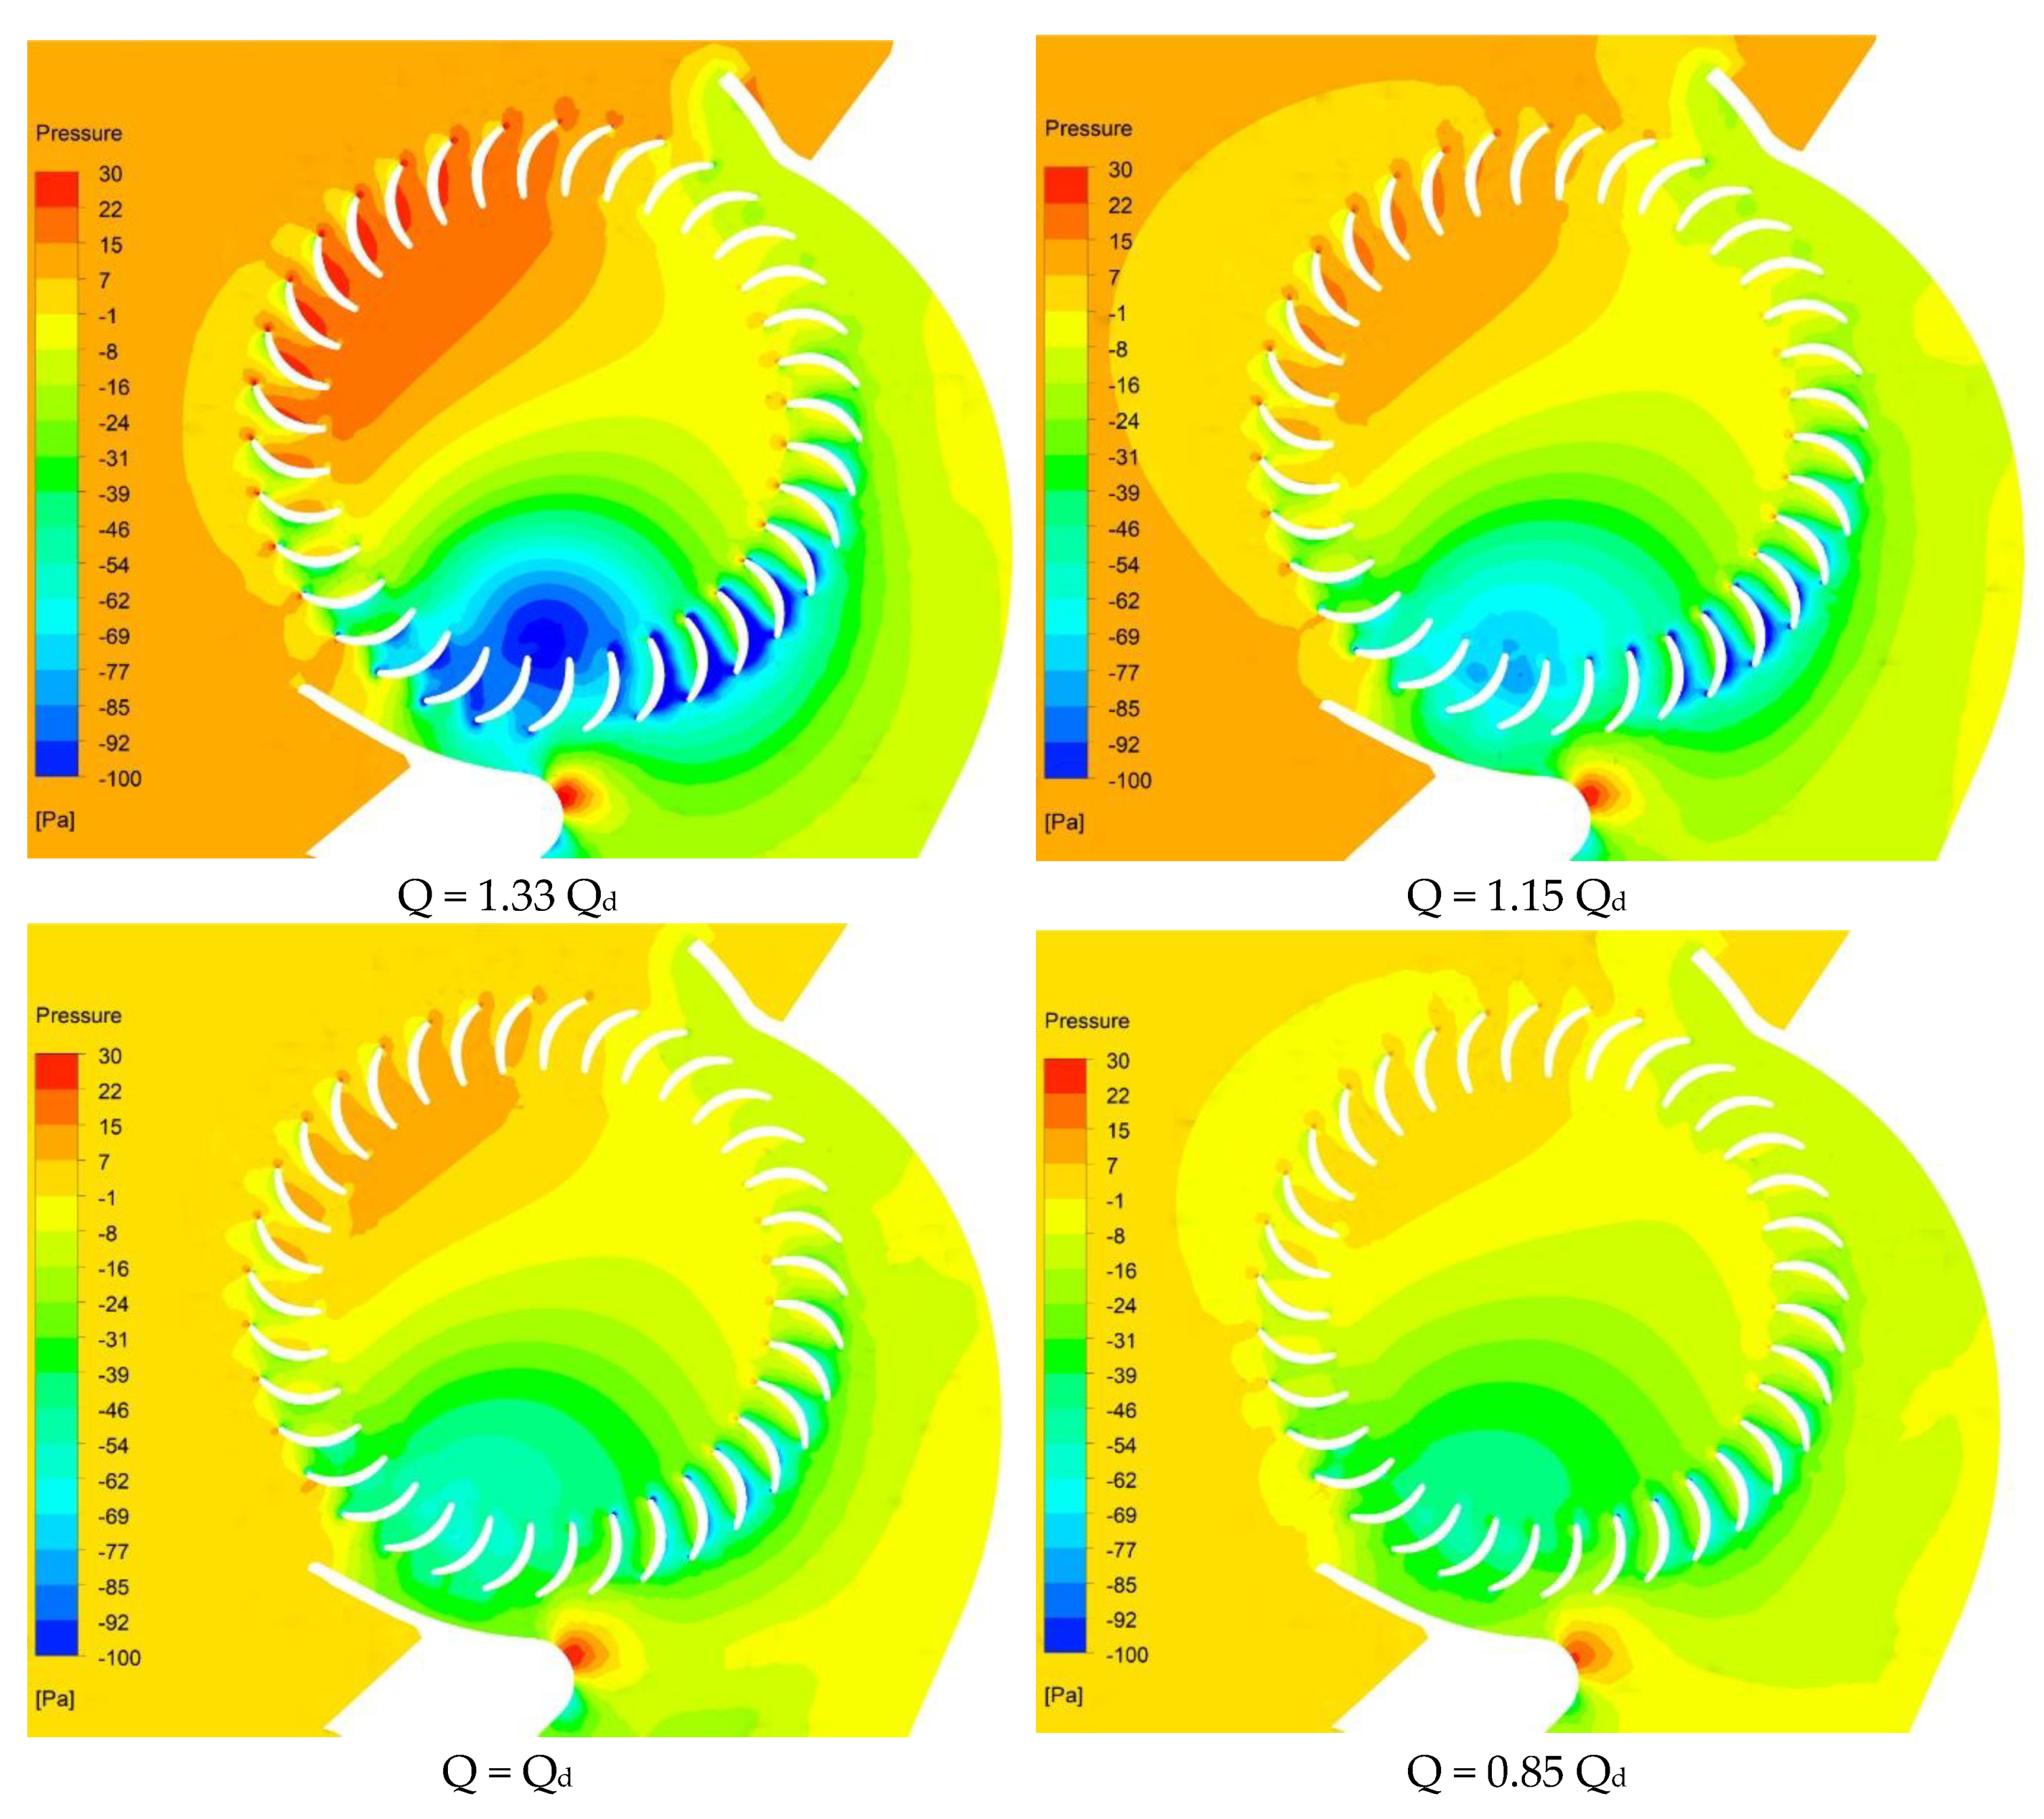
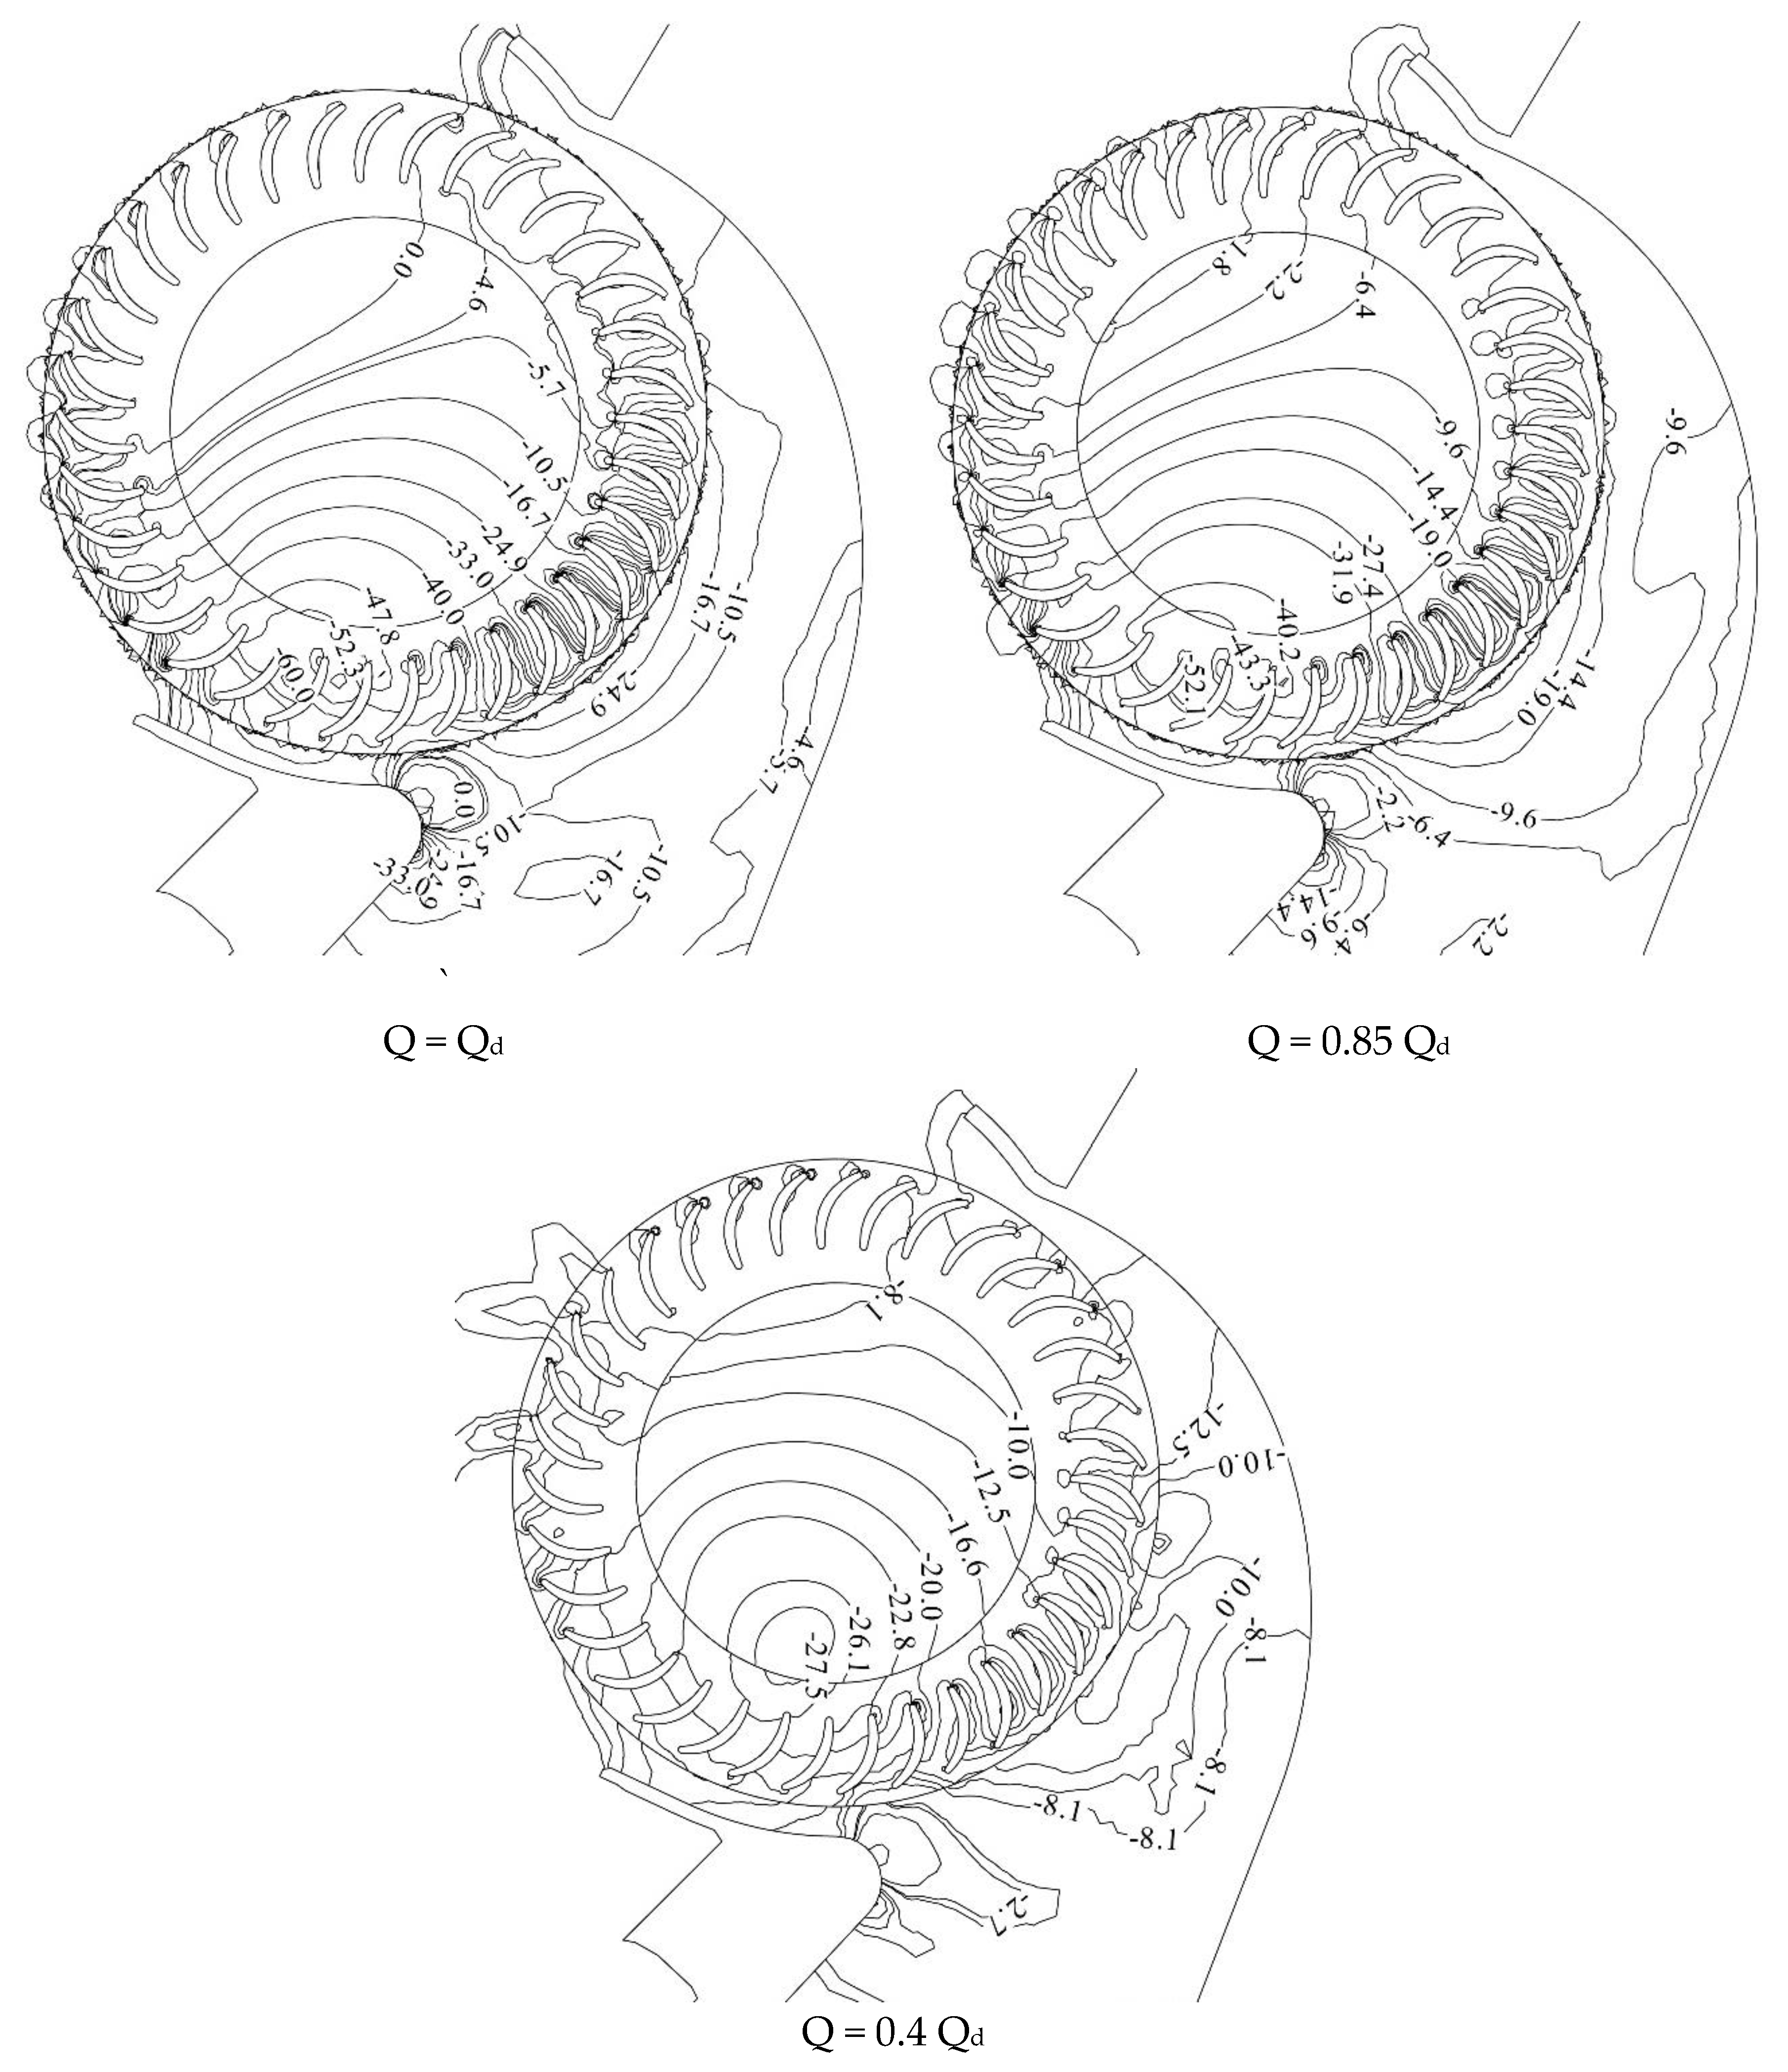
4.2.2. Distribution of Pressure Contour

As shown in Figure 10 that although the pressure range of the cross-flow fan duct system varies greatly, the minimum negative pressure value exists at the core of the eccentric vortex. The position of the eccentric vortex core undergoes minor changes. Moreover, as the flow rate increases, the pressure at the eccentric vortex core decreases.

4.3. Distribution of Velocity Vector

Figure 11 shows the velocity vector diagram. It was observed that the position of the eccentric vortex core region for different flow conditions of the cross-flow fan had a slight change, which was consistent with the pressure contour.
Considering the eccentric vortex area of the cross-flow fan, it was found that the eccentric vortex area increases as the cross-flow fan flow decreases. The working condition of 1.33 Qd eccentric vortex low speed area accounts for four blade flow paths. Moreover, it was found that when the air volume was set to 1.15 Qd, Qd, 0.85 Qd, and 0.4 Qd, the low speed area of the eccentric vortex accounted for six, seven, eight, and nine blade flow paths, respectively. The reason for the increase in the eccentric vortex area is mainly due to the decrease of the flow of the cross-flow fan, moreover, the rotation of the formed cross-flow fan is enhanced, so that it is difficult for the inlet airflow to effectively enter the inner cross-flow area of the fan and the recirculation area is increased. The phenomenon gradually increases as the flow rate decreases. As the flow of the cross-flow fan decreases, the area of the airflow passage area decreases, the area of the eccentric vortex area gradually increases, the airflow at the outlet expands, and the uniformity becomes worse. This is consistent with conclusions reached in the literature [18] through experiments.

4.4. Distribution of Vorticity

The vorticity figure shows the distribution of the flow field vorticity in the cross-flow fan and infers the position of the eccentric vortex. Moreover, it is observed that when the Mach number is not very high, the generation of vortices causes noise so that the analysis of the vorticity figure is necessary.
Figure 12 illustrates a vorticity distribution contour. It indicates that there are three vortex zones in the blade channel, including the inlet, the eccentric, and the exit vortex zones. It should be indicated that the eccentric vortex is the most obvious vortex. When the airflow flows through the blade, obvious trailing vortices appear near the trailing edge of the blade near the volute tongue and these shedding vortices eventually combine together to form an eccentric vortex. Due to the existence of the eccentric vortex, the airflow flowing from the impeller has significant interference with the volute tongue. The partial airflow flowing through the volute tongue region and blending with the first inflow impeller airflow results in a smaller eddy current zone. The vortex value of the outlet portion near the impeller at the volute tongue is large, which may be the result of the airflow impinging on the rotating blades. Figure 12 indicates that there are obvious wakes in the vicinity of the blade and the tail of the volute tongue. These wake and blade interactions generate pressure pulsation, resulting in the generation of aerodynamic noise.
The vorticity distribution inside the channel is different under different flow rates. Moreover, the vorticity distribution area and its size of the same color gradation have changed. As the flow rate increases, the distribution of the vorticity increases gradually. The area with large vorticity under various working conditions is basically distributed in the vicinity of the blade surface.

4.5. Distribution of Pressure on the Circumferential Direction

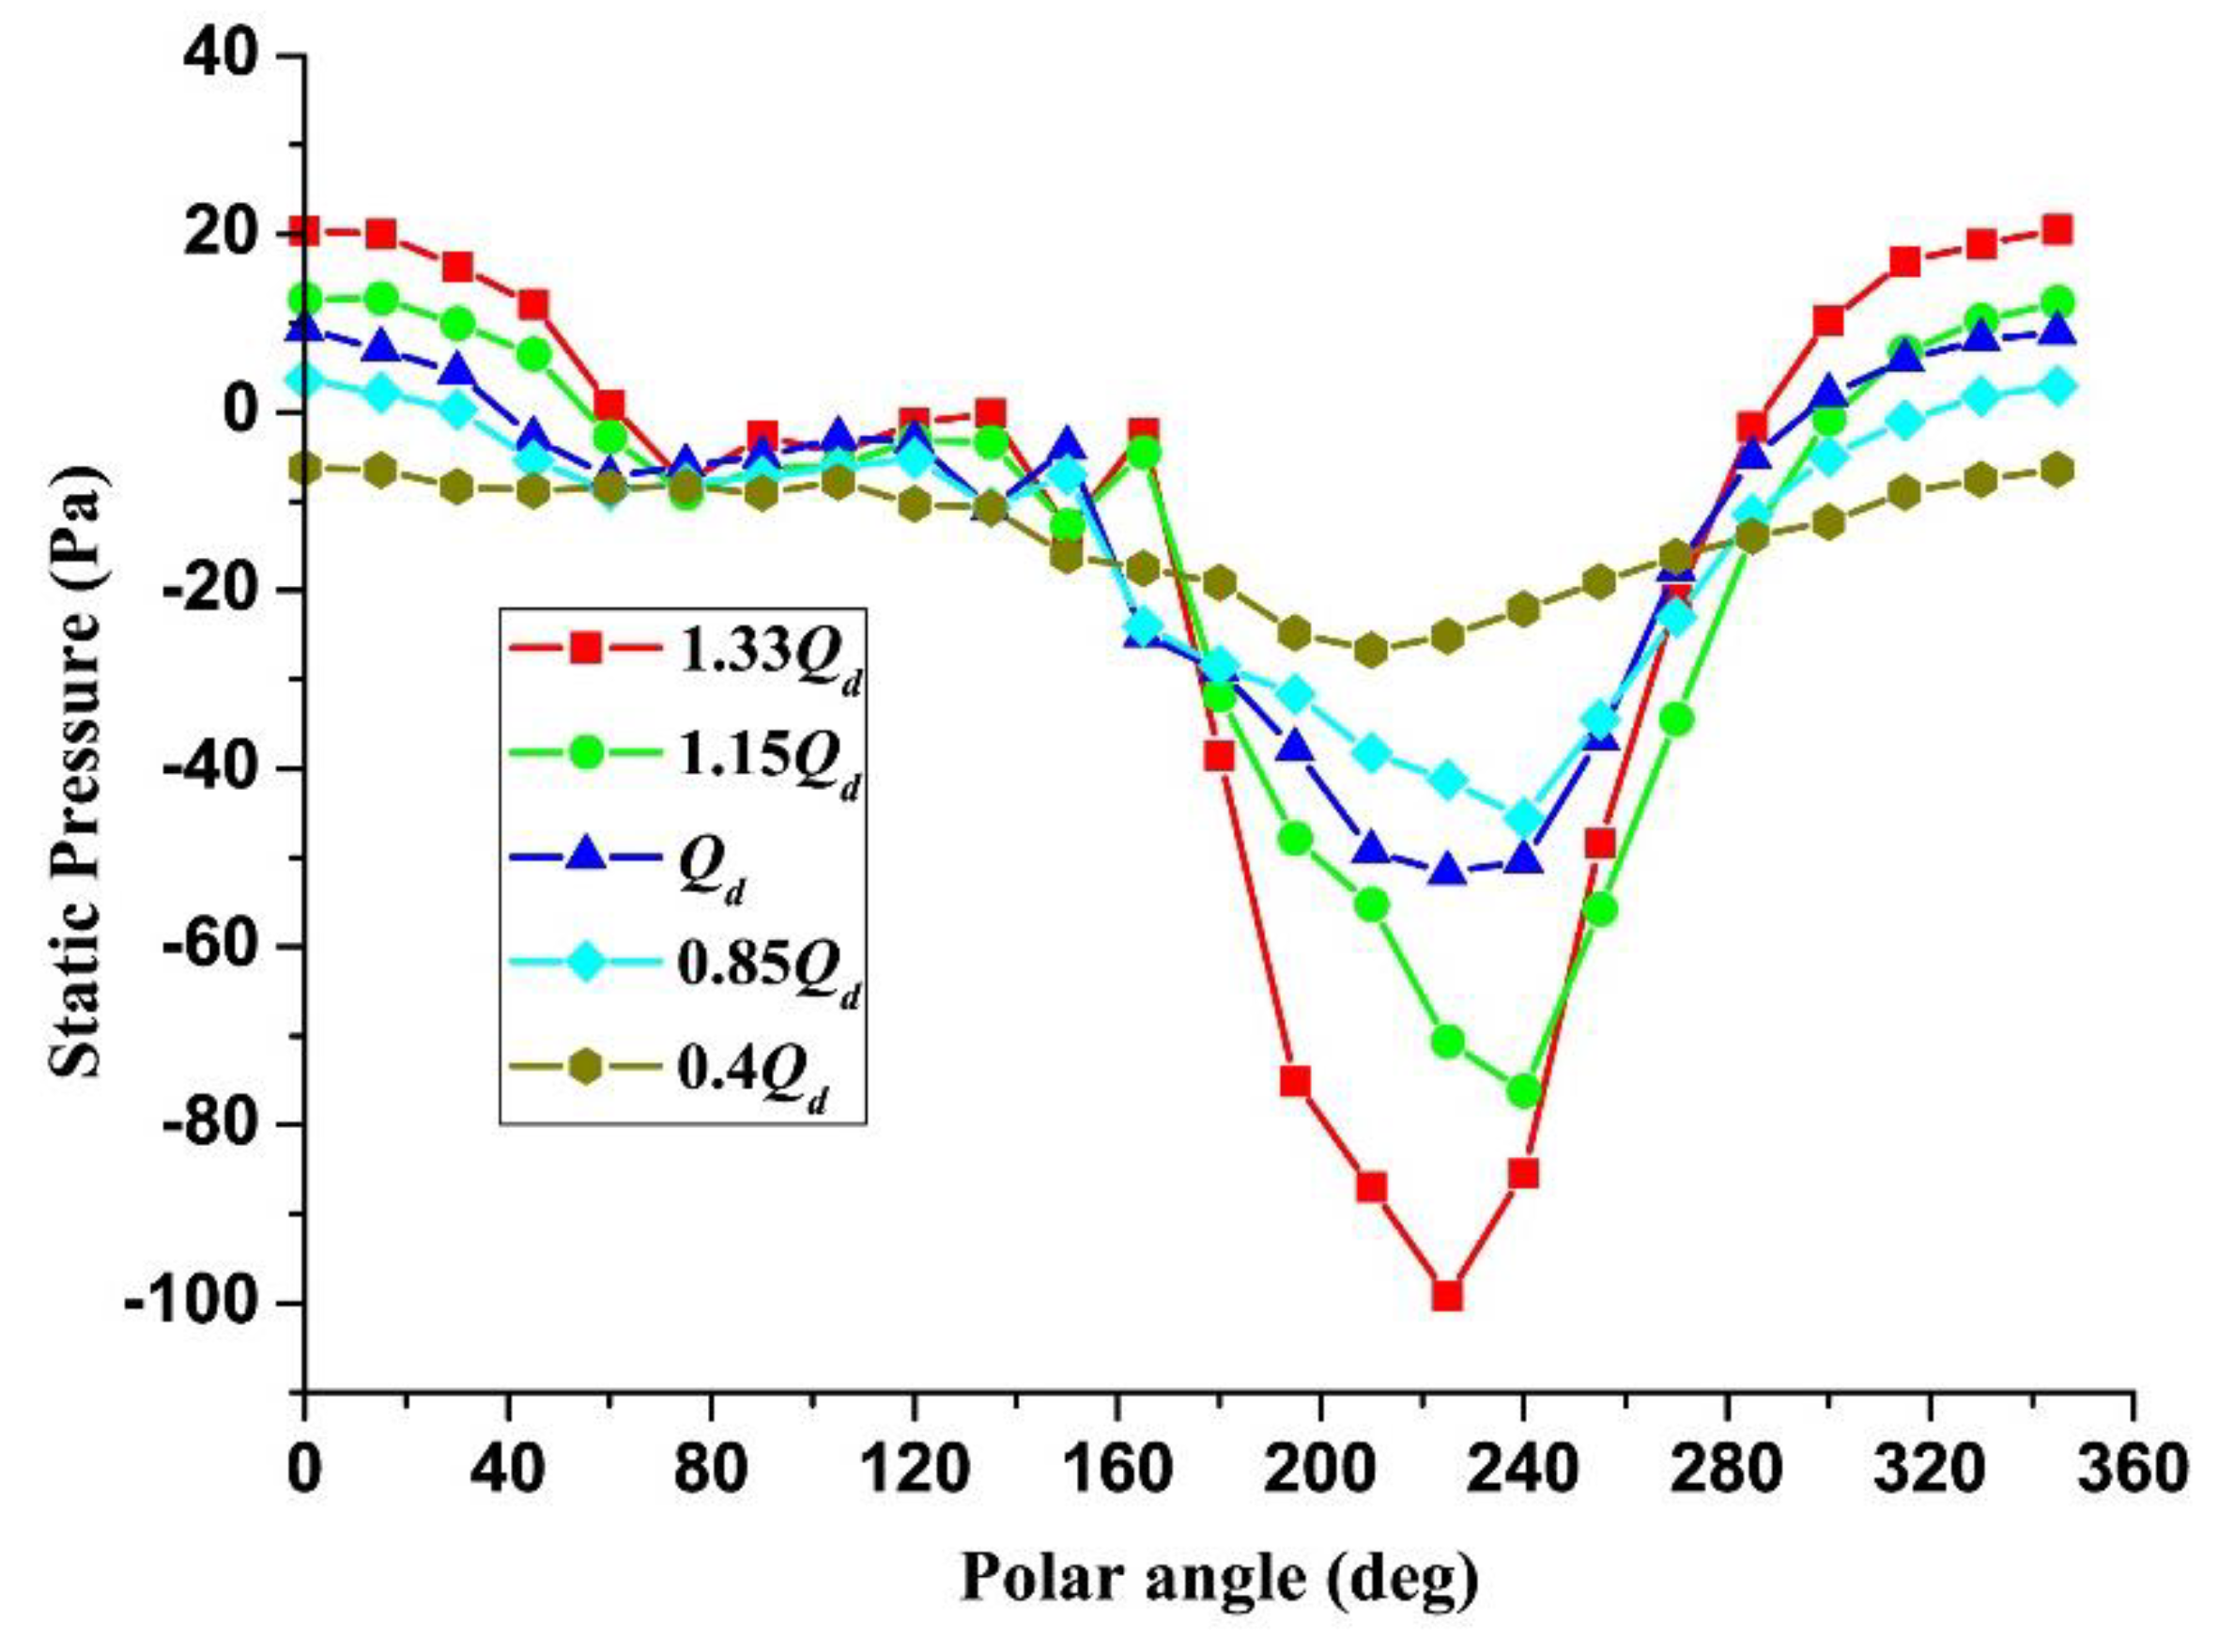
4.5.1. Distribution of Pressure on Different Operating Conditions (R = 33 mm)

As shown in Figure 13, the static pressure of the cross-flow fan obtained by numerical simulation is distributed along the circumferential direction of the R = 33 mm surface, where the abscissa is the relative position polar coordinate on the R = 33 mm surface. In the vicinity of 230°, there is a minimum static pressure, in which the static pressure value is less than the atmospheric pressure and the corresponding position is near the volute tongue, indicating that the static pressure value is the smallest near the eccentric vortex position. There is also a low static pressure near the 60 position and the corresponding position is the recirculation area close to the volute. This result is consistent with the static pressure cloud result.
Furthermore, Figure 14 illustrates the total pressure distribution is similar to the static pressure distribution. The total pressure is the smallest near the eccentric vortex, and it is less than the atmospheric pressure. This result is consistent with the total pressure cloud result. The total minimum pressure appears in the eccentric vortex near the volute tongue and the volute return near the zone, the total pressure near the eccentric vortex is significantly smaller than the total pressure of the main flow zone. Moreover, the maximum pressure appears near the airflow outlet zone. Therefore, it is indicated that the static and total pressures of the eccentric vortex region are the lowest points inside the cross-flow fan and smaller than the airflow passage region.
As the flow rate decreases, the pressure pulsation amplitude of the eccentric vortex region significantly increases. Moreover, the static and total pressure pulsation amplitudes gradually increase. Flow rate 1.33 Qd, static pressure: -100 Pa; 0.4 Qd flow rate, static pressure: -20 Pa. The fan system runs from large flow to small flow and the pressure pulsation amplitude increases significantly.

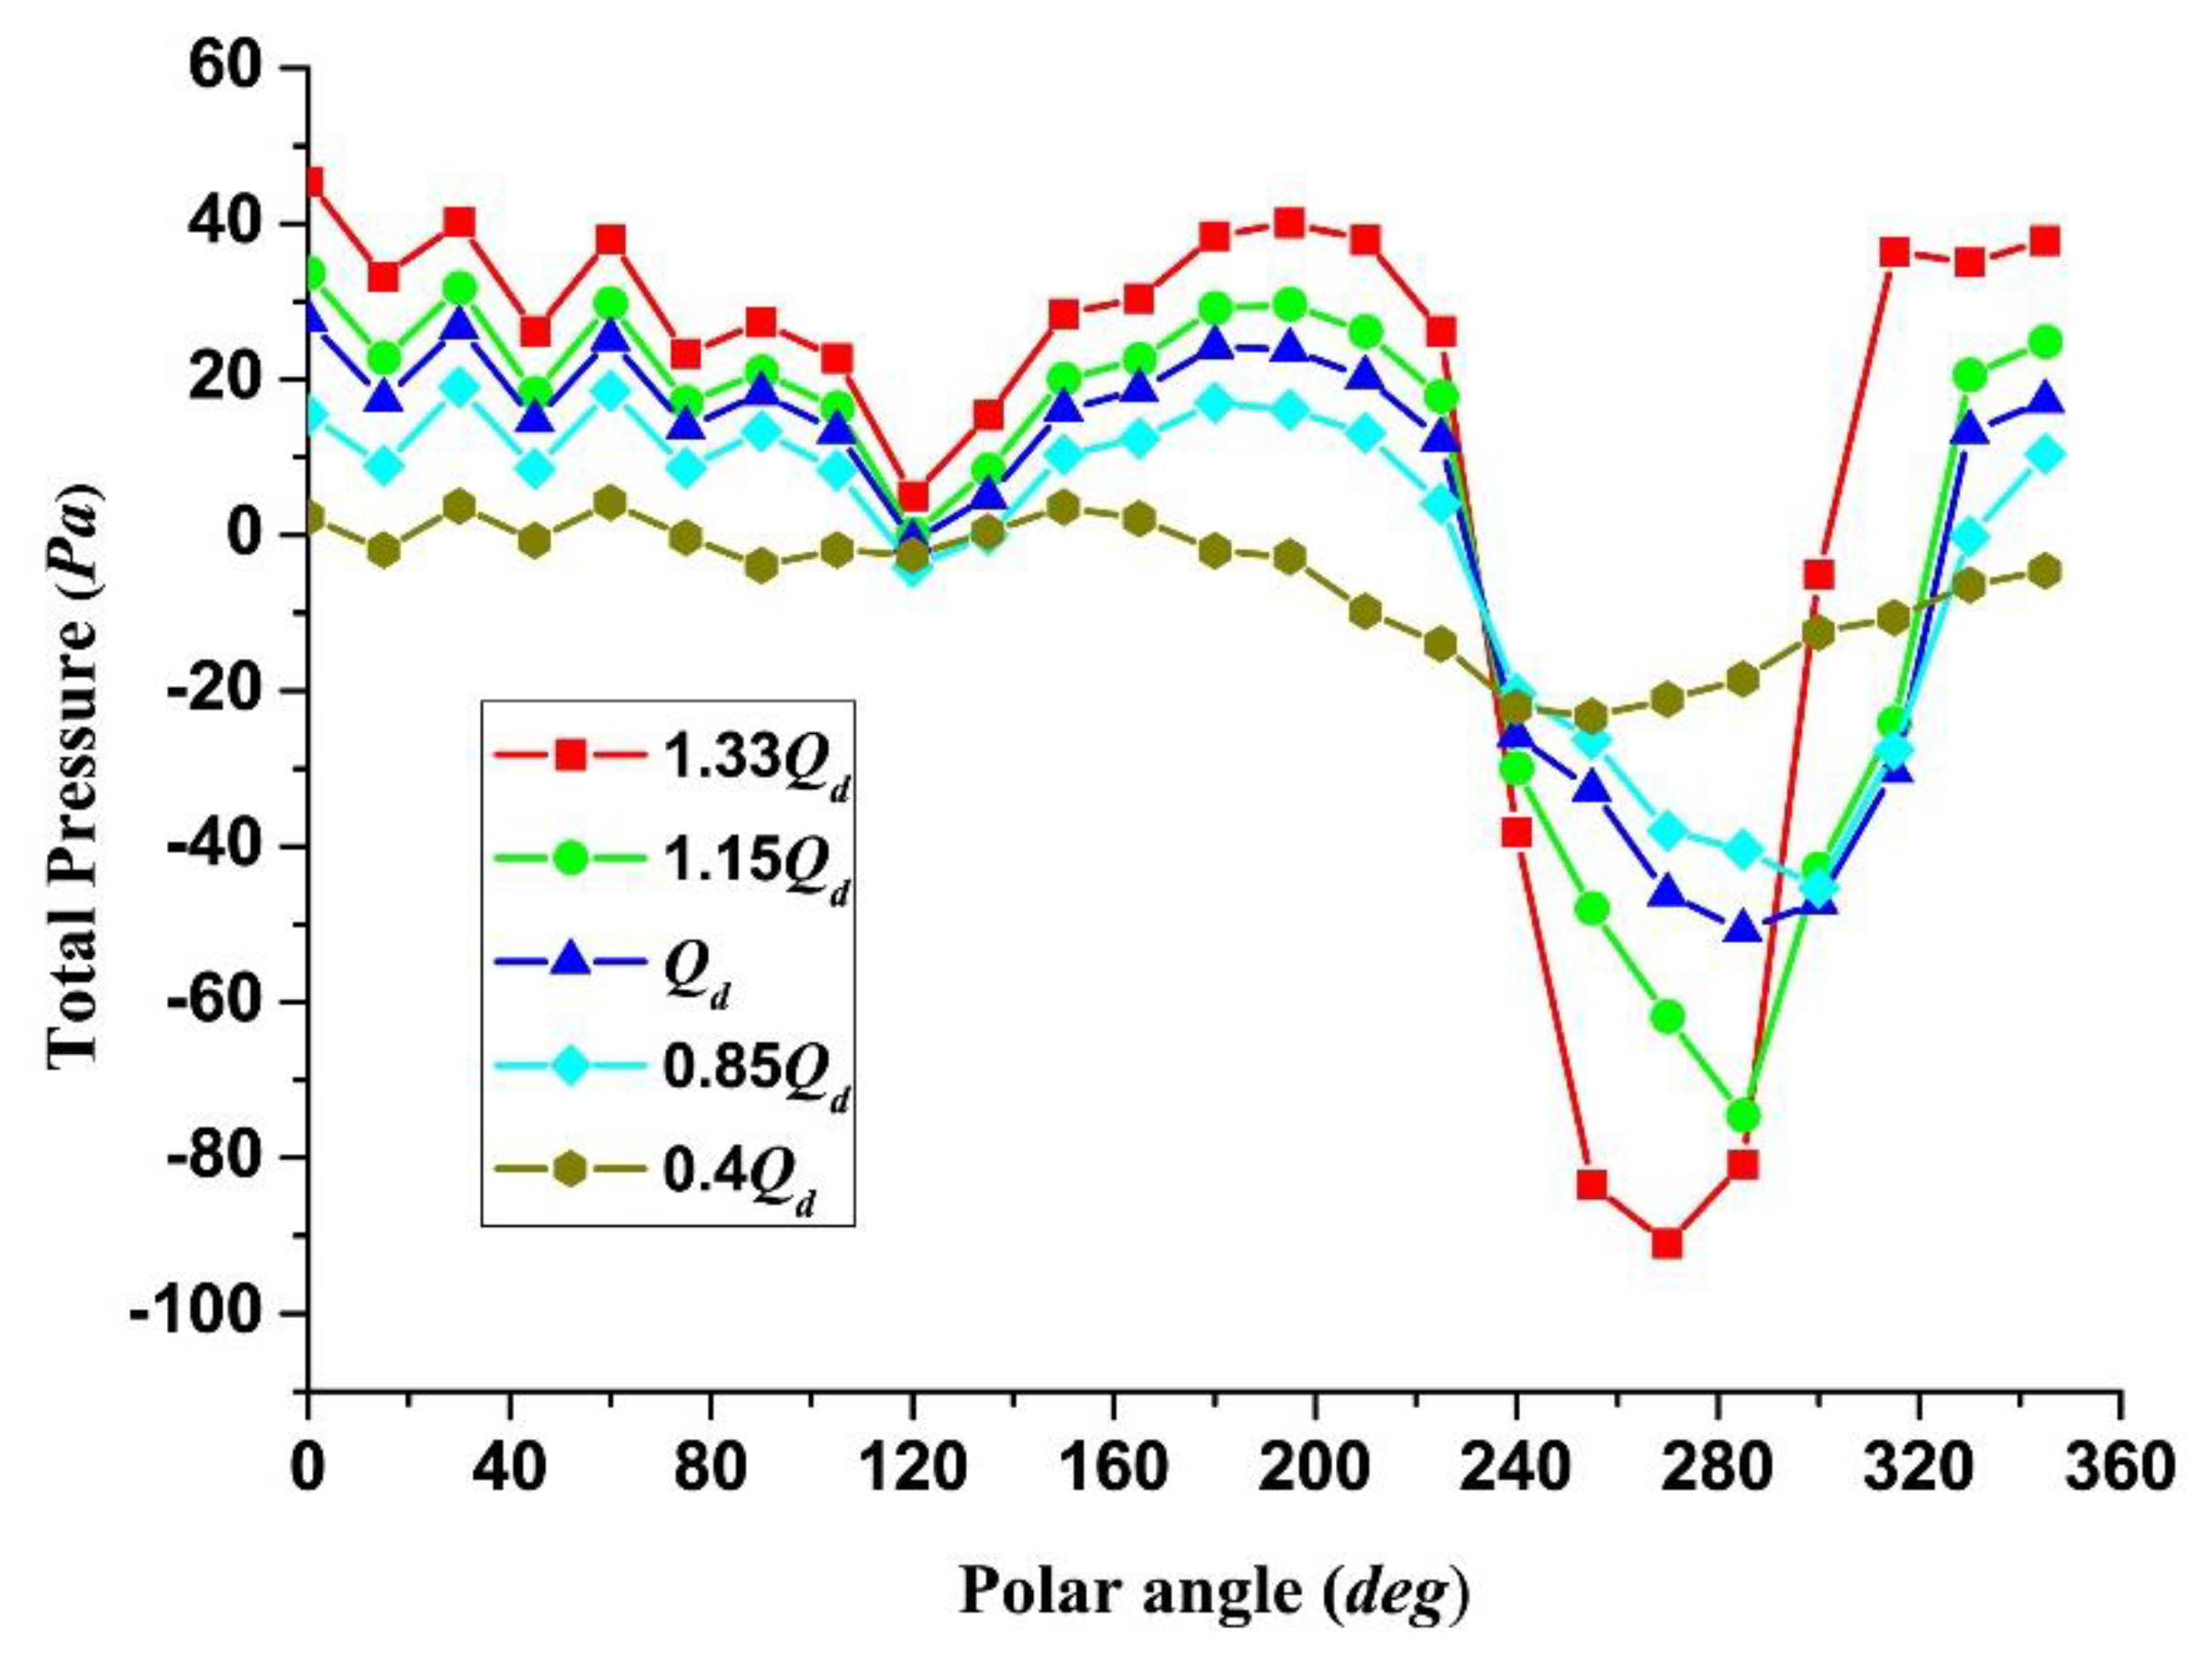
4.5.2. Distribution of Total Pressure Inside and Outside the Blade at the Same Operating Conditions (R = 59 mm)

As shown in Figure 15, Figure 16 and Figure 17, the total pressure of the cross-flow fan obtained by numerical simulation is distributed along the circumferential direction of the R = 59 mm and R = 33 mm surface, where the abscissa is the relative position polar coordinate on the R = 59 mm and R = 33 mm surface. According to the formation and development of the eccentric vortex, the flow area can be divided into four zones. These zones are briefly described as follows:
  • The suction zone (60–210°): In this zone, the total pressure inside and outside the blade remains stable. In fact, the suction zone is the most stable area in the rotation cycle of the blade.
  • The volute tongue zone (0–60°): This zone is close to the eccentric vortex of the inner side of the blade in the volute tongue area, where the total pressure is low, the total pressure on the outside of the blade is not affected, and the pressure difference between the inner and outer sides is considerable.
  • The volute zone (210–240°): The distance between the fan blade and the volute in the volute zone is relatively low, and the total pressure inside and outside the blade is significantly low.
  • The exhaust zone (240–360°): In this zone, the total pressure on the outer side of the blade increases significantly, so that it reaches the maximum value at the air duct system. The total pressure on the inner side increases first and then decreases, and gradually decreases toward the direction of the volute tongue.
With the decrease of the flow rate, the pressure pulsation amplitude of the eccentric vortex position area greatly increases, and the total pressure pulsation amplitude gradually increases.

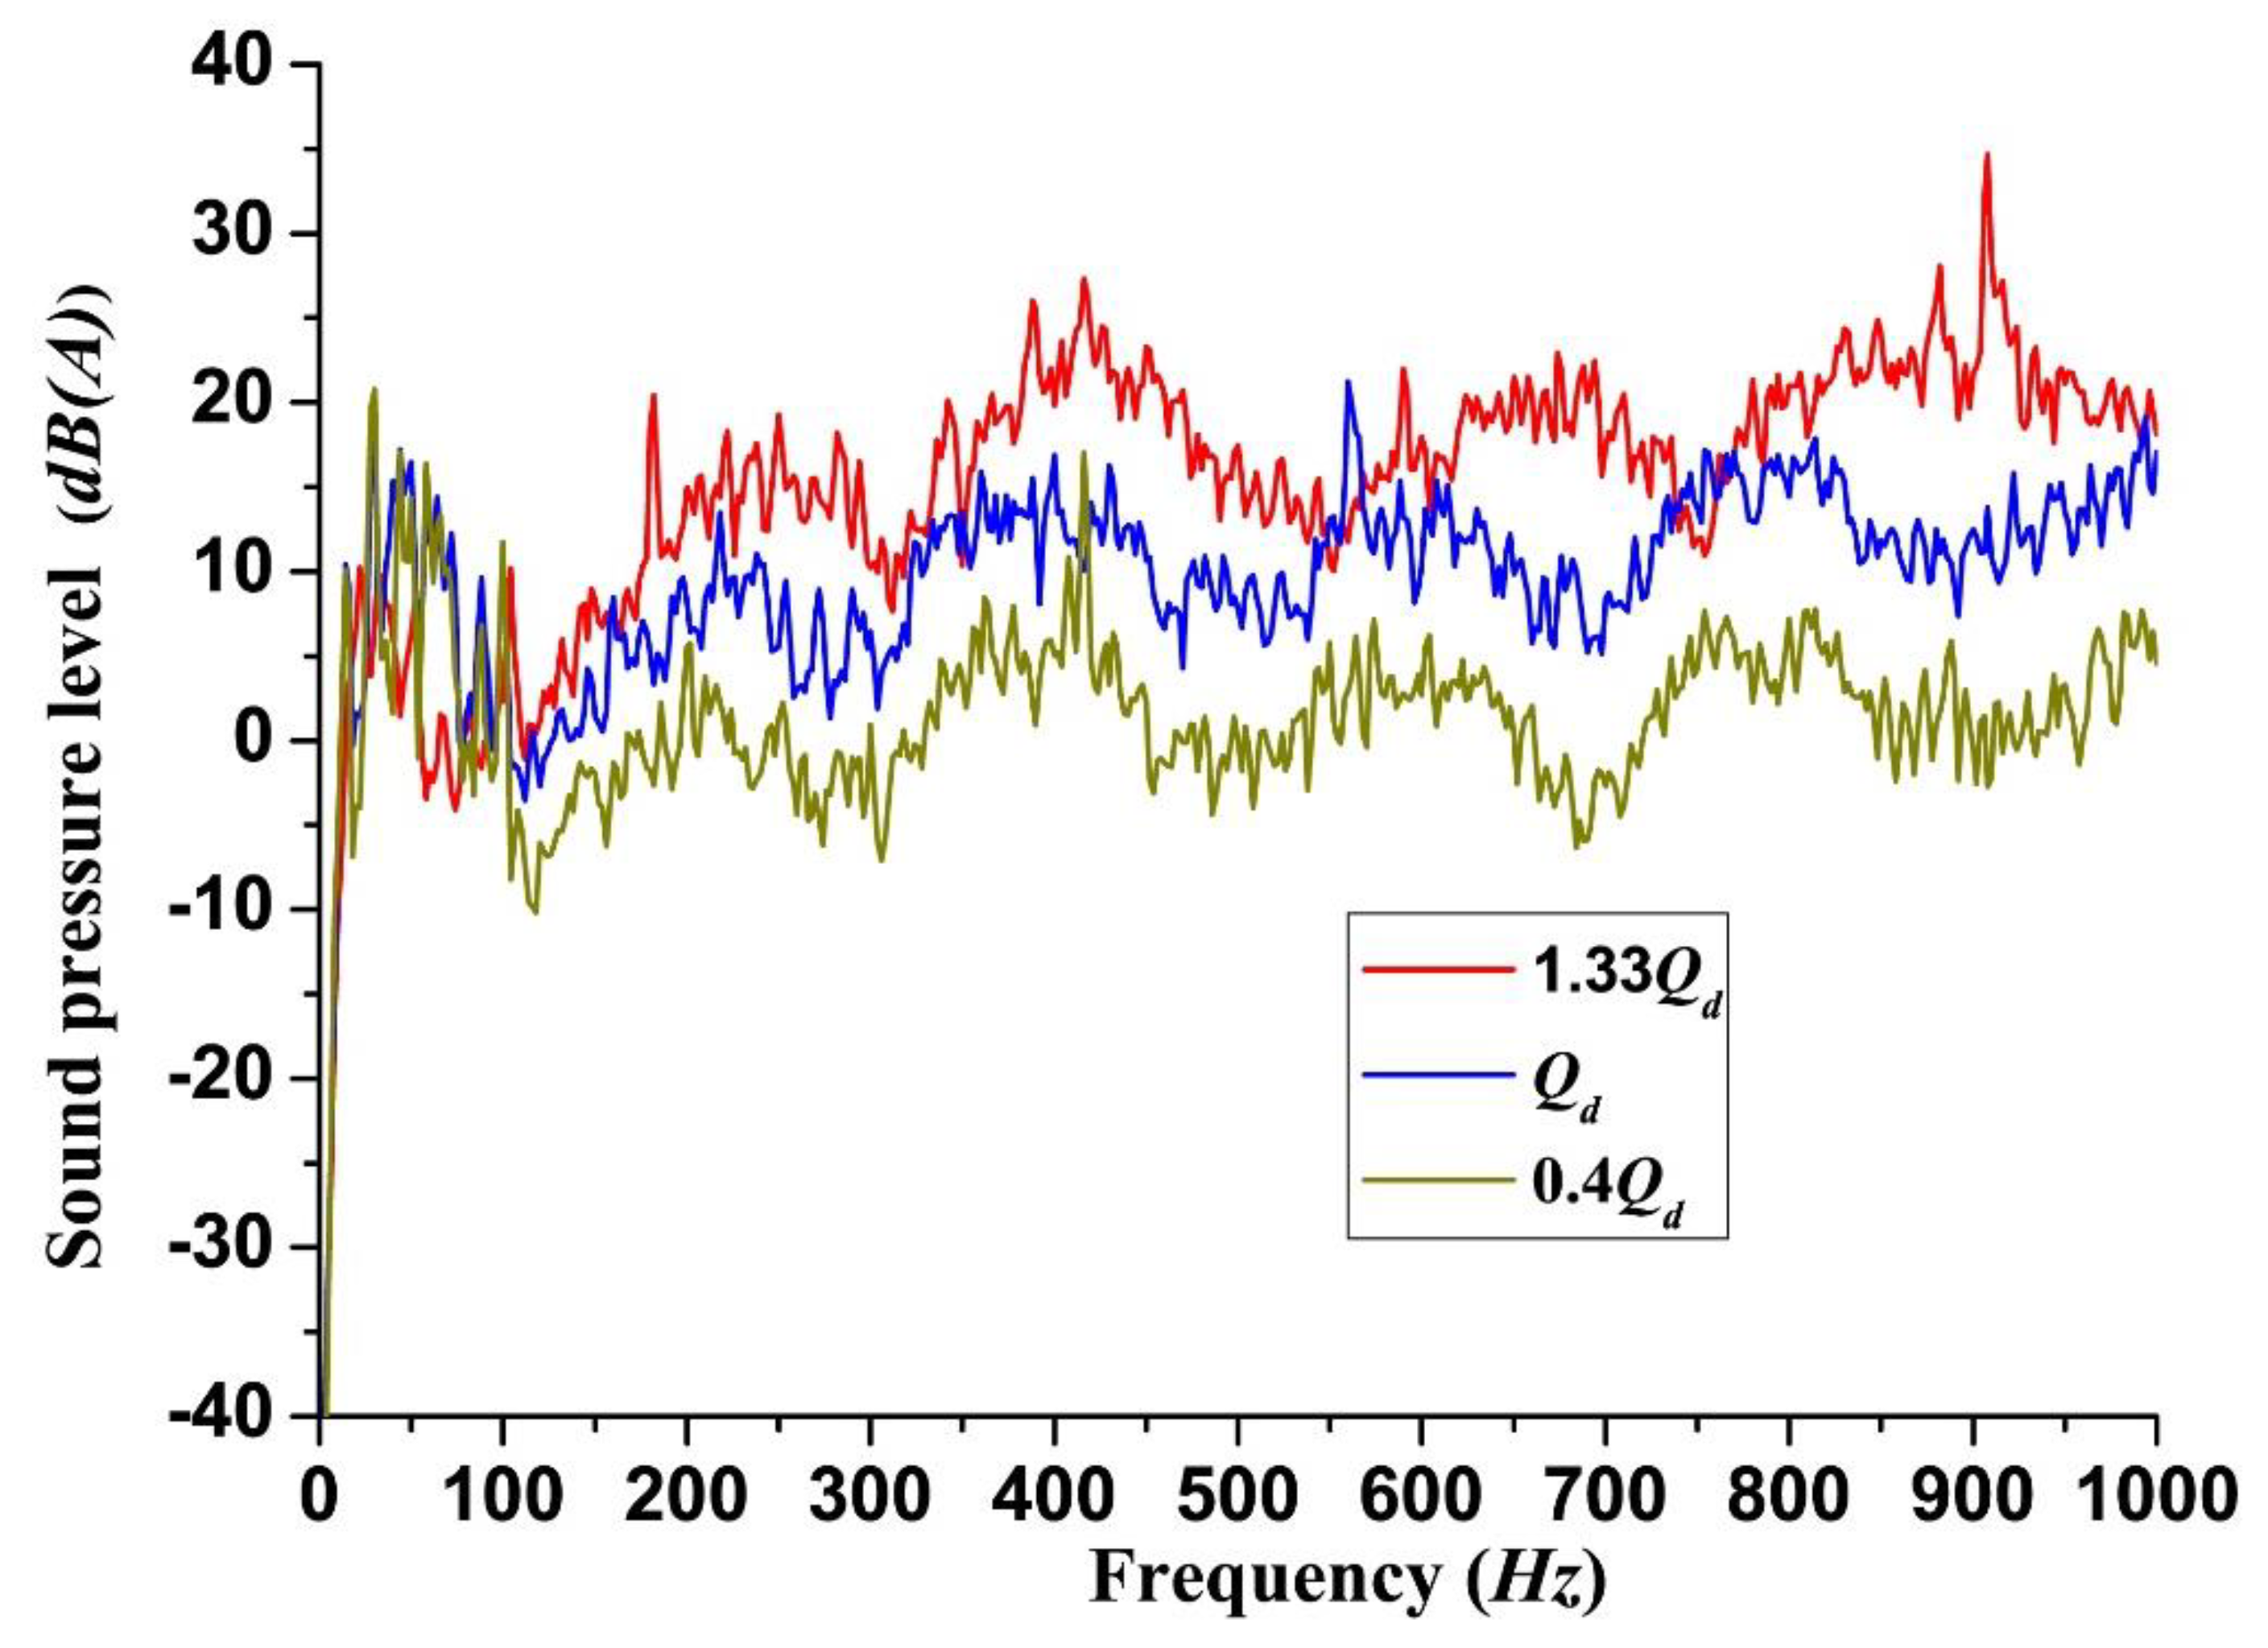
4.6. Analysis of Spectral Characteristics

Figure 18 shows spectral characteristics of the cross-flow fan aerodynamic noise at different flow rates. The noise spectrum shows obvious broadband characteristics, indicating that the noise of the cross-flow fan is mainly aerodynamic noise caused by unsteady pressure pulsation. The cross-flow fan operates under the 1.33 Qd design flow condition and the noise spectrum shows obvious peaks at two times the blade passing frequency and harmonic frequency. The noise caused by the blade’s impact on the surrounding gas is called the rotating noise, which is the noise source in this condition. When the flow rate of the cross-flow fan reduces to the design flow rate, the first peak appears at 1.2 times the blade passing frequency, indicating that the internal flow state is more reasonable under the flow condition. When the flow rate of the cross-flow fan is 0.4 Qd, the maximum peak value of the aerodynamic noise appears at 50 Hz, and the second peak appears at 0.9 times the blade passage frequency, and there is no obvious peak at the harmonic frequency of the blade passage frequency. This shows that the aerodynamic noise is caused by the main unstable flow.

5. Conclusions

In the present study, numerical simulation and noise experiments were used to study the transient process under five operating conditions. According to the simulation calculation and experimental results, pressure pulsation and flow field in the unsteady are analyzed from the following aspects.
(1)
As the system flow changes, the static pressure in the air duct changes significantly, and the larger the flow rate, the larger the negative pressure value. It was found that the pressure distribution range under different working conditions and flow rates is different. Moreover, the pressure at the eccentric vortex core is different. Minor changes occur at the position of the eccentric vortex core.
(2)
As the flow of the cross-flow fan decreases, the area of the airflow passage area decreases, the area of the eccentric vortex gradually increases, the airflow at the outlet expands, and the uniformity gets worse.
(3)
As the flow rate increases, the distribution of vorticity increases gradually. Moreover, the area with large vorticity under various working conditions is basically distributed in the vicinity of the blade surface. It was observed that there are obvious wakes in the vicinity of the blade and the tail of the volute tongue. These wake and blade interactions generate pressure pulsation, resulting in the generation of aerodynamic noise.
(4)
The pressure on the circumferential direction (R = 59 mm, R = 33 mm) was consistent with the total pressure cloud result. The total minimum pressure appears in the eccentric vortex near the volute tongue and the volute return near the zone. Moreover, it is indicated that the total pressure near the eccentric vortex is significantly smaller than the total pressure of the main flow zone. As the flow rate decreases, the pressure pulsation amplitude of the eccentric vortex region greatly increases, and the static pressure and total pressure pulsation amplitude gradually increase. Close to the eccentric vortex on the inner side of the blade in the volute tongue area, the total pressure is low, the total pressure on the outside of the blade is not affected, and the pressure difference between the inner and outer sides is large.
(5)
Spectral characteristics show that the cross-flow fan is operating at the designed flow rate. The first peak appears at two times the blade passing frequency, indicating that the internal flow state is more reasonable under the flow condition. When the flow rate of the cross-flow fan is 0.4 Qd, there is no obvious peak at the harmonic frequency of the blade passage frequency. This indicates that the aerodynamic noise is caused by the main unstable flow.

Author Contributions

W.Z. performed the data analyses and wrote the manuscript. J.Y. contributed to the conception of the study. Q.S. and Y.F. helped perform the analysis with constructive discussions.

Funding

This work was supported by the National Key Research and Development Topics No. 2018YFB0606103, China.

Acknowledgments

This work was supported by the National Key Research and Development Topics No. 2018YFB0606103, China.

Conflicts of Interest

The author(s) declared no potential conflicts of interest with respect to the research, authorship, and/or publication of this article.

References

  1. Chunlu, H.J. Simulation of aero acoustic on air-conditioner. Chin. J. Mech. Eng. 2004, 40, 188–192. [Google Scholar]
  2. Zhi, N.G.; Xiao, B.S. Fan Noise Control Technology; Mechanical Industry Press: Beijing, China, 1985. [Google Scholar]
  3. Fan, B.E. Shen Yang Blower Research Institute and Other Translations, 1st ed.; Mechanical Industry Press: Beijing, China, 1983. [Google Scholar]
  4. Porter, A.M.; Markland, E. A Study of the Cross Flow Fan. J. Mech. Eng. Sci. 1970, 12, 421–431. [Google Scholar] [CrossRef]
  5. Fukutomi, J. Internal Flow and Performance of Cross-Flow Fan; JSME: Tokyo, Japan, 1995; pp. 3669–3705. [Google Scholar]
  6. Tsurusaki, H.; Tsujimoto, Y.; Yoshida, Y.; Kitagawa, K. Visualization measure and numerical analysis of internal flow in cross flow fan. J. Fluids Eng. 1997, 119, 633–638. [Google Scholar] [CrossRef]
  7. Tsurusaki, H.; Shimizu, H.; Tsujimoto, Y.; Yoshida, Y.; Kitagawa, K. Study of cross-flow fan internal flow by flow visualization(discussion of measured results by particle-tracking velocimetry. J. Fluids Eng. 1996, 39, 540–545. [Google Scholar] [CrossRef] [Green Version]
  8. Yang, B.; Zhong, F.Y.; Yuan, H.Q. Experimental study on internal flow of cross-flow fans. J. Mech. Eng. 2000, 36, 68–70. [Google Scholar] [CrossRef]
  9. Tanaka, S.; Murata, S. Scale effects in cross flow fans (effects of fan dimentions on flow details and the universal representation of performances). JSME 1995, 38, 388–397. [Google Scholar]
  10. You, B.; Wu, K.Q. Computational fluid dynamics simulation of unsteady evolvement of vortices flow in cross flow fan. J. Eng. Thermophys. 2004, 25, 238–240. [Google Scholar]
  11. You, B.; Wu, K.Q. Comparison research of the twisted impeller and the straight impeller in the cross flow fan. J. Eng. Thermophys. 2005, 26, 58–60. [Google Scholar]
  12. Akaike, S. Internal flow and fan characteristics of a cross flow fan. JSME 1997, 63, 583–589. [Google Scholar] [CrossRef]
  13. Liu, M. Numerical Analysis and Experimental Research on the Aeroacoustics of Cross-Flow Fans; Huazhong University of Science and Technology: Wuhan, China, 2009. [Google Scholar]
  14. Zhao, X.L. Internal Flow Mechanism and Noise Analysis for Cross-Flow Fan in Air-Conditioning; Huazhong University of Science and Technology: Wuhan, China, 2013. [Google Scholar]
  15. Liu, Q. Research on the Flow Field Characteristics in Duct System of Indoor Air Conditioner; Huazhong University of Science and Technology: Wuhan, China, 2011. [Google Scholar]
  16. Zhou, S.; Kong, F.; Wang, Z.; Yi, C.; Zhang, Y. Numerical simulationfor low specific-speed centrifugal pump with structured grid. J. Agric. Mach. 2011, 42, 66–69. [Google Scholar]
  17. Xing, G.L.; Zhou, S.P. Comparison and Analysis of Two K-ε Turbulence Models for Simulation of Flow Field in a Cross-Flow Fan; China Engineering Thermophysics Society: Shao Xing, China, 2008. [Google Scholar]
  18. Shih, Y.; Hou, H.; Chiang, H. On similitude of the cross flow fan in a split-type air-conditioner. Appl. Therm. Eng. 2008, 28, 1853–1864. [Google Scholar] [CrossRef]
Figure 1. Configuration of the air-conditioning system.
Processes 07 00959 g001
Figure 2. Computational domain and grid distribution.
Processes 07 00959 g002
Figure 3. Flow rate with different grid numbers.
Processes 07 00959 g003
Figure 4. Distribution of the monitoring points on the blade.
Processes 07 00959 g004
Figure 5. Noise test equipment.
Processes 07 00959 g005
Figure 6. Air volume test equipment.
Processes 07 00959 g006
Figure 7. Flow rate comparison between the simulation and experiment.
Processes 07 00959 g007
Figure 8. Sensitivity analysis of the total pressure and the flow rate.
Processes 07 00959 g008
Figure 9. Distribution of the static pressure at different operating conditions.
Processes 07 00959 g009aProcesses 07 00959 g009b
Figure 10. Distribution of the pressure contour at different operating conditions.
Processes 07 00959 g010aProcesses 07 00959 g010b
Figure 11. Velocity distribution at different operating conditions.
Processes 07 00959 g011
Figure 12. Vorticity distribution at different operating conditions.
Processes 07 00959 g012aProcesses 07 00959 g012b
Figure 13. Distribution of static pressure along the circumferential direction of the R = 33 mm surface.
Processes 07 00959 g013
Figure 14. Distribution of total pressure along the circumferential direction of the R = 33 mm surface.
Processes 07 00959 g014
Figure 15. Distribution of the total pressure along the circumferential direction of the inside and outside of the blade at the air volume of Q = 1.33 Qd.
Processes 07 00959 g015
Figure 16. Distribution of the total pressure along the circumferential direction of the inside and outside of the blade at the air volume of Q = Qd.
Processes 07 00959 g016
Figure 17. Distribution of the total pressure along the circumferential direction of the inside and outside of the blade at the air volume of Q = 0.4 Qd.
Processes 07 00959 g017
Figure 18. Distribution of the spectrum at different operating conditions.
Processes 07 00959 g018
Table 1. Impeller specifications of the model blade.
Diameter (mm)Dt111.5
Hub ratiov0.63
Blade height (mm)l66.8
Blade numberz35
Inlet angel (°)β190
Outlet angel (°)β226
Table 2. Operating parameters of the air-conditioning system.
Nominal Speed (rpm)n800
Nominal flow rate (m3/h)Qd822
Nominal power (w)P20

