Article

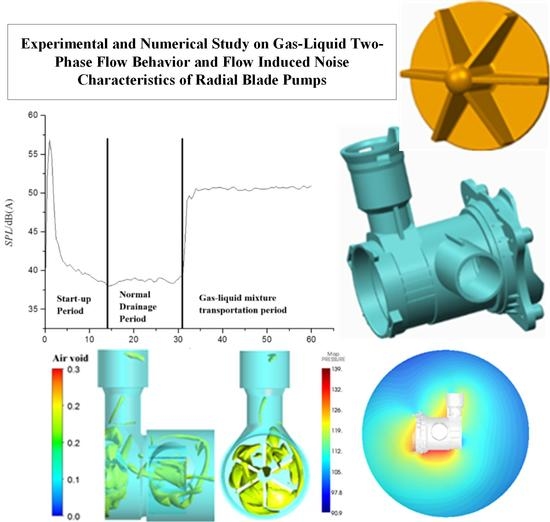
Experimental and Numerical Study on Gas-Liquid Two-Phase Flow Behavior and Flow Induced Noise Characteristics of Radial Blade Pumps

1
National Research Center of Pumps, Jiangsu University, Zhenjiang 212013, China
2
College of Hydraulic Science and Engineering, Yangzhou University, Yangzhou 225009, China
*
Author to whom correspondence should be addressed.
Processes 2019, 7(12), 920; https://doi.org/10.3390/pr7120920
Submission received: 31 October 2019 / Revised: 15 November 2019 / Accepted: 25 November 2019 / Published: 4 December 2019
(This article belongs to the Special Issue Smart Flow Control Processes in Micro Scale)

Abstract

:
Miniature drainage pumps with a radial blade are widely used in situations with critical constant head and low noise requests, but the stable operation state is often broken up by the entraining gas. In order to explore the internal flow characteristics under gas–liquid two phase flow, pump performance and emitted noise measurements were processed under different working conditions. Three-dimensional numerical calculations based on the Euler inhomogeneous model and obtained experimental boundaries were carried out under different inlet air void fractions (IAVFs). A hybrid numerical method was proposed to obtain the flow-induced emitted noise characteristics. The results show there is little influence on pump characteristics when the IAVF is less than 1%. The pump head slope degradation was found to increase with air content. The bubbles adhere to the impeller hub on the blade’s suction side and spread to the periphery with a big IAVF, leading to unstable operation. It is obvious that vortices appear inside the impeller flow passage as IAVF reaches 6.5%. The two-phase flow pattern has a small effect on the characteristic frequency distribution of pressure fluctuation and emitted noise, but the corresponding pulsation intensity and noise level will increase. The study could provide some reference for low noise design of the drainage pump.

Graphical Abstract

1. Introduction

Pumps are classified as general machinery with varied applications [1,2,3]. In addition to energy saving and emission reduction, pumps now attract attention in terms of vibration and noise reduction [4,5]. Mini pumps with radial vane impellers are widely used in many fields such as electronic industries, blood pumps for medical industries, aerospace industries, and in some home appliances [6,7]. These pumps are known as mini-pumps because their sizes are smaller than 50 mm. Drainage pumps for home appliances such as drum type washing machines are mini pumps that consist of a synchronous motor with a splined shaft and a radial impeller connected with the splined shaft and the pressure chamber [8,9]. The radial impellers are easy to manufacture and present a stable head [10,11]. At present, the most important qualities of the washing machine are the water saving, power saving, and low noise ability, similar to other home appliances. The stable operation state of the centrifugal pumps is always broken up by the entraining gas, resulting in performance degradation and a higher level of the noise [12]. Therefore, it is significant to study gas–liquid two-phase flow behavior and the relationship to pump performance and flow induced noise characteristics of radial blade pumps.
The drainage pump is the prime drainage power component in a drum type washing machine. Initial research from Jang and Lim [13] points out that the drainage pump is one of the main noise sources in the operation of a washing machine, which affects the quality of the equipment seriously. They invented an apparatus that can control the vibration and noise during the startup period. However, the pump falls in the state of air water mixed transportation, namely empty discharge with the decrease of water level, which has a higher impact on the noise and vibration levels. An unsteady flow pattern of the air water mixture will induce gas pockets and cause performance degeneration when the pump is working in this period. Murakami and Minemura [14,15] studied experimentally the influence of air–water two-phase flow on centrifugal pump performance related to the internal flow-field by visualization and proposed a one-dimensional modeling method. This was the first study which focused on the flow pattern inside the impeller in relation with pump performance. Subsequently, Pessoa and Prado [16] observed cyclical head variation of the centrifugal pump under gas–liquid two-phase flow and pointed out that this may be caused by the periodic variation of the air pocket in the pump. Flow visualization by a high-speed camera makes it easy to identify the flow patterns and bubble size distribution when analyzing the internal flow-field under gas–liquid two phase flow. Serena and Bakken [17] performed flow instability analysis on a multiphase pump model working under higher gas void fractions and described the complex flow behavior in terms of length, location, and time scale. Further, their studies provide detailed information about the unsteady two-phase flow behavior and surging phenomena. Schäfer et al. [18] performed investigations using gamma-ray tomography techniques to find local discontinuities in pump characteristics. The handling ability for gas entraining of a centrifugal pump is still not clear to the pump designer, which is related to the two-phase flow behaviors inside the flow passage. Verde et al. [19] investigated how both flow and head modification can be related to flow pattern modifications inside the impeller. The above research, mainly experimental, focused on a traditional bend centrifugal impeller, rarely on radial blade pumps. Computational fluid dynamics (CFD) has been used widely in many engineering fields with the rapid development of computer technology [20,21,22] which could comprehensively and physically understand complicated rotating flow phenomena combined with advance signal processing technology [23,24,25]. Three-dimensional Reynolds-averaged Navier–Stokes equations (3D-URANS) CFD approaches based on Eulerian-Eulerian two-phase momentum equations and drag force models are widely adopted to process the simulation. The size and coalescence of the bubble has been found to play an important role in modeling the flow characteristic of pump under two-phase conditions [26,27]. The review paper by Si et al. [28] introduces a lot of related research works on flow-induced noise of pumps, most of which believe that the intensive pressure pulsations are an important source of hydrodynamic excitation force that in turn produces fluid and structure-borne noise. Further, fluid-borne noise is a major contributor to radiated noise as well as increased fatigue in the system components. However, related research introduced in [28] mainly focused on the internal flow and induced noise under pure water conditions. More attention should be paid to the influence of air–water mixed flow behavior to fluid borne noise on such radial blade pumps under two-phase flow.
In the present work, pump performance and noise characteristics were experimentally tested on a mini drainage pump used in washing machines. Pump performance and emitted noise measurements were both processed to obtain a relation between basement and boundary conditions for the next simulation works. 3D-URANS numerical calculation based on Euler inhomogeneous model and the obtained experimental boundary conditions are applied for four flow rates and different inlet air void fractions. The obtained air phase distribution and velocity field are presented for exploring the influence of the IAVF on the head degeneration and pressure pulsation variation of the model pump. The results could provide some theoretical guidance in optimizing the mini pump with low noise.

2. Experimental Setup and Calculation of Boundary Conditions for Pump Model

A single-stage, single-suction centrifugal pump with radial blade impeller and annular chamber volute was used for the study. This type of drainage pump is widely used on the drum washing machine because it could produce the same head when reversed rotate, thereby effectively avoiding the entanglement of debris. As shown in Figure 1, it provides kinetic energy and potential energy for the liquid after washing, which is necessary for the drainage process of washing machine. The required pump head Hr for draining is 0.8m. Design parameters of the pump are shown in Table 1. With the decrease in water level, the pump undergoes in the state of empty discharge expressed as pump head falling and high level of noise generation with intuitive adverse feeling of humans.

2.1. Test Equipment and Loop

In order to simulate the working condition of the model drainage pump used in the washing machine, an open type test rig was built, as shown in Figure 2. The hydraulic performance and noise experiments of drainage pump are performed in the semi-anechoic chamber with size of 4.2 × 3.2 × 3 m. The background noise of the semi-anechoic chamber is 20 dB and the cut-off frequency is 50 Hz.
In this open loop, the valve between the upper tank and lower tank is kept open when processing pump performance measurements under different IAVF. The air injection system is driven at the constant 0.5 bar pressure by a compressor combined with a regulator tank. The air mass flow rate is measured and well controlled by a Bürkert 8107 fluid control system which contains micro-electromechanical system flow sensors that could supply volume air flowrate value on standard conditions (25°, 101,325 Pa). The initial air volume flow rate is calculated by ideal gas equation of state after measuring the pump inlet pressure. Then, further calculation of the IAVF could be processed by the obtained air and pure water volume flowrate. The air–water mixed fluid is sucked into the pump, goes through the regulating valve, and finally arrives into the upper tank. Air bubbles inside the mixed fluid exhaust to the external space stay in the upper tank and the left pure water runs to the lower tank. The flow rate of pure water was measured by an electromagnetic flowmeter set between the lower tank and the mixer. Pump performance curves at pure water fluid are obtained when the compressor stopped.
Pump noise characteristics are also measured as they are used in washing machines, which means working for a drainage period. The valve between the upper tank and lower tank keeps close to simulate the drainage of the water inside the lower tank. Three microphones typed as PCB 14,043 (3.15 Hz~20 kHz frequency response, 146 dB maximum sound pressure level) located around the pump as a circle with 1 m to collect noise signal together with equipment and software of LMS test Lab platform (Leuven Measurement & System international, Leuven, The Kingdom of Belgium).
Two static pressure sensors with an accuracy of 0.25% were set at the pump inlet and outlet to calculate the pump head. Digital power meter with accuracy 0.4% were used to measure the hydraulic shaft power after dividing it by a constant motor efficiency coefficient. The pump head and efficiency also could be obtained following the procedure in ISO 9906: 2012 [29]. The biggest uncertainties of the measurement are ±1.8% error of pump head, ±5% error of pump efficiency, ±0.5% error of water flow rate, and ±0.5% of air void fraction calculated by instrument precision.

2.2. Experimental Results Analysis

2.2.1. Pump Performance

According to the Bernoulli equation, the parameters such as head, efficiency, IAVF, and density of the air–water mixer fluid are defined as follows.
H = p 2 p 1 ρ g + v 2 2 v 1 2 ρ g + ( z 2 z 1 )
η = ρ g H Q P e
I A V F = Q g Q g + Q l
ρ = ( 1 α ) ρ l + α ρ g
where the subscript g means air and l means water. Shaft power Pe is calculated by multiplication of the obtained motor current and voltage values and its constant efficiency value (namely 0.65).
According to the Euler formula, the radial type impeller could provide a constant head whatever the flow rate. Figure 3a shows the measured hydraulic performance curve of the washing machine drain pump under pure water. Inconsistent with theory, the head curve of the pump shows a linear degradation trend with a small slope when the flow rate increases. The head shows a maximum value of 2.3 times Hr when the pump is running at zero flow rate. The maximum flow rate that could supply enough head for draining is no more than 1.4 Qd. A maximum efficiency value of 22.4% concerns mostly the design flow rate vicinity. The above phenomenon can be explained in a way that the hydraulic loss in the inlet and outlet part of pumps increases with the increasing flow rate in actual flow conditions, which leads to the drop in the pump head. Figure 3b presents the pump head degradation results under initial flow rate as Qd and constant regulating valve position when the IAVF increases. The result shows that the pump can still work when IAVF maximum reaches 70%. However, the required head Hr cannot be supplied by the pump when the gas content is greater than 25%, which might result in reflux flow from the outlet pipe of the pump. As shown in Figure 3c are the pump head degradation results under three constant water flow rates wherein the pump head drops in all three conditions, but a small flow rate could reach a bigger IAVF because of the higher initial head. When the IAVF is greater than 15%, the slope of the head degradation curve under 0.8 Qd deteriorates rapidly, by 10% under 0.6 Qd and 7% under 0.4 Qd. This might refer to the gas entrained handing ability difference of the impeller under different initial flow conditions.

2.2.2. Radiated Noise of the Drain Pump at Different Measuring Points

Figure 4 shows the averaged radiated noise characteristic of the model pump during one cycle of operation. The horizontal axis corresponds to the running time of the drainage pump and the ordinate corresponds to the total sound pressure level of the model pump. The sound pressure level (SPL) can reflect the acoustic field characteristics in terms of sound pressure distribution, which is defined as:
S P L = 20 lg p p r e f
where p means sound pressure and pref equal to 10−5 Pa. During the noise test process, the valve between the upstream tank and lower tank is kept close in order to simulate the actual draining process of the drainage pump. The LMS noise acquisition module starts at the same time as the drainage pump is working. The results show that the radiated noise curve of model pump can be divided into three parts corresponding to the different running states of the washing machine, namely the starting period, normal draining period, and gas–liquid mixture transportation period (empty period). The motor starts, and the rotor produces significant noise at the beginning of start-up period. Then, the rotational speed of the pump gradually reaches the designed one, leading to normal flow rate working conditions and the SPL gradually reduces to a low level, about 38.5 dB(A). In this period, namely the normal drainage period, the pump transports pure water. As the water level inside the lower tank drops, some of the air draw into the drainage pump to form a gas-liquid two-phase flow state. The SPL of the pump increases sharply and reaches about 50 dB (A). Due to the performance deterioration of the pump during the empty discharge period, the head of the pump does not reach the required 0.8 m and the fluid in the outlet pipe is continuously returning to the impeller and generating fluid borne noise, thereby keeping the radiated noise of the pump at a higher level. The difference in the above sound pressure level is related to the pressure pulsation phenomenon corresponding to the specific flow state of the two-phase flow inside the pump passage.
In addition, Figure 5 shows the spectrum comparison in frequency between the normal drainage period and the empty discharge period. The ordinate represents the SPL amplitude and the abscissa is processed as a multiple of the shaft frequency (fn). For the normal drainage period and the empty discharge period, an expected discrete noise characteristic appears and the axial frequency and its multiple is the main frequency, which means the discrete noise is related to the motor rotational speed. For a two-phase flow state, the unsteady flow in the pump gives rise to the instability of the pump rotor, which in turn makes the discrete noise of the empty discharge period higher. Thus, we could conclude that SPL is bigger at the end of the drainage period because of gas-liquid two phase flow. This happens due to the unsteady flow inside the rotating part of the pump that causes the flow induced structure vibration and turns to radiated noise.

3. Numerical Simulation Study on the Inner Flow Behavior

Presented here is a very helpful tool to solve basic equations that model the flow movement by CFD, which give us more movement characteristics of the flow than experimental investigations [30,31]. In recent years, in order to provide detailed two-phase flow results in terms of flow structure, phase distribution and slippage, CFD has become increasingly important with the rapid development of computer technology, which can be used to obtain physical understanding of the noise generated by gas–liquid two phase flow.

3.1. The Eulerian–Eulerian Inhomogeneous Two-Phase Flow Modeling Method

The numerical calculation of the model pump flow field concerns pumps working under pure and air–water mixed flow conditions at different flow rates. Normally, multiphase flow models are subdivided into homogeneous and inhomogeneous kind. In the inhomogeneous model, both the velocity slip and the interphase mass and momentum transfer terms are solved. Each phase has its own fluid field and passes through the phase transfer unit. Because the homogeneous model does not consider any velocity slip between the two phases, this research adopts the inhomogeneous model regardless of the temperature field, for which the liquid phase is continuous and the gas phase is discrete. The particle model assumes that the gas–liquid two-phase flow pattern corresponds to a bubbly flow, meeting the principle of the mass and momentum conservation. Gas–liquid here always refer to air–water in the following.
t ( α k ρ k ) + ( α k ρ k w k ) = 0
t ( α k ρ k w k ) + ( α k ρ k w k w k ) = α k p k + ( α k μ k ( w k + ( w k ) T ) ) + M k + f k
where k is phase (l-liquid, g-gas); ρk is density of the k phase, kg/m3; pk is pressure of k phase, Pa; αk is the void fraction of k phase; μk is the dynamic viscosity of k phase, Pa·s; wk is the relative velocity of the k phase fluid, m/s; Mk is due to the interphase drag force; and fk refers to the added mass force related to the contribution of the impeller rotation.
For this two-phase flow approach, the liquid phase is considered the continuous phase using the renormalization group (RNG) k-ε turbulence model. Meanwhile, the gas phase is considered as the discrete phase using the zero-equation theoretical model, which means that the action between the two phases only considers the so-called interfacial drag coefficient through the following relations [32]:
M l = M g = 3 4 c D ρ l d B α g ( w g w l ) | w g w l |
with:
c D = { 24 R e ( 1 + 0.15 R e 0.687 ) ( R e 1000 ) 0.44 ( R e > 1000 )
and
R e = ρ l | w g w l | μ l d B
where dB is the diameter of the bubble and cD refers to the resistance coefficient.

3.2. Computational Domain, Meshing and Boundary Setting

The flow field computational domain includes the inlet chamber, impeller, pressure chamber, and filter chamber. ANSYS ICEM 14.0 was used to carry out this work. As shown in Figure 6, the impeller and the filter chamber are meshed with a hexahedron structure, which can better control the density of the grid boundary layer and ensure the orthogonality of the grid. Due to the complexity of the geometric models of the inlet chamber and the pressure chamber, unstructured meshes with better geometric adaptation are adopted. The resulting pump model that consisted of 2,377,605 elements in total (about 2.4 × 10⁶) was chosen for rotating and stationary domains after grid independence analysis. It can be seen from Figure 7 that when the number of meshes is greater than this value, the change in head coefficient of the model pump working under Qd is less than 1%.
Considering the requirements of the test, the inlet boundary conditions are set according to the pressure measured in the experiment, and the outlet boundary conditions are set as the mass flow rate. A certain amount of air phase is defined as initial bubble with a diameter of 0.2 mm which is equivalent to the experimental injector device. The liquid boundary adopts the non-slip solid wall condition, and the gas boundary adopts the free-slip solid wall condition. The smooth wall condition is used for the near-wall function. The time step was set as 5.56 × 10⁻⁵ s, corresponding to 1° impeller rotation for each step. The accuracy of convergence is set to 10−4. A total simulation time was set as 0.2 s in order to further process a data reduction of the unsteady flow field, corresponding to 10 impeller revolutions. The direction of impeller rotation is set as counterclockwise.
The previous experimental results show that the system cannot maintain a very constant flow rate of pure water when inject air at high flow rates. Pump performance deteriorates quickly, leading the drain pump to go into an empty discharge operation period when IAVF is bigger than 7%. Big radiated noise during the empty discharge period is caused by the mixing and impacting process from the outlet backflow to the impeller blade. Moreover, pre-research of the modeling method used in this calculation by Si et al. [33] suggests that it is more accurate for low IAVF. Therefore, simulation processes at selected flow rates smaller than 1.2 Qd and several conditions IAVF lower than 7% were carried out.

3.3. Simulation Results Analysis from CFD

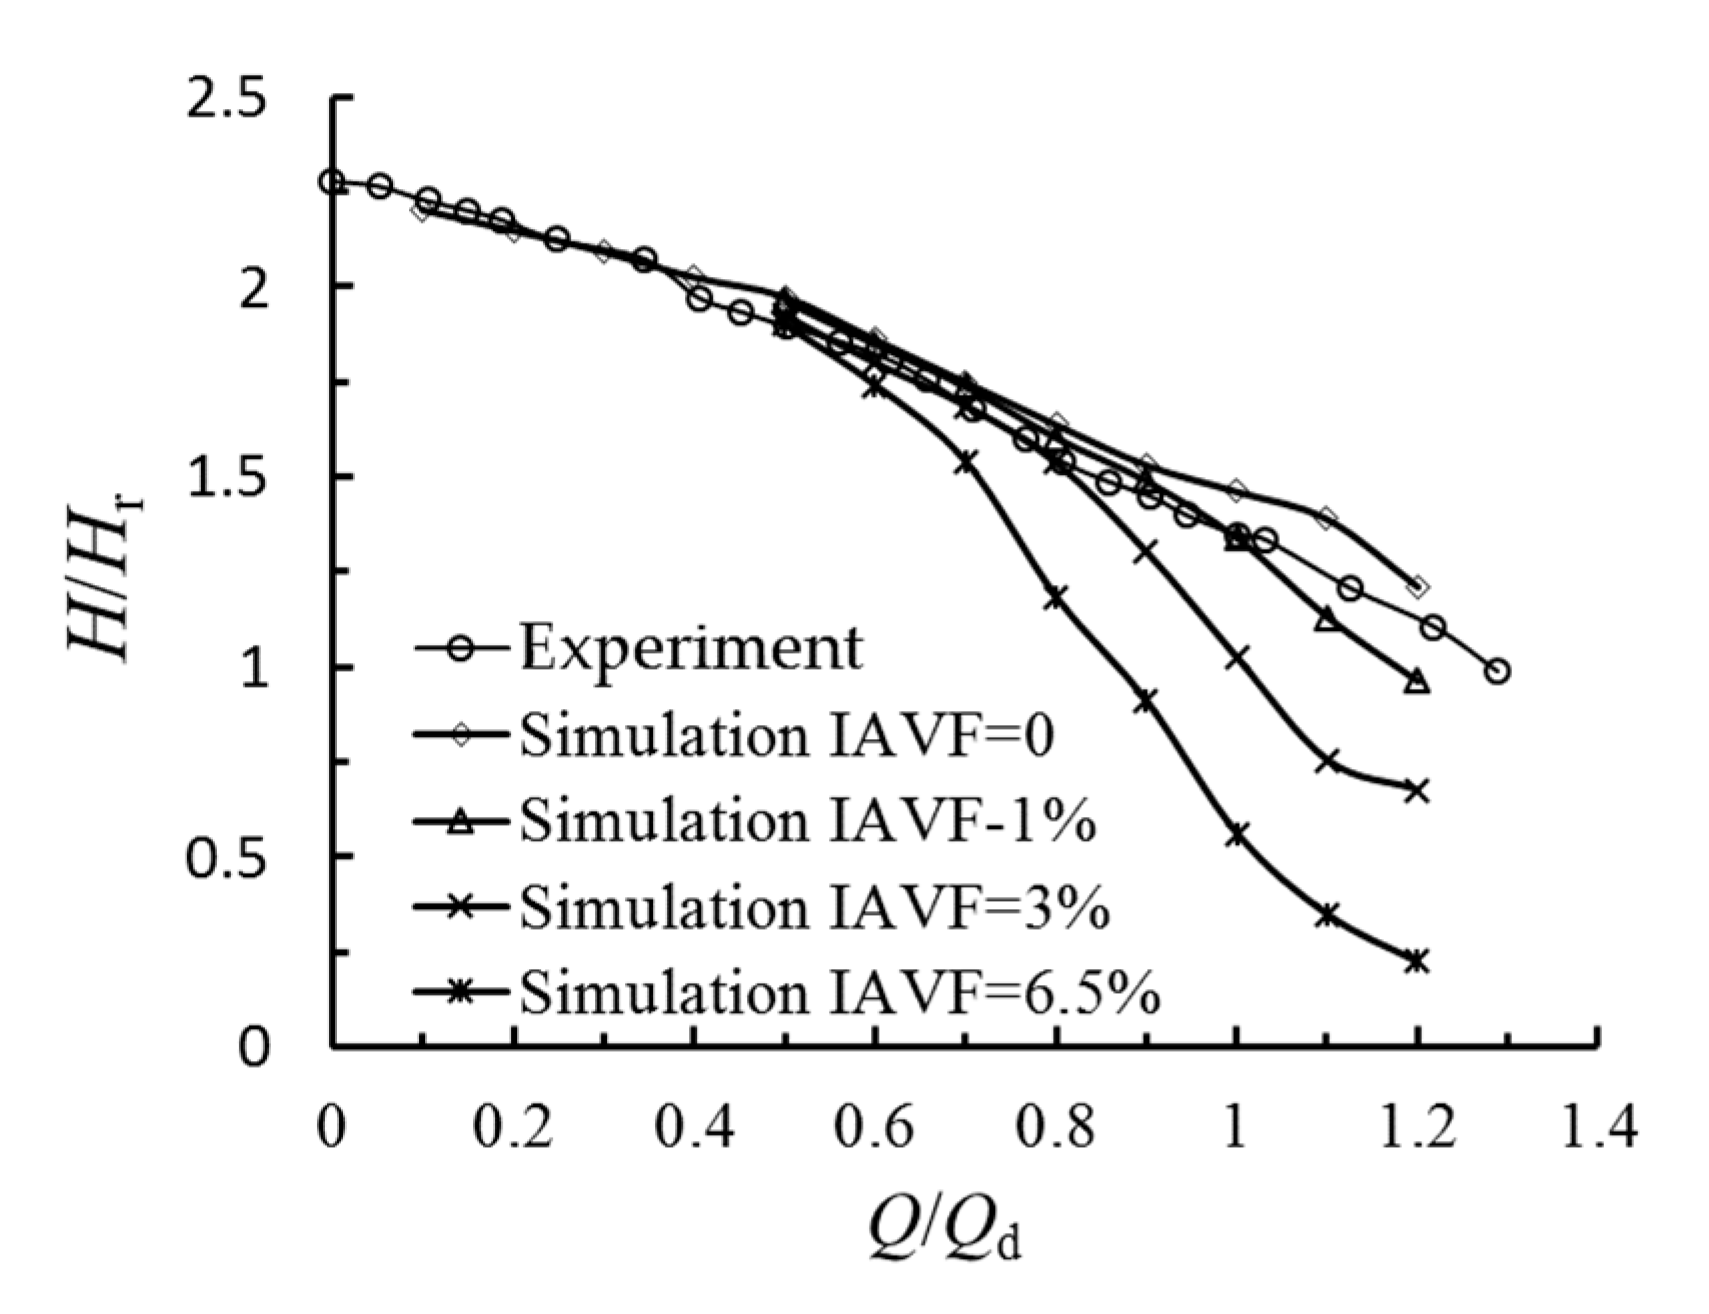
3.3.1. Pump Performance Degradation

A comparison between the experimental and the numerical results of the pump head ratio and efficiency under the pure water conditions are shown in Figure 8. Values of each point are obtained by the average of 360 timesteps from the unsteady calculation. It can be seen that the experimental results show the same trend as the simulation results in the range from 0.1 Qd to 1.2 Qd. Simulated head ratio of the model pump is almost identical to the test one when flow rate below 0.4 Qd. There is a certain difference with bigger values when the flow rate is above 0.4 Qd, which might be due to the smooth wall boundary setting. Deviation between them increases gradually with the increase of the flow rate. The relative error between the two works is below 5%, indicating that the results of simulation are credible. Simulated head ratios under eight flow rates and three different IAVFs are also presented in Figure 8. Here, the pump head ratio decreases faster as the flow rate increases at big IAVF. The pump head ratio has little change at small flow rates when the gas content is lower than 7%. This might occur because the radial type blades are conducive to transporting air bubbles into the cavity without causing blockage under a low flow rate.

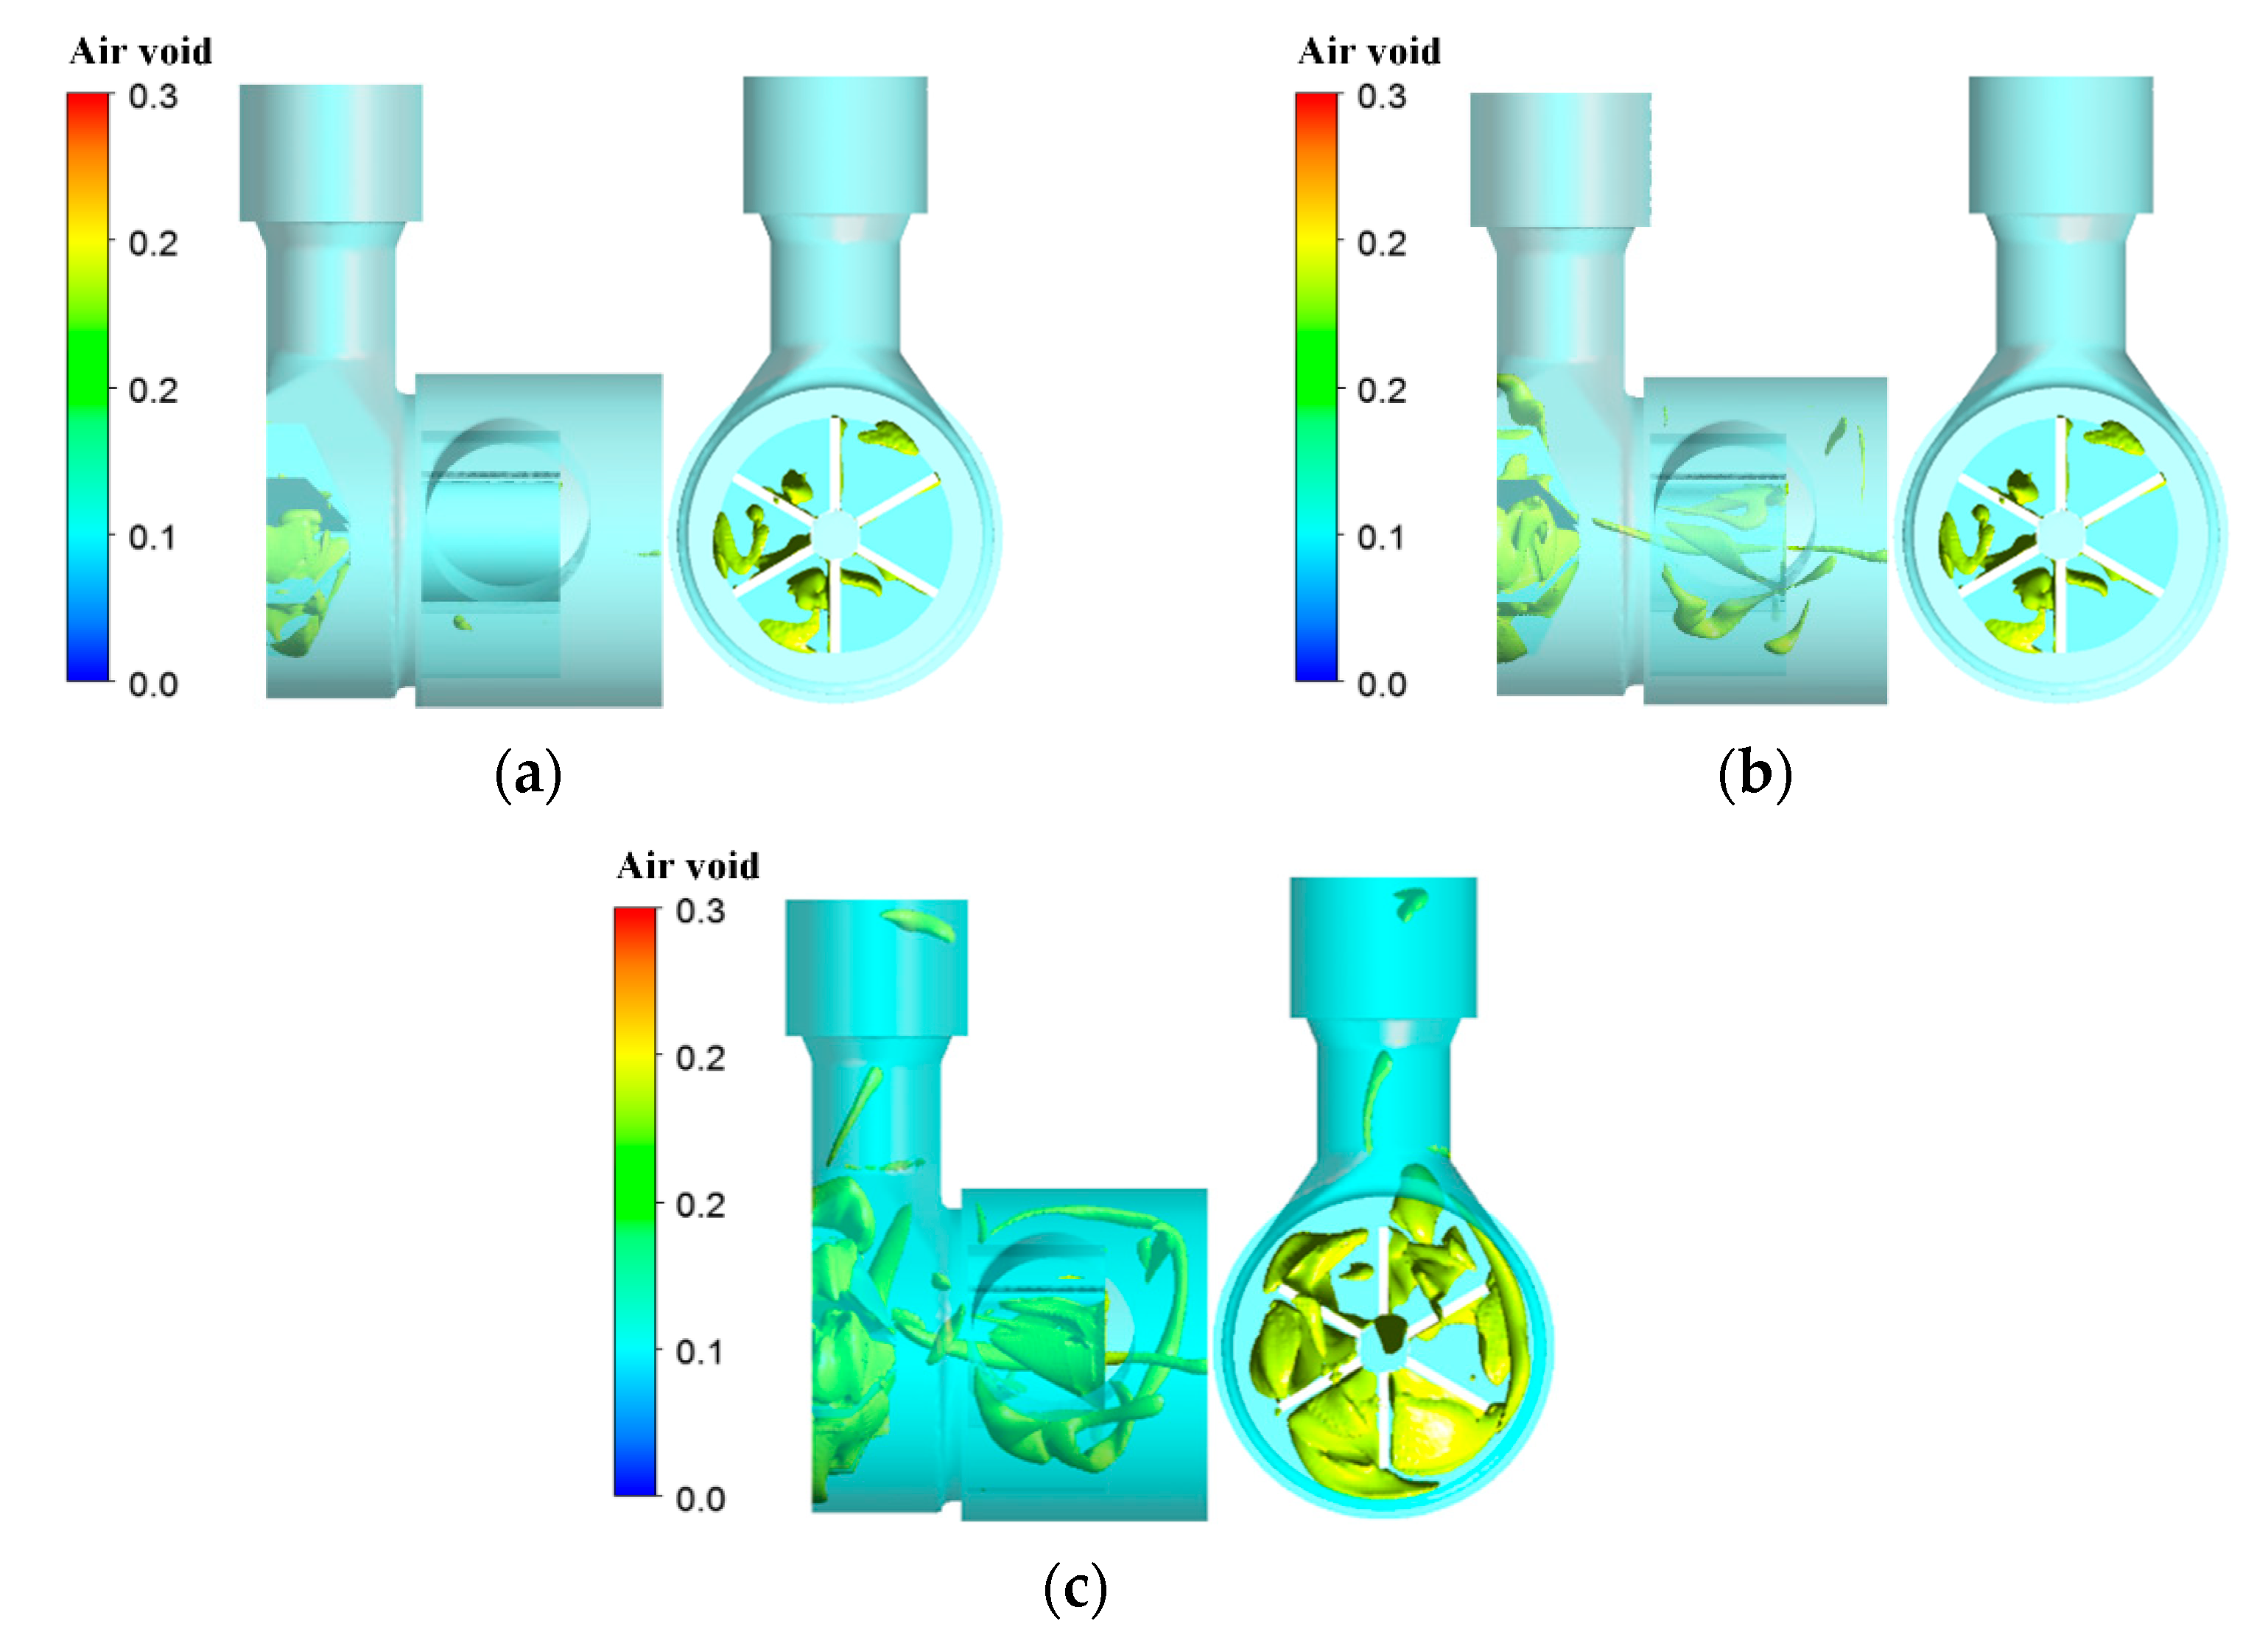
3.3.2. Two Phase Flow Behavior Analysis

Figure 9 shows the volume distribution of the air phase inside the pump flow passage under Qd at three different IAVF conditions. When the inlet gas content is low, the bubble volume is relatively small and mainly distributed near the suction surface of the impeller. With the increase of inlet gas content, the bubble near the suction surface of impeller will develop along the hub direction and radial direction of the impeller, and then block some part of the flow channel. When the IAVF reaches 6.5%, the impeller channel is partly blocked, which reduces the working capability of the model pump. The air pocket formed in the filter chamber occupies the upper half of the flow passage, which further deteriorate the impeller flow condition.
Figure 10 shows the air velocity distribution inside the impeller middle section under four different flow rates when IAVF equal to 6.5%. Seen from it, the flow rate has obvious effect on the air phase velocity, the larger the flow rate, the bigger the velocity. The air phase with high velocity mainly appears near the pressure side in the middle of the flow passage under small flow rate. And also, partly bubbles with high velocity separate from the tip of the impeller, which is related to the centrifugal force generated by the rotating impeller. As the flow rate increases, the area of air phase with high velocity becomes larger and moves to the middle of the flow passage and trailing edge position. Under 0.8 Qd, the distribution of air phase velocity streamline is quite disordered, and there are obvious swirls in some blade passage. With the increase of flow rate, the number of swirls increase, and the position of the vortex also has a corresponding deviation. The corresponding gas velocities are higher in the vortex region above, which indicates that the swirl motion in the flow has a great influence on gas accumulation as well as on its position, and then effects the working capability of the model pump.
Turbulent kinetic energy is used to describe the degree of turbulence pulsation, and it is often used to describe the viscous dissipation of fluid and the range of pulsation and diffusion. Figure 11 shows the distribution of the turbulent kinetic energy of the impeller in the model pump under the conditions of an inlet gas content of 6.5% and different flow rates. With the increase of flow rate, the turbulent kinetic energy in the impeller passage increases obviously, and the high turbulent kinetic energy region mainly appears near the impeller outlet. Under the design conditions, the turbulent kinetic energy of the flow is relatively uniform. On the other hand, under off-design conditions, the high turbulent kinetic energy is mainly concentrated in the gas accumulation area due to the decrease of fluid flow stability in the channel, which is caused by the gas accumulation, and then it leads to high energy loss, which reduces the working capability of the model pump.

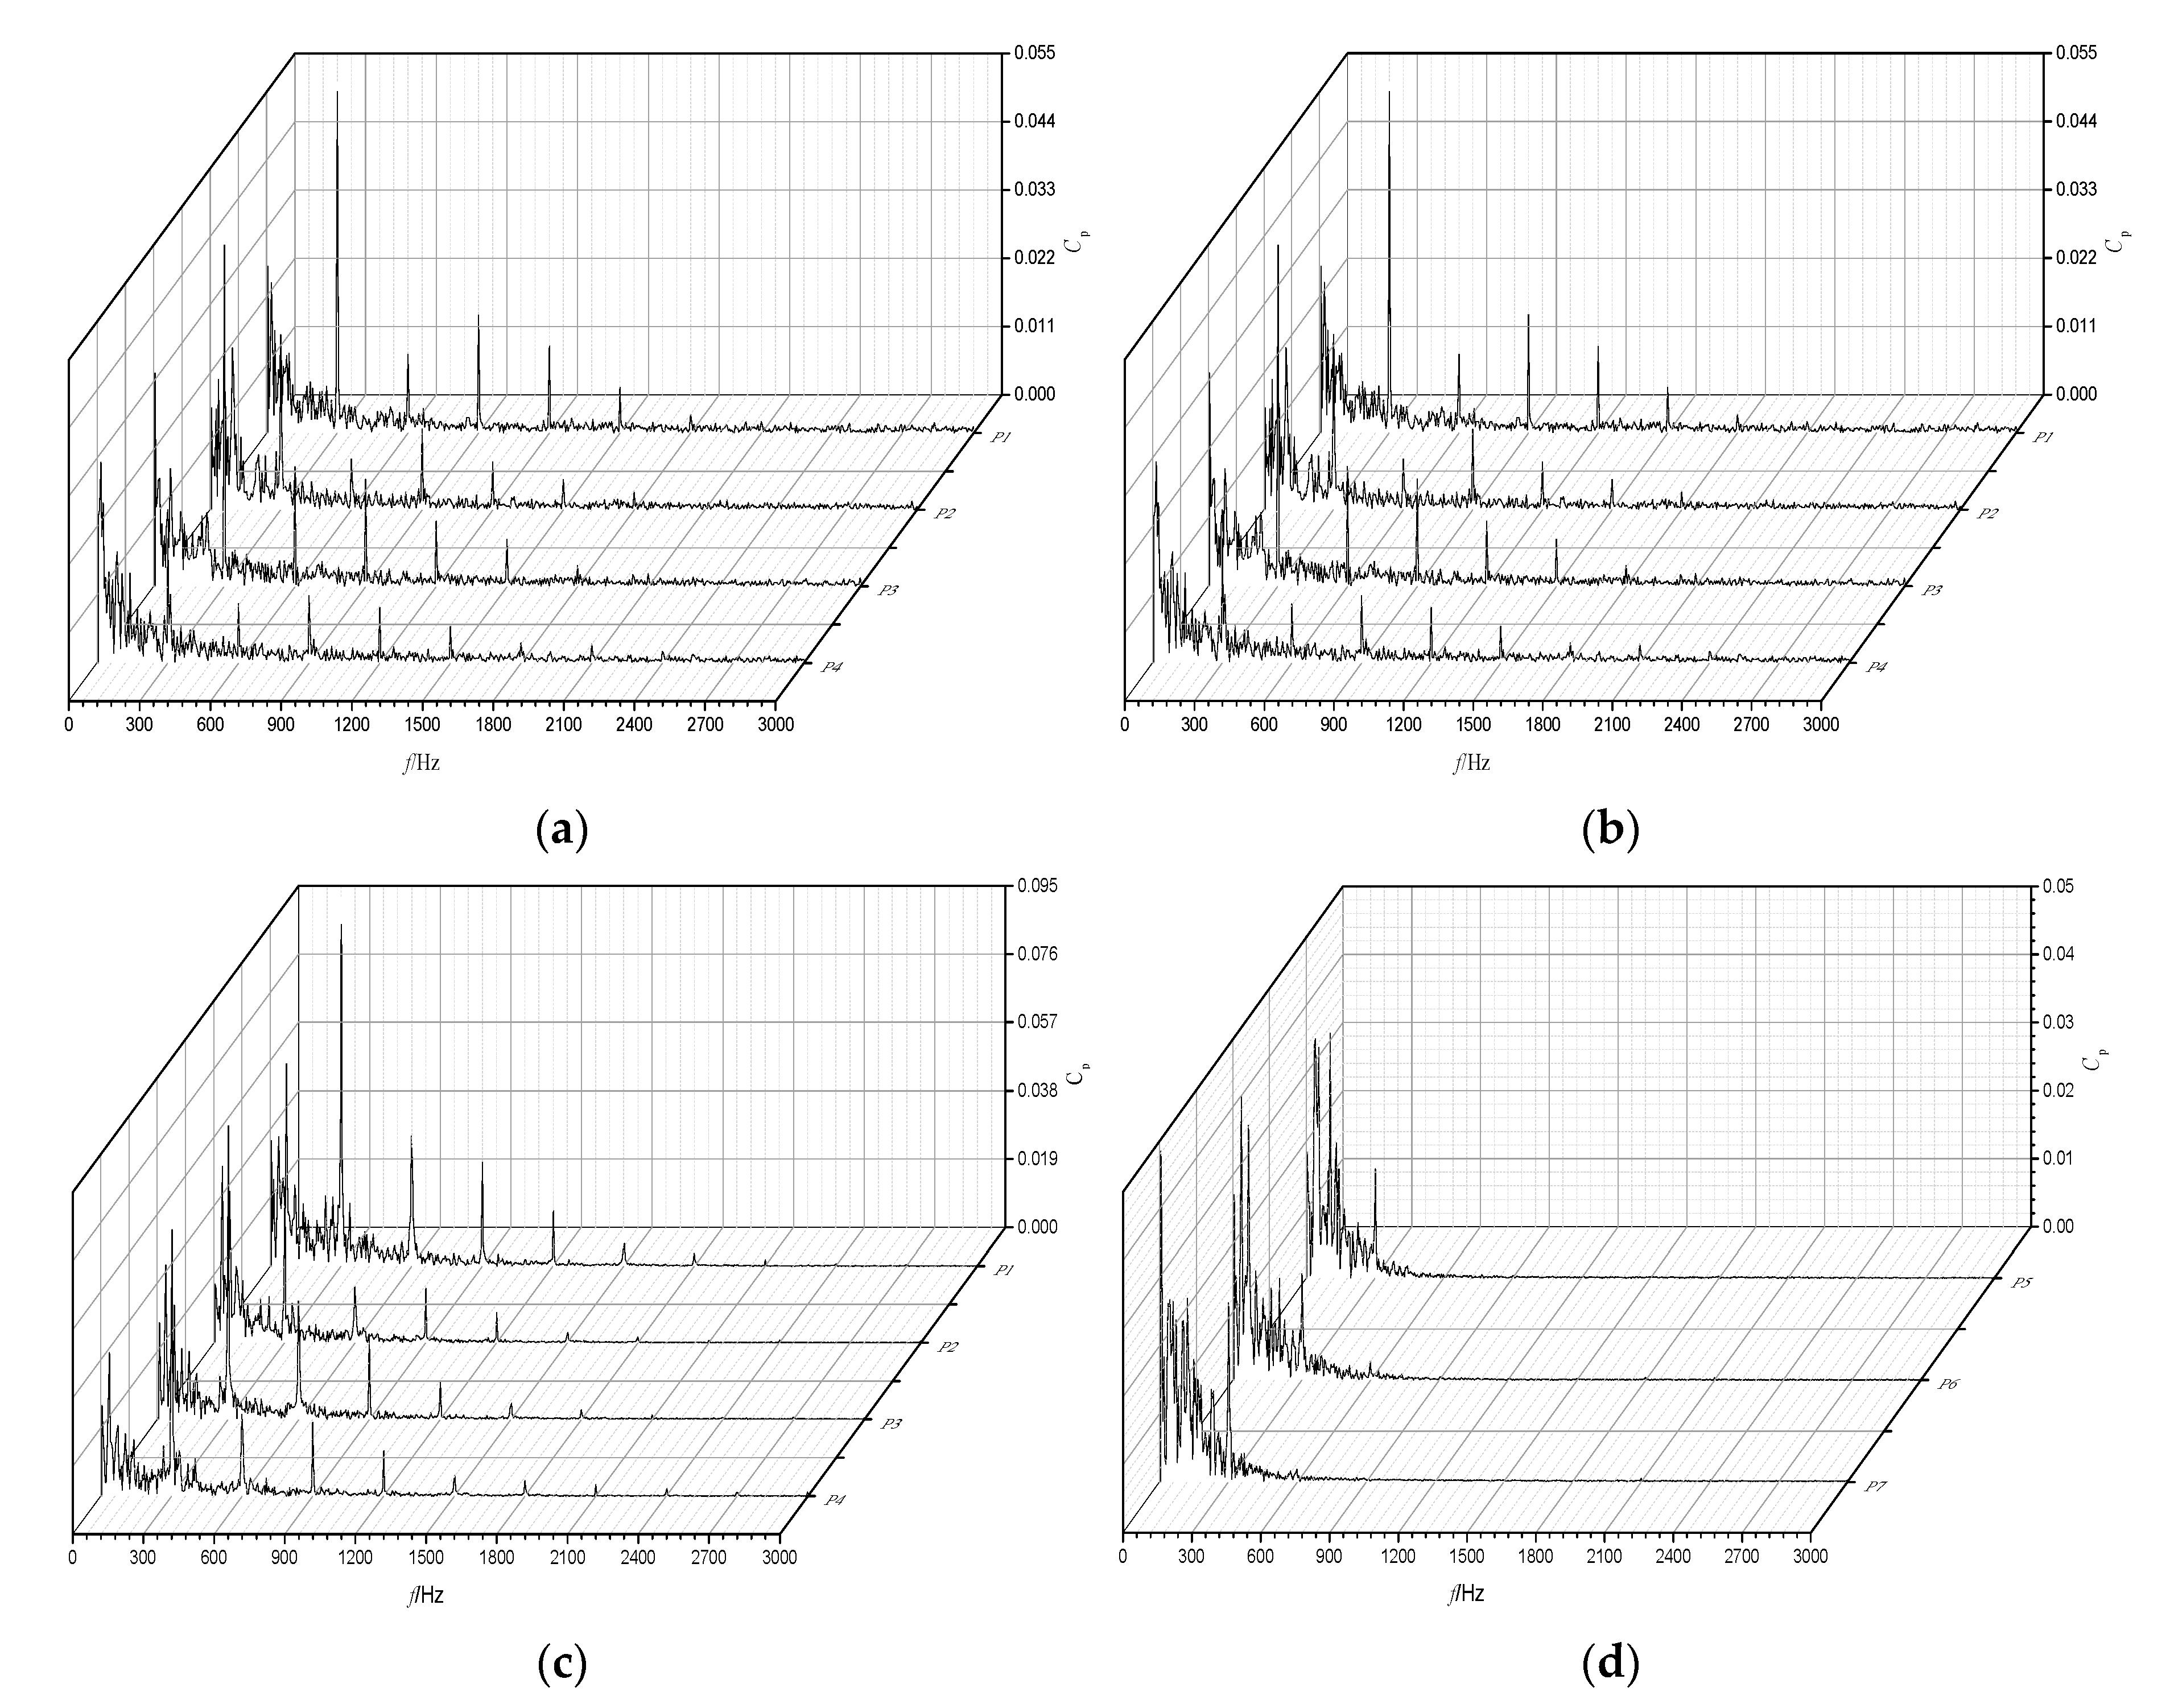
3.3.3. Analysis of Pressure Fluctuations

From the above turbulent kinetic energy (TKE) analysis, the void fraction of bubbles is closely related to the intensity of TKE. Future analysis on frequency domain are needed to express the flow behavior. The inner flow characteristics, including rotor–stator interaction, eddy current, and backflow, which is closely related to pump noise, induce a dynamic response of the pump in terms of pressure pulsation. Therefore, several monitoring points are set as shown in Figure 12 during the simulation. Among them, P1, P2, P3, and P4 are evenly distributed on the outlet of the impeller, whereas P5 is locate at the middle of outlet chamber, P6 and P7 are located near the volute tongue of the drainage pump. The pressure pulsation of each monitoring point is analyzed by fast Fourier transform (FFT) under Qd at IAVF equal to 0% and 6.5%.
In order to present this in a normalized form, a nondimensional pressure coefficient CP* expressed as follows is introduced.
C P * = ( P P ¯ ) 0.5 ρ u 2 2
where P is the static pressure of the monitoring points, P ¯ is the average of the static pressure, ρ is the fluid density, and u2 is the circumferential velocity component at the impeller outlet.
Figure 13 is the frequency representation of the pressure pulsation spectrum. The results shown in Figure 13a,b indicate that the amplitude of pressure pulsation is larger in the low frequency region (below 300 Hz) and it is mainly caused by the flow separation, backflow, and turbulence inside the pump flow passage under pure water conditions. No matter whether the inlet is pure water or gas–liquid two-phase flow, there are obvious discrete frequencies in the impeller outlet region, which are 300 Hz and frequency multiplier. From Figure 13c,d, the peak value of the frequency multiplier decreases faster than that of blade frequency, which indicates that the gas–liquid two-phase flow does not affect the characteristic frequency of pressure pulsation. Compared with pure water, the amplitude of pressure pulsation increases obviously, which indicates that the existence of bubble makes the flow instability of impeller outlet increase. Close to the tongue area of the volute, the pressure pulsation intensity in the low frequency region of the two-phase flow is obviously higher than that in the pure water conditions, inducing greater noise.

4. Radiated Noise Simulation

In an air–water two phase flow situation, the complex flow behavior is expressed as pressure pulsation with big intense generation of strong hydraulic excitation which in turn causes radiated noise problems. Hence, the relationship between hydraulics and radiated noise of the pump running at the above conditions must be well understood. A numerical simulation of the model pump working under Qd and air–water two phase flow are presented to provide detailed information.

4.1. Computational Acoustic Theory and Method

A hybrid numerical method mentioned by Gao et al. [34] is proposed to describe the flow-induced noise generation and dissemination based on Lighthill acoustic analogy theory, which subdivides the computational process into computational fluid dynamics (CFD) and computational acoustics (CA). The CFD process calculates the characteristics of the sound source and puts out the flow field behavior such as velocity, density, and pressure for acoustic simulation. Acoustic analogies are derived from the Navier–Stokes equations, which govern both the flow field and corresponding acoustic filed. It can be transformed into a Lighthill function, which is expressed as:
Ω ( 2 t 2 ( ρ ρ 0 ) δ ρ + c 0 2 x i ( ρ ρ 0 ) ( δ ρ ) x i ) d x = Ω T i j x j ( δ ρ ) x i d x + Γ i j x j n i δ ρ d Γ ( x )
The first part of the right term is the volume source, and the second part is the surface source. In the acoustic simulation, the solution of the Navier-Stokes equation firstly assumes the water as incompressible to calculate the flow-induced acoustic source. Then, the compressibility of the water is to be considered to solve the acoustic wave propagation. Combined with acoustic wave equation, the final frequency response of the radiated noise could be calculated.
During the noise simulation procedure, the unsteady simulation of the pump flow field was re-obtained using the detached eddy simulation (DES) method, a modification of a RANS (Reynolds Average Navier-Stokes) model in which switches to a sub-grid scale formulation in regions fine enough for large eddy simulation [35]. The detailed flow information, such as flow velocity, pressure, density, etc., under two phase flow conditions, are extracted and transformed as the sound source in the acoustic simulation. Meanwhile, the acoustic calculation domains were built and the acoustic meshes were generated containing an interface setting. Finally, the radiated noise calculation was completed by the acoustic finite element method using Actran12.0 software. The flow chart of the acoustic simulation work is shown in Figure 14.

4.2. Computational Domain, Mesh Generation and Boundary Condition of the Acoustic

The computational domain for the acoustic simulation includes the structural domain and air-borne domain, as shown in Figure 15. Unstructured mesh, which has better adaptability to the geometry, is applied in the acoustic simulation. To guarantee the precision of the acoustic computation, the maximum mesh size should meet the Equation (13). The data transmission of the interface between the structural domain and the air-borne domain is accomplished with the integral interpolation method. Also shown in Figure 15, the maximum mesh size of the structural domain is 0.0002 m and air-borne domain is 0.0006 m in this study. The inner surface between the structural domain and flow field domain is loaded with information of the unsteady flow to yield the sound source in the subsequent simulation, and the definition of the radiated air-borne sound domain is set to get the distribution of the radiated noise in the subsequent simulation.
L max < c 6 f max
The material properties of the structure domain are shown in Table 2. Considering the total time of the unsteady CFD simulation and the time step, the frequency range of the acoustic simulation is set from 0–3000 Hz and the resolution is set as 1 Hz.

4.3. Acoustic Field Results

In order to analyze the properties of the radiated noise, 60 monitor points are mounted equally in the mid-span surface of the pump casing surface with a radius equal to 1 m. The SPL of the monitoring points set in the sound field is obtained by using the ACTRAN PLTViewer module, and the frequency response spectrum results are shown in Figure 16.
The radiation noise under pure water, as can be seen in the above figure, contains certain discrete frequency amplitude. Confirmed with the pressure pulsation analysis above, it is known that this discrete frequency is caused by the rotor stator interaction between the impeller and the water chamber. Compared with the discrete noise under the pure water condition, the two-phase flow condition with IAVF of 6.5% present a higher level in the entire frequency domain, which is consistent with the experimental results. In addition, in the two-phase flow condition, the discrete frequency of the radiated noise is no longer obvious, which is consistent with the pressure pulsation analysis above.
Figure 17 shows the corresponding cloud image of the radiation noise at blade passing frequency (300 Hz) in pure water and IAVF equal to 6.5% condition. The left column with “map pressure” means SPL distribution. The scale represents the magnitude of the SPL values. In Figure 17a, the SPL near the wall of the shell is the largest, and the noise gradually decreases with the increase of the radius. The distribution of noise sound pressure levels across both the section of the impeller and the axial section exhibit dipole characteristics, which are related to the dynamic and static interference phenomena in the model pump. Among them, the light blue band region can be regarded as a dipole axis, and the dipole axis normal region has the highest sound pressure level. The larger radiated sound pressure is mainly in the vicinity of the model pump outlet and the model pump chamber. Compared with Figure 17a, the SPL of the pump noise working under an air–water two-phase flow condition increases significantly as shown in Figure 17b, and the dipole characteristics are no longer obvious. This phenomenon indicates that the interaction between the air–water two-phase flow and the model pump casing is intensified, the excitation force of the pump casing is obviously increased, and the dipole source is no longer the main source of radiated noise. Under two-phase flow conditions, the bubble volume inside the pump passage changes with time, which occurs owing to the influence of the monopole.

5. Conclusions

The study presents an experimental and numerical study on gas–liquid two-phase flow behavior and flow induced noise characteristics of radial blade pumps. Three-dimensional numerical calculations based on the Euler–Euler inhomogeneous model and obtained experimental boundaries are carried out under different inlet air void fraction (IAVF). A hybrid numerical method is proposed to obtain the flow-induced emitted noise characteristics. The following results have been obtained:
(1) Under small flow rate conditions, the change of inlet gas content has a little effect on the head characteristics of drainage pump. When the IAVF is 1%, the influence of gas phase on the head characteristics of the drainage pump is small. With the increase of IAVF, the slope of the flow-head descending curve of the pump becomes larger. The influence of gas void on pump performance gradually increases with an increase of flow rate. When IAVF reaches 6.5%, the head curve decreases obviously at all flow rates.
(2) The sound pressure level is bigger at the end of drainage period (empty discharge period) because of air-water two phase flow. The flow induced structure vibration and noise is due to the unsteady flow inside the rotating part of the pump. Further, under two-phase flow conditions, the unsteady flow in the pump gives rise to the instability of the pump rotor, which in turn makes the discrete noise of the empty discharge period higher.
(3) As the IAVF increases at different flow rate conditions, the bubble adheres to the impeller hub and the backside of the blade, and develops around it. In addition, the formation of vapor pockets is easy in the inlet chamber, which could reduce the working capability of the drainage pump. When the IAVF is 6.5%, the air velocity increases with an increase of the flow rate. At small flow rates, flow separation will occur, and when the flow rate is 80% of the nominal value, an obvious vortex appears in the impeller flow channel.
(4) The air–water two-phase flow has a little effect on the characteristic frequency distribution of both the impeller outlet pressure pulsation and radiated noise SPL. However, the corresponding pulsation intensity and SPL values will increase with an increase in IAVF, which indicates that the existence of bubbles increases the instability of the impeller outlet flow. Thus, the influence of flow state should be taken into account in the hydraulic optimization of drainage pump impellers.

Author Contributions

Q.S. and C.W. conceived and designed the experiments; C.S. and R.C. performed the experiments and simulation; A.A. and Q.S. analyzed the data; Q.S. wrote the paper; J.Y. provided funding acquisition.

Funding

This research was funded by National Key Research and Development Program of China (2018YFB0606103), National Natural Foundation of China (51976079, 51779107), Training Project for Young Core Teacher of Jiangsu University and Senior Talent Foundation of Jiangsu University (15JDG048), China Postdoctoral Science Foundation (2019M661745) and Open Foundation of National Research Center of Pumps, Jiangsu University (NRCP201604).

Conflicts of Interest

The authors declare no conflict of interest.

Nomenclature

IAVFinlet air void fraction
bimpeller blade width
ddiameter of bubble
Ddiameter
Hpump head
Mshaft torque
nrotational speed
plocal static pressure
Pshaft power
Qvolume water flow rate
Rradius
SPLsound pressure level
vvelocity
zheight level
Zimpeller blade number
Greek Symbols
αlocal gas void fraction
ηglobal efficiency of the pump
ρdensity of fluid mixture
ωangular velocity
δblade thickness
Subscripts
Bbubble
ddesign condition
ggas
lliquid
rrequired
1inlet of the impeller
2outlet of the impeller
3inlet of the volute
4outlet of the pump

References

  1. Wang, C.; Hu, B.; Zhu, Y.; Wang, X.; Luo, C.; Cheng, L. Numerical Study on the Gas-Water Two-Phase Flow in the Self-Priming Process of Self-Priming Centrifugal Pump. Processes 2019, 7, 330. [Google Scholar] [CrossRef] [Green Version]
  2. He, X.K.; Jiao, W.X.; Wang, C.; Cao, W.D. Influence of Surface Roughness on the Pump Performance Based on Computational Fluid Dynamics. IEEE Access 2019, 7, 105331–105341. [Google Scholar] [CrossRef]
  3. Wang, C.; He, X.K.; Shi, W.D.; Wang, X.K.; Wang, X.L.; Qiu, N. Numerical study on pressure fluctuation of a multistage centrifugal pump based on whole flow field. AIP Adv. 2019, 9, 035118. [Google Scholar] [CrossRef] [Green Version]
  4. Zhang, J.; Xia, S.; Ye, S.; Xu, B.; Song, W.; Zhu, S.; Xiang, J. Experimental investigation on the noise reduction of an axial piston pump using free-layer damping material treatment. Appl. Acoust. 2018, 139, 1–7. [Google Scholar] [CrossRef]
  5. Ye, S.G.; Zhang, J.H.; Xu, B.; Zhu, S.Q.; Xiang, J.; Tang, H. Theoretical investigation of the contributions of the excitation forces to the vibration of an axial piston pump. Mech. Syst. Signal Process. 2019, 129, 201–217. [Google Scholar] [CrossRef]
  6. Kaigala, G.V.; Hoang, V.N.; Stickel, A.; Lauzon, J.; Manage, D.; Pilarski, L.M.; Backhouse, C.J. An inexpensive and portable microchip-based platform for integrated RT–PCR and capillary electrophoresis. Analyst 2008, 133, 331–338. [Google Scholar] [CrossRef] [PubMed]
  7. Yu, S.C.; Ng, B.T.; Chan, W.K.; Chua, L.P. The flow patterns within the impeller passages of a centrifugal blood pump model. Med. Eng. Phys. 2000, 22, 381–393. [Google Scholar] [CrossRef]
  8. Orue, R. Drain Pump for Home Appliances. U.S. Patent 2007/0071617 A1, 29 March 2007. [Google Scholar]
  9. Marioni, E.; Cavalcante, V. Centrifugal Pump for Electric Household Appliances such as Washing Machines, Dishwashers and the Like. U.S. Patent 4861240 A, 29 August 1989. [Google Scholar]
  10. Luo, X.W.; Nishi, M.; Yoshida, K.; Dohzono, H.; Miura, K. Cavitation Performance of a Centrifugal Impeller Suitable for a Mini Turbo-Pump. In Proceedings of the Fifth International Symposium on Cavitation, Osaka, Japan, 1–4 November 2003. [Google Scholar]
  11. Zhuang, B.; Luo, X.; Zhang, Y.; Wang, X.; Xu, H.; Nishi, M. Design optimization for a shaft-less double suction mini turbo pump. IOP Conf. Ser. Earth Environ. Sci. 2010, 12, 012049. [Google Scholar] [CrossRef] [Green Version]
  12. Jiang, Q.F.; Heng, Y.G.; Liu, X.B.; Zhang, W.B.; Bois, G.; Si, Q.R. A review on design considerations of centrifugal pump capability for handling inlet gas-liquid two-phase flows. Energies 2019, 12, 1078. [Google Scholar] [CrossRef] [Green Version]
  13. Jang, J.H.; Lim, D.B. Washing Machine Having a Drain Pump to Reduce Vibration. U.S. Patent 7966848 B2, 28 June 2011. [Google Scholar]
  14. Murakami, M.; Minemura, K. Effects of Entrained Air on the Performance of a Centrifugal Pump: 1st Report, Performance and Flow Conditions. Bull. JSME 1974, 17, 1047–1055. [Google Scholar] [CrossRef]
  15. Murakami, M.; Minemura, K. Effects of Entrained Air on the Performance of Centrifugal Pumps: 2nd Report, Effects of Number of Blades. Bull. JSME 1974, 17, 1286–1295. [Google Scholar] [CrossRef] [Green Version]
  16. Pessoa, R.; Prado, M. Two-Phase Flow Performance for Electrical Submersible Pump Stages. SPE Prod. Facil. 2003, 18, 13–27. [Google Scholar] [CrossRef]
  17. Serena, A.; Bakken, L.E. Design of a Multiphase Pump Test Laboratory Allowing to Perform Flow Visualization and Instability Analysis. In Proceedings of the ASME 2015 Power Conference, San Diego, CA, USA, 28 June–2 July 2015. [Google Scholar]
  18. Schäfer, T.; Bieberle, A.; Neumann, M.; Hampel, U. Application of gamma-ray computed tomography for the analysis of gas holdup distributions in centrifugal pumps. Flow Meas. Instrum. 2015, 46, 262–267. [Google Scholar] [CrossRef]
  19. Verde, W.M.; Biazussi, J.L.; Sassim, N.A.; Bannwart, A.C. Experimental study of gas-liquid two-phase flow patterns within centrifugal pumps impellers. Exp. Therm. Fluid Sci. 2017, 85, 37–51. [Google Scholar] [CrossRef]
  20. Wang, C.; Shi, W.D.; Wang, X.K.; Jiang, X.P.; Yang, Y.; Li, W.; Zhou, L. Optimal design of multistage centrifugal pump based on the combined energy loss model and computational fluid dynamics. Appl. Energy 2017, 187, 10–26. [Google Scholar] [CrossRef]
  21. Wang, C.; He, X.K.; Zhang, D.S.; Hu, B.; Shi, W.D. Numerical and experimental study of the self-priming process of a multistage self-priming centrifugal pump. Int. J. Energy Res. 2019, 43, 4074–4092. [Google Scholar] [CrossRef]
  22. Qian, J.Y.; Chen, M.R.; Liu, X.L.; Jin, Z.J. A numerical investigation of the flow of nanofluids through a micro Tesla valve. J. Zhejiang Univ. Sci. A 2019, 20, 50–60. [Google Scholar] [CrossRef]
  23. Qian, J.-Y.; Gao, Z.-X.; Liu, B.-Z.; Jin, Z.-J. Parametric Study on Fluid Dynamics of Pilot-Control Angle Globe Valve. J. Fluids Eng. 2018, 140, 111103. [Google Scholar] [CrossRef]
  24. Zhu, Y.; Tang, S.; Wang, C.; Jiang, W.; Yuan, X.; Lei, Y. Bifurcation Characteristic Research on the Load Vertical Vibration of a Hydraulic Automatic Gauge Control System. Processes 2019, 7, 718. [Google Scholar] [CrossRef] [Green Version]
  25. Zhu, Y.; Tang, S.; Quan, L.; Jiang, W.; Zhou, L. Extraction method for signal effective component based on extreme-point symmetric mode decomposition and Kullback-Leibler divergence. J. Braz. Soc. Mech. Sci. Eng. 2019, 41, 100. [Google Scholar] [CrossRef]
  26. Zhu, J.; Zhang, H.-Q. Numerical Study on Electrical Submersible Pump Two-Phase Performance and Bubble-Size Modeling. SPE Prod. Oper. 2017, 32, 267–278. [Google Scholar] [CrossRef]
  27. Si, Q.R.; Bois, G.; Jiang, Q.F.; He, W.T.; Ali, A.; Yuan, S.Q. Investigation on the Handling Ability of Centrifugal Pump Under Air-Water Two-Phase Inflow: Model and Experimental Validation. Energies 2018, 11, 3048. [Google Scholar] [CrossRef] [Green Version]
  28. Si, Q.R.; Asad, A.; Yuan, J.P.; Ibra, F.; Yasin, M.F. Flow-Induced Noises in a Centrifugal Pump: A Review. Sci. Adv. Mater. 2019, 11, 909–924. [Google Scholar] [CrossRef]
  29. International Organization for Standardization (ISO). ISO 9906: 2012 Rotodynamic Pumps-Hydraulic Performance Acceptance Tests—Grades 1, 2 and 3; ISO: Geneva, Switzerland, 2012. [Google Scholar]
  30. Wang, C.; Chen, X.X.; Qiu, N.; Zhu, Y.; Shi, W.D. Numerical and experimental study on the pressure fluctuation, vibration, and noise of multistage pump with radial diffuser. J. Braz. Soc. Mech. Sci. Eng. 2018, 40, 481. [Google Scholar] [CrossRef]
  31. Jiao, W.X.; Cheng, L.; Zhang, D.; Zhang, B.W.; Su, Y.P.; Wang, C. Optimal Design of Inlet Passage for Waterjet Propulsion System Based on Flow and Geometric Parameters. Adv. Mater. Sci. Eng. 2019, 2019, 2320981. [Google Scholar] [CrossRef] [Green Version]
  32. Clift, R.; Grace, J.R.; Weber, M.E. Bubbles, Drops and Particles; Academic Press: New York, NY, USA, 1978. [Google Scholar]
  33. Si, Q.R.; He, W.T.; Cui, Q.L.; Bois, G.; Yuan, S.Q. Experimental and numerical studies on inner flow characteristics of centrifugal pump under air-water inflow. Int. J. Fluid Mach. Syst. 2019, 12, 31–38. [Google Scholar]
  34. Gao, M.; Dong, P.X.; Lei, S.H.; Turan, A. Computational Study of the Noise Radiation in a Centrifugal Pump When Flow Rate Changes. Energies 2017, 10, 221. [Google Scholar] [CrossRef] [Green Version]
  35. Si, Q.; Wang, B.; Yuan, J.; Huang, K.; Lin, G.; Wang, C. Numerical and Experimental Investigation on Radiated Noise Characteristics of the Multistage Centrifugal Pump. Processes 2019, 7, 793. [Google Scholar] [CrossRef] [Green Version]
Figure 1. Selected pump model. (a) Working scenario of the pump; (b) Impeller; (c) Casing.
Processes 07 00920 g001
Figure 2. Experiment system list as: (a) Test rig; (b) semi-anechoic chamber; (c) Data acquisition system.
Processes 07 00920 g002
Figure 3. Pump performance characteristics curve under list condition: (a) IAVF = 0; (b) Initial flow rate as Qd and Valve position kept constant; (c) Water flow rate kept constant.
Processes 07 00920 g003
Figure 4. The SPL of radiated noise of the pump.
Processes 07 00920 g004
Figure 5. Frequency responses of the two working periods.
Processes 07 00920 g005
Figure 6. Meshing results of the computational domain.
Processes 07 00920 g006
Figure 7. Grid independence analysis with pure water under Qd.
Processes 07 00920 g007
Figure 8. Numerical pump performance.
Processes 07 00920 g008
Figure 9. Air phase distribution at different IAVF under Qd: (a) 1%; (b) 3%; (c) 6.5%.
Processes 07 00920 g009
Figure 10. Air phase velocity distribution under different flow rates when IAVF = 6.5%: (a) 0.6 Qd; (b) 0.8 Qd; (c) Qd; (d) 1.2 Qd.
Processes 07 00920 g010
Figure 11. Turbulent kinetic energy distribution under different flow rates when IAVF = 6.5%: (a) 0.6 Qd; (b) 0.8 Qd; (c) Qd; (d) 1.2 Qd.
Processes 07 00920 g011
Figure 12. Location of monitoring points.
Processes 07 00920 g012
Figure 13. Spectrum of pressure fluctuation in the model pump: (a) P1-P4, IAVF = 0; (b) P5-P7, IAVF = 6.5%; (c) P1-P4, IAVF = 0; (d) P5-P7, IAVF = 6.5%.
Processes 07 00920 g013
Figure 14. The flow chart of the radiated noise calculation of the multi-stage centrifugal pump.
Processes 07 00920 g014
Figure 15. The mesh for sound field calculation: (a) Structural domain; (b) Air-borne domain.
Processes 07 00920 g015
Figure 16. Frequency response of the radiated noise at monitoring point of the sound field.
Processes 07 00920 g016
Figure 17. The SPL contour at blade passing frequency: (a) IAVF = 0; (b) IAVF = 6.5%.
Processes 07 00920 g017aProcesses 07 00920 g017b
Table 1. Design parameters of the model pump.
ParametersValuesParametersValues
Design Flow rate Qd1.08 m3/hBlade thickness δ 1.5 mm
Head Hd1.2 mBlades number Z6
Rotating speed n3000 r/minSpecific speed ns68
Impeller outlet diameter D237 mmVolute base circle diameter D350 mm
Blade outlet width b26.25 mmDiameter of outlet pipe D430 mm
Table 2. Material properties of the structure domain.
MaterialDensity/(kg/m3)Young’s Modulus/GPaPoisson’s Ratio
PP9100.8960.4103

