Article

Model Study on Burden Distribution in COREX Melter Gasifier

1
Key Laboratory for Ecological Metallurgy of Multi-metallic Mineral (Ministry of Education), Northeastern University, Shenyang 110819, Liaoning, China
2
State Key Laboratory of Rolling and Automation, Northeastern University, Shenyang 110819, Liaoning, China
3
School of Metallurgy, Northeastern University, Shenyang 110819, Liaoning, China
*
Authors to whom correspondence should be addressed.
Processes 2019, 7(12), 892; https://doi.org/10.3390/pr7120892
Submission received: 21 October 2019 / Revised: 22 November 2019 / Accepted: 26 November 2019 / Published: 1 December 2019
(This article belongs to the Special Issue Process Modeling in Pyrometallurgical Engineering)

Abstract

:
COREX is one of the commercialized smelting reduction ironmaking processes. It mainly includes two reactors, i.e., a (reduction) shaft furnace (SF) and a melter gasifier (MG). In comparison with the conventional blast furnace (BF), the COREX MG is not only equipped with a more complicated top charging system consisting of one gimbal distributor for coal and eight flap distributors for direct reduction iron (DRI), but also the growth mechanism of its burden pile is in a developing phase, rather than that in a fully-developed phase in a BF. Since the distribution of charged burden plays a crucial role in determining the gas flow and thus in achieving a stable operation, it is of considerable importance to investigate the burden distribution influenced by the charging system of COREX MG. In the present work, a mathematical model is developed for predicting the burden distribution in terms of burden layer structure and radial ore/coal ratio within the COREX MG. Based on the burden pile width measured in the previous physical experiments at different ring radii on a horizontal flat surface, a new growth mechanism of burden pile is proposed. The validity of the model is demonstrated by comparing the simulated burden layer structure with the corresponding results obtained by physical experiments. Furthermore, the usefulness of the mathematical model is illustrated by performing a set of simulation cases under various charging matrixes. It is hoped that the model can be used as a what-if tool in practice for the COREX operator to gain a better understanding of burden distribution in the COREX MG.

Graphical Abstract

1. Introduction

Steel is the world’s most popular construction material due to its durability, processability, and cost cheapness. However, producing steel brings high energy consumption and CO2 emissions, especially in ironmaking process. In order to minimize the energy consumption and CO2 emissions of the ironmaking process, some alternative liquid iron production technologies to blast furnace (BF), such as the COREX process and the FINEX process, have been developed [1]. The COREX process is a smelting-reduction process developed by Siemens Voest-Alpine Industrieanlagenbau Gmbh & Co. (VAI) in the 1970s, for cost-efficient and environment-friendly production of hot metal from iron ore and non-coking coal. Eight COREX units in the world have been put into use and successfully commercialized in different areas, e.g., South Africa, India, and China; therein, two of them are the latest generation of COREX with a capacity of 1.5 million tons of liquid iron per year and were built in China at the Baosteel Luojing steel plant.
In the COREX process [2], all the metallurgical reactions take place in two separate process reactors, the upper shaft furnace (SF) for the iron ore pre-reduction and the lower melter gasifier (MG) for final reduction and smelting. A schematic process flow sheet is shown in Figure 1. Iron ore (lump ore, pellets, or a mixture thereof) is charged into the upper SF where the burden is reduced to direct reduced iron (DRI) by the reduction gas arising from the lower MG. Discharge screws convey the DRI from the SF into the MG where final reduction and melting take place in addition to all other metallurgical reactions. In comparison with a conventional BF, COREX MG is equipped with a more complicated top charging system consisting of one gimbal distributor for coal and eight flap distributors for DRI.
The BF concept is used, but the BF is virtually split into two parts at the cohesive zone interface (cf. Figure 2) in a COREX process. Compared with the conventional BF route, non-coking coal can be directly used for ore reduction and smelting in a COREX process, which eliminates the need for coke making units. The use of lump ore or pellets also dispenses with the need of sinter plants. Since coking and sintering plants are not required for the COREX process, substantial cost savings of up to 20% can be achieved in the production of hot metal, of a grade similar to that of the blast furnace [3].
Since the distribution of charged burden plays a crucial role in determining the gas flow and thus in achieving a stable operation in BF and SF, it is of considerable importance to investigate the burden distribution influenced by the complicated charging system of COREX MG. The top charging system of COREX MG consists of one coal-gimbal distributor and eight DRI-flap distributors. The gimbal distributor distributes the coal to different radial positions in the furnace by adjusting the angle of the chute. The DRI-flap distributors can charge DRI into the furnace by changing the angle of the flap. The burden distribution is affected by many factors, such as loading equipment and charging patterns. However, as a closed high-temperature reactor, it is difficult to observe directly the burden surface profile and internal structure in the COREX MG. Therefore, it is necessary to establish a mathematical model to predict the profile of the burden surface and the internal structure of burden column.
Many studies [4,5,6,7] have established mathematical models of BF and SF charging with chute distributors, and compared with physical experiments [8] or data from industrial onsite experiments [9], and the rationality and accuracy of the models have been verified. However, the mathematical model studies on the charging process in COREX MG remain scarce. In recent years, more and more detailed research works have been carried out on the flow trajectory of the DRI-flap distributor and the coal-gimbal distributor by some research groups [10,11,12,13,14,15,16]. Although many physical experiments and numerical simulations have been conducted, sophisticated forecasting software or mathematical models similar to the fast evaluation model of BF charging [17,18,19] for predicting the burden surface profile and internal layer structure have not been formed.
The authors’ experimental studies on COREX MG charging [11,12] has shown that, due to the high free space (low stockline) and small flow rate of burden charging in the COREX MG, the formation of burden pile is in a developing phase with growing pile angles, while that in a BF is commonly recognized as in a fully-developed phase with stable pile angles. The experimental measurement showed also that the pile width was practically the same as the width of burden flow arriving at the burden surface. This makes the formation of burden pile in COREX MG being different from that in a BF. Therefore, this work will focus on the formation process of burden pile when certain material reaches the burden surface, and thereby a thorough understanding of the charging process as well as burden pile evolution can be expected, especially for the mechanism of developing growing with developing pile angles.

2. Mathematical Model

The charging system of MG involves one coal-gimbal distributor and eight DRI-flap distributors. Reasonable charging processes are completed by various combinations of the two sets of equipment. The coal-gimbal distributor consists of consecutively a coal hopper, a down-comer, and the rotating chute; while a DRI-flap distributor consists of consecutively a vertical pipe, an inclined-pipe, and the angle-adjustable flap.

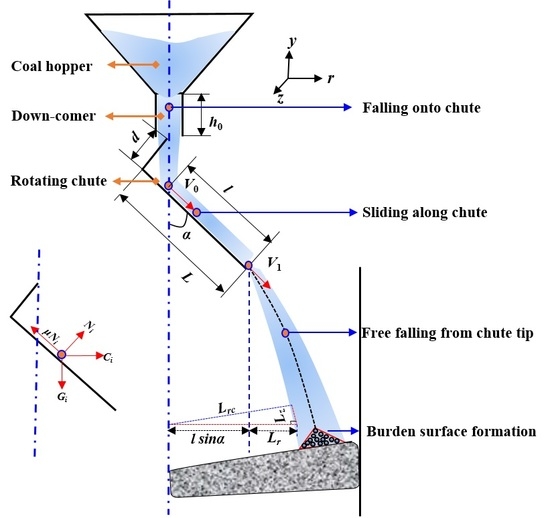
2.1. The Coal-Gimbal Distributor

The mathematical model for the coal-gimbal distributor is similar to the chute distributor of a modern BF with the bell-less charging system (cf. Figure 3). In the mathematical model, the charging process is divided into four consecutive fundamental steps: the free falling of particles from the hopper onto the chute, the sliding of particles along chute, the free falling of particles from the chute tip, and the formation of the burden pile. Detailed treatments of the first three fundamental steps can be found in a previous publication [18,19] of the authors. In the fourth step, compared with the charging process of BF, the burden has a longer descent distance and a wider flow width in the COREX charging process, so the formation mechanism of burden pile is quite different.

2.2. The DRI-Flap Distributor

The pathway of DRI particles in the DRI-flap distributor is shown in Figure 4. The mass of the particle is m. At the bottom of the vertical pipe, the particle attains the velocity of V1 (m/s) normal to the inclined pipe and it attains the velocity of V2 (m/s) at the end of the inclined pipe, then the particle collides with DRI-flap and attains the bouncing velocity of V3 (m/s). The friction coefficient between particle and inclined-pipe is μ, and the length of inclined pipe is l1. The angle between the inclined pipe and the horizontal direction is α1, and that between V3 and the vertical direction is α2.
DRI particles stored in the upper hopper fall onto the bottom of vertical pipe. This motion is simplified by assuming the flow of a bulk stream similar to that of an individual particle, which is stationary when leaving the upper hopper and gains an exit velocity V1 along the direction normal to the inclined pipe.
V 1 = k 1 , DRI cos α 1 2 g ( H 1 + h 1 )
where a correction coefficient, k1,DRI, is introduced to take into account the imperfect elastic collision of the falling particles.
Since the moving direction of DRI particles from the vertical pipe is normal to the inclined pipe, the initial particle velocity along the inclined pipe is zero. Therefore, the velocity at the end of the inclined pipe is obtained as
V 2 = 2 g ( cos α 1 μ sin α 1 ) l 1
The velocity V3 after colliding with the flap is
V 3 = k 2 , DRI V 2
where a correction coefficient, k2,DRI, is introduced to take into account the imperfect elastic collision between the particles and flap.
Upon leaving the flap, the velocity of the bulk stream is decomposed into two components in the vertical direction (V3 sinα2) and the horizontal direction (V3 cosα2). After this, the bulk stream will form a parabolic motion similar to the free falling of a particle from a chute tip.

2.3. Formulation of Mathematical Model

The burden structure model in COREX MG is formulated as follows.
(1) Whenever the coal-gimbal distributor or the DRI-flap distributor is used, the burden pile is formed in a ring at certain radius and uniformly distributed in the circumferential direction. It is assumed that the two-dimensional section of the burden profile is a triangle, the shape of the triangle is determined by the width of the burden flow and the volume of the burden batch together, and the position of the triangle in radius direction is determined by the chute angle or flap angle.
(2) As mentioned above, the formation of COREX burden pile is in a developing phase, therefore, the width (W) of the burden pile is considered to be equal to the width of the burden flow arriving at the burden surface. The measured results for the width (W) of burden piles, the locations of the pile’s left (L) and right (R) edges for coal, and DRI for different rings in physical experiment are listed in Table 1 [15].
Through regression analysis of the experimental data, the relationships between burden pile width and ring radius were obtained as shown by Equations (4) and (5) for coal and DRI respectively.
Wcoal = 41.667Ri + 177.92
WDRI = 23Ri + 257
(3) The impinging effect and the mixing between sequential layers (rings) are ignored. Based on observations from physical experiments, it was found that the larger and lighter coal particles more easily to roll than the ore particles if they charged on an inclined surface. Therefore, a modification coefficient (greater than 1) is introduced to take it into account.

2.4. Result of Stable Initial Burden Profile

Compared with BF, the COREX MG charging process has the characteristics of smaller volume of burden dumps (or batches) and lower height of stock level (13~14 m in MG, and 1~2 m in BF). Previous physical experiments [10,11,12] and numerical simulation [13,14] results indicate that, in MG, it is difficult to form a stable surface with certain internal and external repose angles similar to those in the BF [15,16]. In other words, the mechanism of burden pile formation is different in the two reactors. To solve this problem, a new method based on burden pile width is proposed to calculate the growing process of the pile. The model can be used to characterize the evolution of burden surface profile and internal layer structure under various charging matrixes.
The published physical experiment [12] and numerical simulation [20] studies of the mixed charging in MG show that the stable burden profile has a high center and a low edge with the descent of the whole burden column. By regression analysis of the physical experiment and numerical simulation data, an equation for the stable burden profile in the COREX MG can be obtained, as shown in Figure 5. Such a stable burden profile is then simplified into a line of three segments, that is, the horizontal center and edge segments and the inclined middle segment.

2.5. Growing Mechanism of Burden Surface

The characterization of the growing of burden surface mainly requires the determination of the radius locations of the left and right edges of the pile according to the width of burden flow measured from previous physical experiments [12] under various angles of coal-gimbal chute and DRI-flap. Since the stable initial burden profile is composed of three segments, the growing mechanisms at different locations are more complicated than that on a horizontal flat profile. In this model, there are mainly five pile patterns as shown in Figure 6. In the figure, L and R represent the left and right ends of the burden pile, respectively, on a horizontal plane. OM represents the radius of the pile ring which is determined by the angles of coal-gimbal chute and DRI-flap. Point O is the intersection point between the old burden surface and the vertical line at pile ring radius, and point M can be obtained according the dump volume. The critical width of burden pile (Wcritical) is the width when the pile attains stable repose angles, and is determined by the height of stock line, the angle of chute or flap, and the physical property parameters including size distribution and rolling friction coefficient. L, R, O and Wcritical are measured on a horizontal flat burden surface by previous physical experiment under various angles of the coal-gimbal chute and DRI-flap, and these data has just been listed in the above Section 2.3.
To characterize the formation of such complicated piles, the growing of a pile is calculated by iteration with a small volume step till the dump volume. In this way, the growth mechanism of burden pile on the horizontal section is shown in Figure 6a, including an early developing phase and a later developed phase. In the developing phase, both the inner and outer angles of the pile increase before the pile reaches the developed phase, where the pile undergoes a parallel growing mechanism similar to that in a BF. The horizontal distance LR is the width of burden flow arriving at the original burden surface, while OM represents the radial location of the burden ring.
The growing mechanism of a burden pile sitting on the turning point from a horizontal segment to a declining one is shown in from Figure 6b, where both points L and M are on the horizontal segment and point R is on the declining segment. In such cases, the point L is set as the left end of the burden flow. The right end of the first-step burden pile is the first intersection R0, between the old burden surface and the line segment of MR. When the right point R0 reaches R, the outer angle starts increasing until it reaches the developed phase, and then the growing mechanism becomes parallel in growth with the outer angle, similar to that in a BF. The evolution of the inner angle follows a similar procedure as the outer angle.
When a pile is developed on the declining segment, its growing mechanism is shown in Figure 6c, where all the three points L, R, and M are on the declining segment. In this case, point R is set as the right end of the burden flow. The left point of first-step burden pile is the first intersection L0 between the old burden profile and the horizon line. The inner angle increases until it reaches the developed phase and then turns to parallel growth with inner angle similar to that in the BF.
The special cases where one side of the pile reaches the furnace center and the furnace wall are considered as shown in Figure 6d,e. Regardless of whether the inner angle or the outer angle is in the developed or developing phases, as long as one side of the pile encounters an obstacle (furnace center or furnace wall), the inner or outer angle will decrease until it reaches the horizontal level, that is, a flat platform is formed by the center or wall.

3. Results

3.1. Verification of the Model

To show the feasibility and effectiveness of the proposed mathematical model, a comparison between the model prediction and the results of a physical experiment is conducted. Two important parameters, the radial coal/ore ratio and burden surface profile, are compared and analyzed. Table 2 shows the mixed charging pattern of Case 1 used in the physical experiment, where the time period of charging is 300 s (the same as the physical experiment), and the volumes of coal and DRI in one charging period (including two coal dumps and two DRI dumps) are 14.5 m3 and 8.6 m3 respectively.
According to the similarity principle, the scale ratio of the physical model to the actual furnace is 1:7.5, so the width of burden pile in the actual process should be expanded by 7.5 times. Therefore, the results for burden piles of coal and DRI in the mathematical model are listed in Table 3, including the inner end and outer end positions of the consecutive piles.
The burden surface profile of Case 1 obtained by the mathematical model is shown in Figure 7. As can be seen from Figure 7a, the height of the burden surface varies from 12.9 m to 14.5 m, and the burden surface is higher in the middle area and lower in the edge area. Figure 7b is an enlarged part view of the burden surface. By comparing with the result of the physical experiment (cf. Figure 7c), it can be seen that the profile calculated by the model is similar to the result of the physical experiment, showing that the mathematical model based on the burden flow width has a certain accuracy for predicting the burden profile. Both the results of the physical experiment and mathematical model show that the height of burden surface near the furnace center is lower than that in the middle region, and it then decreases along the radial direction but slightly rises near the wall. In this case, because the coal and DRI particles were charged from 2.0 m and 3.0 m outwards respectively, less particles reach the center and more particles were charged to the wall region. But the descent rate of the wall region is higher than that of the center region, and thus a lower burden bed profile was formed.
To further validate the mathematical model, the radial distribution of radial ore/coal mass ratio is compared. Figure 8 shows a comparison of the ore/coal mass ratio in the radial direction between model prediction and experimental measurement. In the physical experiment, eight samples (about 2 kg each) are collected from the layer formed in the last charging cycle at the locations of every 100 mm from center to wall. The ore/coal mass ratio is calculated based on the mass of coal and DRI particles of each sample.
Both the model prediction and experimental measurement in Figure 8 show that the ore/coal mass ratio increases first and then decreases, attaining a maximum at a radial position of about 5 m for the present charging matrix. The charging region of coal is in the radial range of 2~4.5 m, and that of DRI is in the range of 3~4.5 m. Therefore, the volume of coal distributed before the radial distance of 2 m is more than that of ore, and the mass ratio of ore/coal is close to zero. In the radial range of 2.0~4.5 m, the increase rate of coal is lower than that of DRI (cf. Table 1), so the mass ratio of ore/coal is increased. However, due to that larger size and lighter mass, coal particles tend to roll and easily be pushed to the descending region near the wall, the ore/coal mass ratio is decreased near the furnace wall.
Comparing the results of the mathematical model and physical experiment, it can be found that the trend is basically the same, but the value of ore/coal mass ratio calculated by the mathematical model is smaller than that measured in the physical experiment, which is mainly caused by the shape of DRI-flap in the physical experiment. In a previous work [12], it was observed that DRI particles were unevenly distributed in the circumferential direction due to the effect of DRI-flap shape, and the relative quantity of DRI distributed in the area between two adjacent flaps is somewhat more than that in the other areas. The sampling in the physical experiment is exactly in the points between the two DRI-flaps, and thus the ore quantity is somewhat large. In the mathematical model, however, it is assumed that the DRI is evenly distributed in the circumferential direction. In other words, the circumferential segregation is not considered, so the overall ore/coal ratio is somewhat smaller than the experimental value.
Since the burden distribution is determined according to its flow width (measured at a horizontal level), and do not consider the rolling of the particles at a horizontal level in the mathematical model, no material reaches the central area of the furnace (especially DRI). This is somewhat different from the results of the physical experiments. The model should thus be further improved in future studies to make it more consistent with the results of physical experiments. Overall, although the model calculation results are slightly different from the physical experiment results, the overall trend is consistent, which further proves that the mathematical model can effectively predict the mass ratio of ore/coal and the burden profile.

3.2. Application of the Model

The charging matrix determines the surface profile and internal structure of the burden column in the furnace. In this section, three different charging matrixes are used to study the effect of charging pattern on the burden distribution. Detailed data of the charging matrixes are listed in Table 4. The on-site charging pattern can be classified into three categories, including inner coal and outer ore (e.g., Case 1#), outer coal and inner ore (e.g., Case 2#), and co-location of coal ore (e.g., Case 3#).
The evolution of burden profiles under various charging matrixes is shown in Figure 9, where the respective initial stable burden surfaces are determined according to the physical experiment as described above. Taking Case 1 as an example, one charging period including two coal dumps and two DRI dumps, that is, the first coal dump is charged from center to wall, followed by the first DRI charging from center to wall, and then the second coal dump is charged from wall to center, followed by the second DRI charging from wall to center. As can be seen from the figure, the burden surface profile is higher in the center and lower near the wall. As the charging position of Case 3 is farther from the wall than that of Case 1 and Case 2, the original burden surface does not have a flat platform near by the wall. Therefore, the burden profile of Case 3 is relatively flat in the radial direction, and more material gets to the wall region, while the middle area thickness of the burden pile in Case 1 and Case 2 is relatively greater than that in Case 3.
The results of the ore/coal mass ratio distribution for different charging matrixes are shown in Figure 10. It can be seen from the figure that the charging pattern has a great influence on the radial ore/coal ratio distribution.
For Case 1, the charging region of coal is in the range of 2.0~4.5 m, and that of DRI is in the range of 3.0~4.5 m. Since the starting position of coal charging is closer to the furnace center than DRI, there is an ore-free region in the central area. The ore/coal ratio is zero before approximately 2.0 m, and then increases rapidly along the radial direction till R ≈ 4.75 m, and finally decreases in the wall region.
For Case 2, the charging region of coal is in the range of 2.5~4.5 m and that of DRI is in the range of 2.0~4.5 m. Therefore, the volume of ore distributed before the radial distance of 1.0 m (the DRI left ends of R2.0 in Table 3) is more than that of coal, and the ore/coal ratio is larger in this region than Case 1. In the region of 2.5~3.0 m, the relative coal increase rate is greater than DRI, so the ore/coal ratio decreases along radial direction. However, due to larger size and lighter mass, the coal particles tend to roll and are easily pushed to the descending region near the wall, so the ore/coal ratio is decreased near the furnace wall.
For Case 3, the charging regions of both coal and ore are in the same range of 2.0~4.0 m. Since the starting positions of coal and ore charging are the same, the ore/coal ratio distribution in the radial direction is relatively uniform in Case 3. In Case 1 and Case 2, the ore/coal ratio is relatively higher in the wall area, so the ore content or the coal load is larger, which may lead to a poor permeability of the burden bed.

4. Conclusions and Future Perspectives

Based on the previous physical experiment, a new approach was proposed to characterize the growing mechanism of burden surface with the width of burden flow arriving at the burden surface in the COREX MG. The validity of the model is demonstrated by comparing the simulated burden layer structure with the corresponding results obtained by physical experiments. The usefulness of the mathematical model is illustrated by performing a set of simulation cases under various charging matrixes. The main conclusions are as follows.
(1) A mathematical model for characterizing the layer structure has been established based on the burden flow width. Compared with physical experiment, the model prediction is reasonably reliable, and the model can be used to predict the burden distribution with the complicated charging system of gimbal and flaps.
(2) The model can be used to predict the radial distribution of ore/coal mass ratio with different charging matrixes. It can be seen that the charging matrix has a great influence on the radial ore/coal ratio distribution. The co-location charging of coal and ore results in the most uniform distribution of the ore/coal ratio in the radial direction.
In the future, the mathematical model will be further improved by considering the influences of coal pushing, mixing between layers, and burden column descending. It is hoped that the model can be used as a what-if tool in practice for the COREX operator to gain a better understanding of burden distribution in the COREX MG and to supply boundary conditions for a mathematical model of the COREX MG to be developed.

Author Contributions

Conceptualization, H.L., Z.L., and Z.Z.; data curation, H.L., Z.L., and W.L.; funding acquisition, Z.Z.; investigation, W.L. and L.S.; methodology, W.L.; project administration, Z.Z.; resources, Z.Z.; software, H.L. and W.L.; supervision, Z.Z.; writing―original draft, H.L.; writing―review and editing, Z.Z. and L.S.

Funding

This research was funded by the National Science Foundation of China grant number 51604068, 51574064 And the APC was funded by China Scholarship Council (CSC No. 201706085021).

Acknowledgments

Financial supports from the National Science Foundation of China (Grants 51604068, 51574064) and China Scholarship Council (CSC No. 201706085021) are gratefully acknowledged.

Conflicts of Interest

The authors declare no conflict of interest.

References

  1. Hasanbeigi, A.; Arens, M.; Price, L. Alternative emerging ironmaking technologies for energy-efficiency and carbon dioxide emissions reduction: A technical review. Renew. Sustain. Energy Rev. 2014, 33, 645–658. [Google Scholar] [CrossRef]
  2. Srishilan, C.; Shukla, A.K. Static thermochemical model of COREX melter gasifier. Metall. Mater. Trans. B 2018, 49, 388–398. [Google Scholar] [CrossRef]
  3. Song, J.Y.; Jiang, Z.Y.; Bao, C.; Xu, A.J. Comparison of Energy Consumption and CO2 Emission for Three Steel Production Routes—Integrated Steel Plant Equipped with Blast Furnace, Oxygen Blast Furnace or COREX. Metals 2019, 9, 364. [Google Scholar] [CrossRef]
  4. Xu, J.; Wu, S.L.; Kou, M.Y.; Zhang, L.H.; Yu, X.B. Circumferential burden distribution behaviors at bell-less top blast furnace with parallel type hoppers. Appl. Math. Model. 2011, 35, 1439–1455. [Google Scholar] [CrossRef]
  5. Ren, T.Z.; Jin, X.; Ben, H.Y.; Yu, C.Z. Burden distribution for bell-less top with two parallel hoppers. J. Iron Steel Res. Int. 2006, 13, 14–17. [Google Scholar] [CrossRef]
  6. Du, P.Y.; Cheng, S.S.; Teng, Z.J. Research of snakelike deviation in the burden distribution of a parallel-hopper bell-less top. J. Univ. Sci. Technol. Beijing 2011, 33, 479–485. (In Chinese) [Google Scholar]
  7. Shi, L.; Zhao, G.; Li, M.; Ma, X. A model for burden distribution and gas flow distribution of bell-less top blast furnace with parallel hoppers. Appl. Math. Model. 2016, 40, 10254–10273. [Google Scholar] [CrossRef]
  8. Park, J.I.; Jung, H.J.; Jo, M.K.; Oh, H.S.; Han, J.W. Mathematical modeling of the burden distribution in the blast furnace shaft. Met. Mater. Int. 2011, 17, 485–496. [Google Scholar] [CrossRef]
  9. Guo, H.W.; Zhang, J.L.; Chen, L.K.; Che, Y.M.; Yang, T.Y. Simulation of charging system in bell-less BF. Chin. J. Process. Eng. 2009, 9, 415–419. (In Chinese) [Google Scholar]
  10. Chen, L.S.; Luo, Z.G.; You, Y.; Zou, Z.S. Effects of Flap Angles on the Charging Procedure of Flap Distributors. J. Northeast. Univ. Nat. Sci. 2013, 34, 971–974. (In Chinese) [Google Scholar]
  11. You, Y.; Luo, Z.G.; Hou, Q.F.; Li, H.F.; Zhou, H.; Chen, R.; Zou, Z.S. Experimental Study of Burden Distribution in the COREX Melter Gasifier. Steel Res. Int. 2017, 88, 1700025. [Google Scholar] [CrossRef]
  12. Luo, Z.G.; You, Y.; Li, H.F.; Zhou, H.; Zou, Z.S. Experimental study on charging process in the COREX Melter Gasifier. Metall. Mater. Trans. B 2018, 49, 1740–1749. [Google Scholar] [CrossRef]
  13. Li, H.F.; You, Y.; Zou, Z.S.; Cai, J.J. Numerical simulation on the charging process of new DRI-Flap distributor. J. Northeast. Univ. Nat. Sci. 2016, 37, 800–804. (In Chinese) [Google Scholar]
  14. You, Y.; Luo, Z.G.; Li, H.F.; Zou, Z.S.; Yang, R.Y. Effects of the shape and inclination angle of DRI-flaps on DRI distribution in COREX Melter Gasifiers. Powder Technol. 2018, 339, 854–862. [Google Scholar] [CrossRef]
  15. Li, H.F.; You, Y.; Zhou, H.; Luo, Z.G.; Zou, Z.S. Study on burden pile profile prediction model for COREX-3000 Melter Gasifier. J. Chongqing Univ. 2015, 38, 39–44. (In Chinese) [Google Scholar]
  16. Zhang, H.M. CFD-DEM Modeling of Multiphase Flow in a FINEX Melter Gasifier. Ph.D. Thesis, University New South Wales, Sydney, Australia, 2015; pp. 95–144. [Google Scholar]
  17. Saxén, H.; Hinnelä, J. Model for Burden Distribution Tracking in the Blast Furnace. Miner. Process. Extr. Metall. Rev. 2004, 25, 1–27. [Google Scholar] [CrossRef]
  18. Mitra, T.; Saxén, H. Model for Fast Evaluation of Charging Programs in the Blast Furnace. Metall. Mater. Trans. B 2014, 45, 2382–2394. [Google Scholar] [CrossRef]
  19. Li, H.F.; Saxén, H.; Liu, W.Q.; Shao, L.; Zou, Z.S. Model-based analysis of factors affecting the burden layer structure in the blast furnace shaft. Metals 2019, 9, 1003. [Google Scholar] [CrossRef]
  20. You, Y.; Luo, Z.G.; Zou, Z.S.; Yang, R.Y. Numerical study on mixed charging process and gas-solid flow in COREX Melter Gasifier. Powder Technol. 2019. [Google Scholar] [CrossRef]
Figure 1. Schematic flow sheet of COREX process.
Processes 07 00892 g001
Figure 2. Comparison of concepts between blast furnace (BF) route and COREX route.
Processes 07 00892 g002
Figure 3. Schematic illustration of coal-gimbal distributor.
Processes 07 00892 g003
Figure 4. Pathway of direct reduction iron (DRI) in DRI-flap distributor.
Processes 07 00892 g004
Figure 5. Stable initial burden profile.
Processes 07 00892 g005
Figure 6. Growing mechanism of burden surface. (a) on the horizontal section; (b) from a horizontal segment to a declining one; (c) on the horizontal section; (d) near the furnace center section; and (e) near the furnace wall section.
Processes 07 00892 g006aProcesses 07 00892 g006b
Figure 7. Comparison of burden profile between model prediction and experimental measurement. (a) Overall schematic of model prediction; (b) partially enlarged view of model prediction; and (c) burden profile of experimental measurement.
Processes 07 00892 g007
Figure 8. Comparison of ore/coal ratio distribution between model prediction and experimental measurement.
Processes 07 00892 g008
Figure 9. Evolution of burden surface profiles under different charging patterns. (a) Burden surface profile in Case 1; (b) Burden surface profile in Case 2; and (c) Burden surface profile in Case 3.
Processes 07 00892 g009aProcesses 07 00892 g009b
Figure 10. Calculated radial ore/coal ratio distribution with different charging patterns.
Processes 07 00892 g010
Table 1. Measured results of the width of burden piles for coal and DRI in physical experiment (Units: mm).
ParametersR0.5R1.0R1.5R2.0R2.5R3.0R3.5R4.0R4.5R5.0
Wcoal-220240265280300320350365-
Lcoal-3794151208264320376431-
Rcoal-257334412490567644721797-
WDRI---300-330-350-370
LDRI---134-237-389-563
RDRI---437-563-738-935
Table 2. Data of charging pattern in Case 1.
RingsR0.5R1.0R1.5R2.0R2.5R3.0R3.5R4.0R4.5R5.0
Parameters
Relative thickness of coal---0.50.60.70.60.60.5-
Volume of coal/m3---0.6390.9581.3411.3411.5331.437-
Relative thickness of DRI-----0.50.811-
Volume of DRI/m3-----0.5040.9411.3441.512
Table 3. Results for the burden piles of coal and DRI in mathematical model of Case 1 (Units: mm).
ParametersR0.5R1.0R1.5R2.0R2.5R3.0R3.5R4.0R4.5R5.0
Lcoal0.00276.98704.831131.571556.921980.522401.812819.983233.793641.21
Rcoal1490.651923.882507.983090.973672.584252.434829.965404.395974.456538.12
LDRI0.000.000.001003.811373.311777.012285.952916.843588.184224.70
RDRI2013.752100.002186.253276.313732.064222.014817.205534.346291.937014.70
Table 4. Data of charging matrixes.
Case NO.Materials TypeRelative Thickness (–) at Different Rings Locations (m)
R1.0R1.5R2.0R2.5R3.0R3.5R4.0R4.5R5.0
1#Coal--0.50.60.70.60.60.5-
DRI----0.50.81.01.0-
2#Coal---0.50.80.70.60.15-
DRI--1.00.80.80.70.60.2-
3#Coal--0.70.70.80.90.8--
DRI--1.00.80.80.80.75--

