1. Introduction
1.1. Background
Pakistan is the 6th most populous country in the world and, therefore, produces a lot of waste. Studies show that Karachi, the most populous city of Pakistan [
1], will produce 16,000 tons of waste every day by 2020 [
2]. The growth in the civil population is challenging as the mass of waste production needs to be managed and the space utilized by this quantity recovered. In most developing areas, solid waste is usually burnt in an open environment. Burning of solid waste in an open environment is hazardous for the environment as it produces air pollution through dioxins and carbon monoxide. There are no waste to energy (WtE) plants currently employed anywhere in the country. With rapid urban development and the lack of space for new landfills, cities are running out of options. Karachi is a typical example of this situation. WtE plants provide the opportunity to remove dioxins and minimize the carbon monoxide level to reduce air pollution; it also reduces the overall garbage volume to 10%, approximately. Incineration is a process of burning contained garbage prior to disposing of it. Heat is generated as a result of this burning and if the heat generated is used to drive a boiler to produce steam, this will, in turn, drive a turbine which could produce power. It has been employed by developed countries around the world especially in Europe for a long time. In the Netherlands alone, it has existed for 100 years and is a profitable business for the government. As the UN passed its 17 SDG (Sustainable Development Goals), which include the production of clean and affordable energy, we need to work on sustainable energy models from all areas including recovering energy from waste through incineration and gasification.
The main aim of this study is to contribute effectively to the use of energy potential of municipal solid waste. As Pakistan is a developing country, there is a lack of sufficient data and it is quite strenuous to find literature on the energy potential of solid waste in Karachi. In 2016, Asra et al. [
3] made the first attempt to collect samples from one landfill site (Jam Chakro) and evaluated its energy potential. It was concluded that this site is below the minimum calorific value requirement and cannot be utilized for a sustainable and efficient incineration plant. Over time, with increasing population, the waste composition of the mentioned site has drastically changed. This study evaluates that the Jam Chakaro landfill site is now suitable for a WtE plant. Moreover, the previous study just evaluated one site but this study incorporates three landfill sites (two officially nominated and one more i.e., Jam Chakro, Gond Pass, and Sabzi Mandi) to determine their energy potential.
1.2. Literature Review
Solid waste is the random composition of different domestic, industrial, or agricultural components. A sanitary and efficient system for the accumulation and disposal of solid waste is of great significance for every community. Generally, municipality size and per capita income of the community define the requirements of a stable waste disposal system [
4].
Solid waste is usually dumped untreated. If waste treatment is performed at any sight then its hazardous residues are thrown into the mainstream city waste and landfilled along with untreated waste, making it environmentally hostile. Hence, the foundation of a waste administration framework is a proficient waste collection system and an ecologically benevolent landfill.
The recycling framework includes determining whether solid waste is materials or by-products that may have a negative incentive for the proprietor. What can be viewed as waste will subsequently change with the conditions of the proprietor and also with the time and place. Waste can be changed to an environmentally-friendly product by treatment. Such a change relies upon expenses and whether the economy is seen as a private venture, national need, or both.
All the components of municipal solid waste have naturally existent calorific values, which replicate their energy potential when burnt. The primary concern that is significant to the use of this energy is related to the lower calorific value of the solid waste. That is why calorific value is a vital factor for fuel quality evaluation [
5]. Finding the energy potential of solid waste, in mixture form, is not an applicable approach as the composition varies greatly in each sample of the same solid waste. It is necessary to segregate the components and build calorific value statistical data on a percentage basis to estimate the average energy potential. Calorific value can be found out by bomb calorimeter, proximate analysis, chemical ultimate composition analysis, or through theoretical calculations for the estimation of waste quality [
6]. This calorific value can determine how the garbage will be used to produce enough energy to produce power. Once the energy potential is determined, a waste to energy (WtE) system can be efficiently designed by different engineering design methodologies. The rate of production of the municipal solid waste (MSW) is affected by the following factors.
Generally, the higher the economic development, the higher the amount of MSW generated. At present, the population of the world residing in cities is more than 50%. This contributes to generating more solid waste compared to those living in village areas. Greater population rate, rapid industrialization, and economic expansion of developing countries contributes to the increasing rate of landfilling. Proper solid waste collection and its conversion to energy may become a vital fuel and energy resource in the near future.
Waste to energy (WtE) technologies includes the transformation of solid waste to electricity, heat, or transportation fuels. These technologies can be applied to several types of waste, such as
Semi-solid waste (for example sludge from treatment plants)
Fluid waste (for example domestic wastewater and refinery gases)
Solid waste (for example municipal solid waste)
The most commonly observed application is by far, the treatment of municipal solid waste (MSW) [
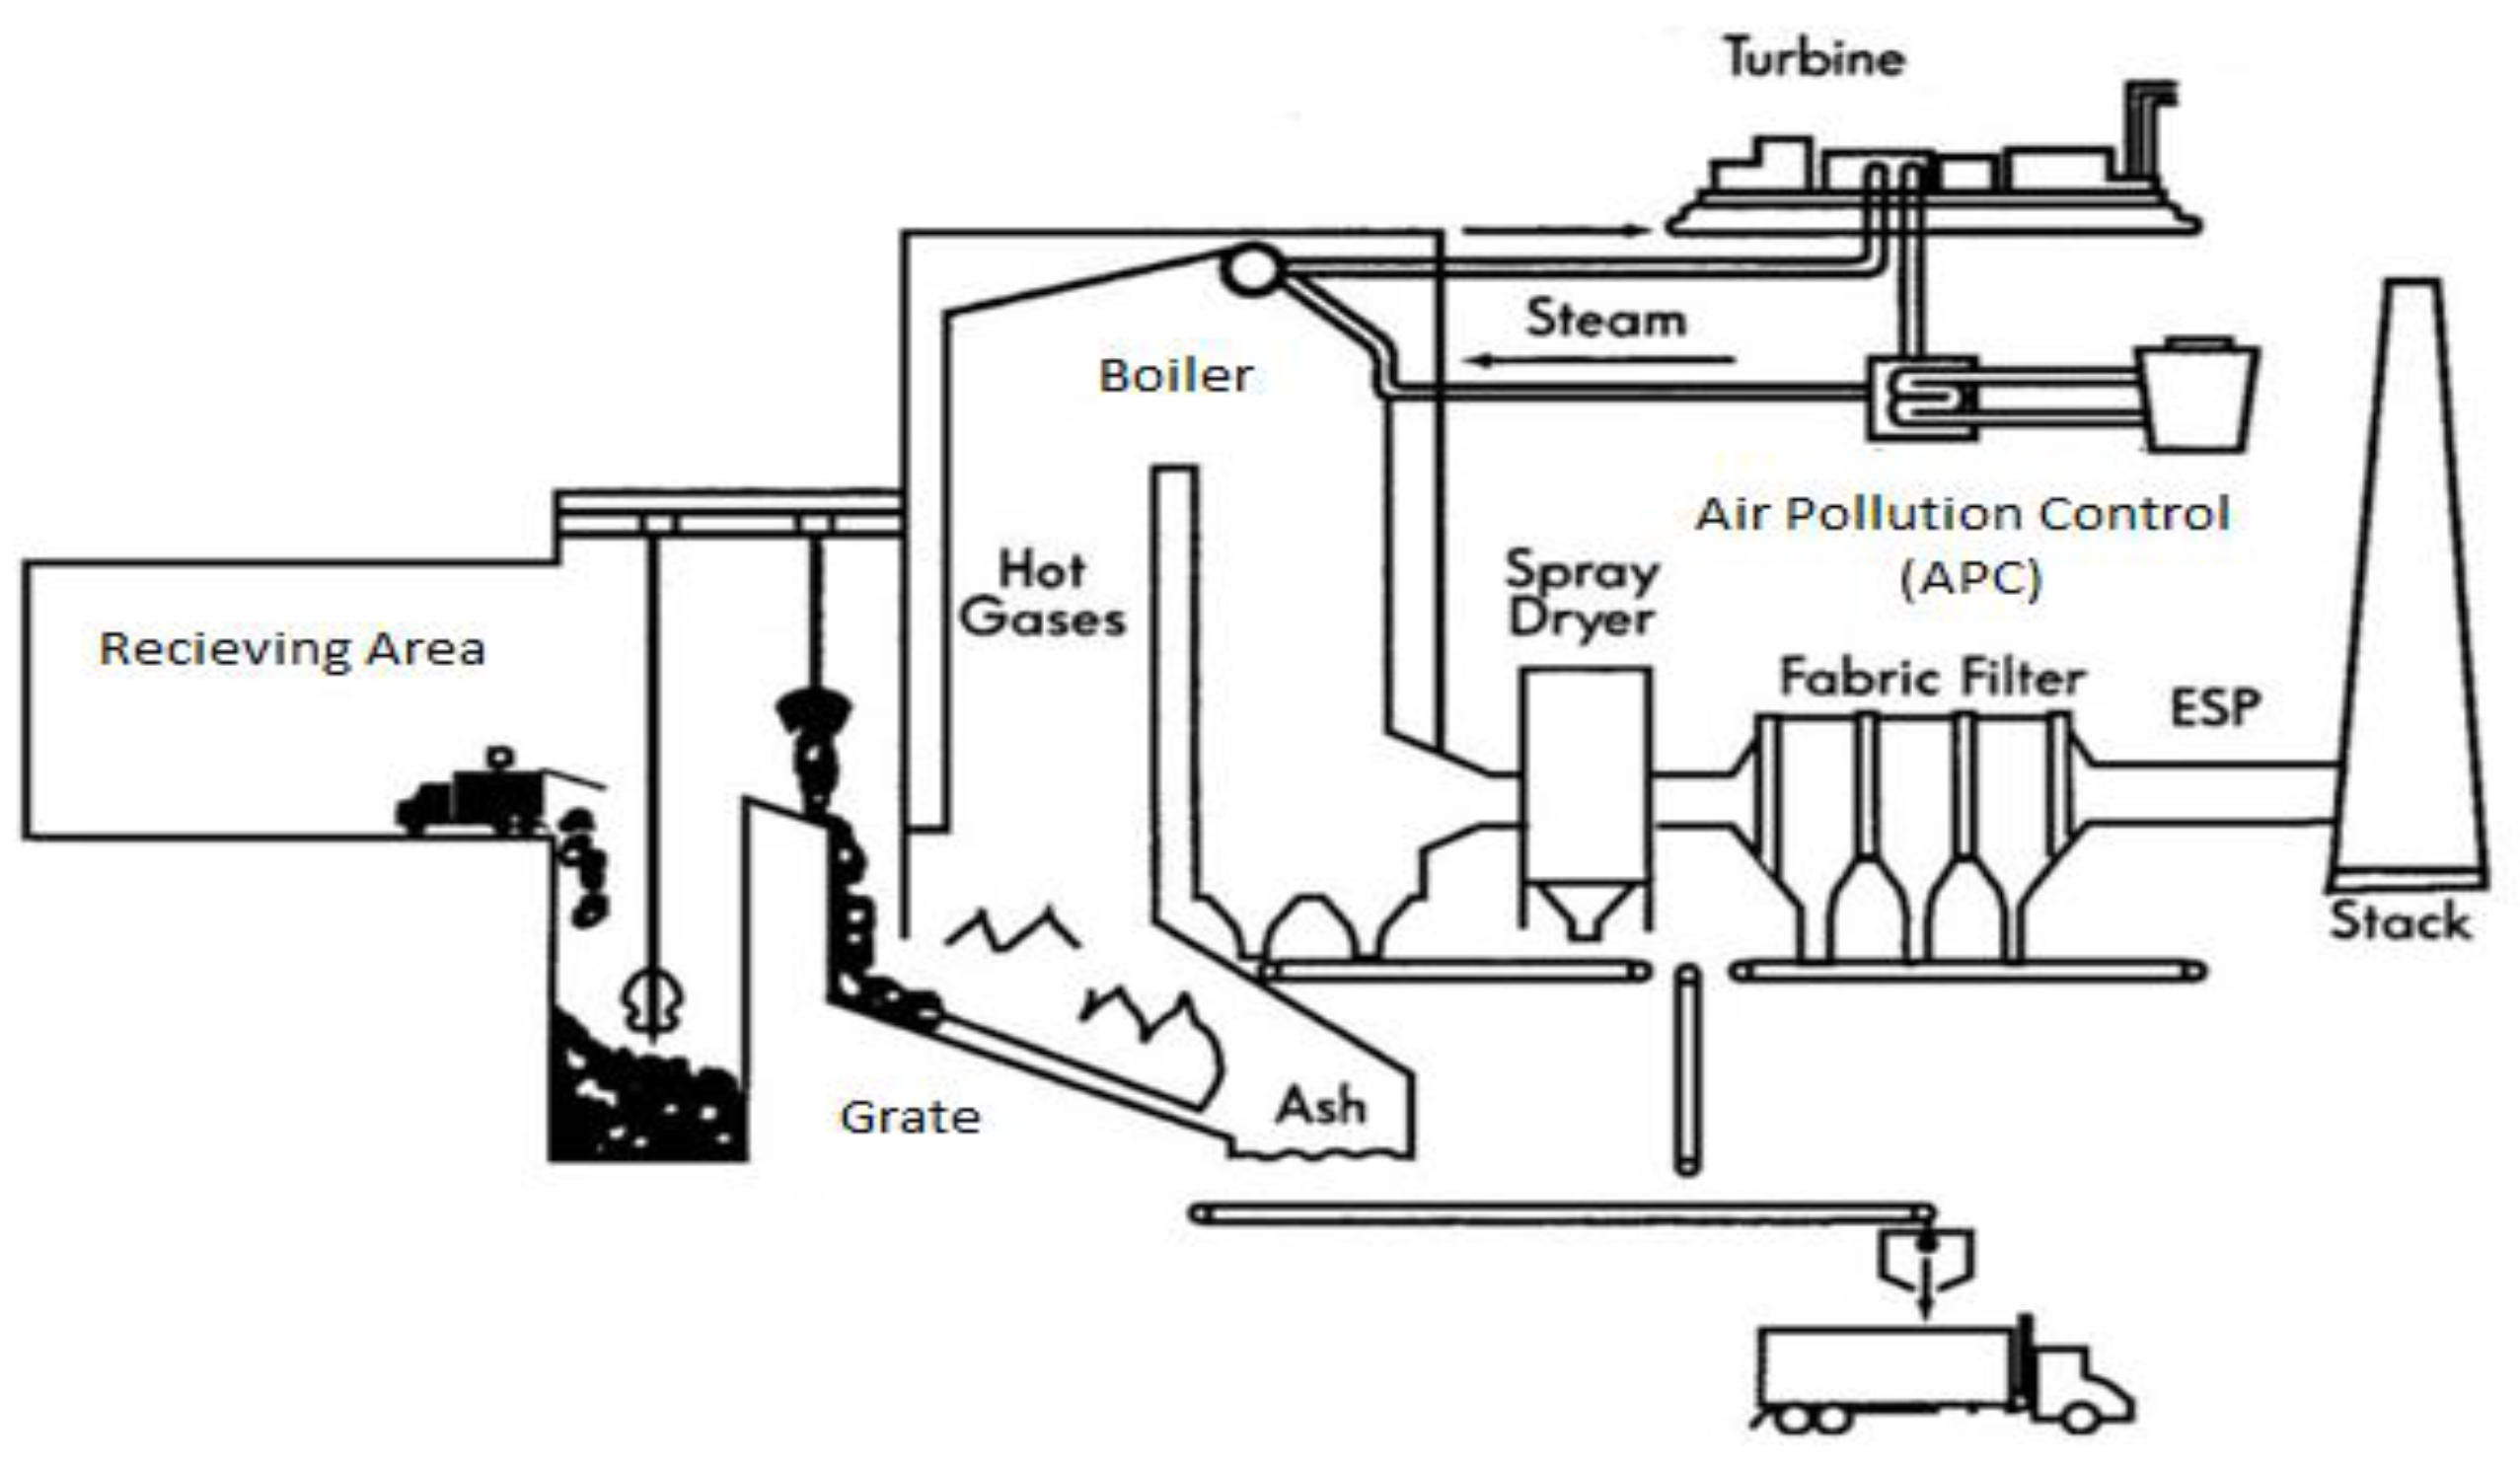
7]. WtE technology is currently best known for the treatment of municipal solid waste. A schematic of a WtE plant is depicted in
Figure 1.
A municipal solid to energy site consists of 4 components.
Stages of WtE Plant
Pre-Processing. The receiving area includes the tipping floor and a storage tank. The tipping floor is the part of a WtE plant where the waste is initially stored for further processing. At this point of the solid waste to energy process, waste is initially scanned to remove hazardous components of waste. This is done for efficient handling of plant and air pollution control.
Primary Process. The grate and the boiler are referred to as the primary process. The waste is left to dry before putting it in the boiler at the end. This is to reduce the moisture content. In hot and dry countries like Pakistan, there is usually no need for drying as the MSW already has a low moisture content. Afterward, the MSW is entered into the grate to shred it. This increases the surface area for surge combustibility. Then the waste is incinerated and is used to heat the fluid in the boiler.
Post Processing. The air pollution control (APC) stage is also known as post-processing and is used to clean the flue gases. Most of the particulate matter and dioxins are removed here. In some facilities, where the policies are strict, the APC can occupy about half of the plant. This ensures the flue gases are according to the regulatory policies.
Some misconceptions regarding MSW incineration must be clarified here:
Incineration does not hinder recycling [
8]. Countries in Europe that have the highest amount of recyclable waste tend to practice incineration as it is an essential part of the waste management process.
Modest pollutants. Due to the high temperatures, the waste is treated [
4]. Modern technology allows us to treat flue gases so the dioxins are no longer a concern.
Waste to energy is better than landfilling. Waste to energy contributes effectively to the removal of harmful pollutants present in the waste from the eco cycle. According to the EPA, municipal solid waste (MSW) burners, using trash and garbage to generate electricity, separating recyclable materials, will “actually reduce the number of greenhouse gas (GHG) emissions in the atmosphere compared to landfilling. The savings are estimated to be about 1.0 ton of GHGs saved per ton of MSW combusted” [
9].
2. Methodology
2.1. Study Area
For this study, Karachi is considered as the case study area because it is the most populated city of Pakistan with 14.9 million people living in it [
1]. Karachi is one of largest cities in the world and it is producing solid waste at an enormous rate. According to research, conducted in 2014, about 10,000 tons of MSW are produced by Karachi alone in one day [
6]. The current solid waste production rate of Karachi is 12,000 tons per day, which is 4.4 million tons per year [
10]. Out of this enormous amount of solid waste, not even 1 ton of waste is dumped as per international standards of solid waste dumping [
11].
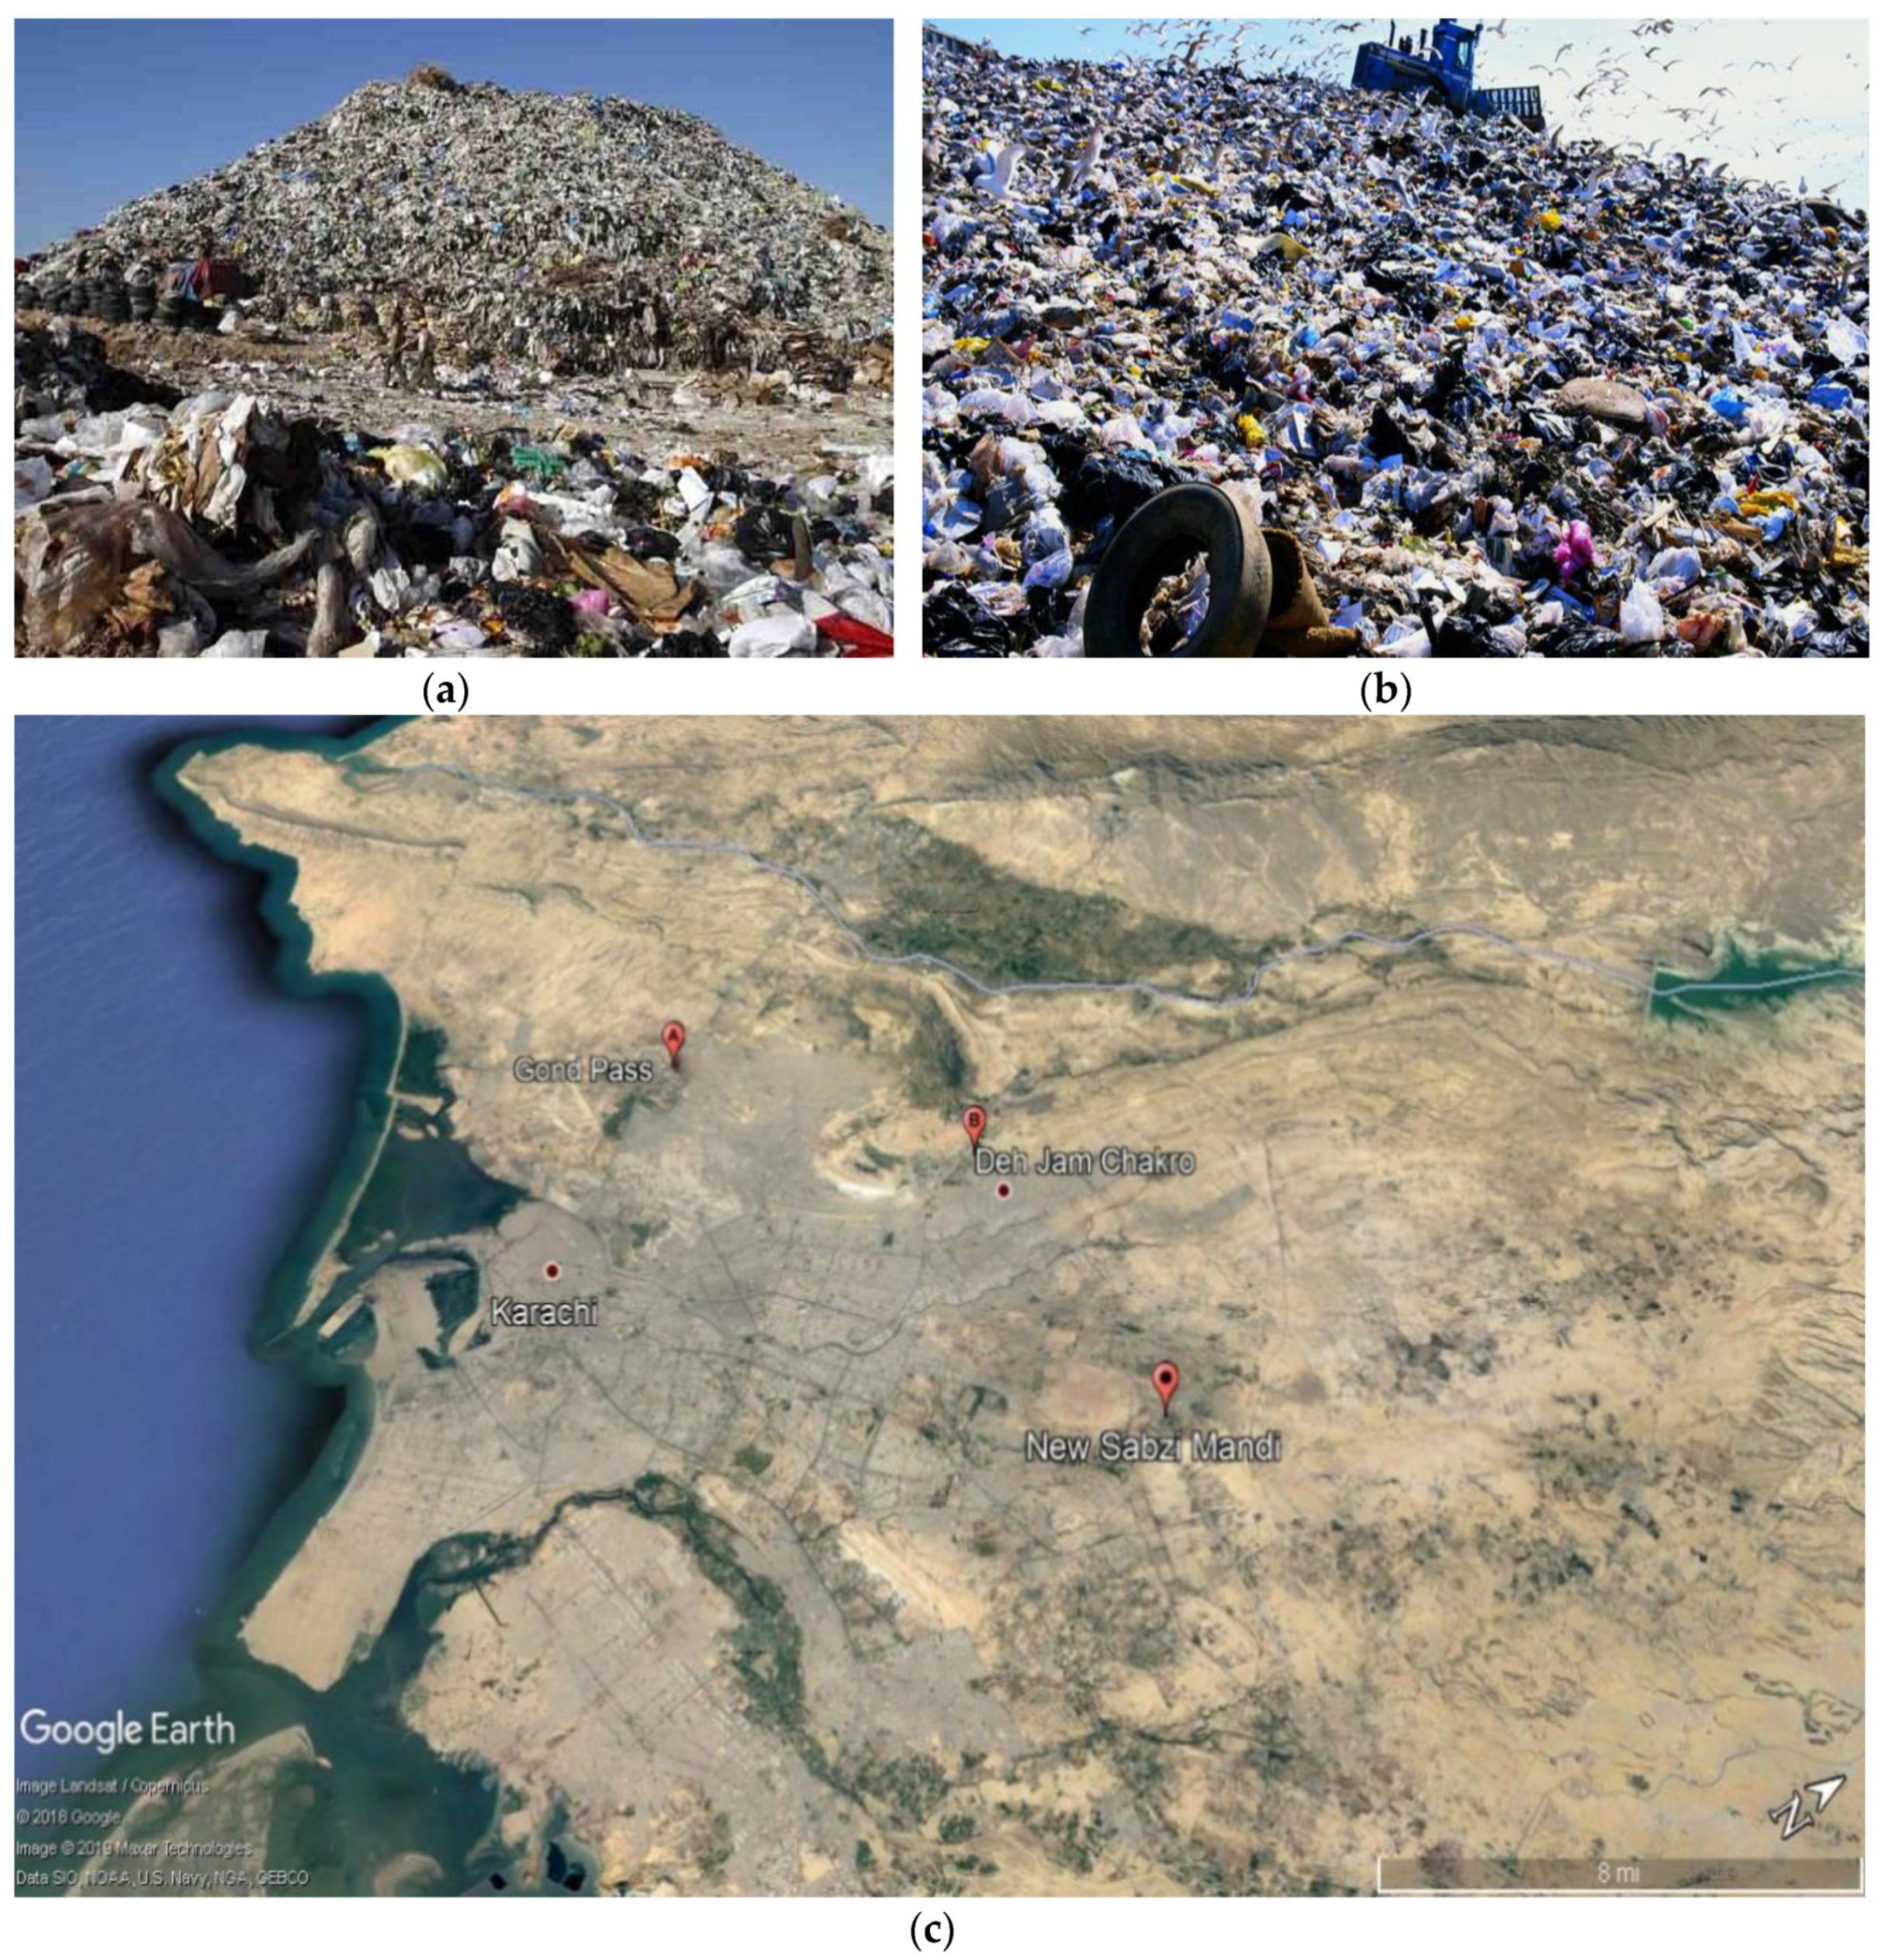
For this research study, a bulk of samples were collected from 3 different sites, as depicted in
Figure 2 and
Figure 3. The waste was collected in plastic bags to get approximately 10 kg from each site. Two of these sites are officially declared landfills which include:
- (a)
Jam Chakro (N = 25°01.675′, E = 67°01.61′)
- (b)
Gond Pass (N = 25°00.634′, E = 66°55.263′)
While Sabzi Mandi (N = 24°56′, E = 67°5′) was also selected because it accounts for the highest amount of food waste dumping. The waste at these sites compromises of fruit and vegetable waste, which comprises of organic matter.
It was also noted that currently around 60% of waste was being landfilled while the rest is left on the city streets, which creates water, air, and land pollution [
6].
2.2. Sample Collection
After the collection process, waste was categorized into different compositions (i.e., food waste, plastic, paper, fabric, (textile), woody, metal/glass, rubber, and unsorted) by manual handling. Extensive collection was spread over the ground and identical material was picked and separated manually. Samples were categorized as plastic bags, paper, fabric, woody material, metal, glass, and miscellaneous items.
Samples were analyzed visually to be homogeneous and free from sand particles. Sand content was measured after separation to optimize the moisture content values. Samples were then measured by weight on a weighing unit to build statistical data for heat potential. The weight percentage of these components is presented in
Figure 3.
2.3. Analysis of Sample
Once the samples were analyzed on the basis of their weight composition, they were theoretically assessed by a proximate analysis report, which was done previously by Korai et al. on the waste gathered from Hyderabad, which is a similar city in Pakistan with a majority urban population and similar dry weather [
12].
Two theoretical models were used to check the feasibility of waste material as fuel. As discussed before, lower calorific values are of most significant interest for active combustion. These models provide a practical approach to find the combustion potential of the samples. The models are given below.
2.3.1. Model 1
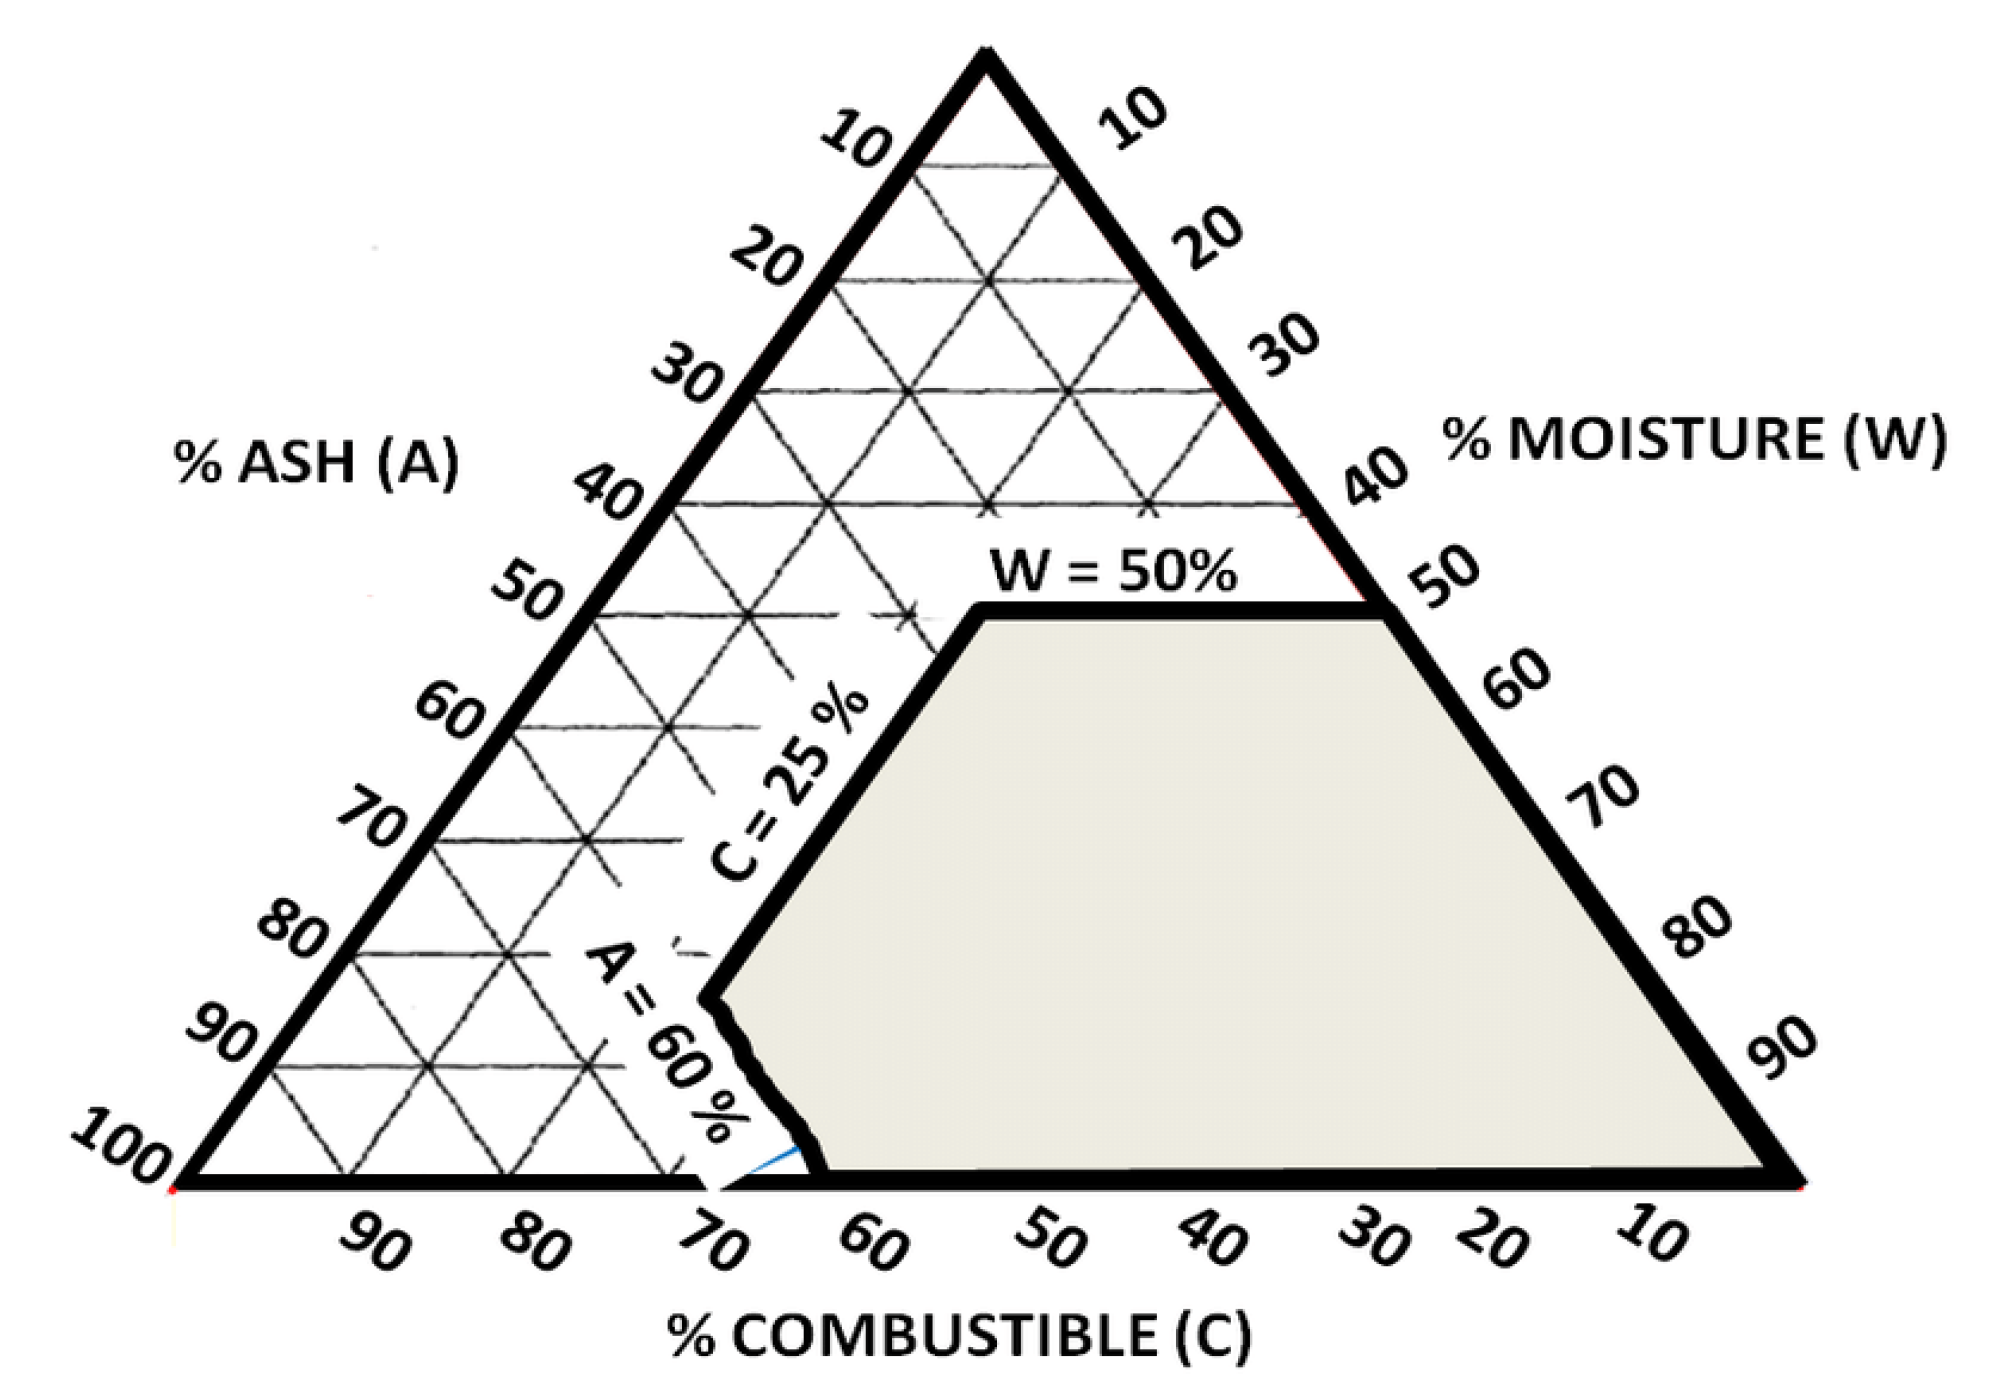
This model is based on one that has many different studies done in the past and it is collectively accepted. We used a simpler model called the Tanner diagram. This is a triangular plot with three content percentages for any waste on wet bases. These include A (% ash content), M (% moisture content), and C (% combustible content). It is important to note that these will always sum up to equal 100. It is good to test if waste would qualify for incineration purposes, gasification, pyrolysis, or anaerobic digestion based on the Tanner diagram results [
13,
14].
A later review finds some new findings that are depicted in
Figure 4 [
15]. The best specimen must then contain a max amount of organic matter and little moisture and ash content. It is important to note that waste should comply with the tanner diagram shown below for it to be combustible without any other fuel, i.e., for self-burning after initial ignition [
4].
Ash must be less than 60%, the moisture content should also be below 50%, and the combustible material should be greater than 25% for the fuel to burn independently. A detailed description of ash, moisture, and combustible contents of the case study area are depicted in
Figure 5.
For a successful MSW power generation plant, some criteria need to be met:
The average low calorific value of waste must be greater than 1500 k Cal/kg or 7 MJ/kg otherwise the plant will not be feasible [
4].
The average low calorific value must be greater than 2400 Cal/kg or 10 MJ/kg to have independent combustion without any other fuel [
12].
Waste should not be less than 50,000 metric tons/year [
4].
2.3.2. Model 2
Theoretical calculations have been performed on the basis of the collected waste. Proximate analysis was used to calculate the moisture, ash, and combustible contents of the samples. H
awf was used from
Table 1,
Table 2 and
Table 3 provided by the World Bank report, and H
inf was calculated by the formula below [
4]:
where, H
inf = inferior calorific value in kJ/kg; H
awf = ash and water free calorific value in kJ/kg; C = combustible content by weight.
A comparison of all mentioned landfill sites with respect to their energy potential is depicted in
Figure 6.
3. Results and Discussion
Model 1: According to the Tanner diagram, only Jam Chakro and Gond Pass waste qualifies for successful input to an MSW plant that would not require any other fuel and would have a calorific value around 13 MJ, which in terms of Kcal is around 3100 Kcal. Sabzi Mandi which has a higher moisture content fails to meet the criteria. Other alternatives must be adopted to tap into the biomass potential at Sabzi Mandi.
Model 2: According to research, Jam Chakro and Gond Pass are ideal locations for the installation of WtE plant because at these locations there is no need for additional fuel for incineration. Moreover, calorific values of waste are also in the sustainable range.
Sabzi Mandi is disqualified for MSW power generation by incineration because of a low calorific value. Other methods, such as composting and gasification, should be applied to tap into the potential of waste with high moisture and a low calorific value.
The yearly waste production of Karachi is around 4.4 million tons, which is well above the required output for a feasible plant.
In Karachi, the present state of municipal solid waste management is very poor. In all four districts of the city, a municipal corporation collects waste and transports it to landfill sites under the supervision of the Sindh Municipal Authority. Due to high population density, these landfill sites provide inadequate space for dumping and this ultimately compels the government and relevant authorities to find alternatives. In recent years, dumping extra waste to sea and other water bodies has been an attractive alternative. To cope with the low availability of space, waste is collected from selected places and elsewhere the waste keeps on accumulating, for as long as a month, leading to fatal diseases.
The proposed solution can be vital for policy makers. To deal with the above mentioned issues, the Sindh Government should appreciate further studies and make appropriate amendments to policies. Collected waste, with high energy potential, should not be dumped into landfill sites nor to water bodies and rather should be used to produce energy.
4. Energy Generation Potential
4.1. System Description
There are four ways to use waste to power a plant: gasification, anaerobic digestion, plasma incineration, and incineration. Gasification involves producing “syngas,” a gas that could be burnt to generate heat to run a plant, while incineration is the direct burning of waste to generate heat to run a plant [
17]. We will work with combustion or WtE plant systems as it is more economical on a large scale and deals with two problems in one go, i.e., power generation and waste disposal. The waste to energy plant is a conventional steam power plant with waste used as a fuel. The incineration of waste produces high-temperature combustion gases which heat water and steam in the boiler to saturated and ultimately superheated steam. This superheated steam is then expanded in the steam turbine, which works mechanically. This mechanical work is used as the input to the generator, which then gives electrical energy as an output. The US environment protection agency has also labeled WtE as one of the cleanest sources of energy today [
7]. One metric ton of MSW in the U.S.A. generates about 600 kWh of electricity. This means that 4 tons of waste produces roughly the same amount of energy as 1 ton of oil or 1.6 tons of coal [
15]. The schematic of the power cycle of a WtE plant is illustrated in
Figure 7.
4.2. Thermodynamic Analysis
The energy potential and electricity generation capacity of the biggest landfill site in Karachi, Jam Chakro, can be calculated through the following parameters:
Incineration rate = 78.70%
Average utility factor = 70% [
18]
Calorific value = 3000 Kcal/kg
Waste produced = 8000 ton/day
Average plant efficiency = 25% [
19]
Electricity generation capacity = 121.9 MW
A 100 MW WTE plant is, therefore, proposed at Jam Chakro. The following design parameters are considered for the analysis of the plant:
The system is based on the Rankine cycle
Sub-critical pressure and temperature are used
Boiler pressure = 150 Bar [
20]
Boiler temperature = 500 °C [
20]
Condenser pressure = 0.30 bar
Feed-water heater temperature = 150 °C
Actual turbine output = 100 MW
Turbine efficiency = 40%
Boiler efficiency = 80%
Pumps isentropic efficiency = 80%
Using water and steam thermodynamic tables, enthalpy, entropy, and specific volume of each state is calculated. Mass and energy balance is applied to each component to determine the
,
,
, and
. All the depicted equations are described in detail in reference [
21].
For a general steady flow system, the energy balance can be written as:
= 69.56 MW
= 540.4 MW
= 95.46 KW
= 3.209 MW
= 363.2 MW
5. Conclusions
MSW is currently generated at about 12,000 tons/day in Karachi. This study elucidates the MSW based energy potential of Karachi to provide a final destination for MSW and to cope with drastic energy deficits in the domestic and industrial sectors of Pakistan. Due to the unavailability of data, the power potential from MSW, which is a renewable source, has been overlooked in Pakistan. In this study, a viable power plant operating on the basic Rankine cycle is proposed. Boiler and condenser pressures and the power output of the turbine were decided and fixed, while the other parameters were embraced from the OEM catalogs. Other data, such as state parameters and plant inputs and outputs were calculated using assumptions. If adopted, the proposed plant could potentially be a financially profitable venture. Moreover, the findings of this study declare Jam Chakro a meritorious landfill site for a WtE plant, although it proved unmeritorious in previous studies. The main advantage of the proposed plant is, of course, generating electricity for the domestic and commercial sectors and such a plant at Jam Chakro processing 8000 tons of waste/day will produce 121.9 MW of electricity. The secondary benefits mainly include tackling overflowing landfill sites and a reduction in GHGs. From the statistical data, the concerned emissions are well below coal and modern equipment allows us to further control the toxins and particulate emissions to acceptable levels. This proposal is proven to be effective by reducing the deposition of waste, by tackling global warming, and by providing a sustainable form of energy. As already mentioned, the unavailability of data is a major issue in developing countries. This study is based on experimental values that can be used as a base for further studies. This study can be further expanded in the future by providing sustainable solution to the waste from the Sabzi Mandi landfill waste, which does not comply with the minimum requirements of a WtE plant.
Author Contributions
Conceptualization: M.M.S.; data curation: M.M.S. and M.N.N; formal analysis: M.M.S., M.N.N., and Y.A.W.; investigation: M.M.S., M.N.N., and Y.A.W.; methodology: M.M.S. and M.N.N.; project administration: M.M.S. and Y.A.W.; validation: M.M.S. and M.N.N.; visualization: M.M.S., M.N.N., and Y.A.W., N.A.H., Z.Z.C., and O.A.; resources: M.M.S. and M.N.N.; writing—original draft: M.N.N.; funding acquisition: M.R.J. and Y.A.W.; software: I.A.B., T.M.Y.K., and S.K.; writing—review and editing: M.M.S. and Y.A.W.; supervision: M.M.S. and Y.A.W.
Acknowledgments
The authors extend their appreciation to University of Malaya for funding this work under grant number RU001-2018 and ST030-2019.
Conflicts of Interest
The authors declare no conflict of interest.
References
- Governmnet, P. Block Wise Provisional Summary Results of 6th Population & Housing Census-2017; Pakistan Bureau of Statistics (PBS)-Govternment of Pakistan: Islamabad, Pakistan, 2018.
- Guriro, A. Garbage, Sewage Bigger Threat to Metropolis than Terrorism. Daiy Times. 2016. Available online: https://dailytimes.com.pk/62126/garbage-sewage-bigger-threat-to-metropolis-than-terrorism/ (accessed on 19 May 2018).
- Asrar, D.; Asrar, S.; Sufyan, F.; Alam, G.; Khan, N.A. Solid Waste Management-Incineration of Solid Waste of Karachi. Int. Conf. Energy Environ. Sustain. Dev. 2016, 149, 317–328. [Google Scholar]
- Rand, T.; Haukohl, J.; Marxen, U. Municipal Solid Waste Incineration A Decision Maker’s Guide. In Municipal Solid Waste Incineration: A Decision Maker’s Guide; The International Bank for Reconstruction and Development/THE WORLD BANK: Washington, DC, USA, 2000. [Google Scholar]
- Komilis, D.; Kissas, K.; Symeonidis, A. Effect of organic matter and moisture on the calorific value of solid wastes: An update of the Tanner diagram. Waste Manag. 2014, 34, 249–255. [Google Scholar] [CrossRef] [PubMed]
- Shahid, M.; Nergis, Y.; Siddiqui, S.A.; Choudhry, A.F. Environmental impact of municipal solid waste in Karachi city. World Appl. Sci. J. 2014, 29, 1516–1526. [Google Scholar]
- Eurostat. Manual on Waste Statistics: A Handbook for Data Collection on Waste Generation and Treatment; Publications Office of the European Union: Luxembourg, 2013.
- Psomopoulos, C.S.; Bourka, A.; Themelis, N.J. Waste-to-energy: A review of the status and benefits in USA. Waste Manag. 2009, 29, 1718–1724. [Google Scholar] [CrossRef] [PubMed]
- Maize, K. Energy from Waste: Greenhouse Gas Winner or Pollution Loser? Power 2016, 160, 59–62. [Google Scholar]
- Ahmed, K. Mastering the world of waste. Dawn, 2017. Available online: https://www.dawn.com/news/1321525/mastering-the-world-of-waste(accessed on 25 March 2018).
- Smith, C.; Whitty, K.; Quintero, M.; Ojeda, B.S. Opportunities for Energy Production from Solid Waste in the Mexicali Region. Annual Meeting of the American Institute of Chemical Engineers. 2007. Available online: https://aiche.confex.com/aiche/2007/techprogram/P103852.HTM (accessed on 19 May 2018).
- Korai, M.S.; Mahar, R.B.; Uqaili, M.A. The feasibility of municipal solid waste for energy generation and its existing management practices in Pakistan. Renew. Sustain. Energy Rev. 2017, 72, 338–353. [Google Scholar] [CrossRef]
- Sebastian, R.M.; Alappat, B. Thermal Properties of Indian Municipal Solid Waste Over the Past, Present and Future Years and Its Effect on Thermal Waste to Energy Facilities. Civ. Eng. Urban Plan. Int. J. 2016, 3, 97–106. [Google Scholar] [CrossRef]
- Governmnt of India. Manual on Municipal Solid Waste Management; Central Public Health and Environmental Engineering Organisation (Cpheeo-)Ministry of Urban Development: New Delhi, India, 2000.
- Pasek, A.D.; Gultom, K.W.; Suwono, A. Feasibility of Recovering Energy from Municipal Solid Waste to Generate Electricity. J. Eng. Technol. Sci. 2013, 45, 241–256. [Google Scholar] [CrossRef]
- Sebastian, R.M.; Kumar, D.; Alappat, B.J. A technique to quantify incinerability of municipal solid waste. Resour. Conserv. Recycl. 2019, 140, 286–296. [Google Scholar] [CrossRef]
- Shahzad, S.; Butt, A.; Anwar, S.; Ahmad, S.; Sarwar, T.; Asghar, N. Municipal Solid Waste as a Renewable Source of Energy: An Overview from the Lahore District in Punjab, Pakistan. Polish J. Environ. Stud. 2017, 26, 2721–2729. [Google Scholar] [CrossRef]
- Kusuda, T. Waste to Energy Project in Japan; J-Power Budapest Office Electric Power Development Co., Ltd.: Tokyo, Japan, 2011. [Google Scholar]
- Honorio, L.E.; Bartaire, J.-G.; Bauerschmidt, Z.; Ohman (fin), R.; Tihanyi (hu), T.; Dezeinhofer (at), V.; Scowcroft, H.; Janeiro, J.F. Efficiency in Electricity Generation; VGB PowerTech e.V.: Essen, Germany, 2003; Available online: https://wecanfigurethisout.org/ENERGY/Web_notes/Bigger%20Picture/Where%20do%20we%20go%20-%20Supporting%20-%20Files/Efficiency%20in%20Electricity%20Generation%20-%20EURELECTRIC.pdf (accessed on 19 May 2018).
- Power, G. Smarter, Cleaner, Steam Power. In 2017 Steam Power Systems Product Catalog; General Electric: Boston, MA, USA, 2017. [Google Scholar]
- Cengel, Y.A.; Boles, M.A. Thermodynamics: An Engineering Approach, 5th ed.; McGraw Hill: New York, NY, USA, 2006. [Google Scholar]
© 2019 by the authors. Licensee MDPI, Basel, Switzerland. This article is an open access article distributed under the terms and conditions of the Creative Commons Attribution (CC BY) license (http://creativecommons.org/licenses/by/4.0/).


 ,
, 


