Integration of Process Modeling, Design, and Optimization with an Experimental Study of a Solar-Driven Humidification and Dehumidification Desalination System


Abstract
:1. Introduction
2. Experimental Setup and Procedure
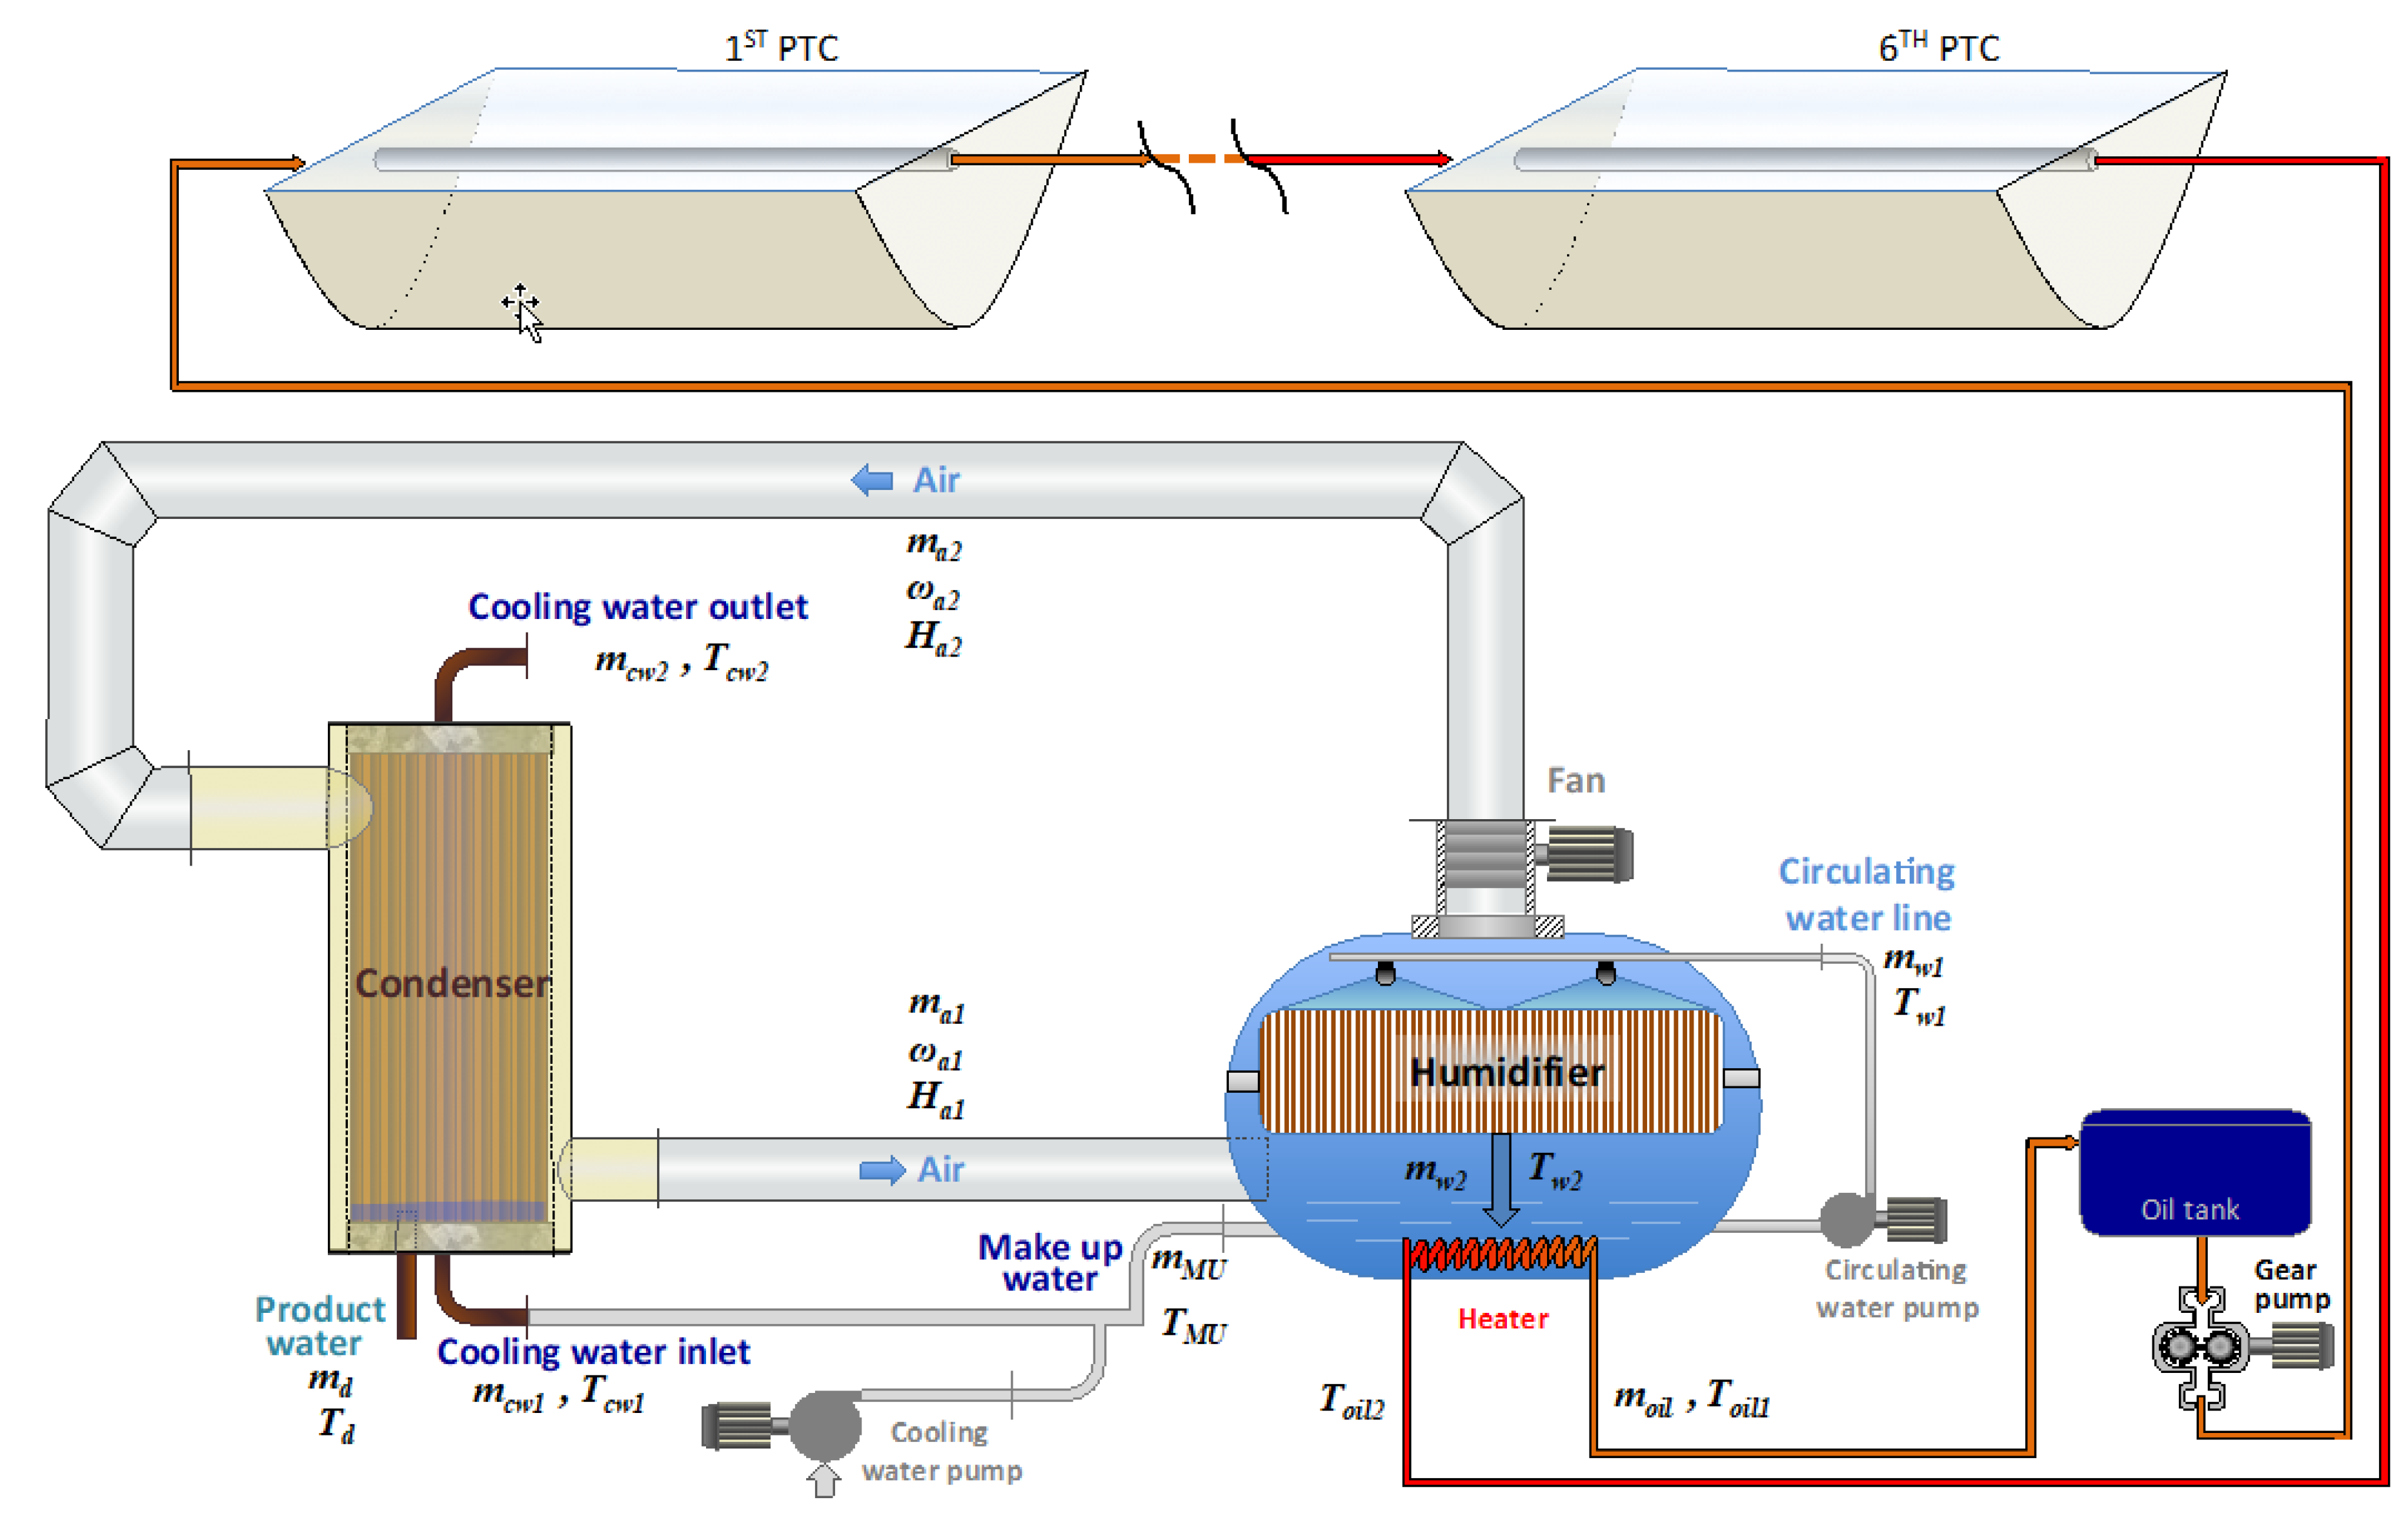
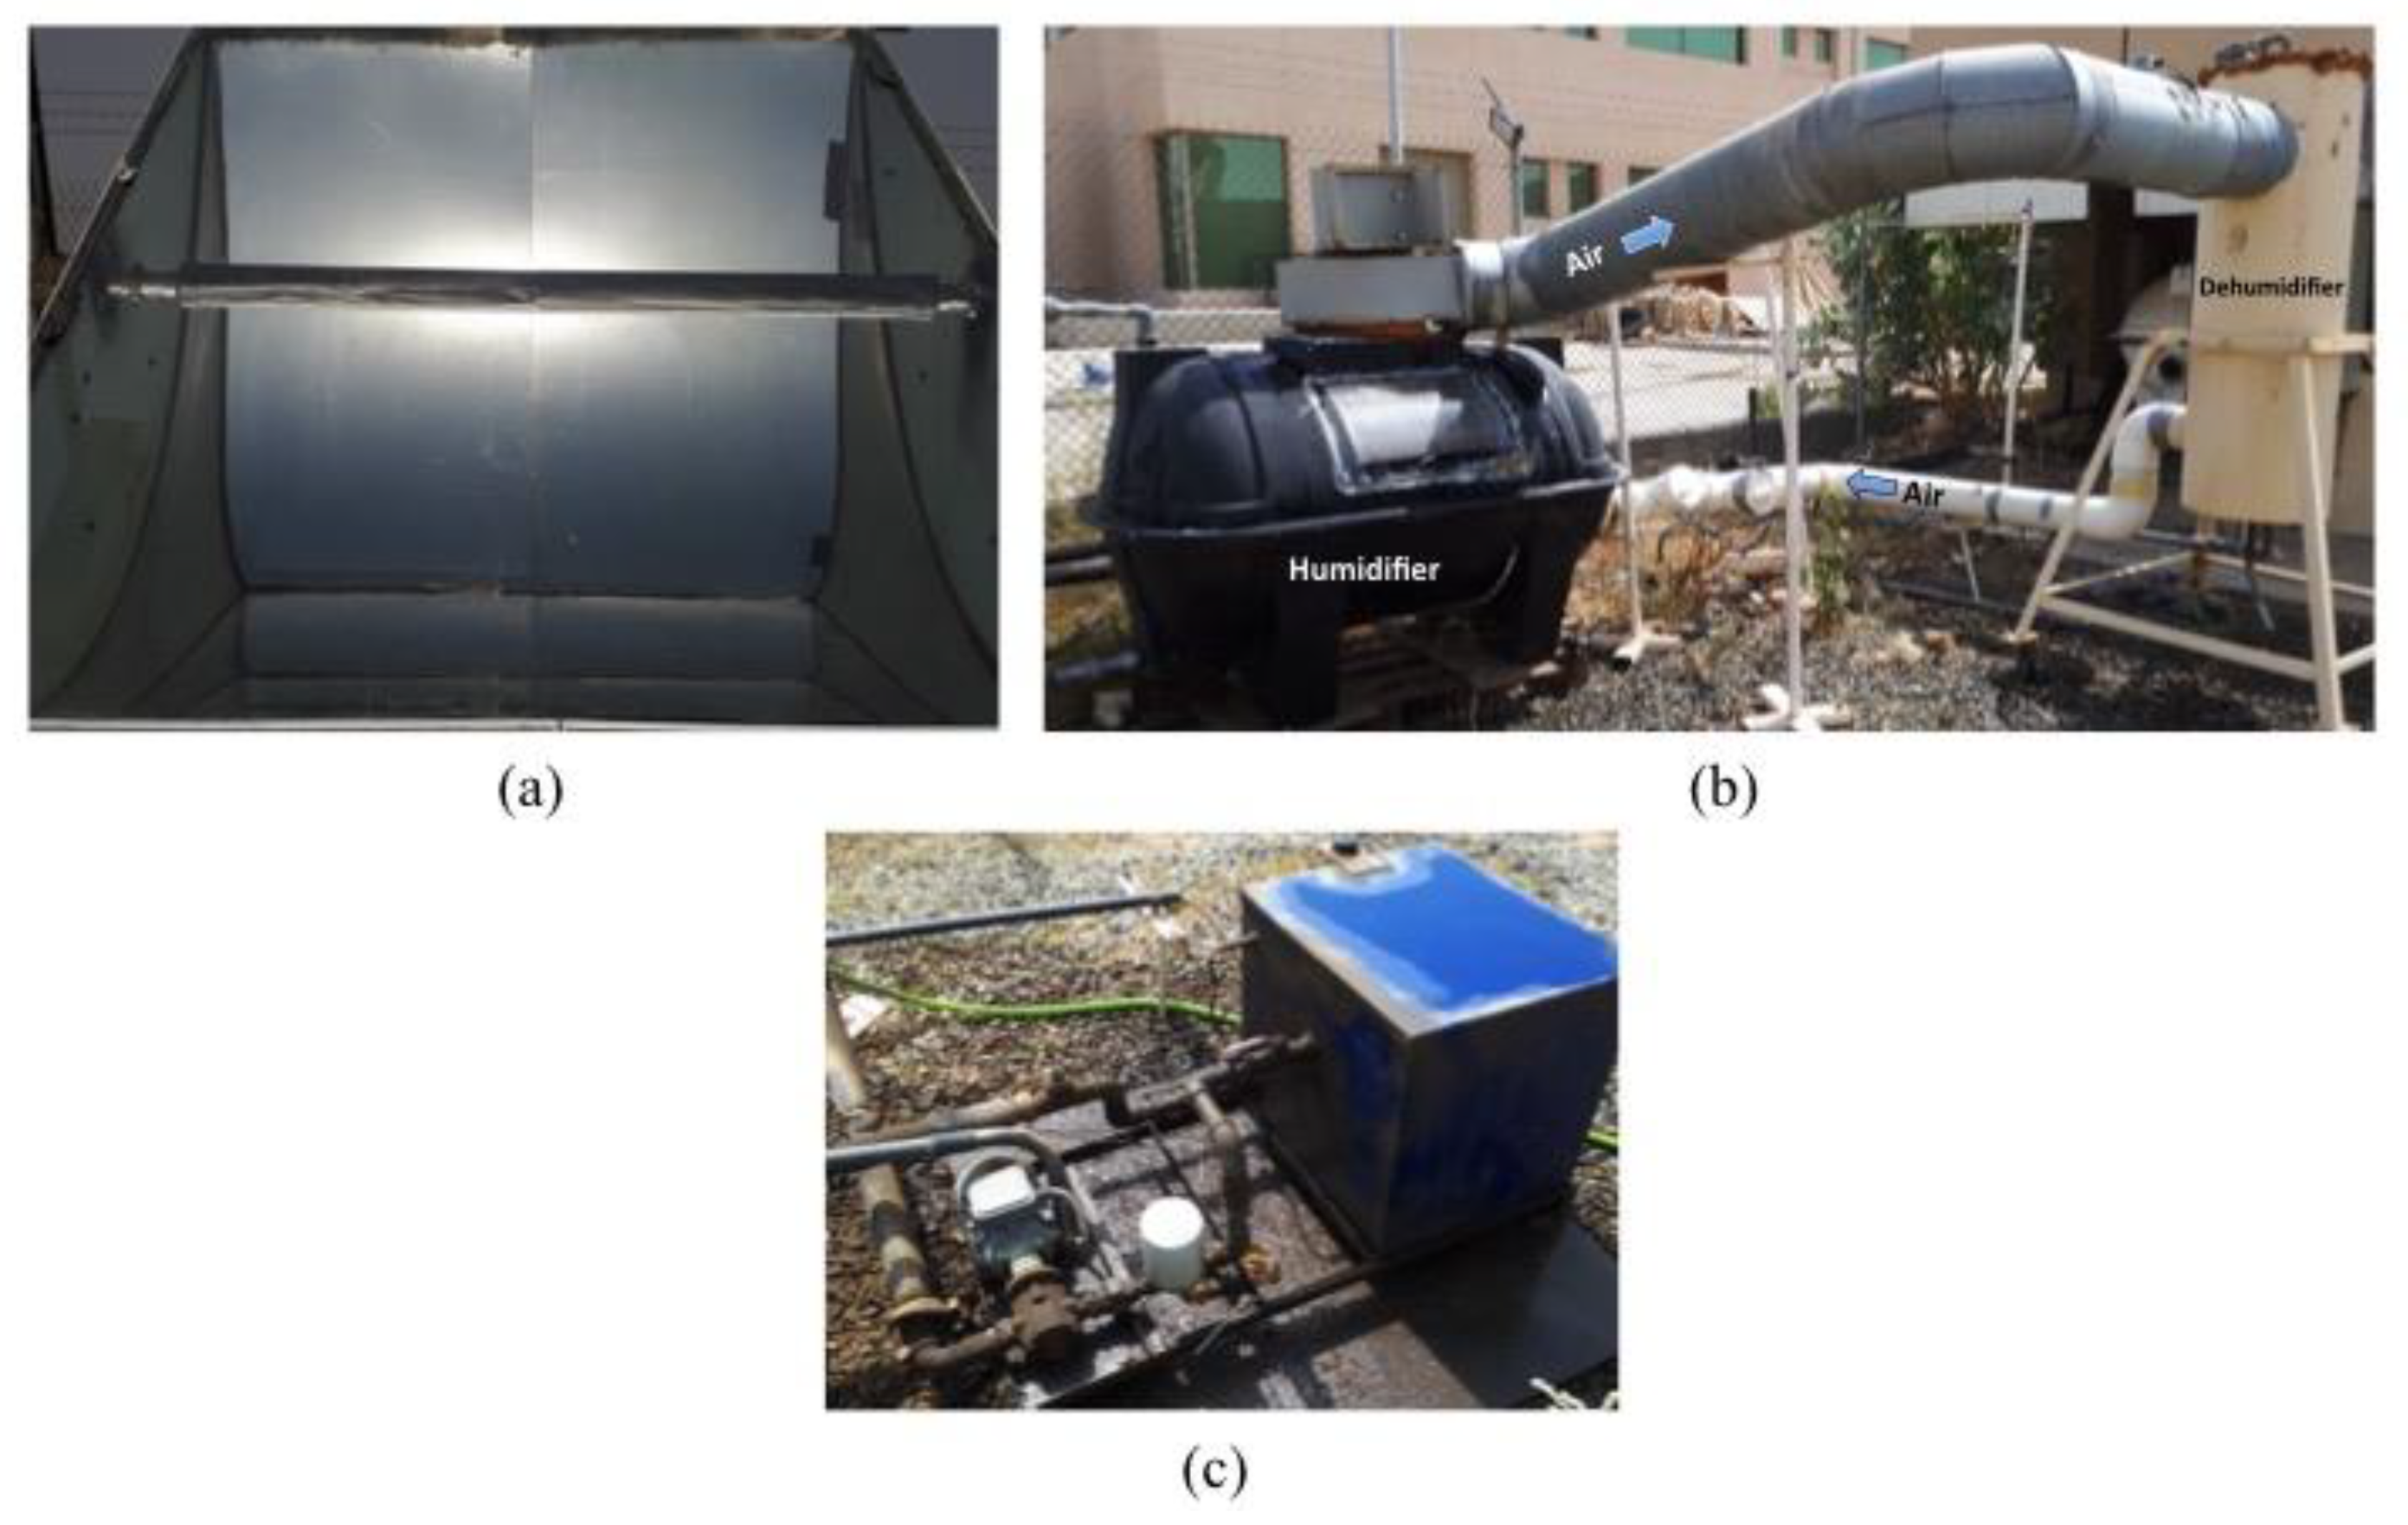
2.1. Experimental Setup
2.1.1. The Parabolic Concentrators
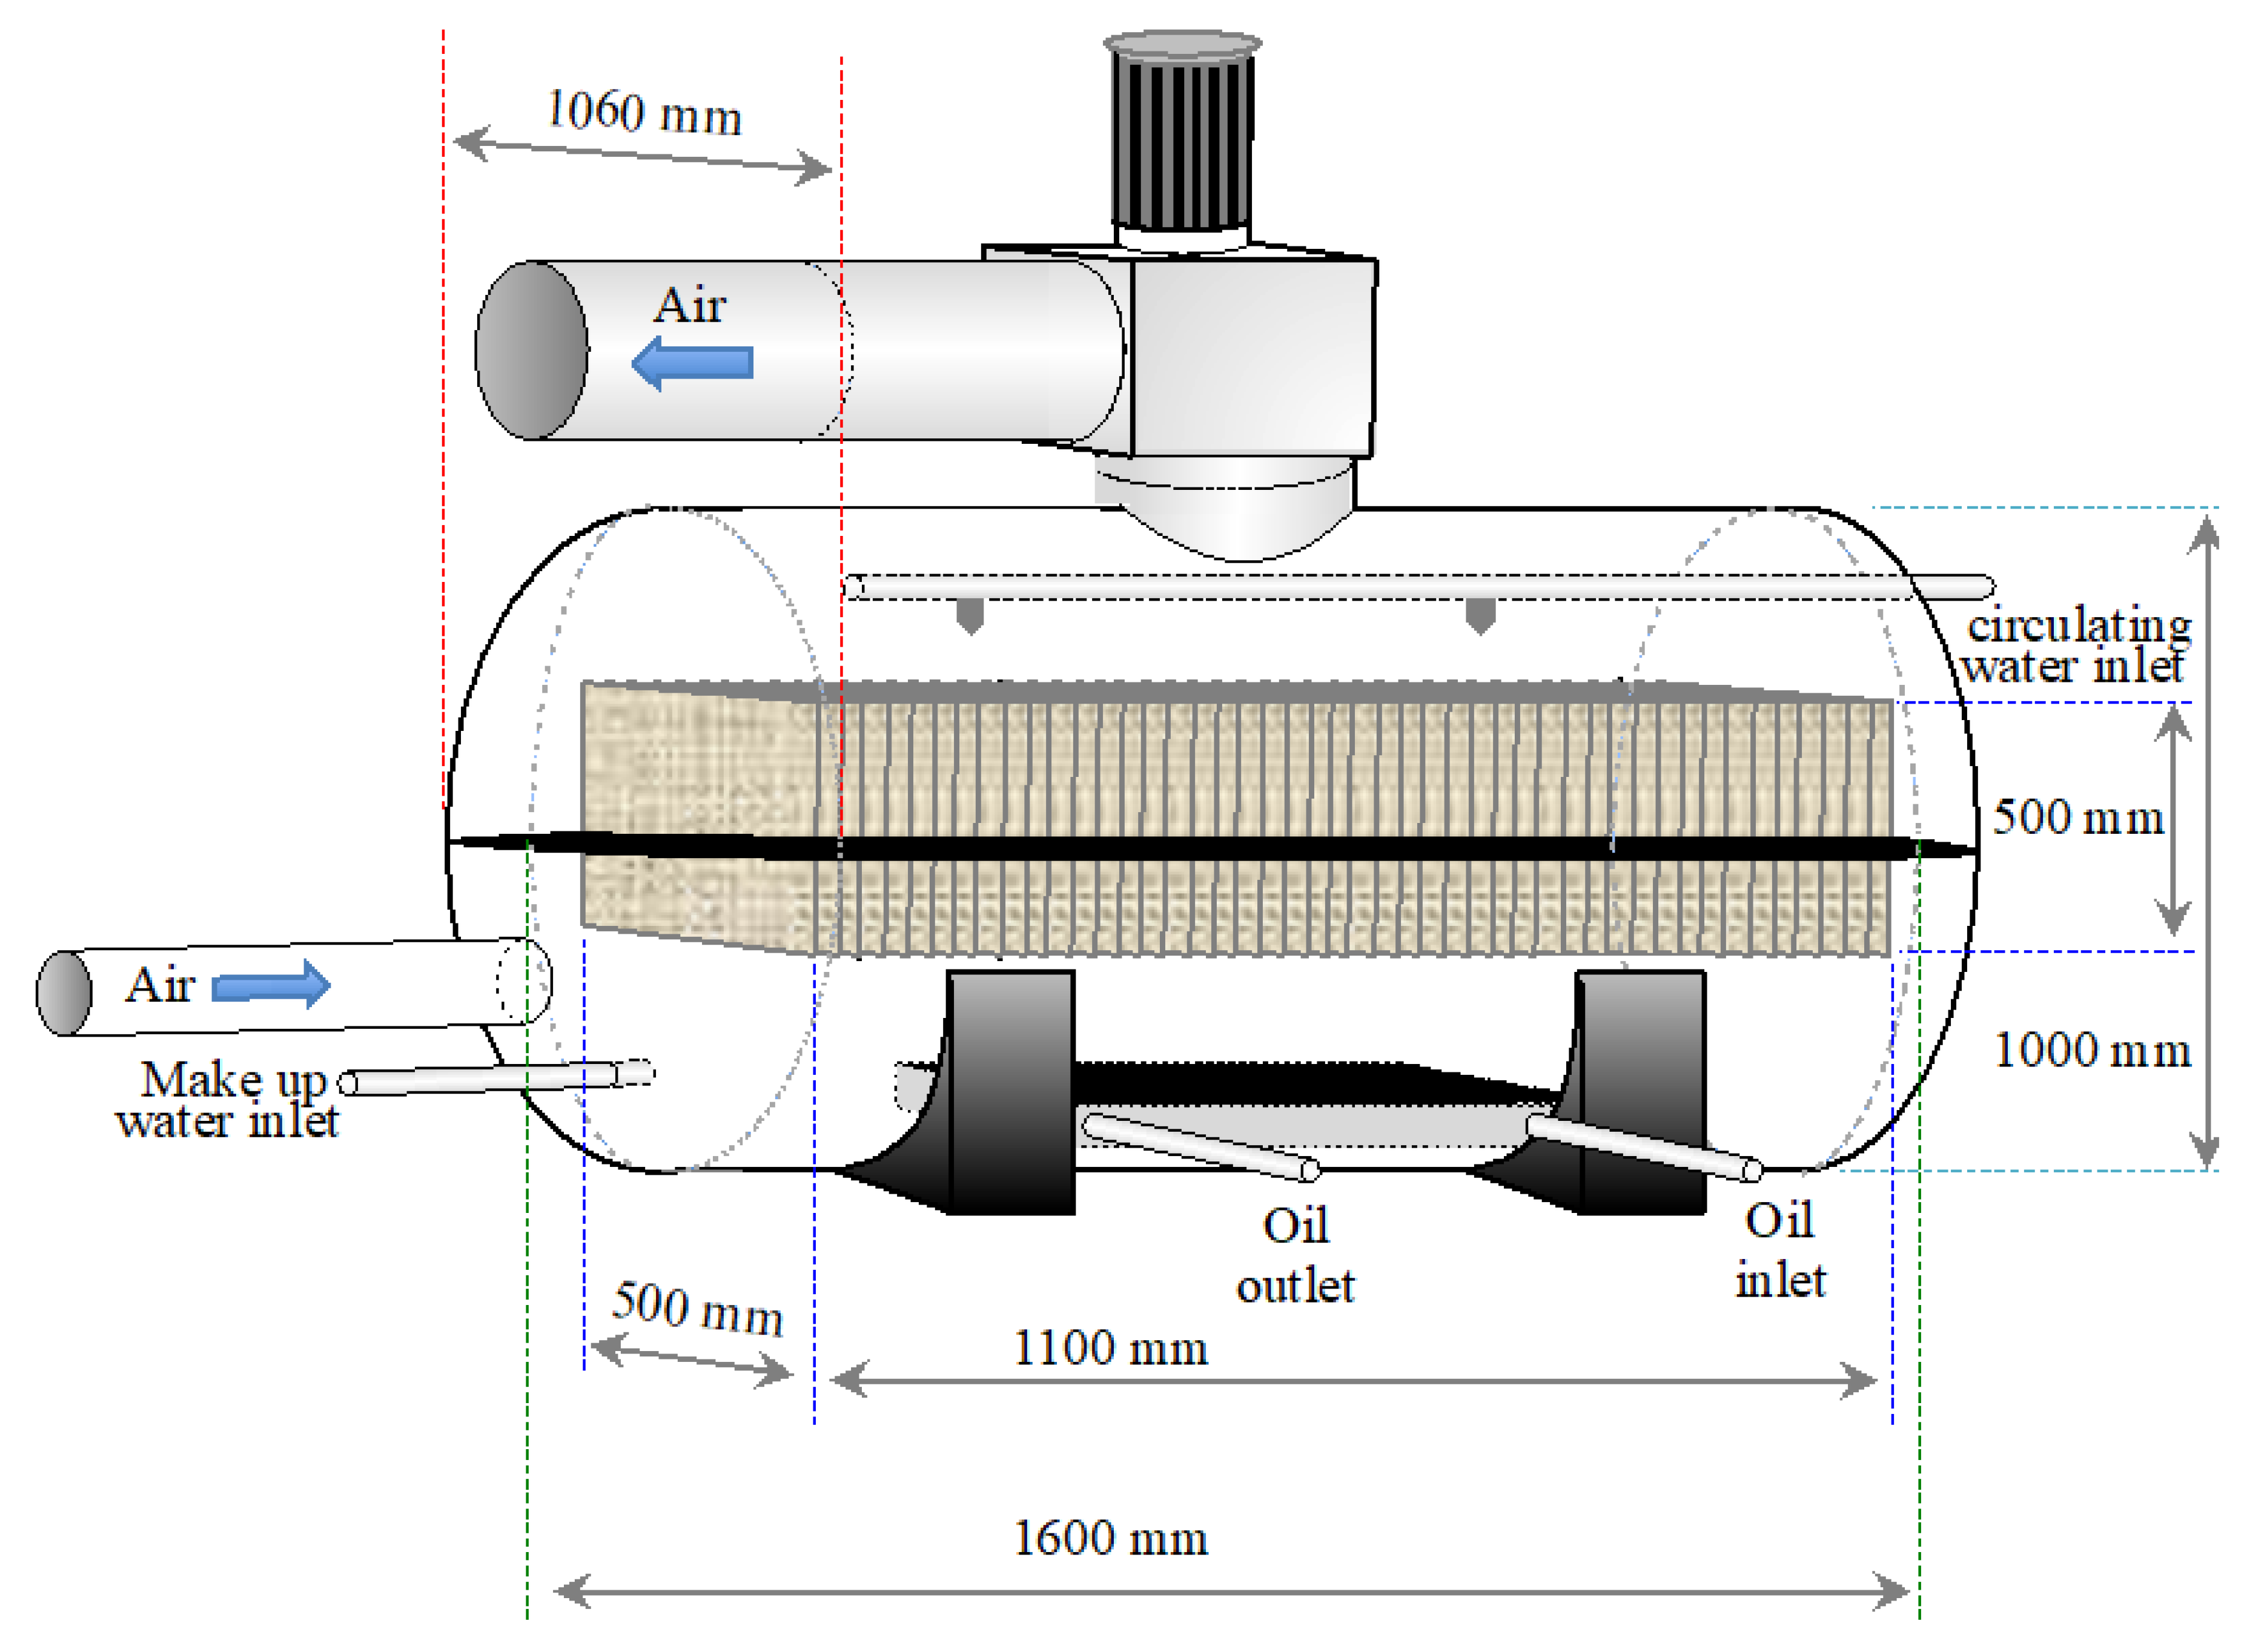
2.1.2. Humidification and Dehumidification Unit
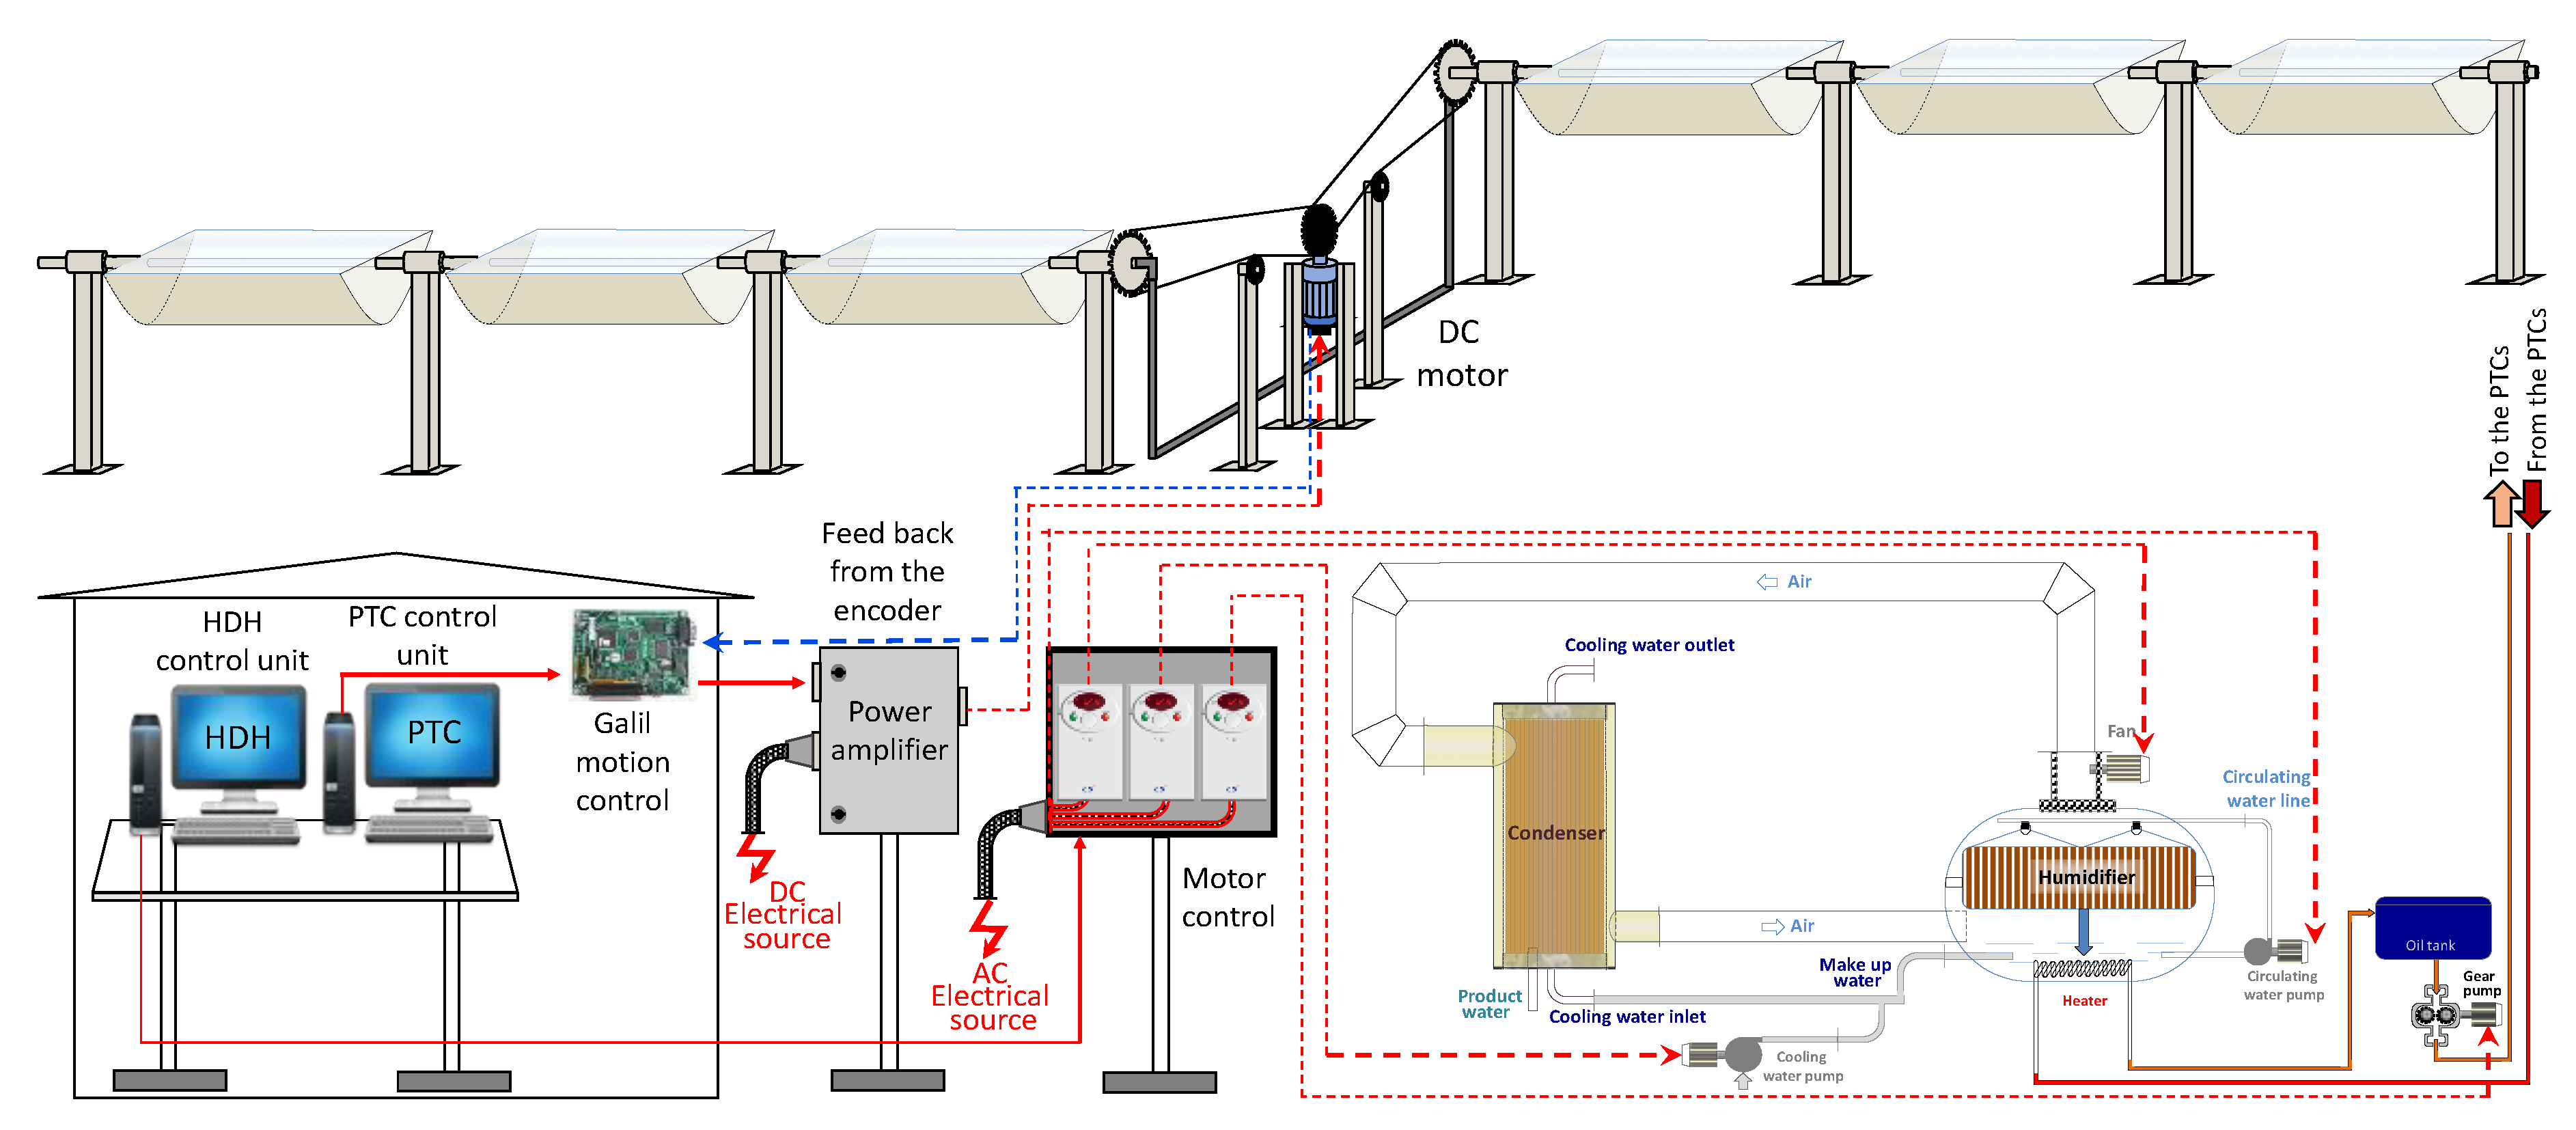
2.1.3. Measuring and Controls
2.2. Experimental Procedure
3. Experiment Analysis
- (1)
- Solar parabolic concentrator,
- (2)
- Humidifier,
- (3)
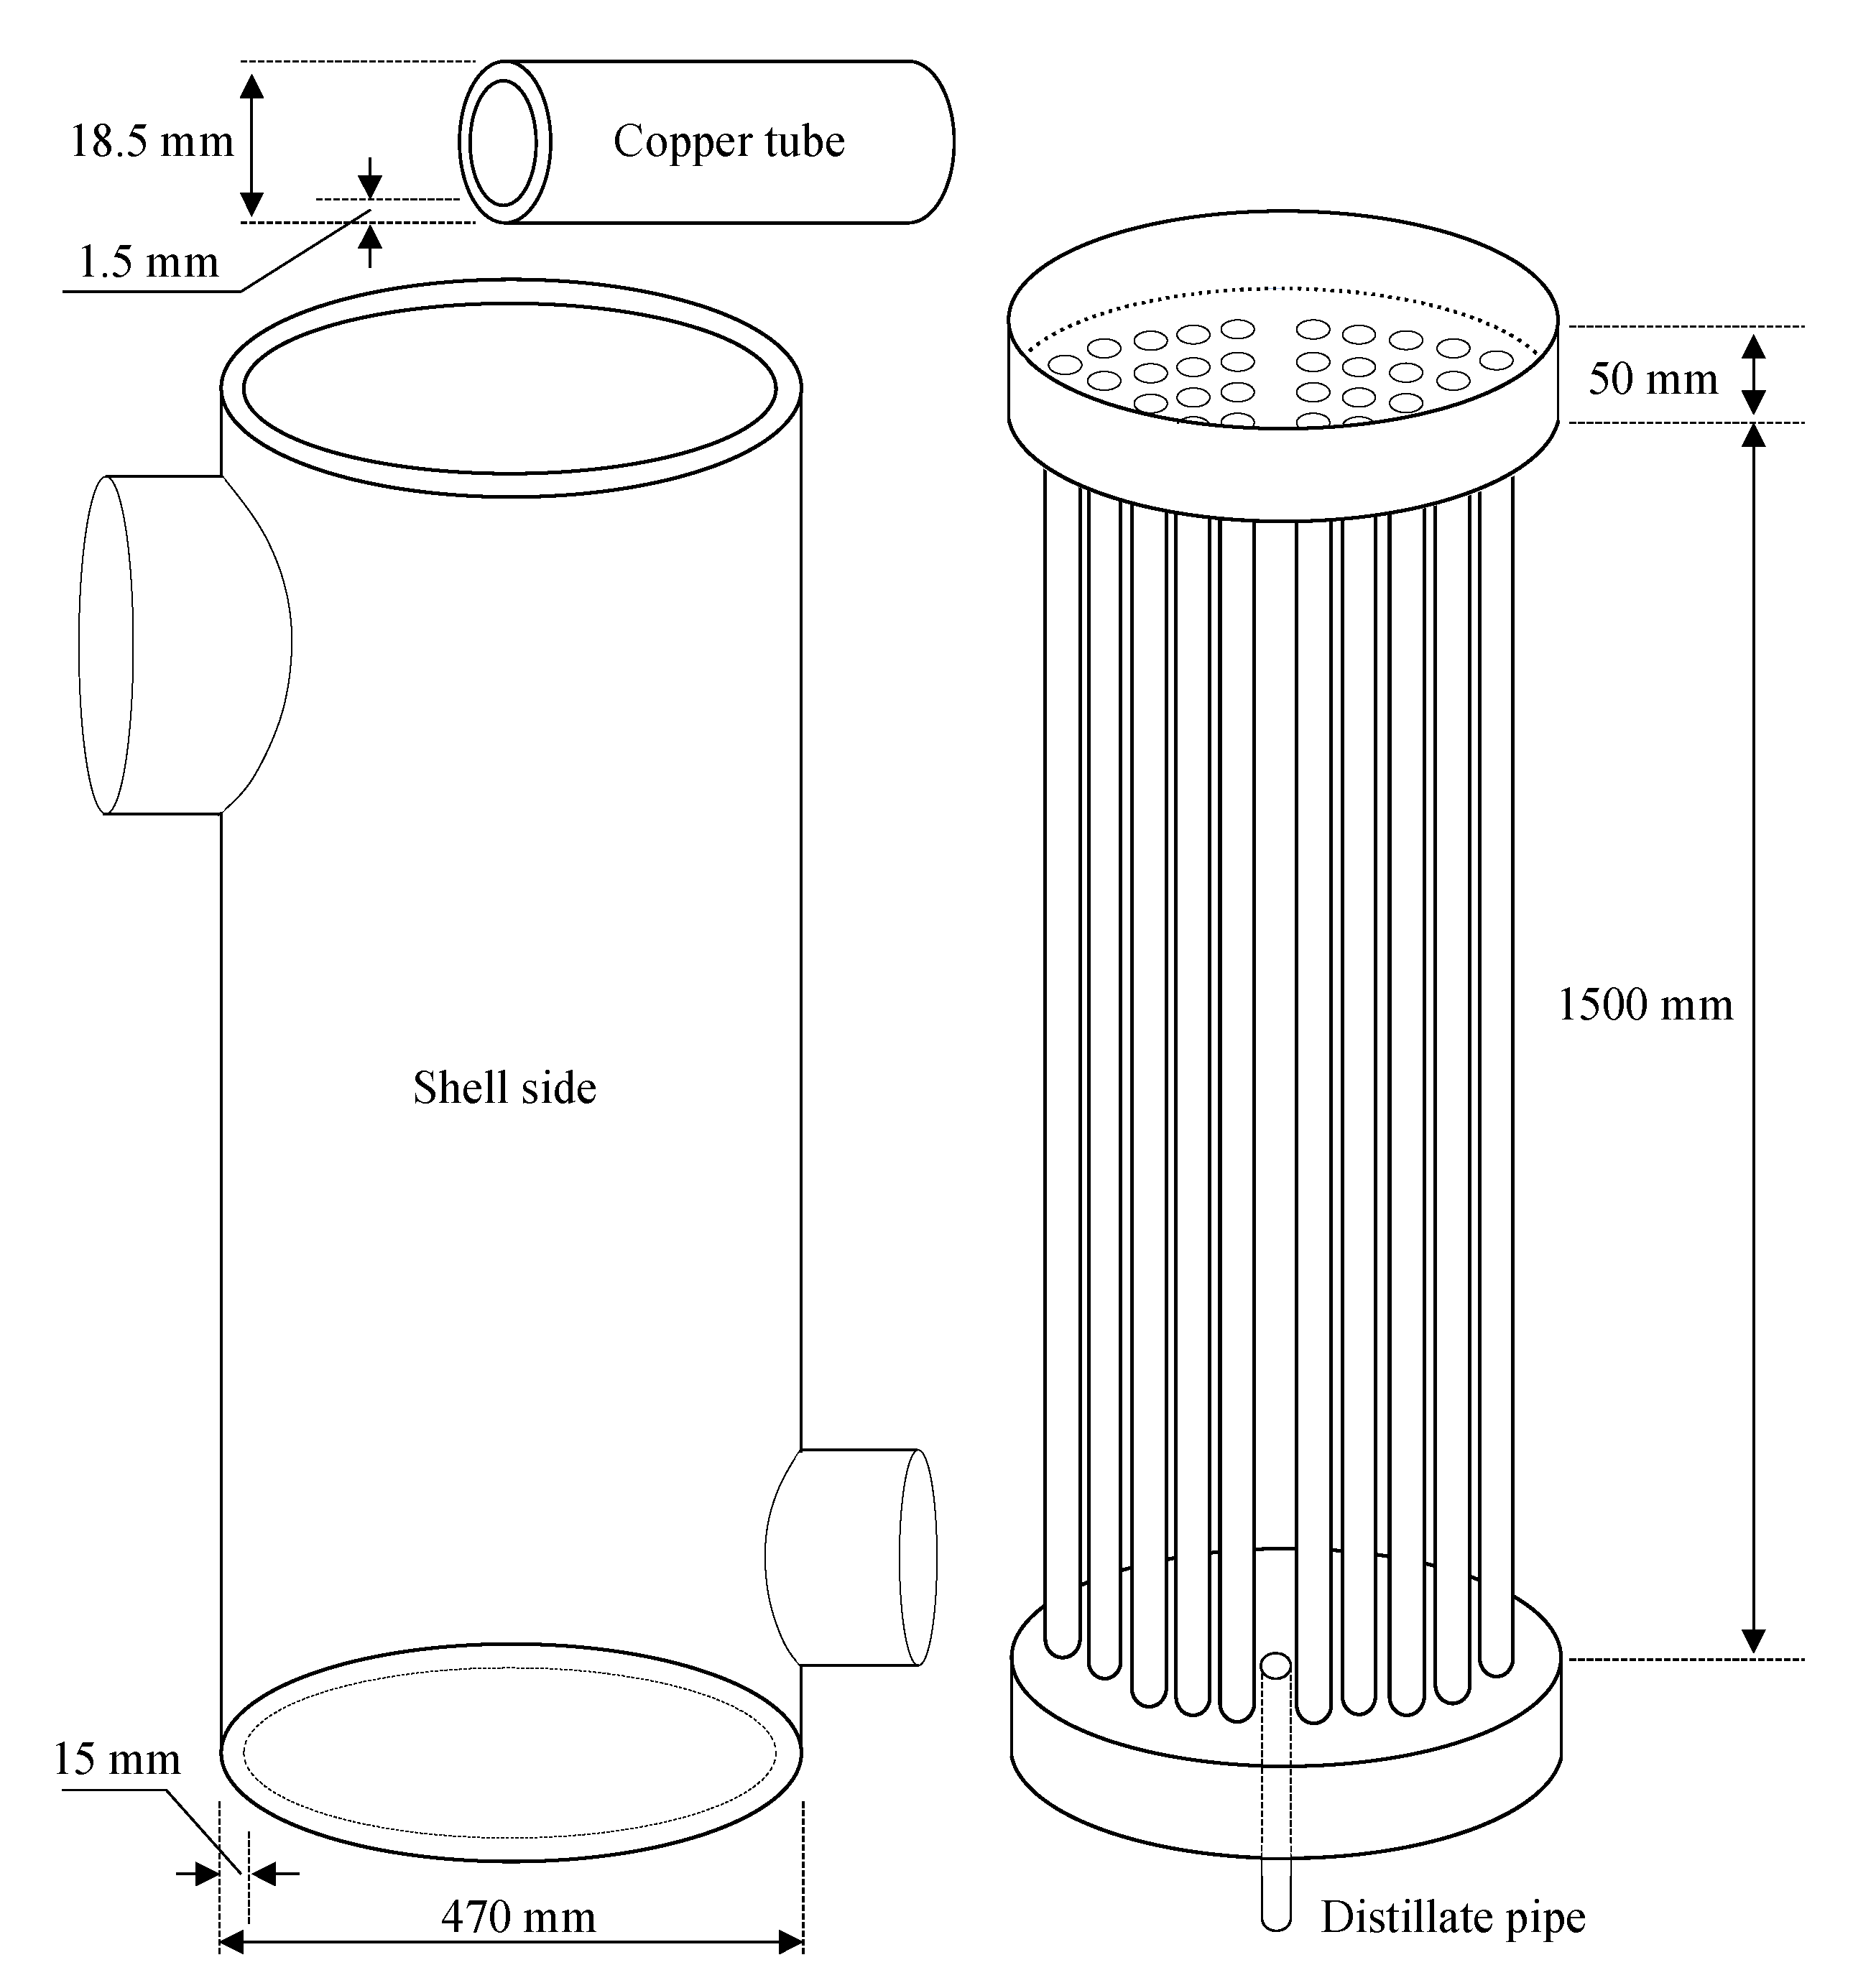
- Dehumidifier.
3.1. Parabolic Solar Collector
3.1.1. Solar Irradiance and Tracking Angles
- Latitude angle (L)
- Hour angle (h)
- Declination angle (δ)
- Altitude angel (α)
- Azimuth angle (ϕ)
- Surface azimuth angle (ϕs)
- Zenith angle (θz)
- The incident angle (θ)
3.1.2. Concentrator Thermal Analysis
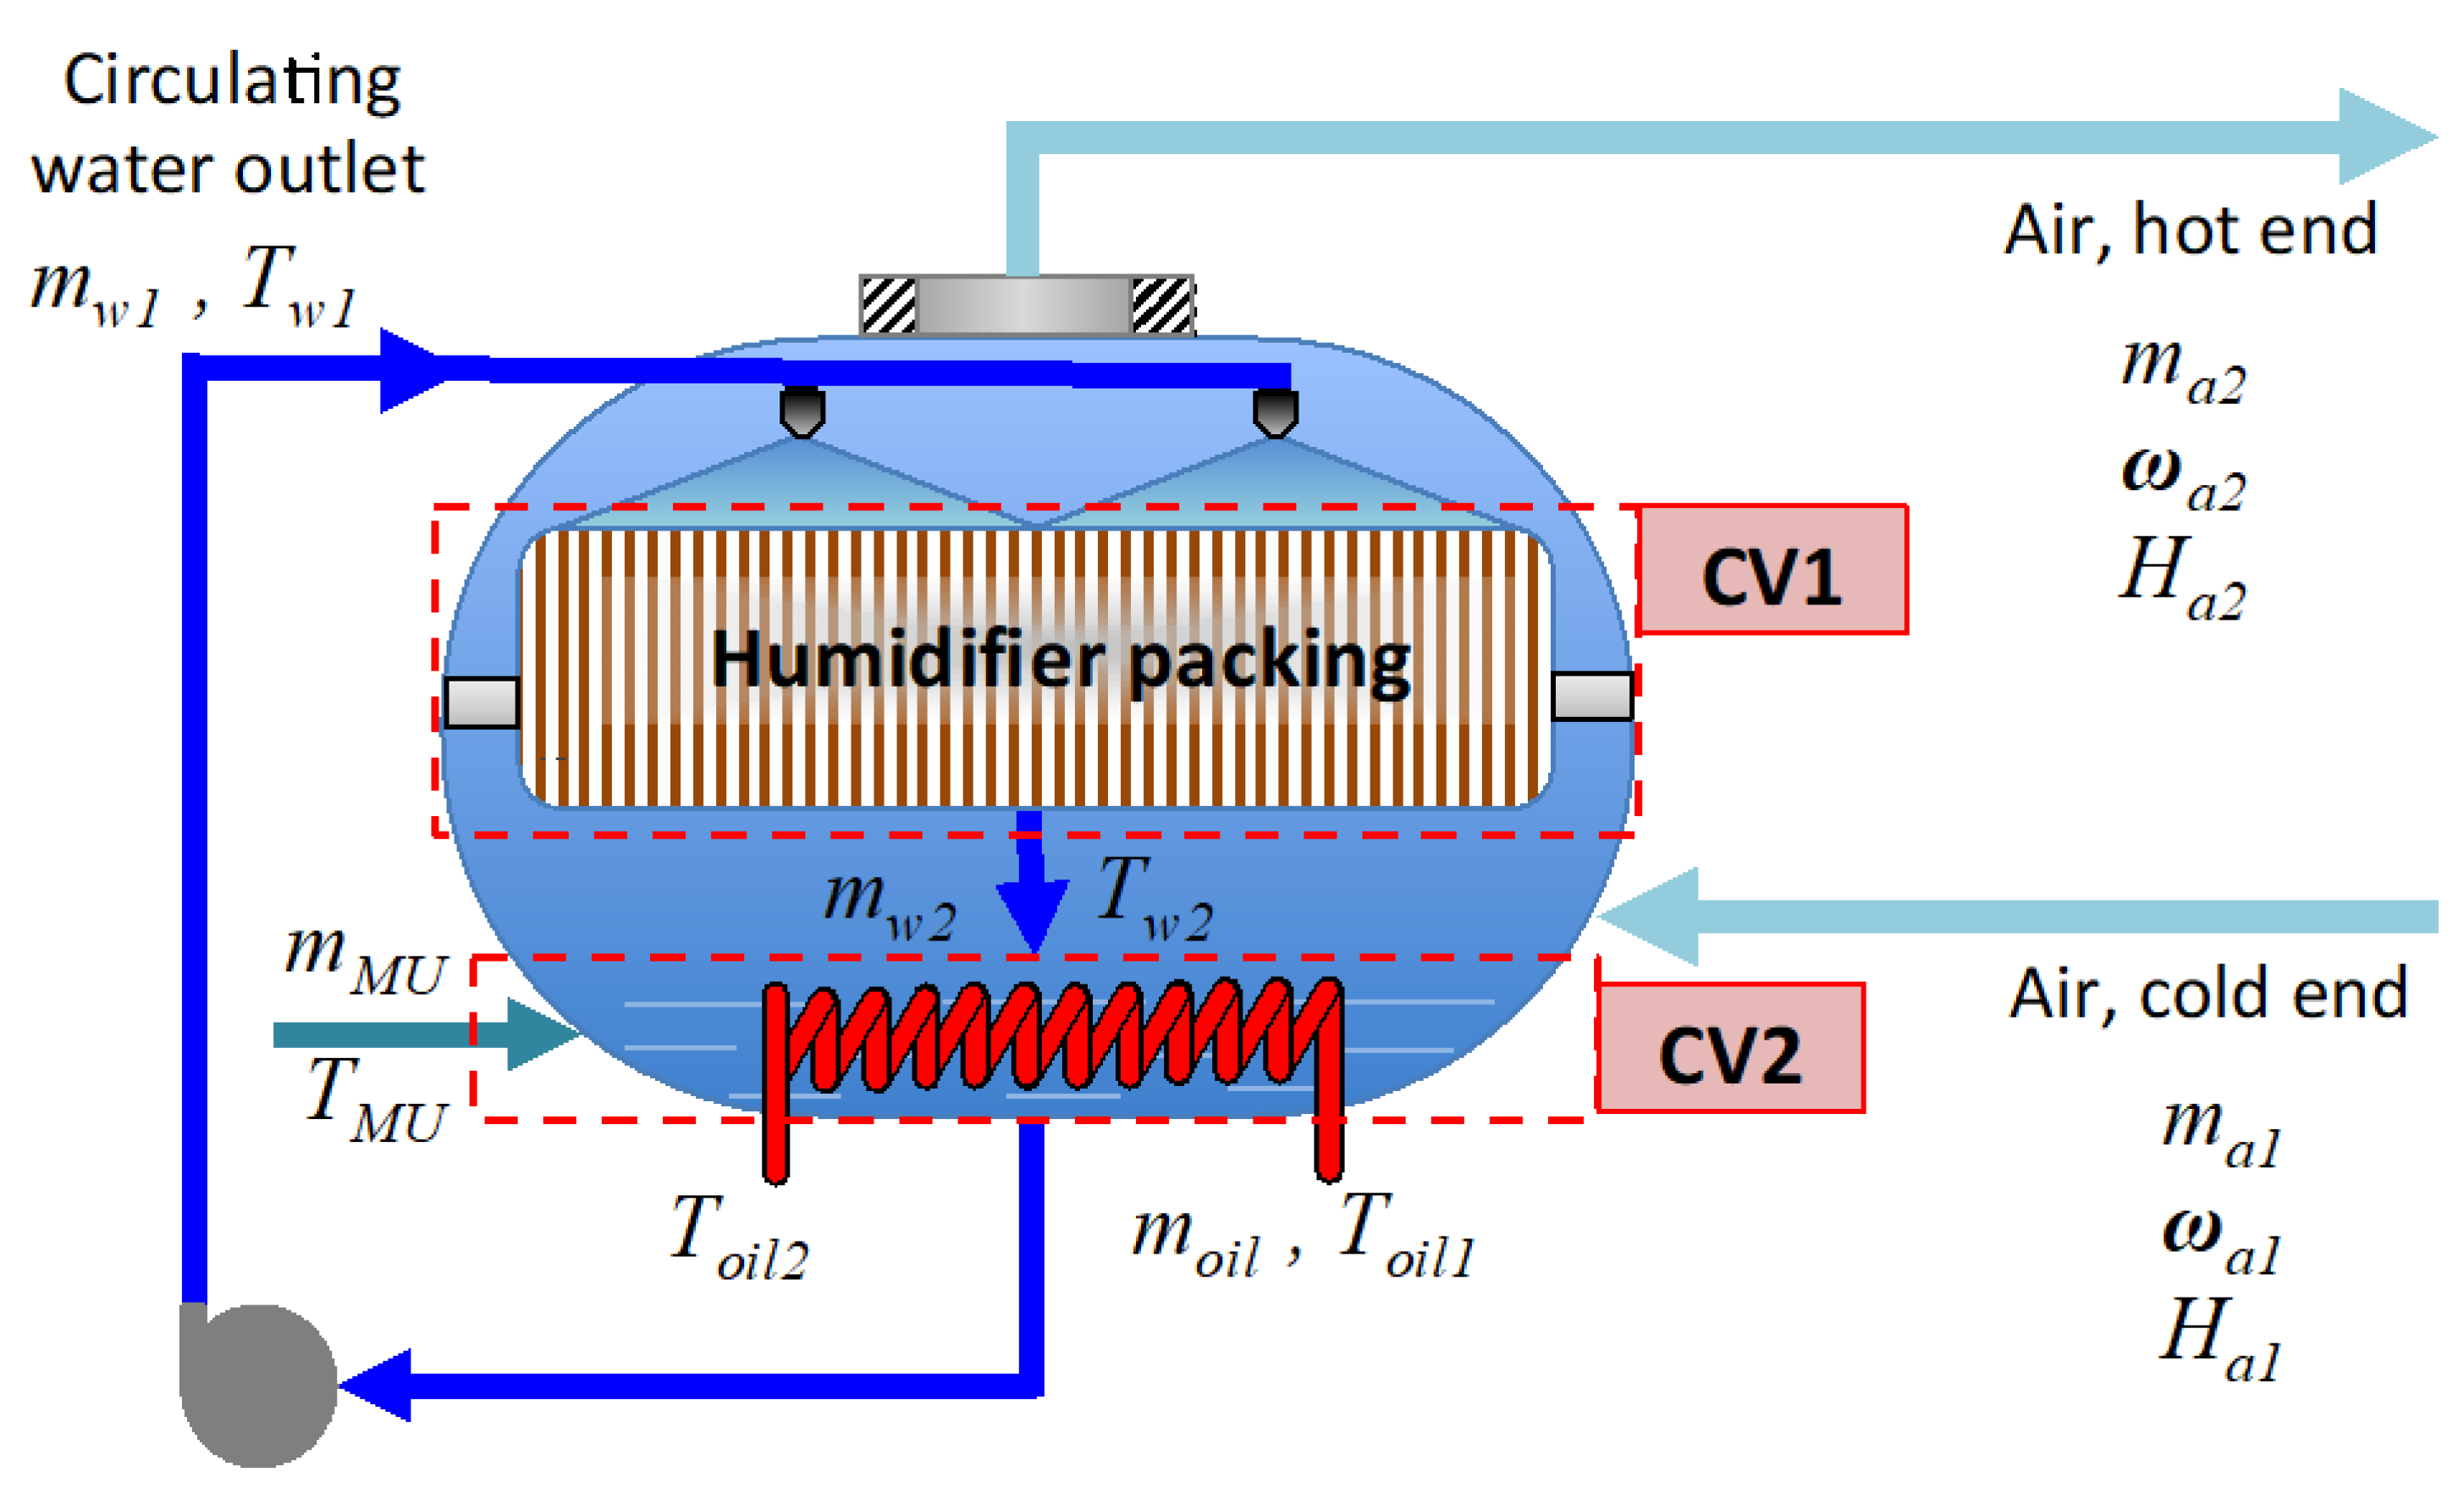
3.2. Humidifier
3.2.1. Humidifier Bottom Heater Section
3.2.2. Humidifier Packing Section
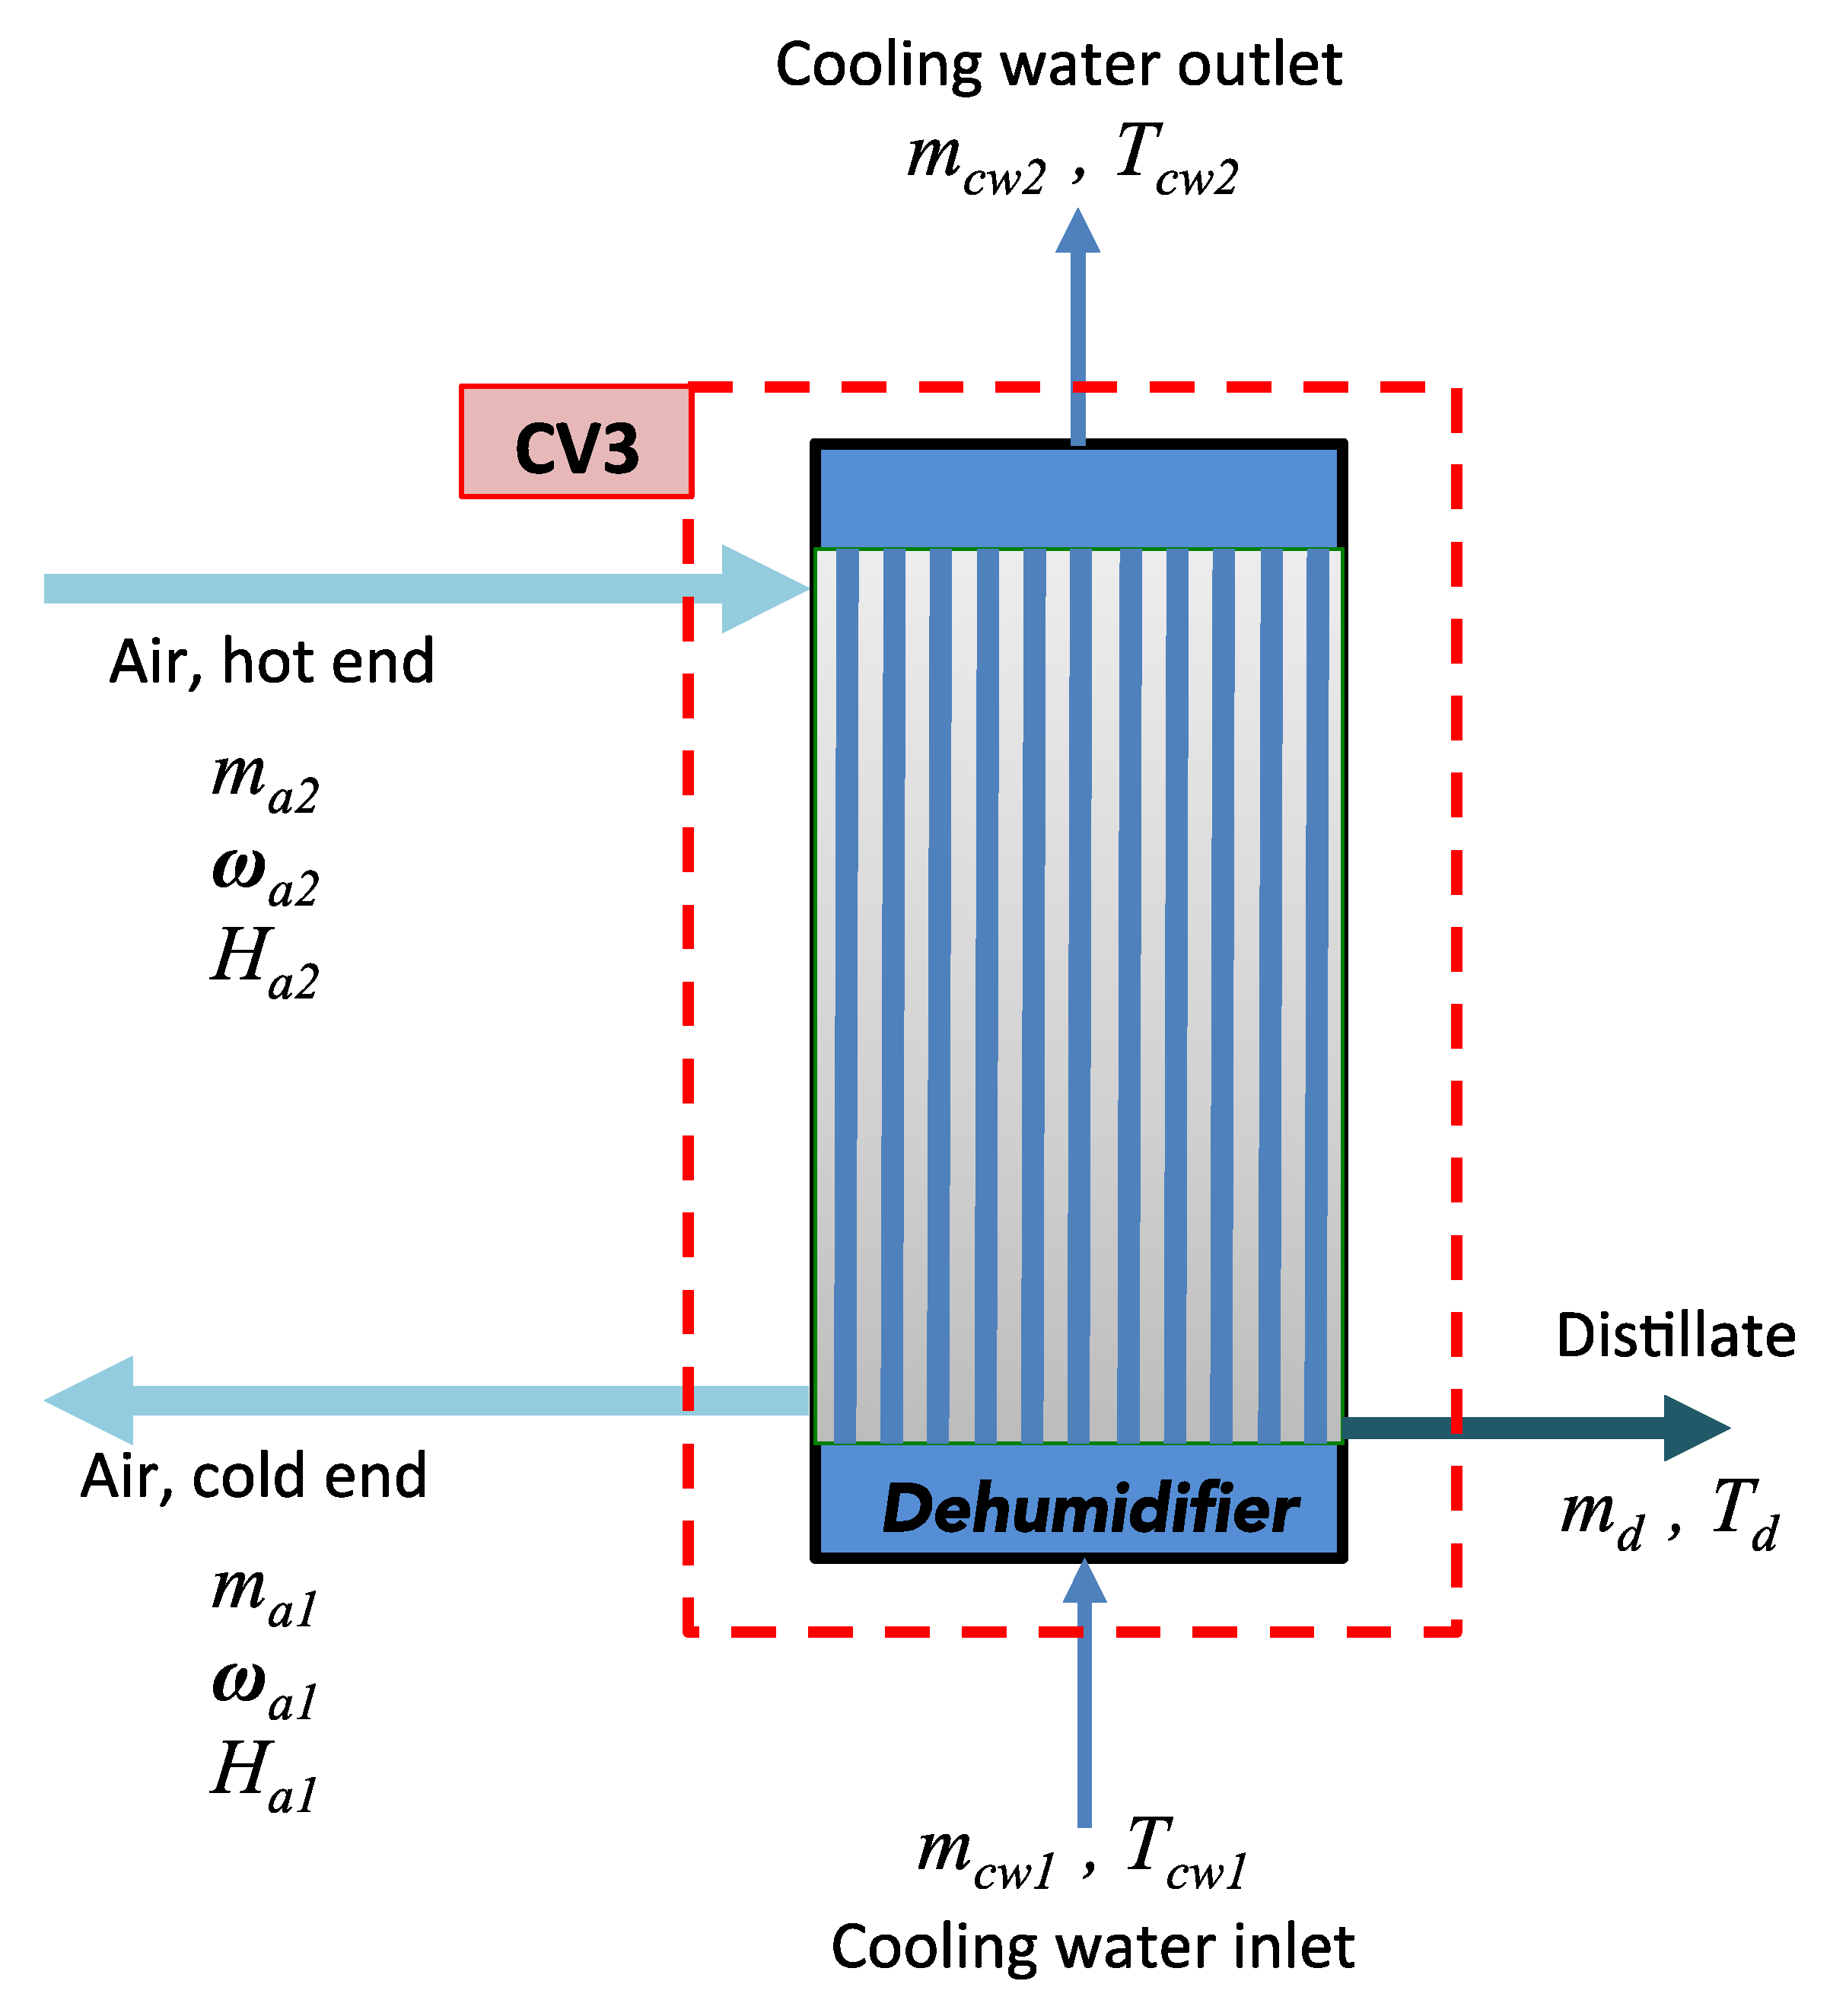
3.3. Dehumidifier
3.4. System Key Performance Parameters
3.4.1. Humidifier Efficiency
3.4.2. System Gain Output Ratio (GOR)
3.4.3. Humidifier Thermal Efficiency
3.4.4. Convective Heat and Mass Transfer Coefficients
3.5. Thermodynamic Relations
3.6. Process Economics
4. Results and Discussion
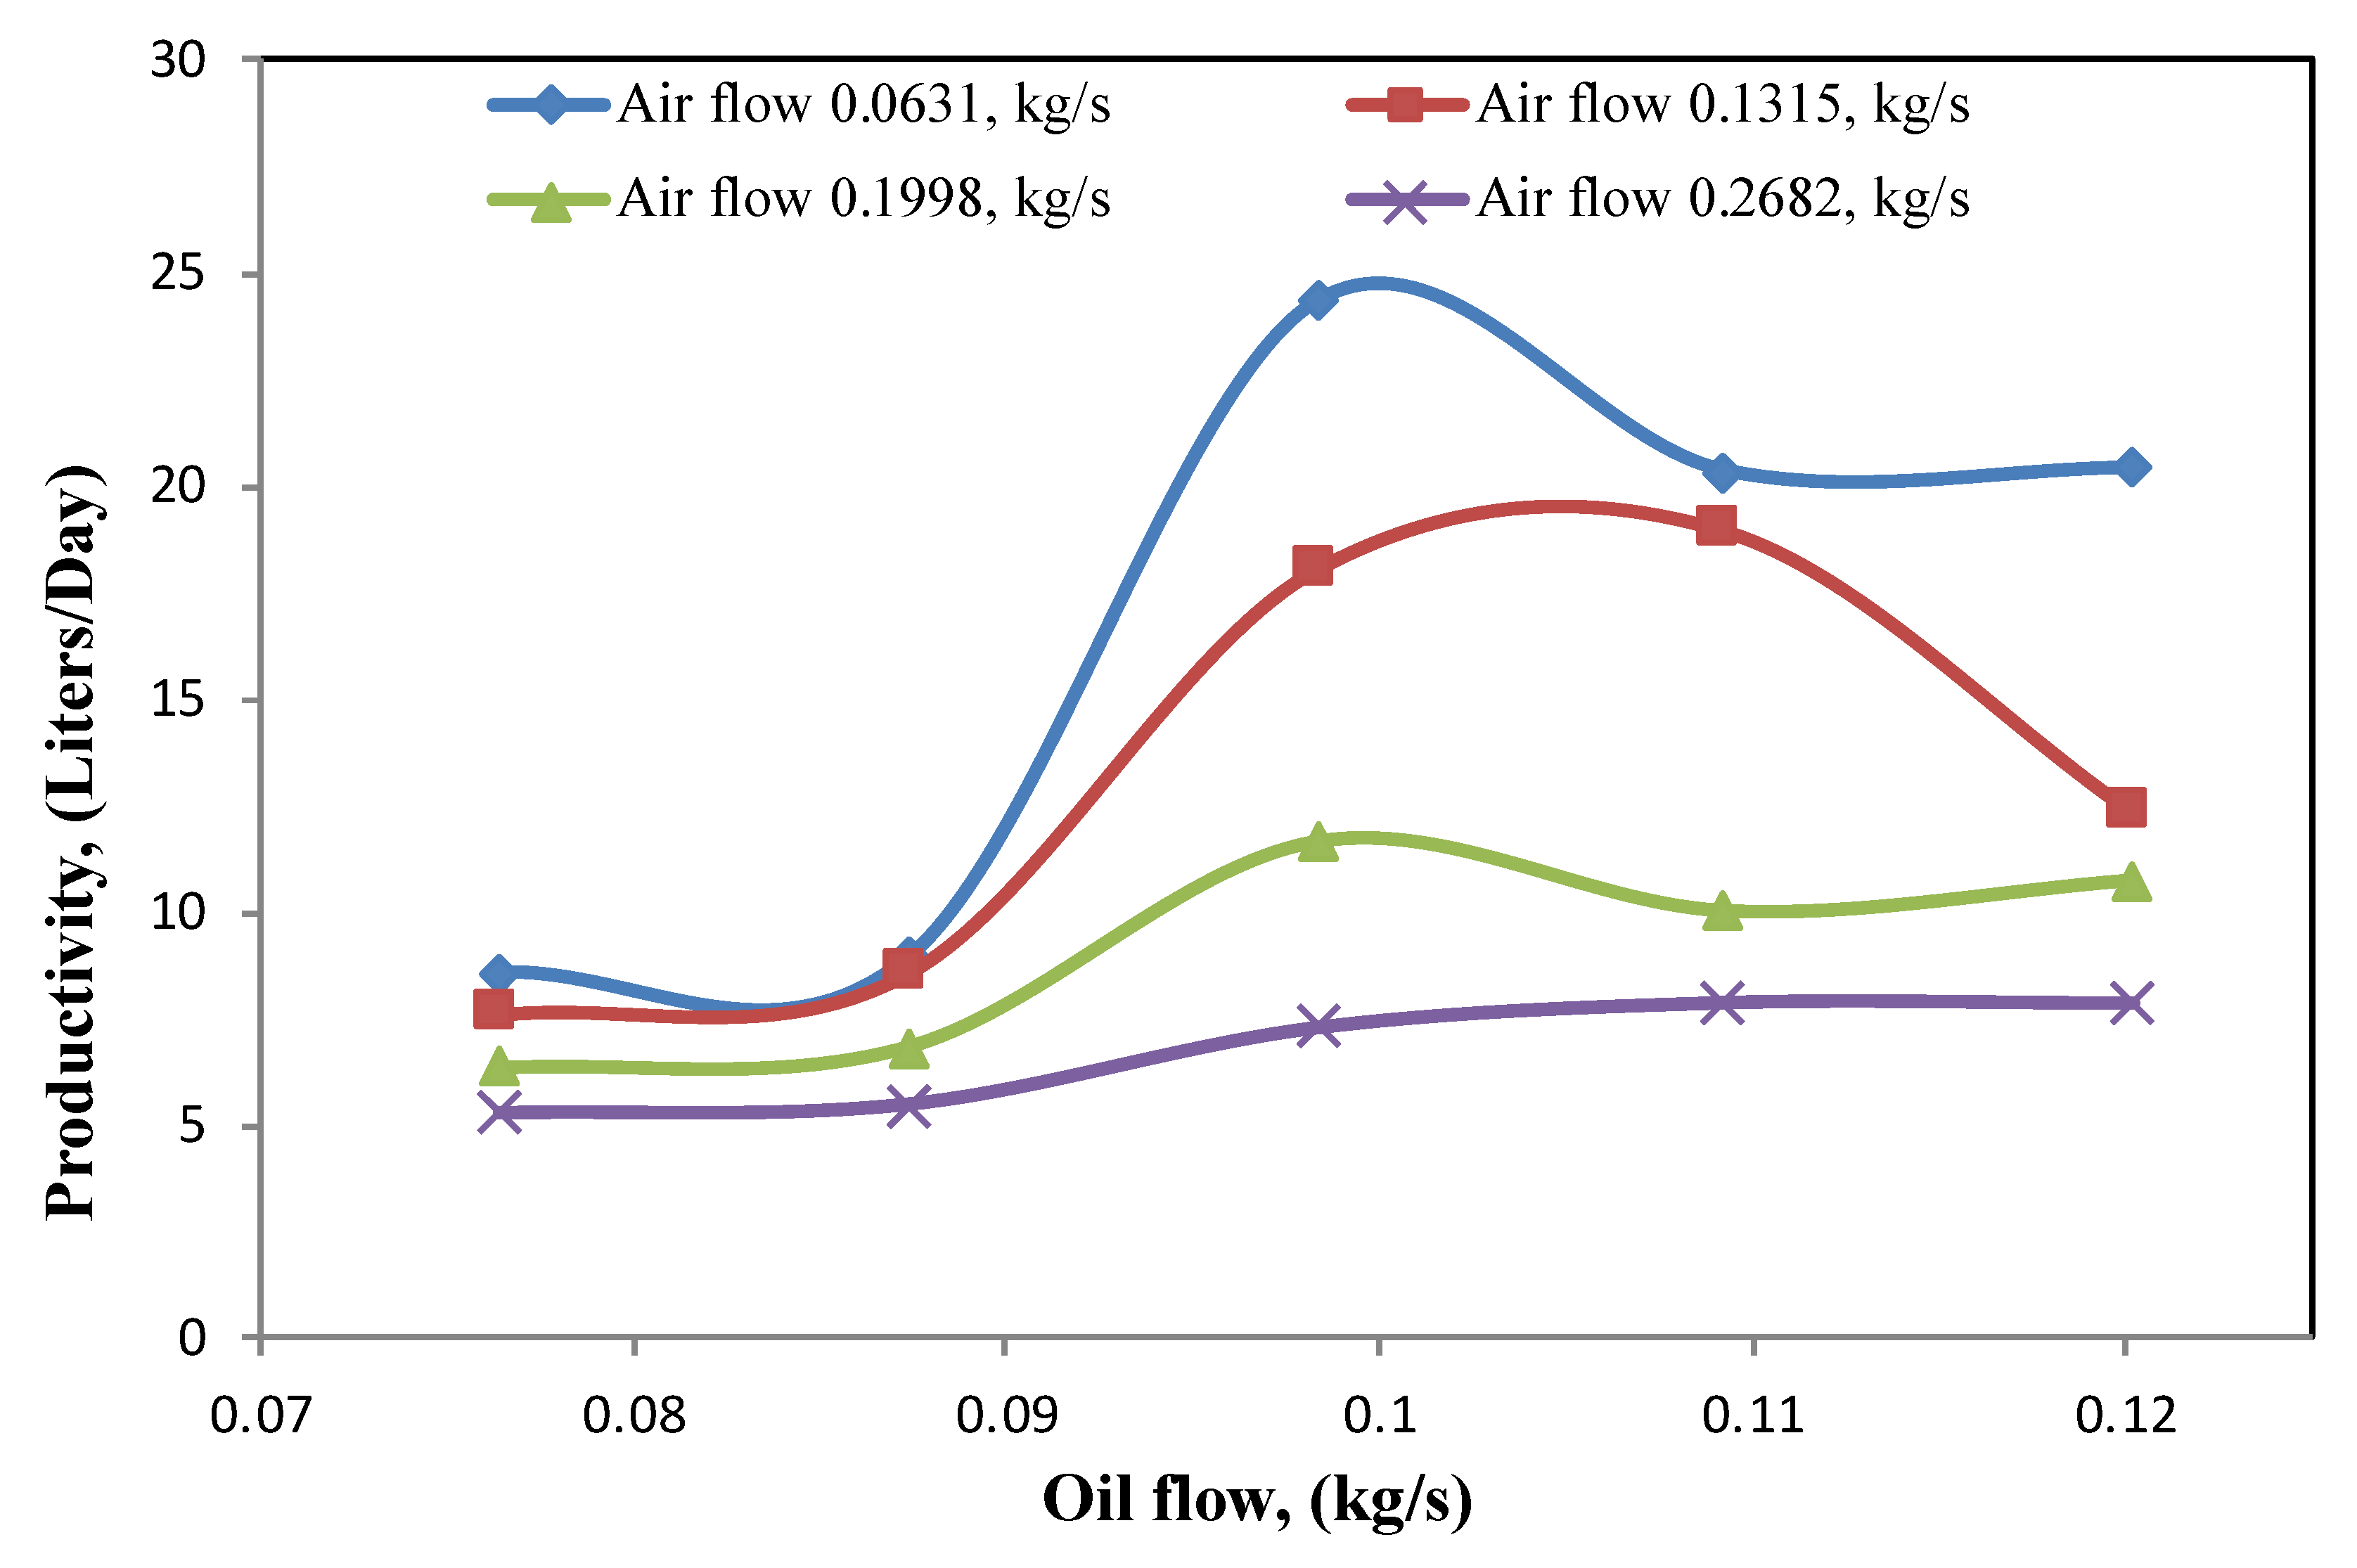
4.1. System Productivity
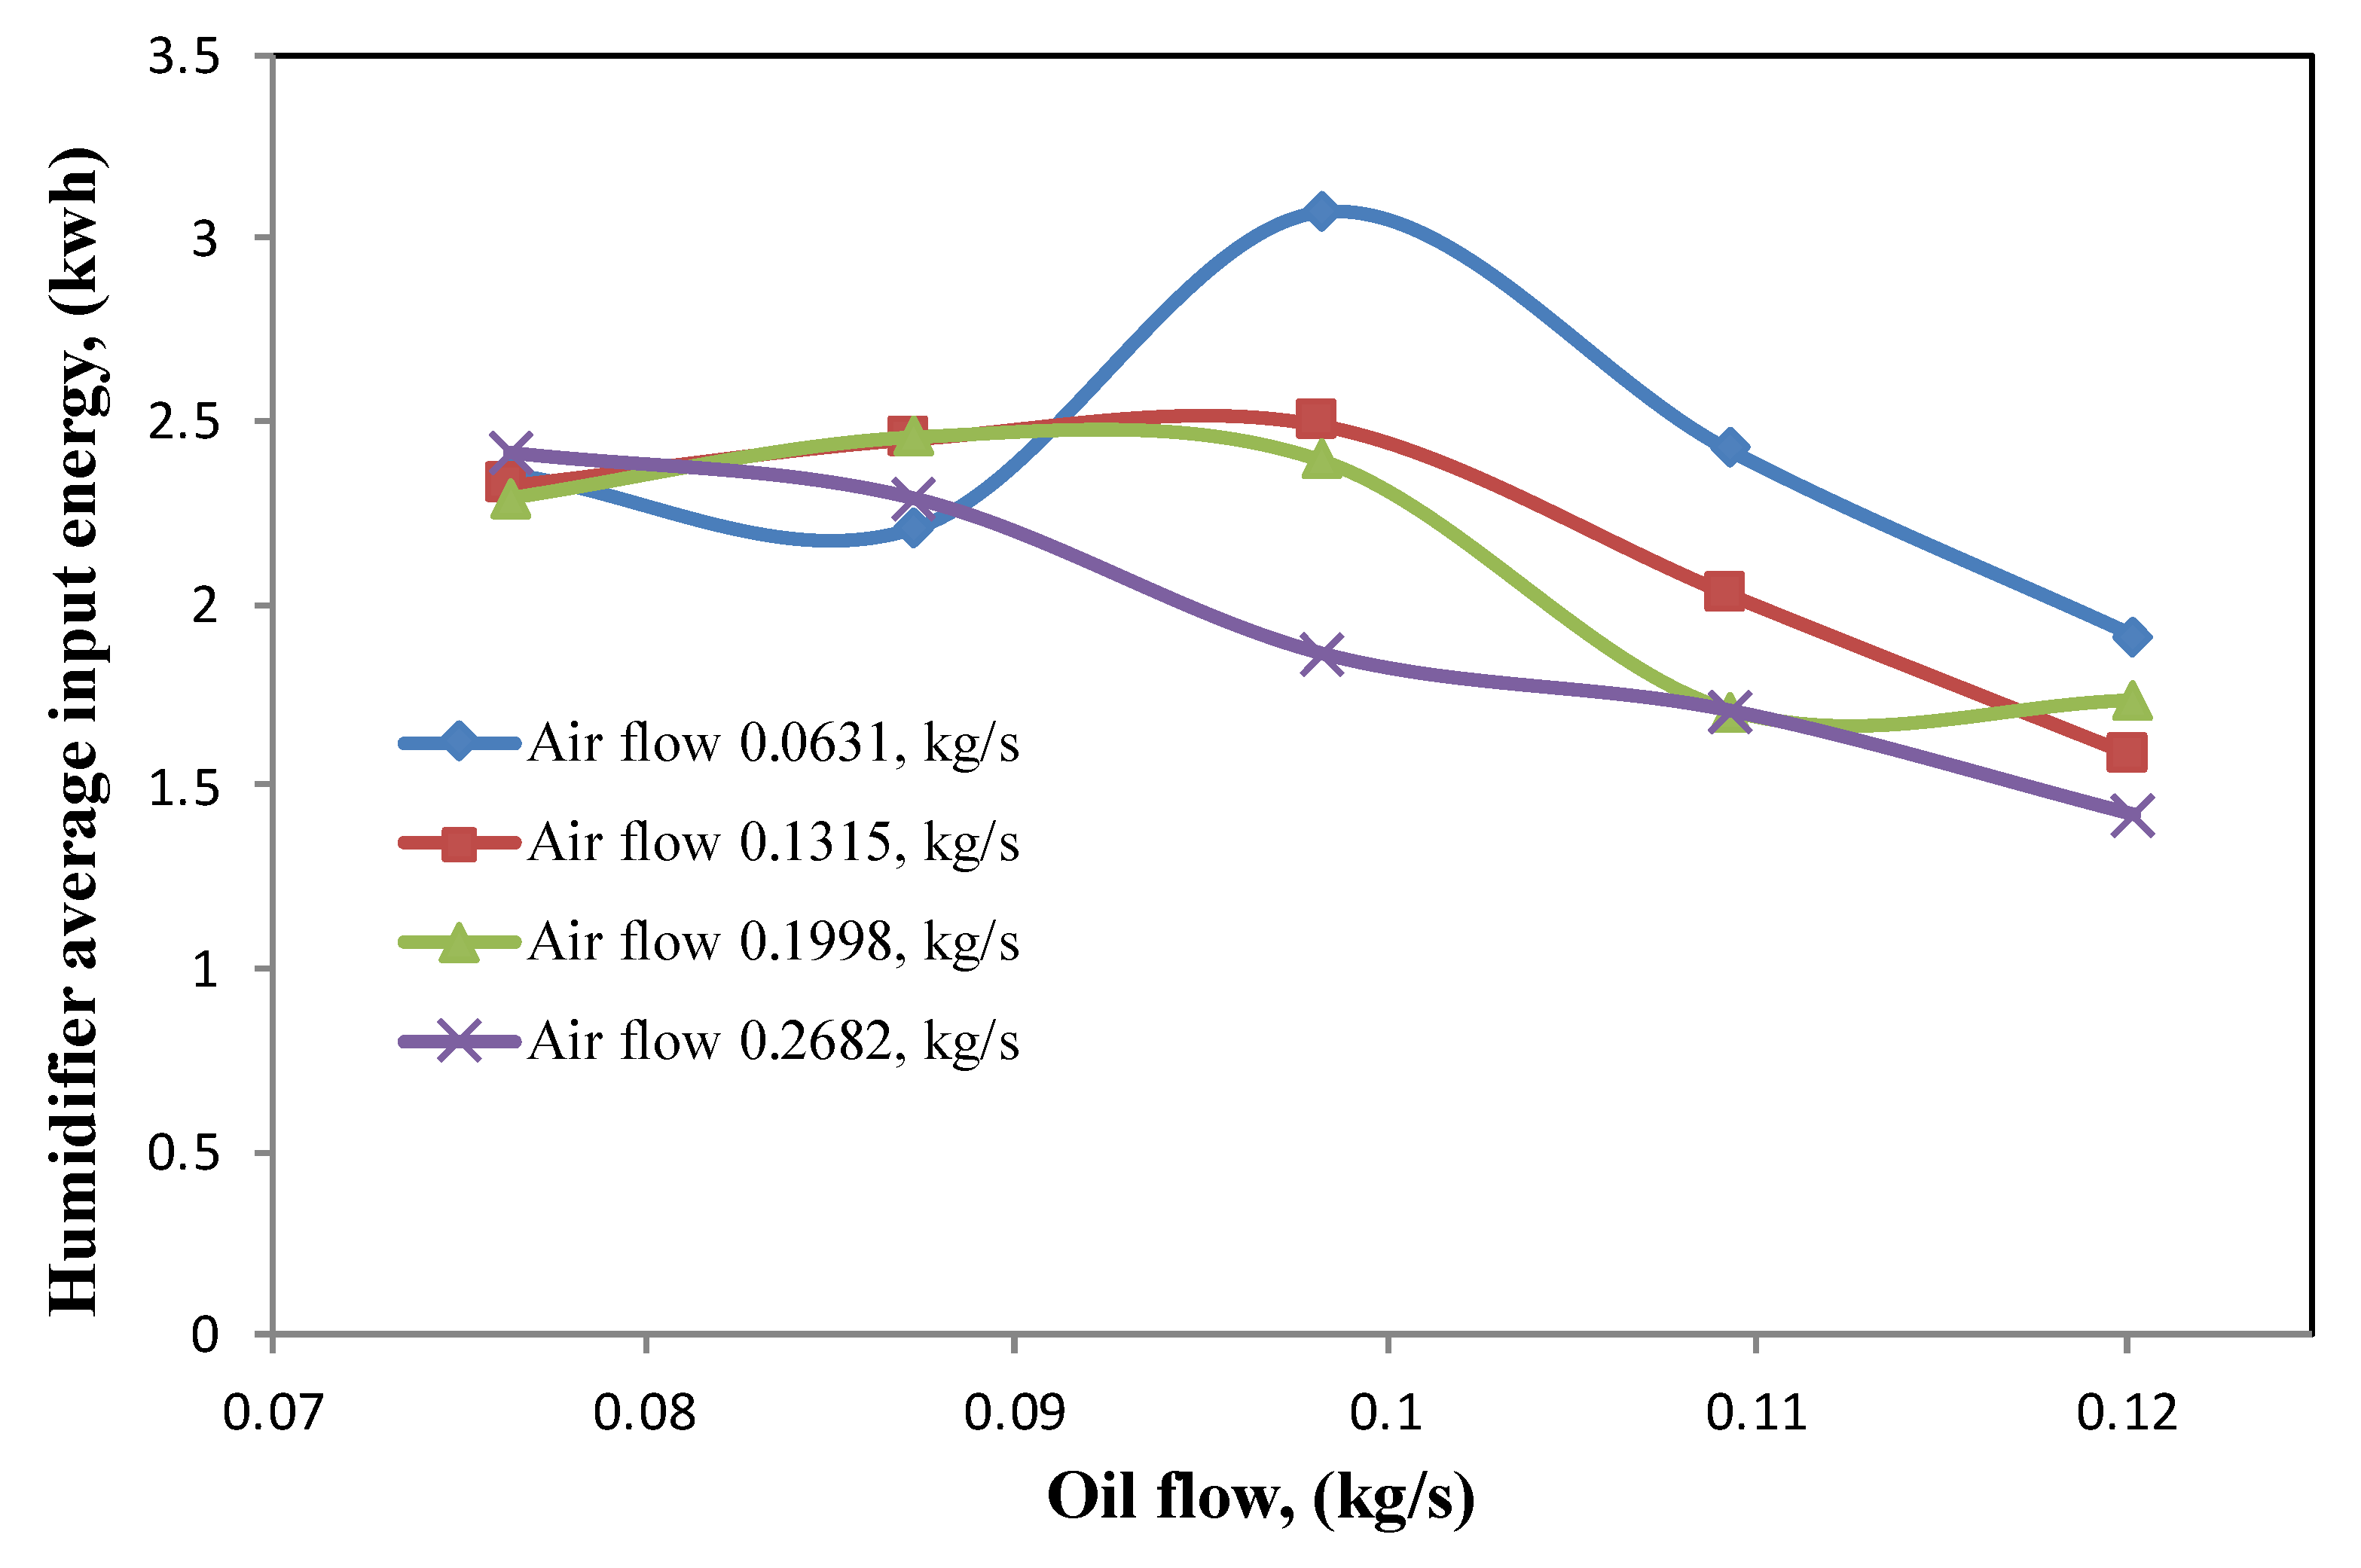
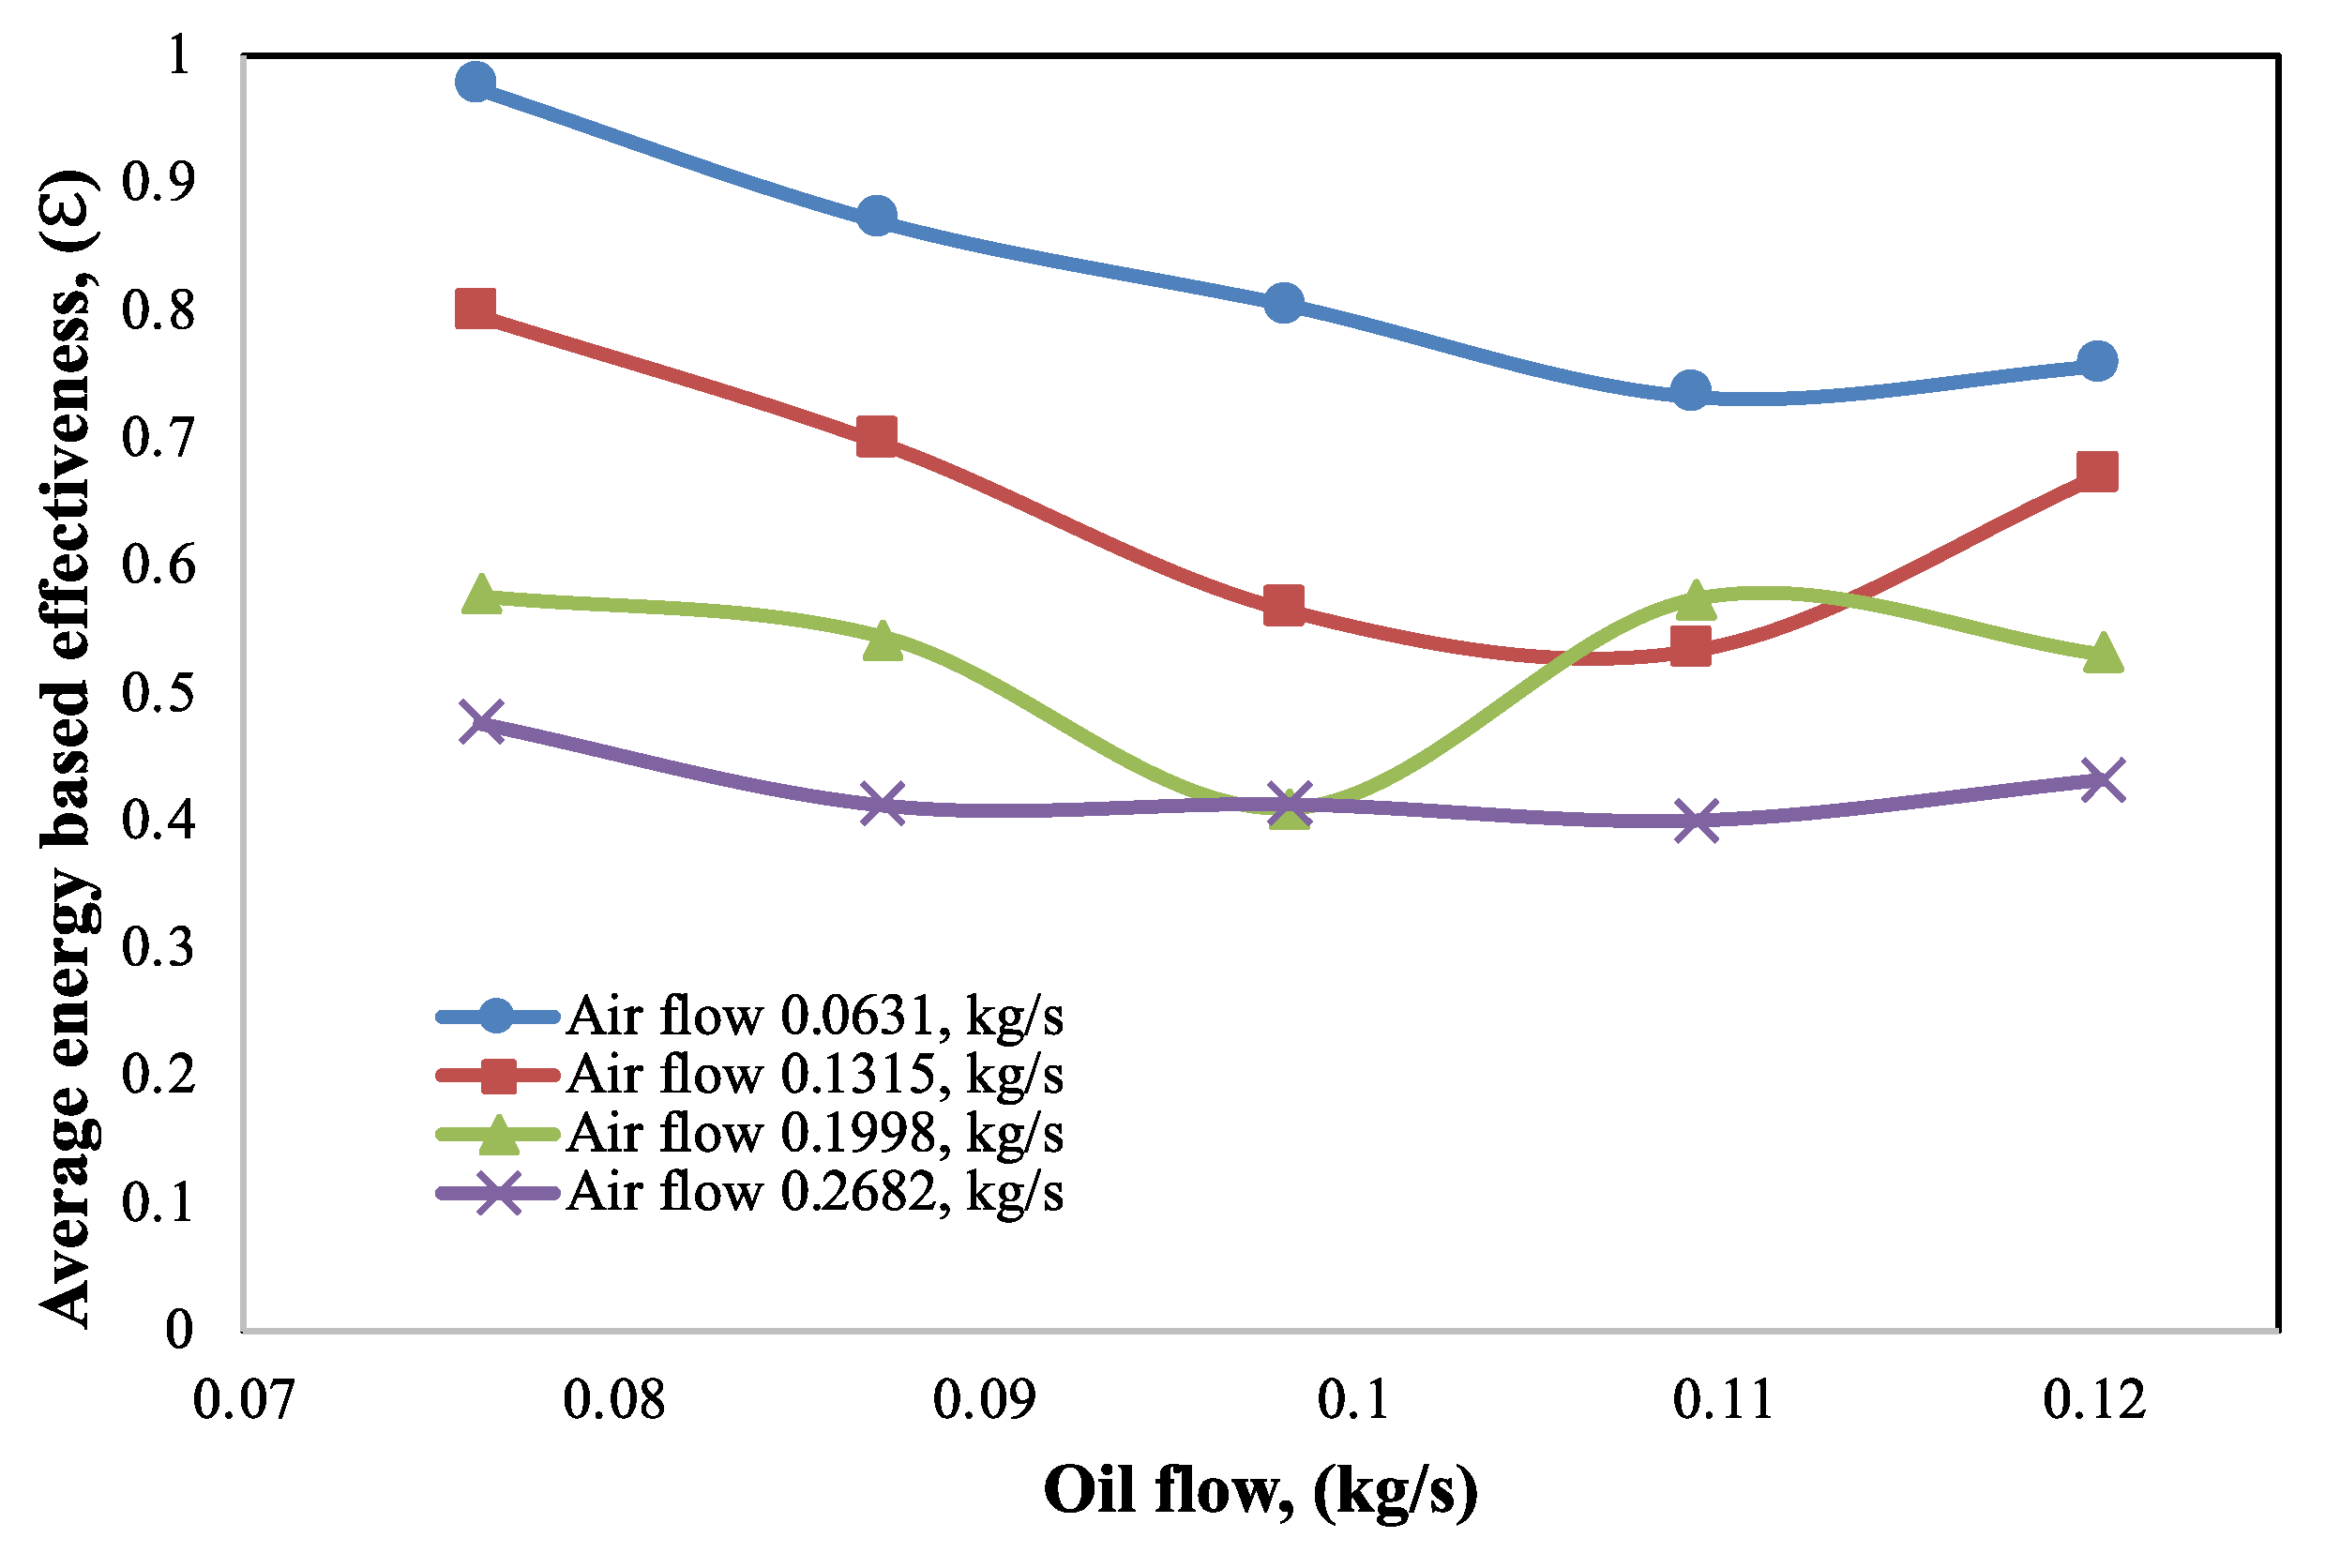
4.2. Energy of the System
4.3. The GOR
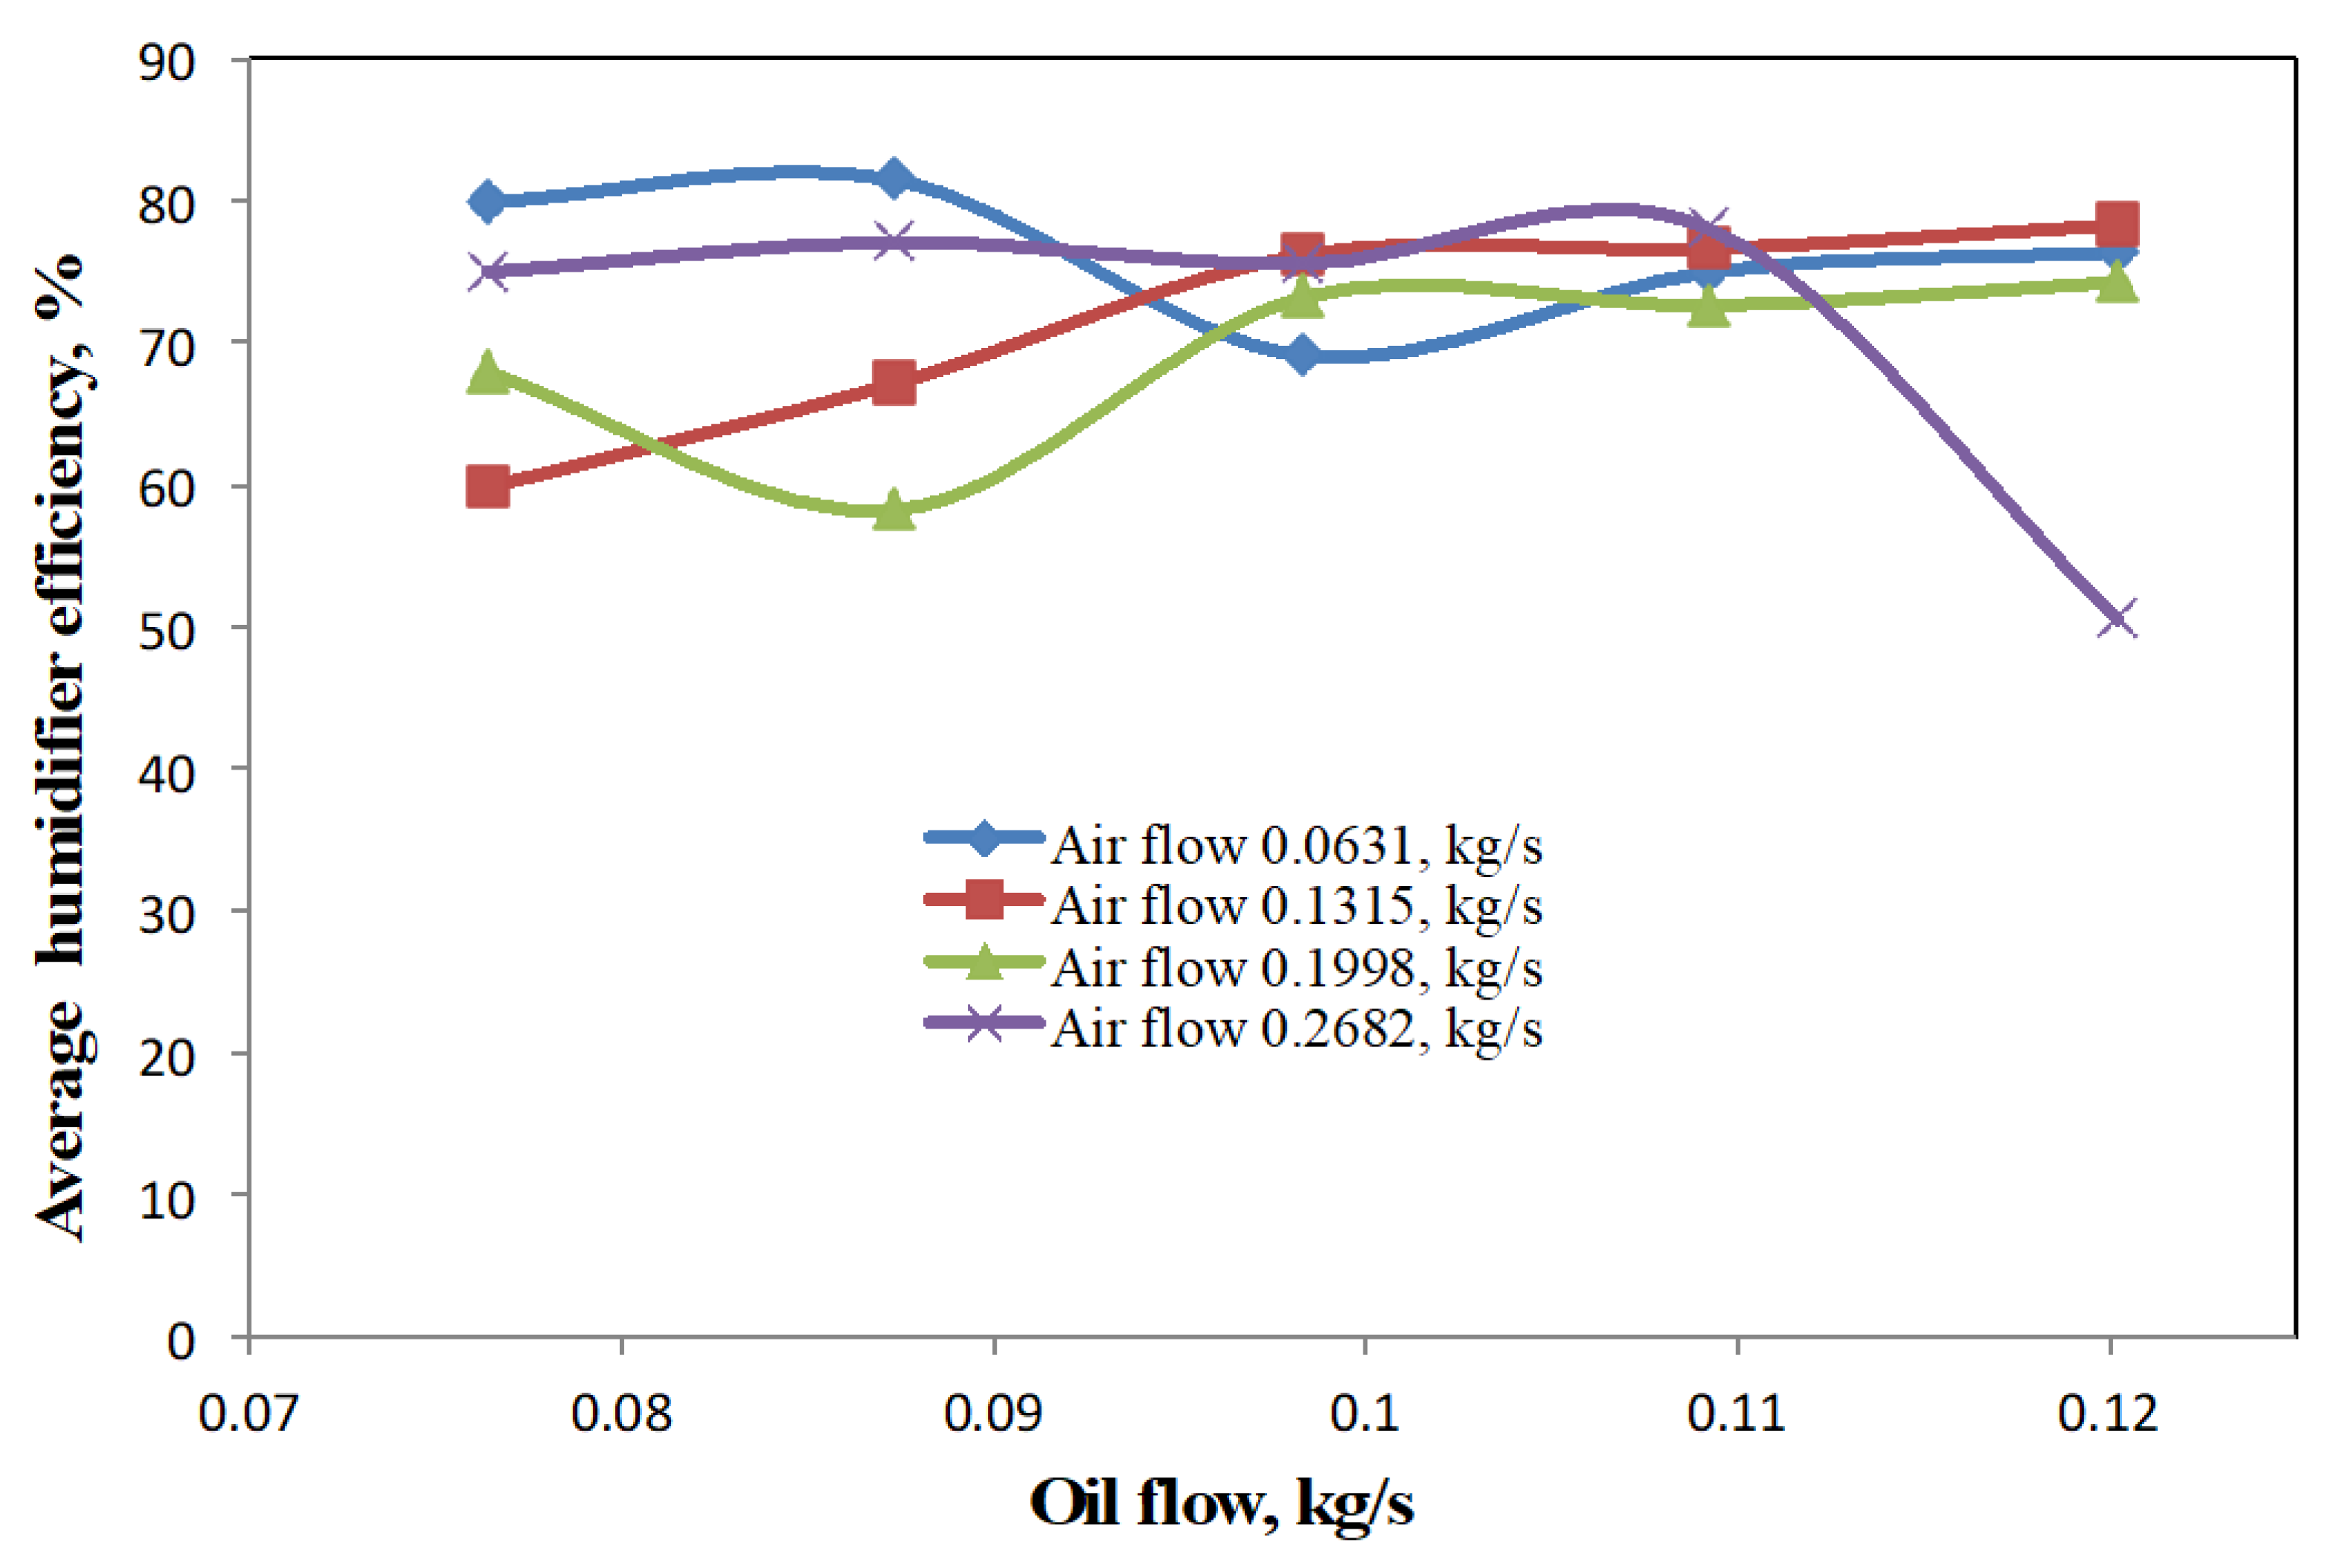
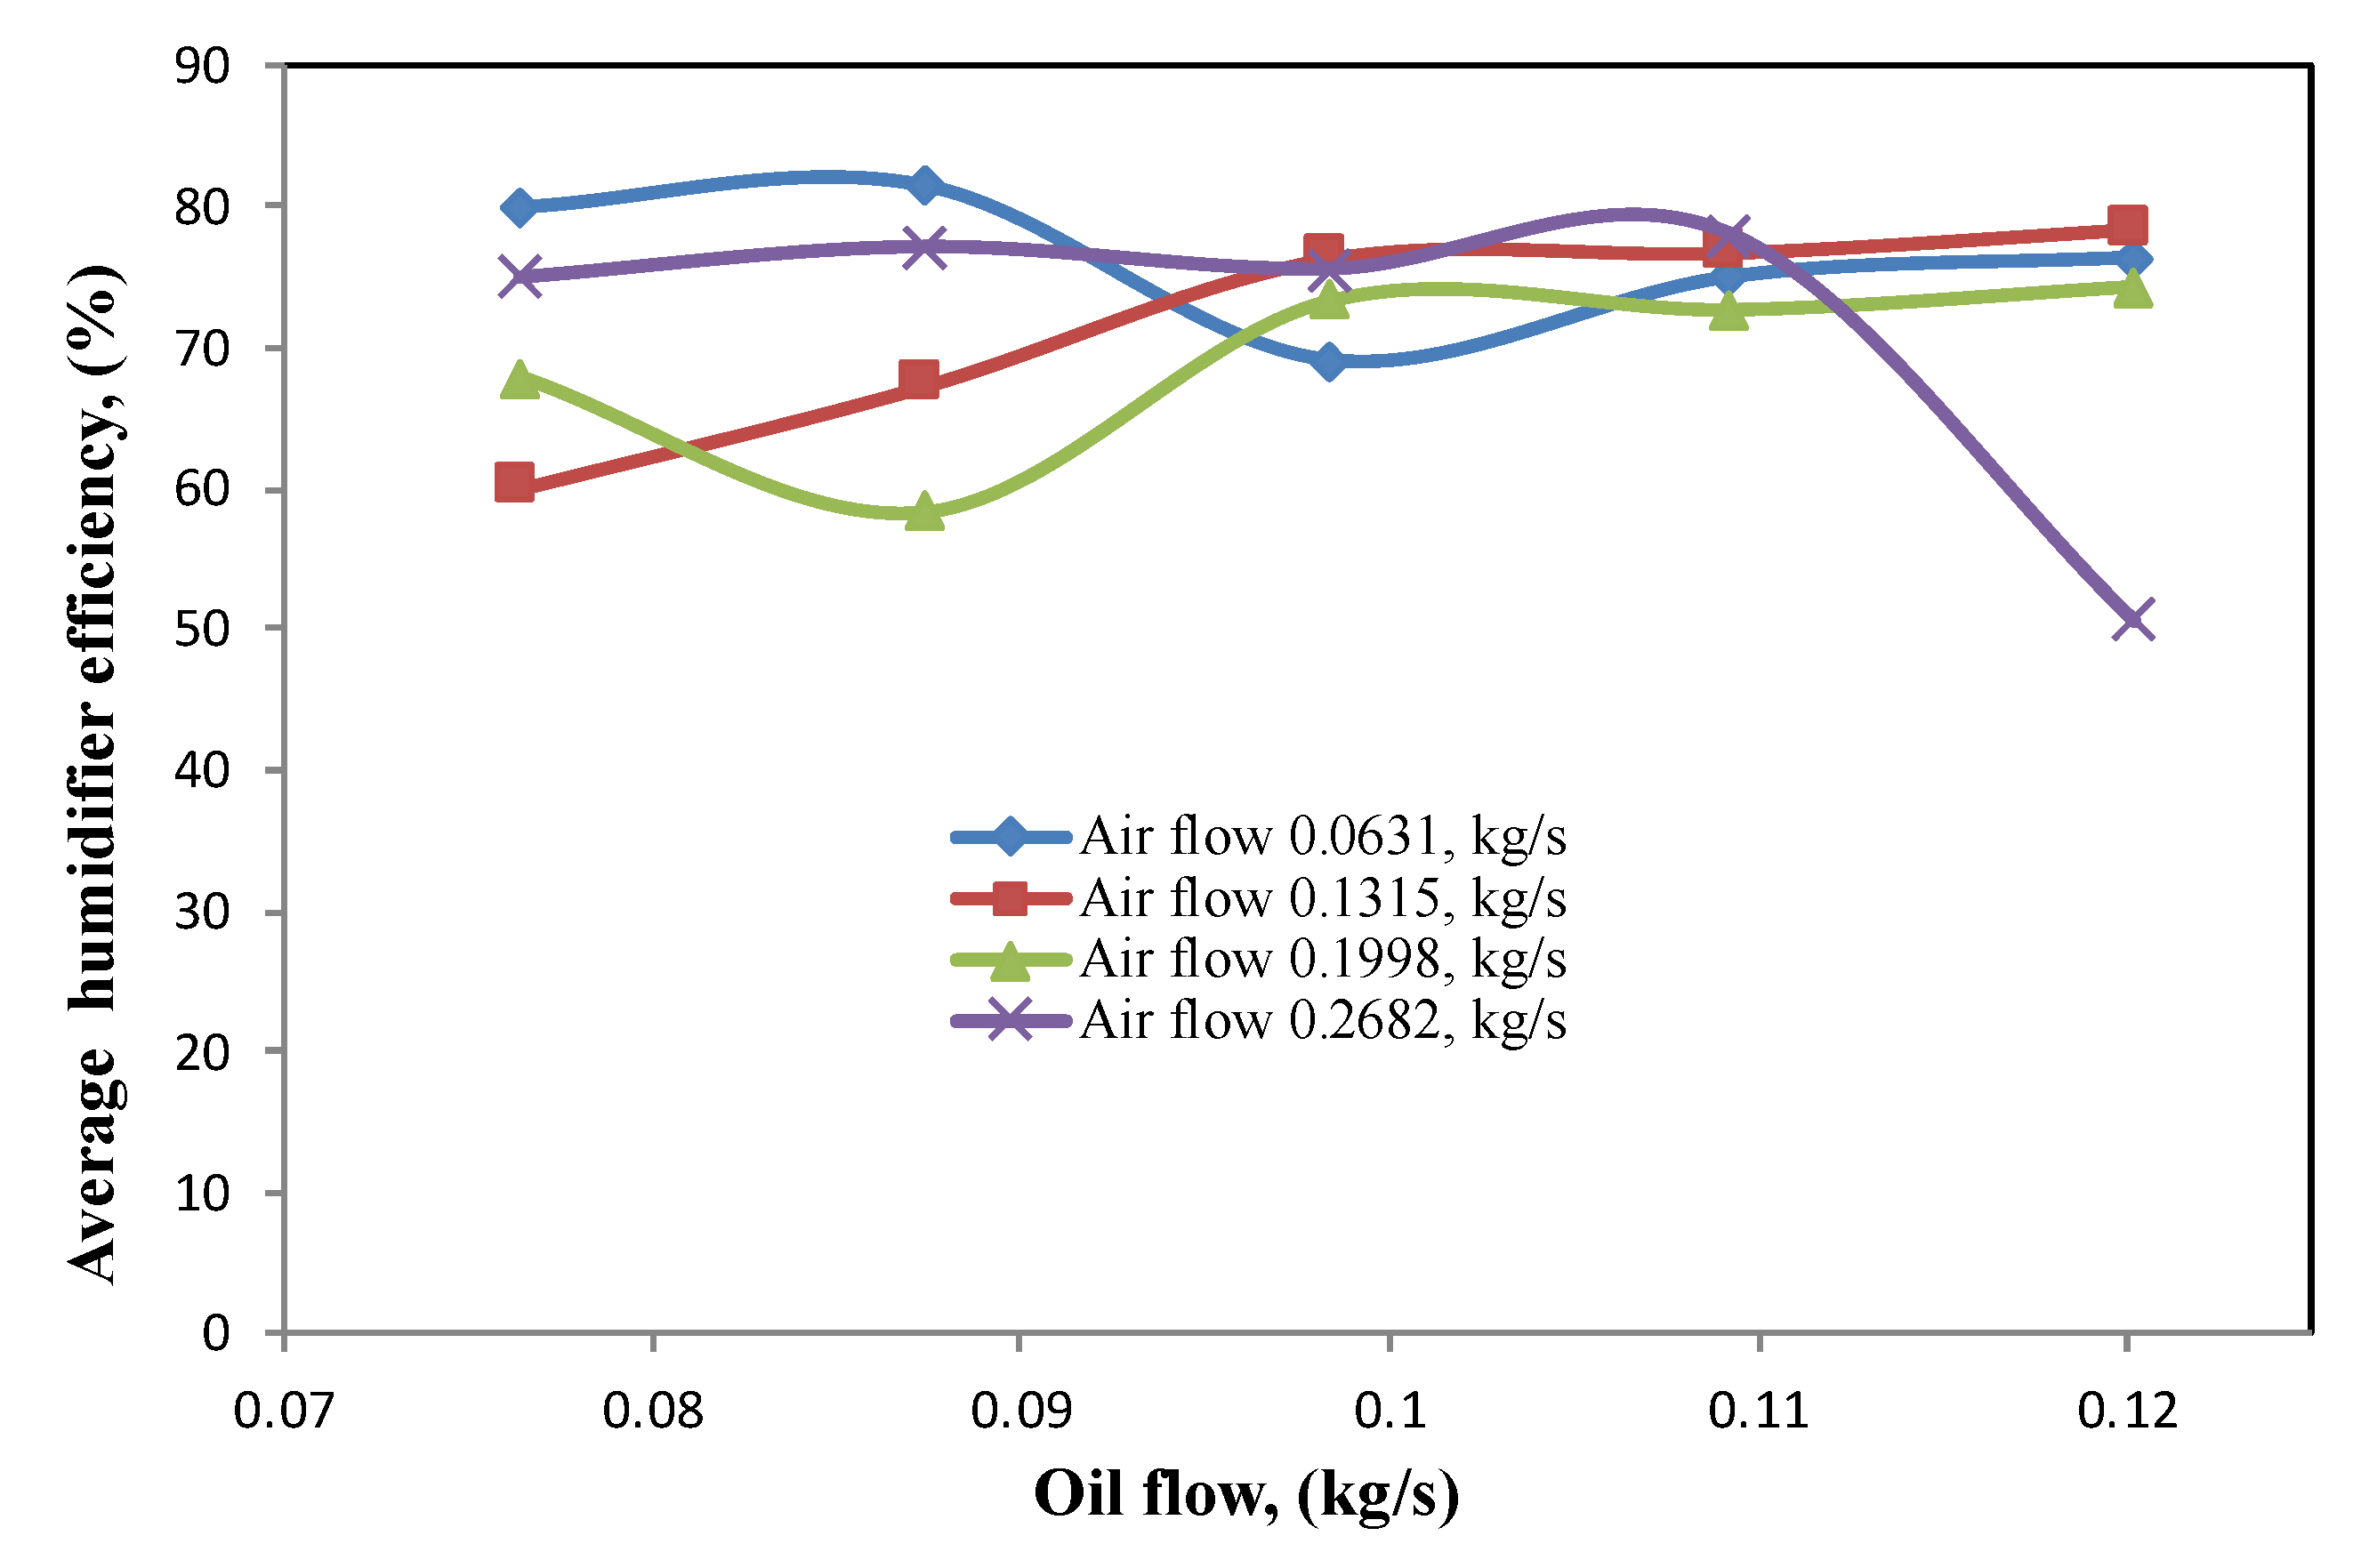
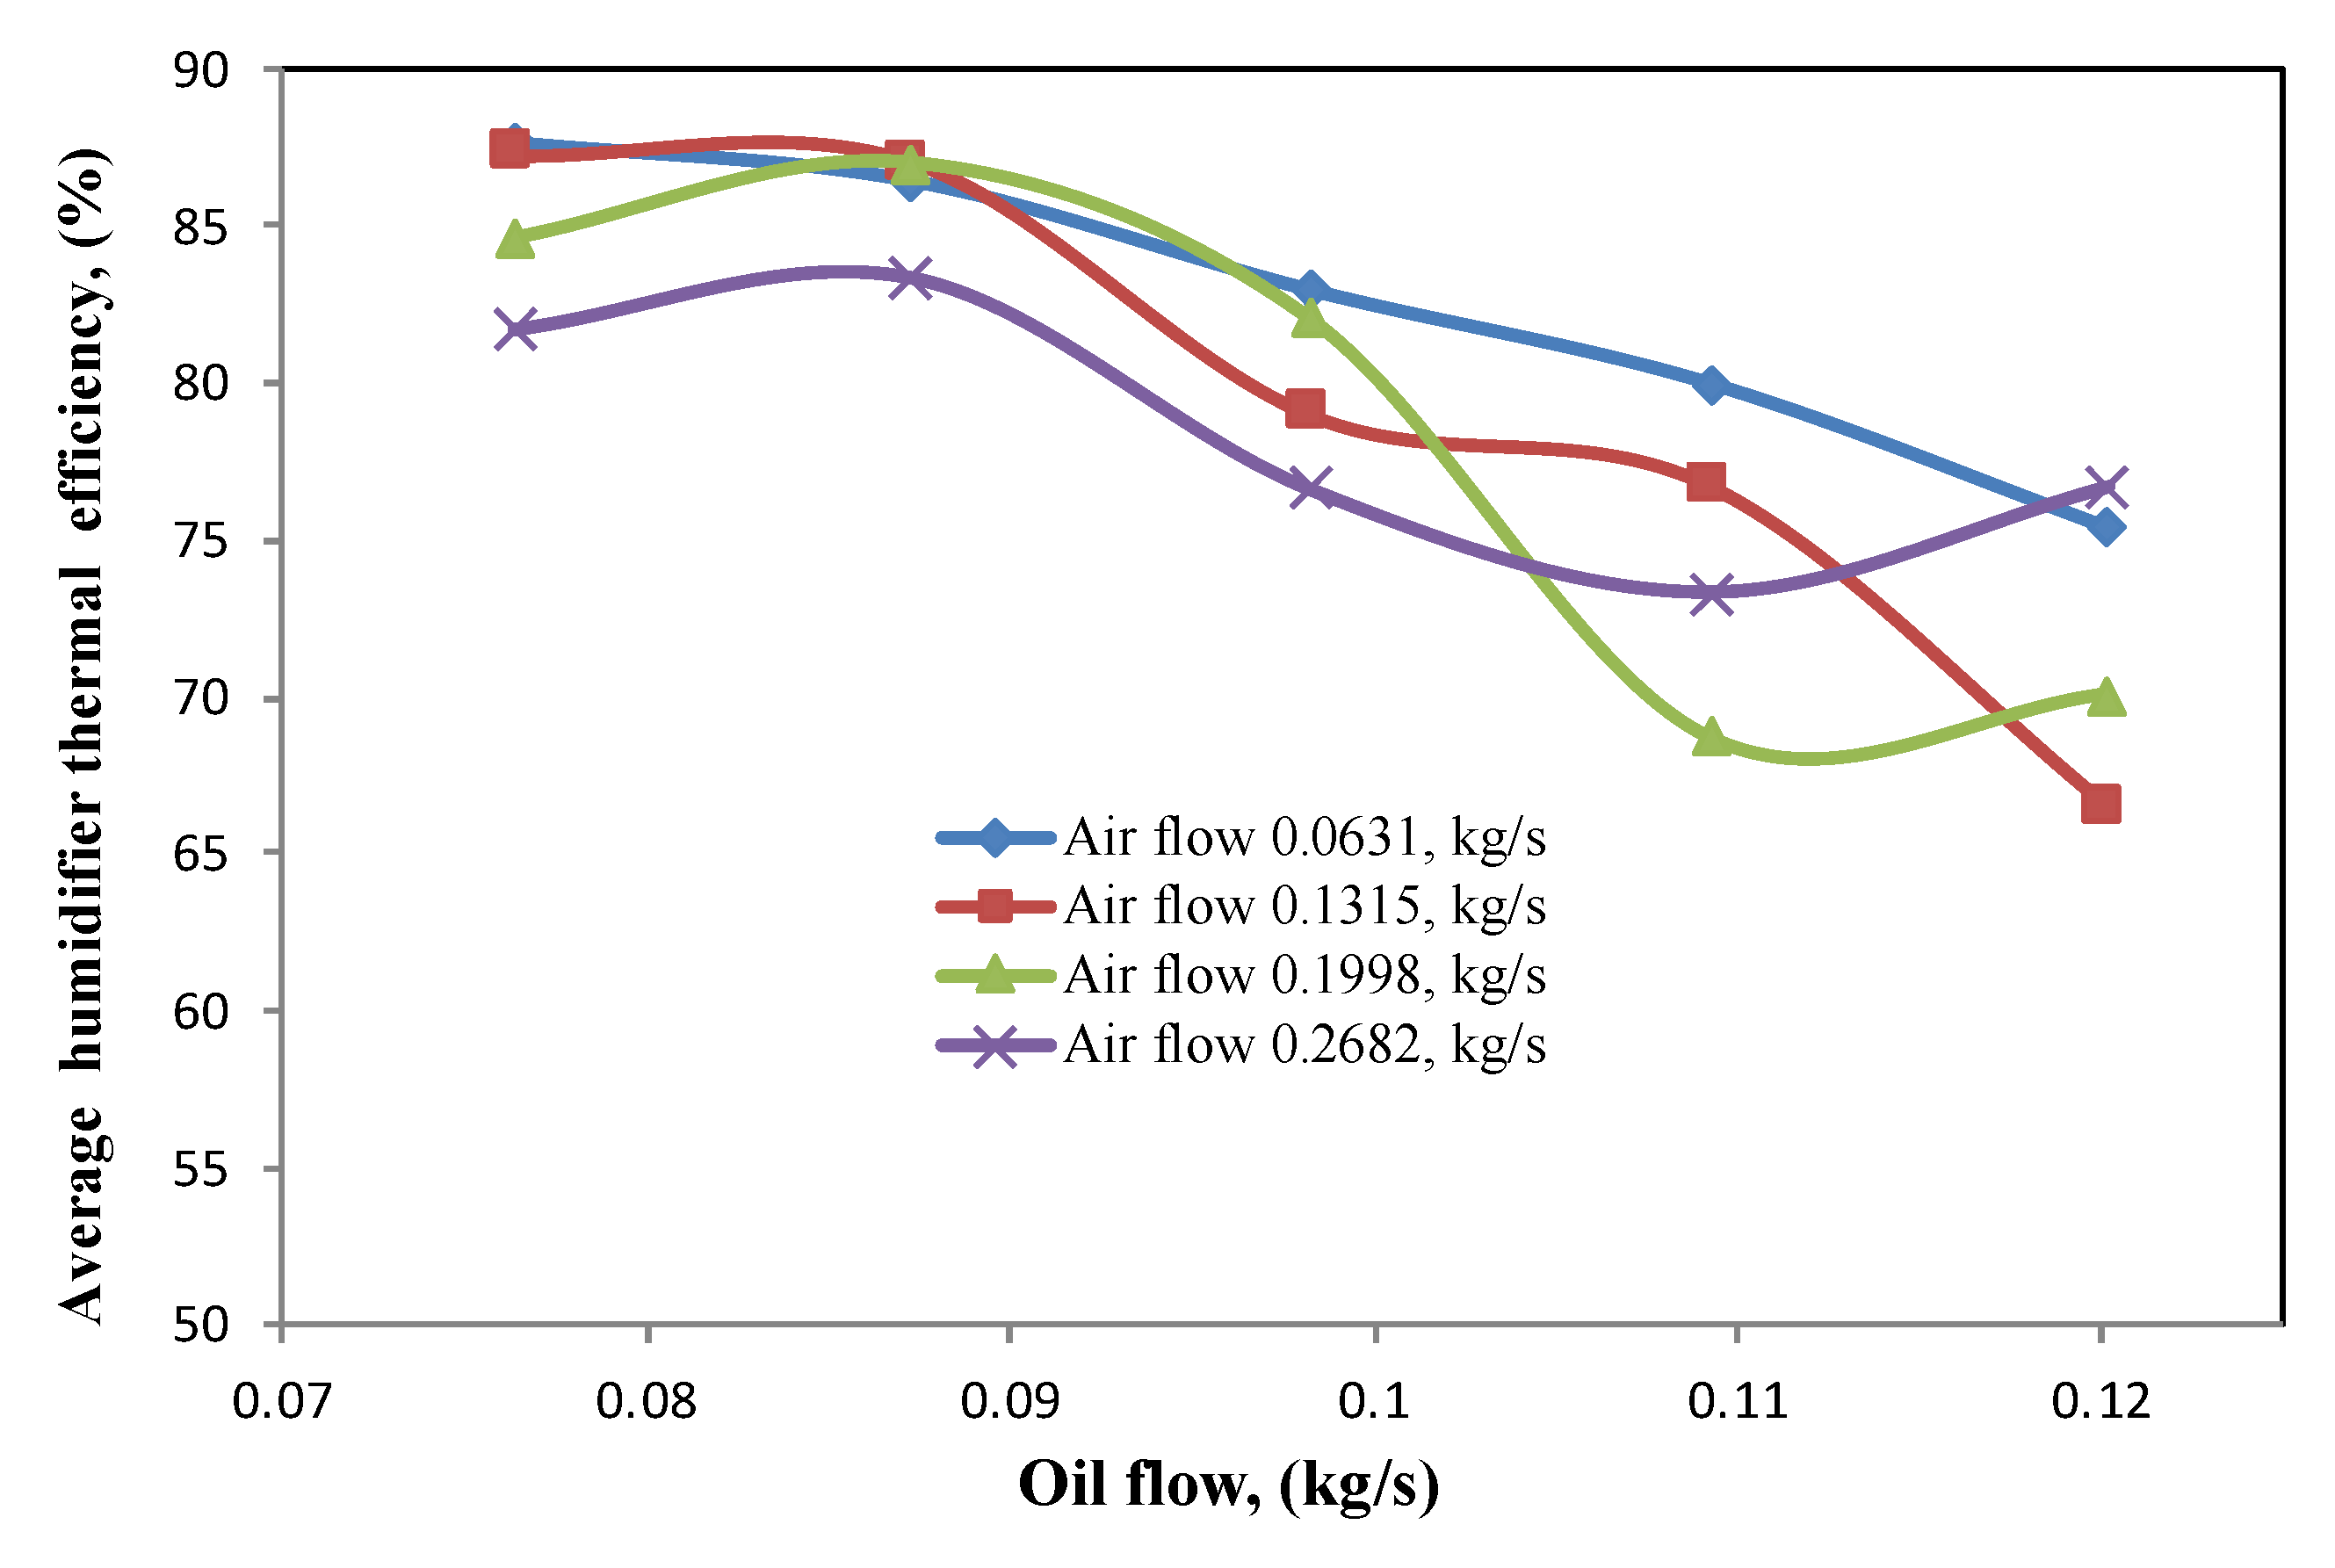
4.4. Humidifier Efficiency and Thermal Efficiency
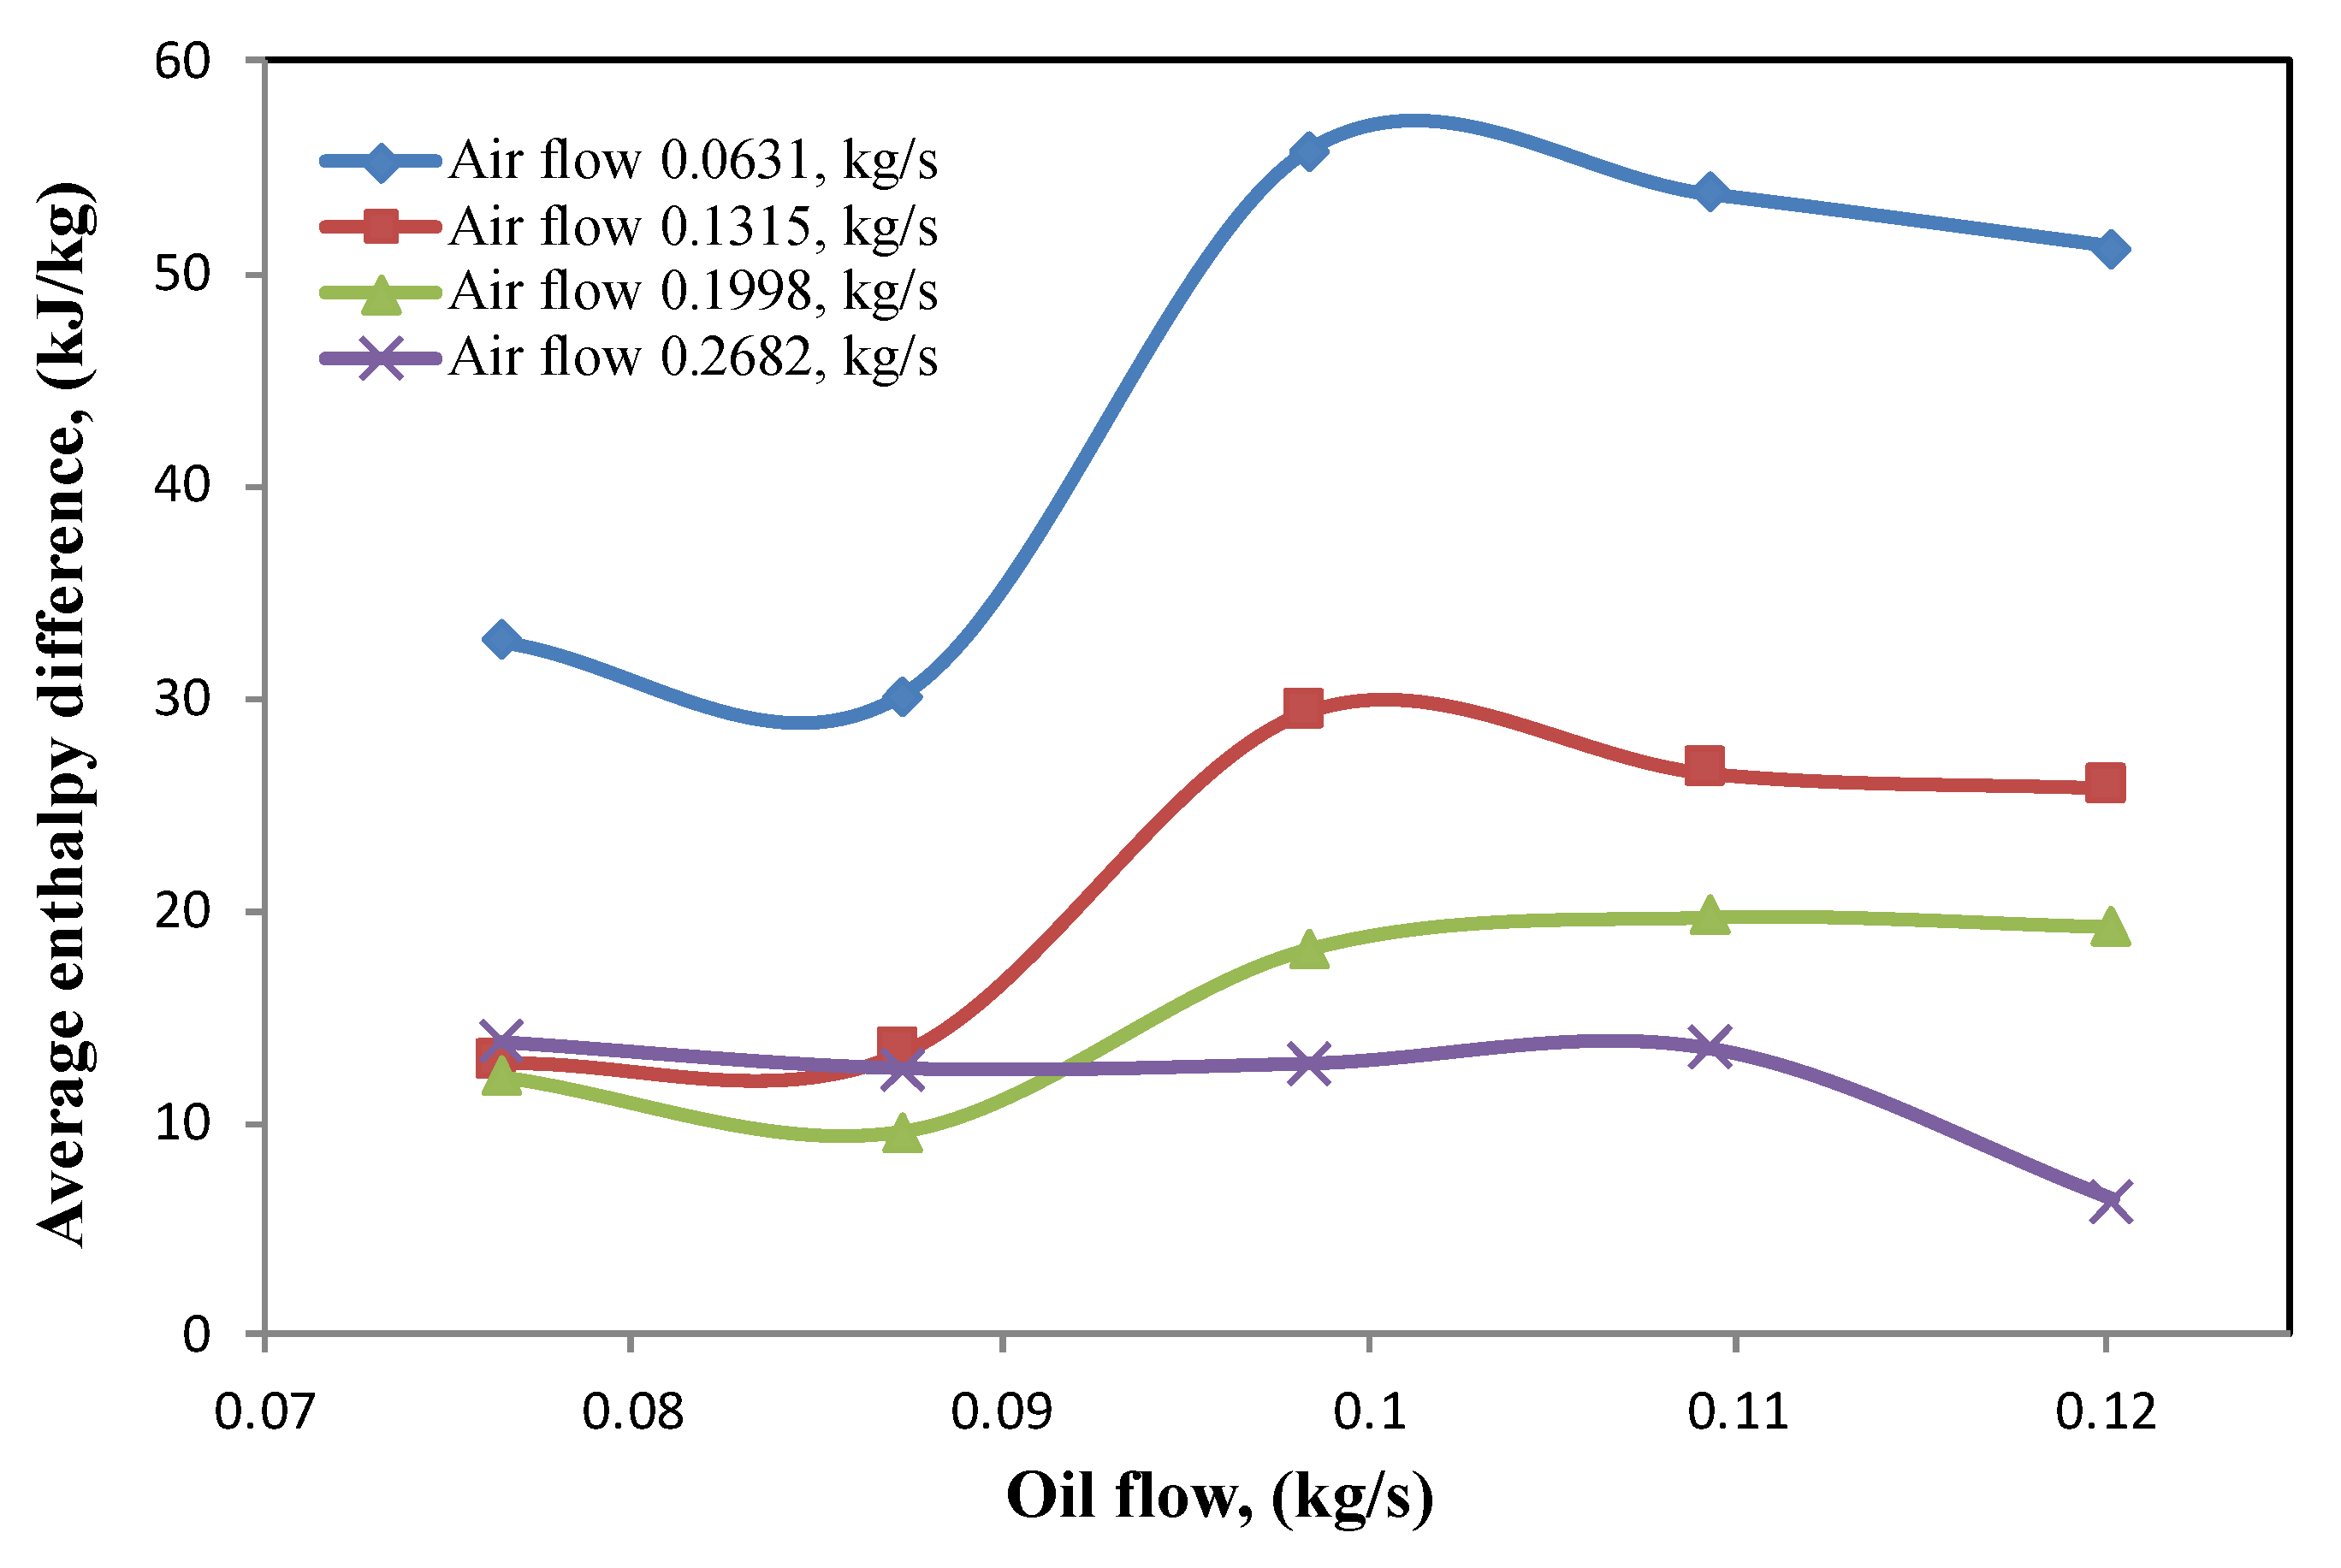
4.5. Enthalpy Difference
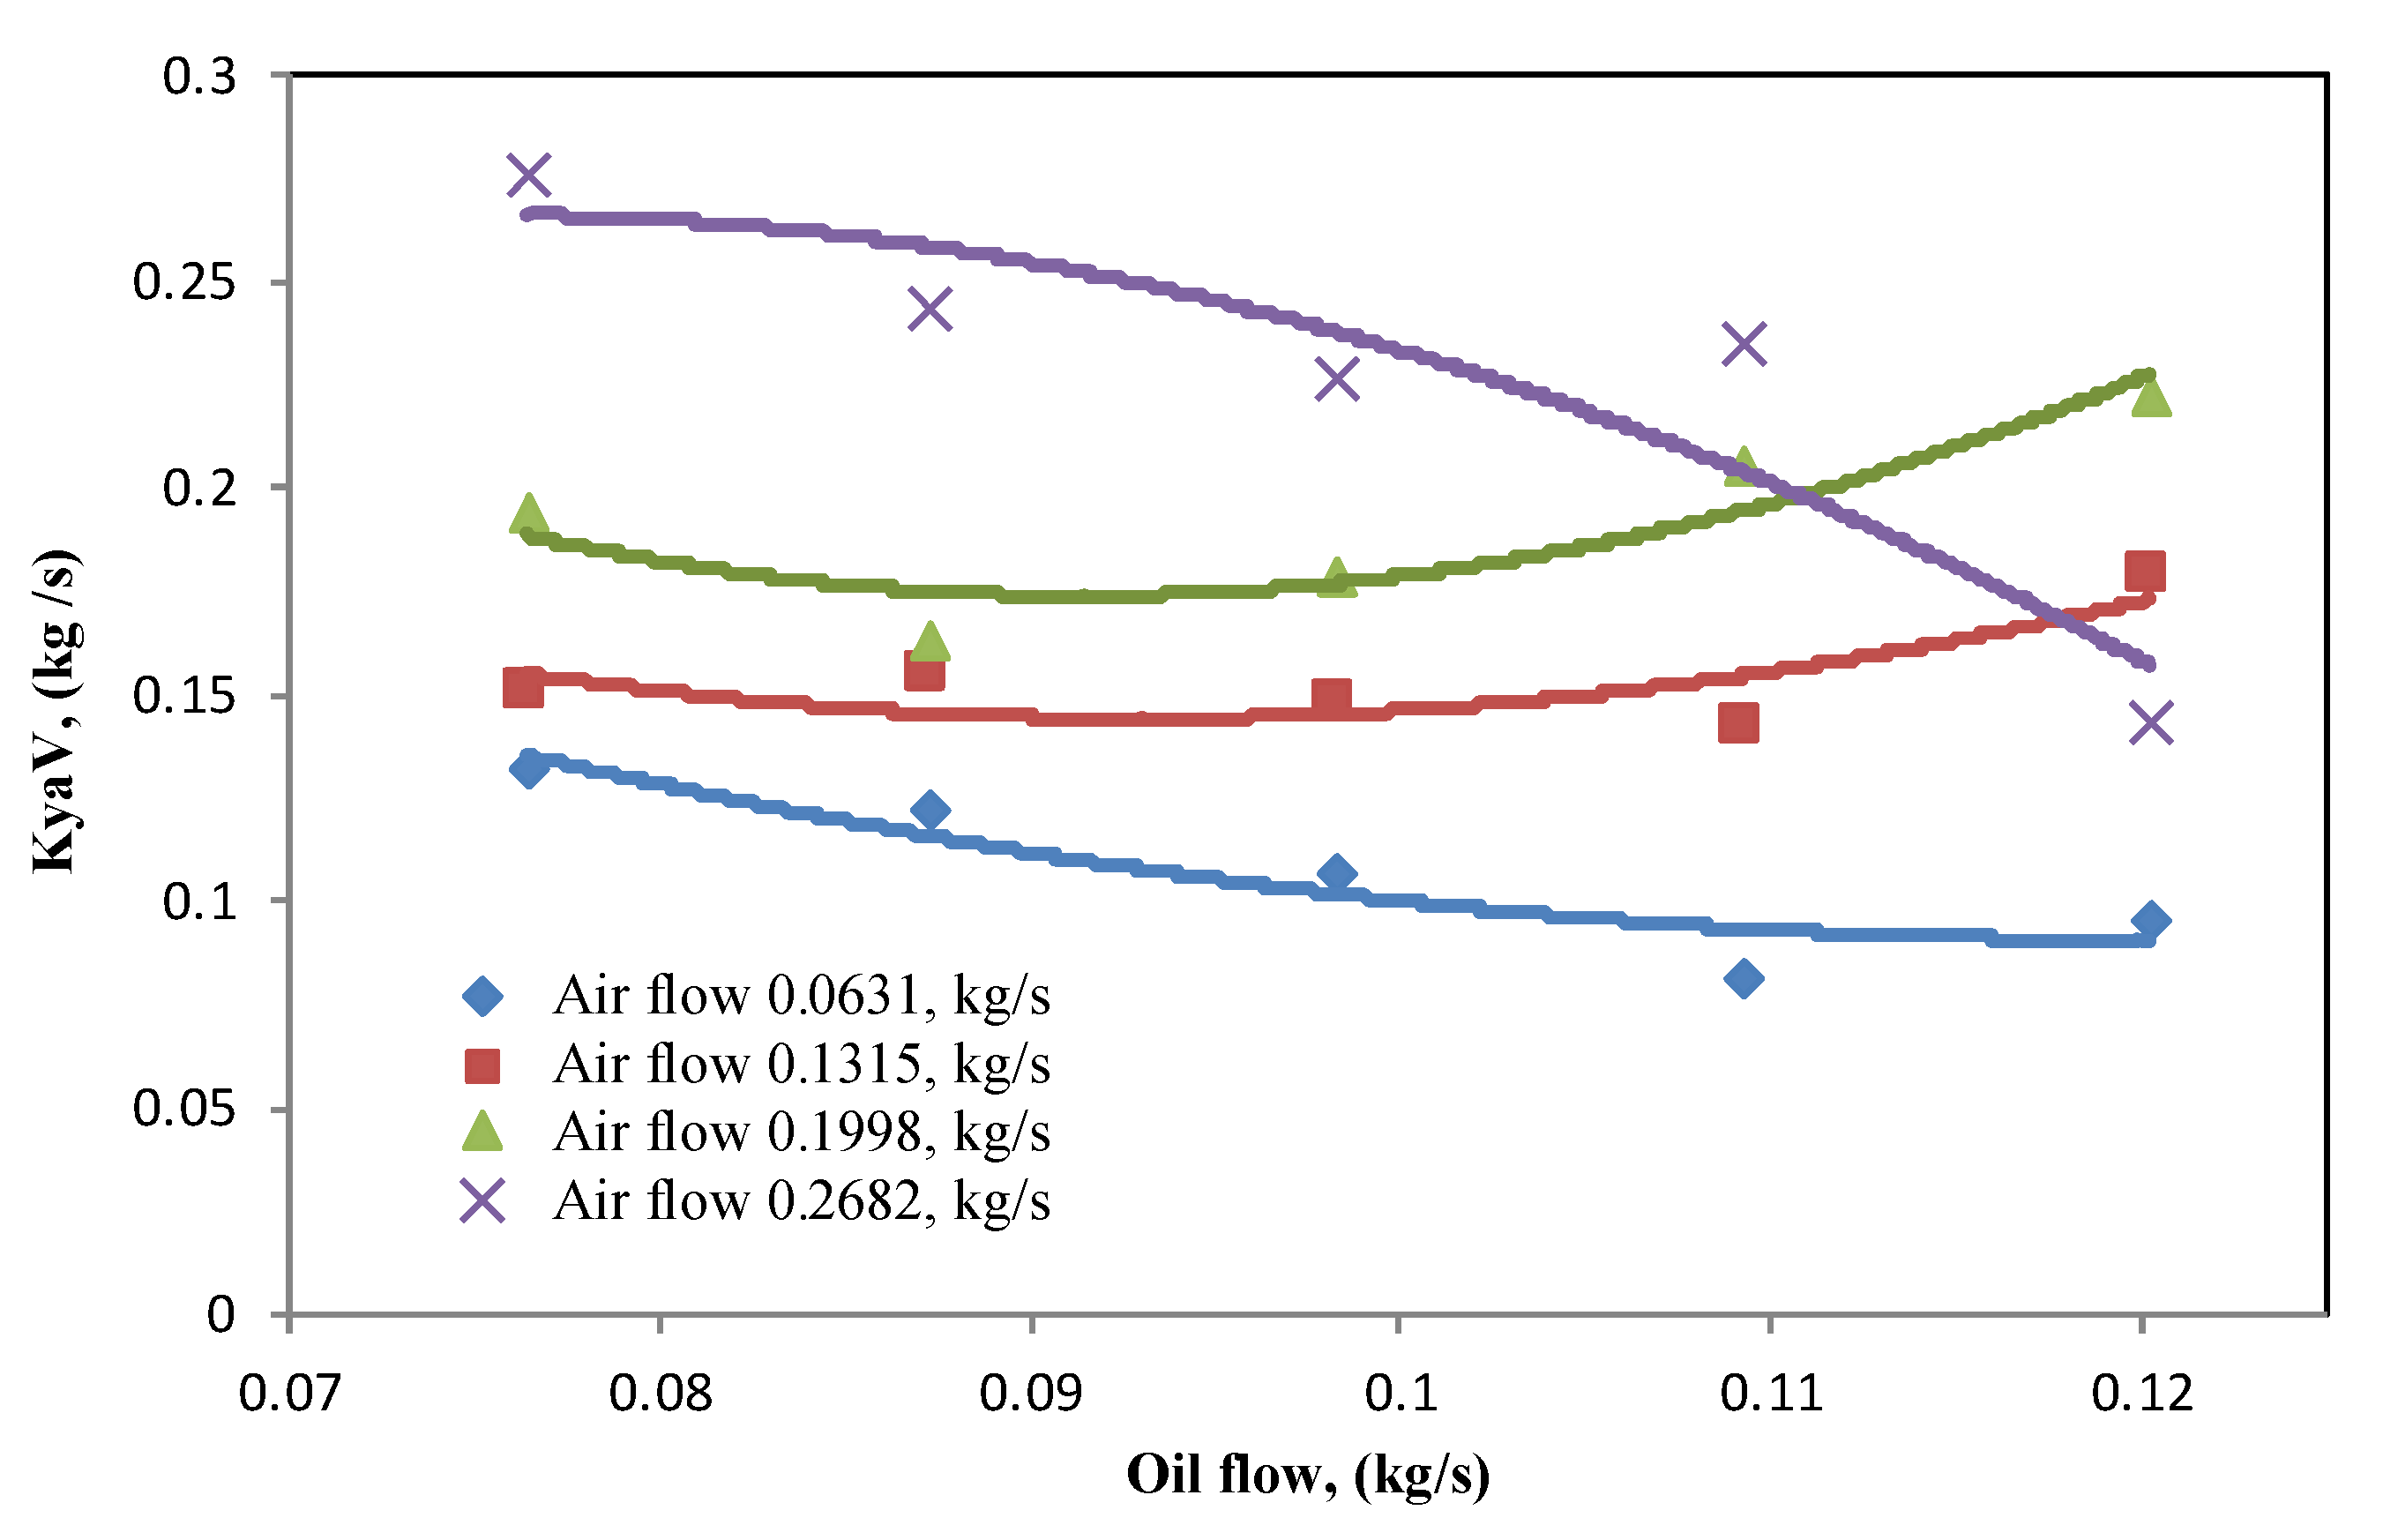
4.6. Humidifier Mass Transfer Coefficient
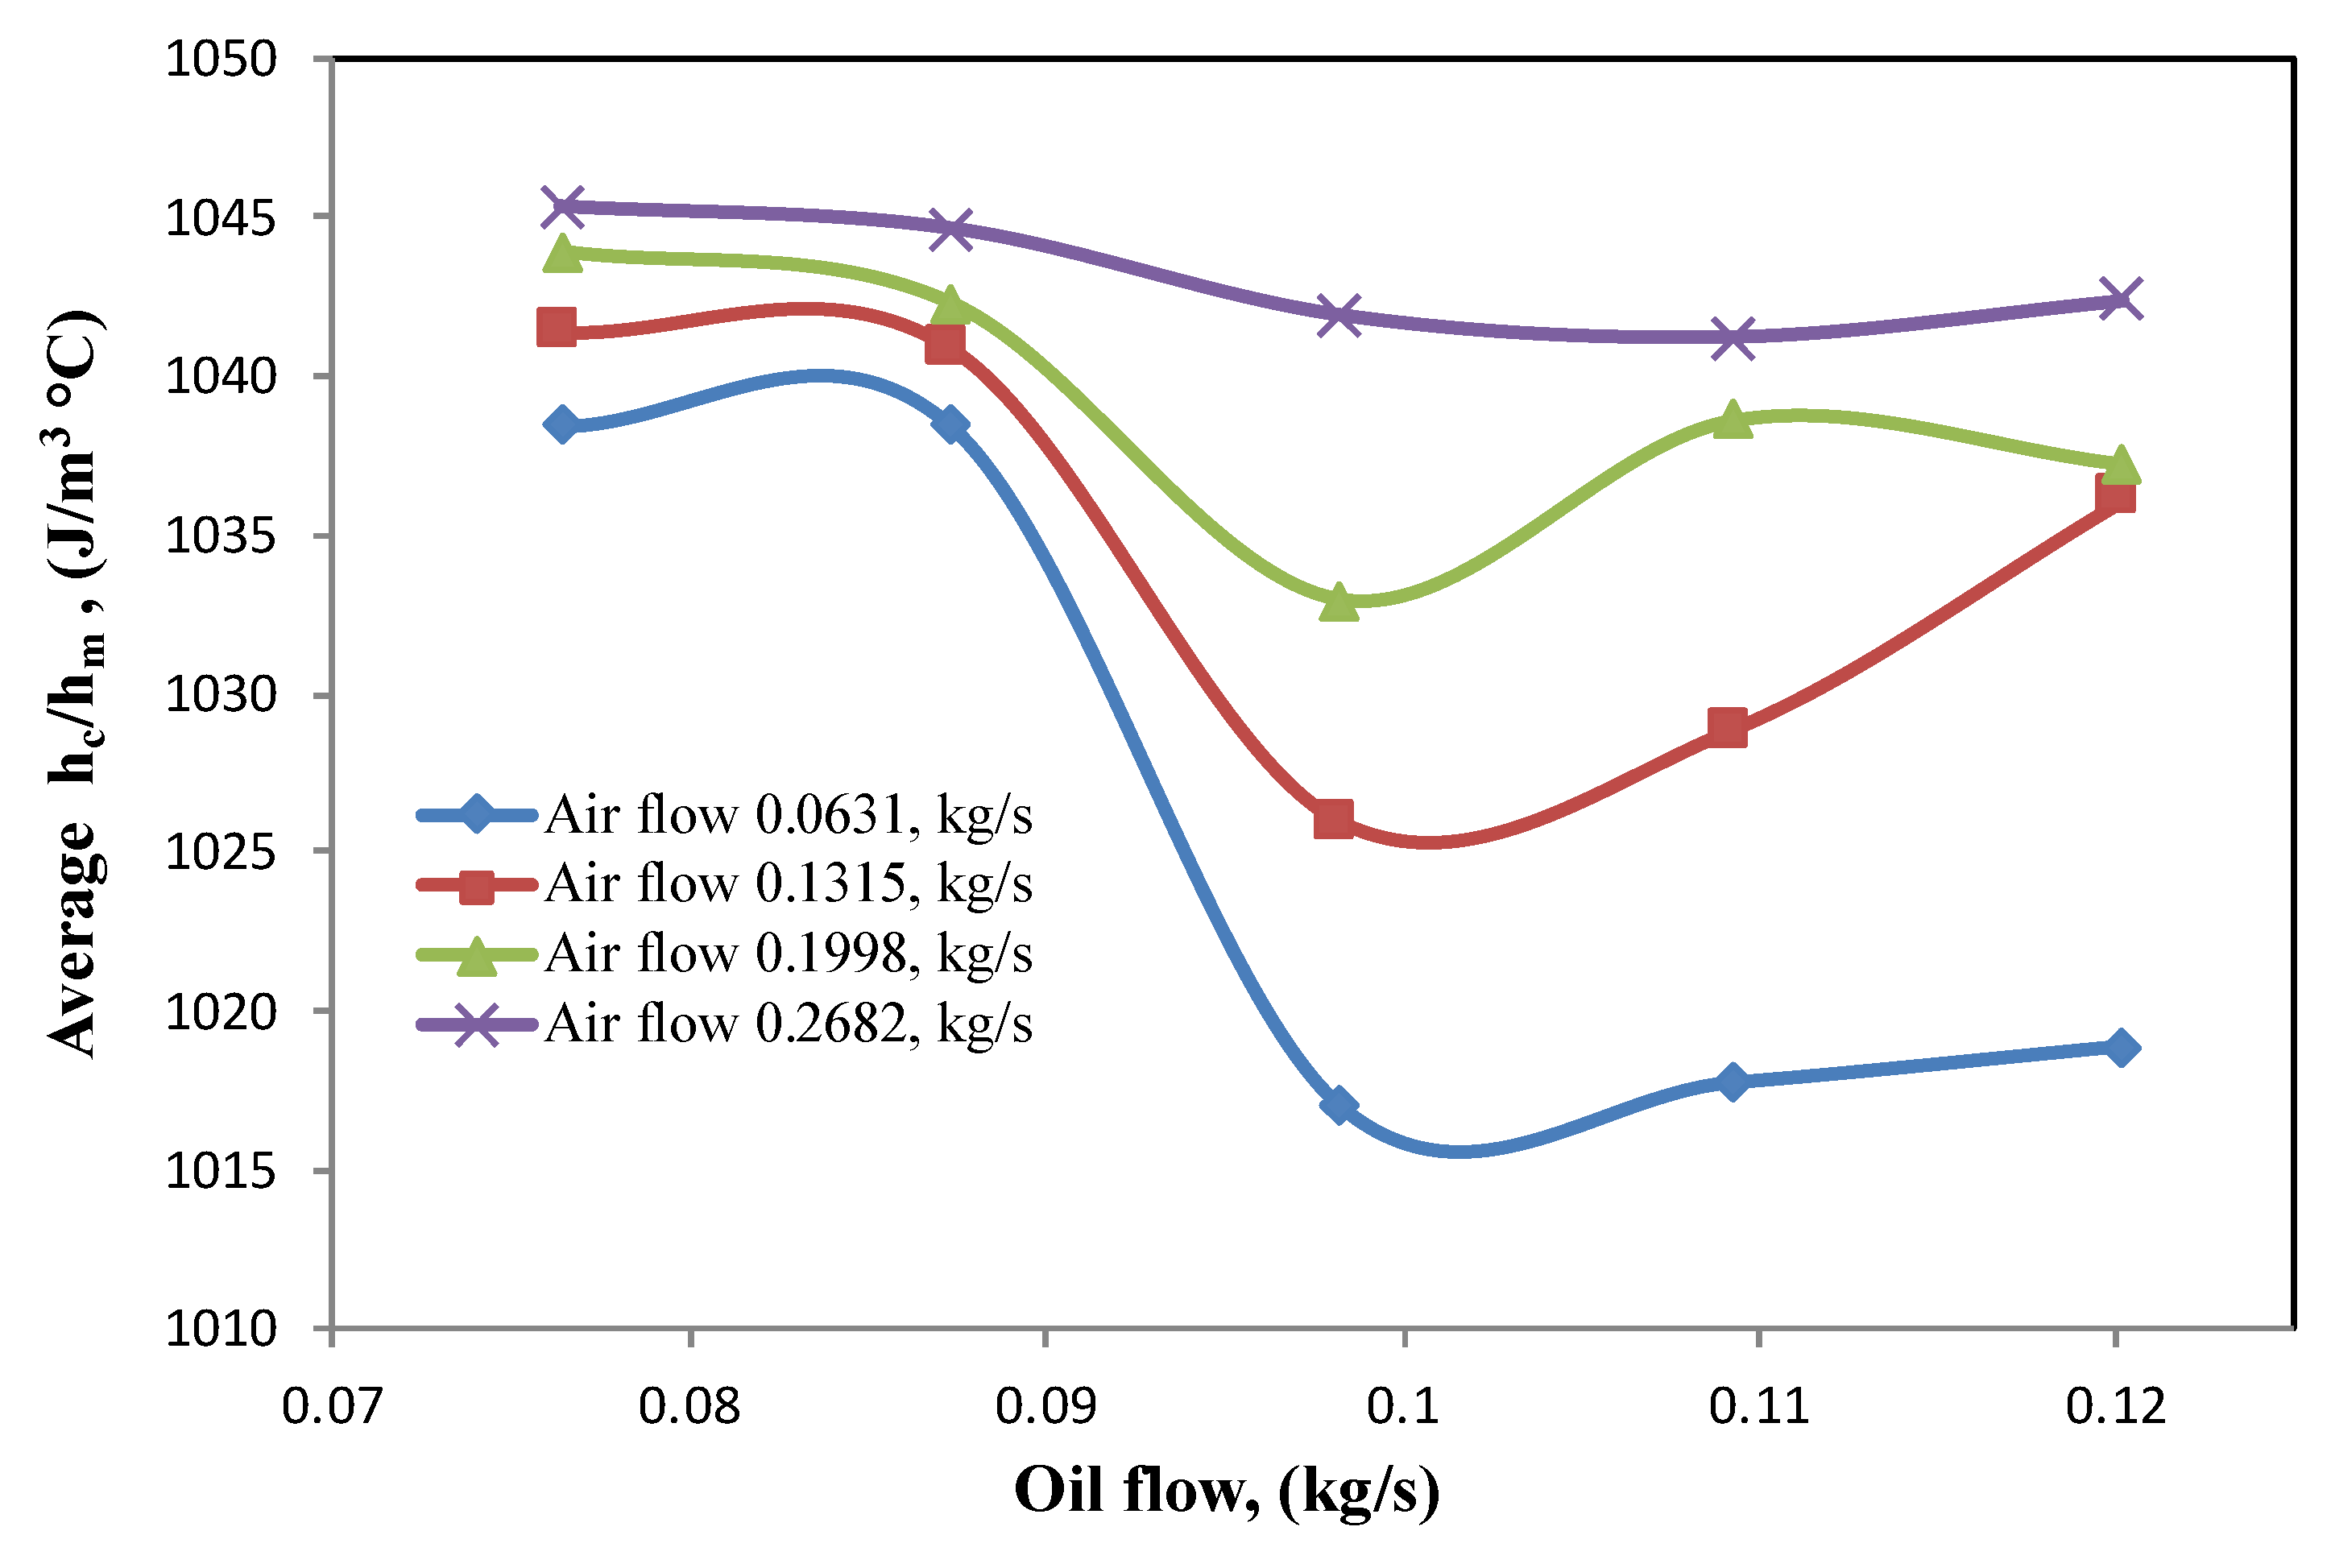
4.7. Convective Mass Transfer Coefficient
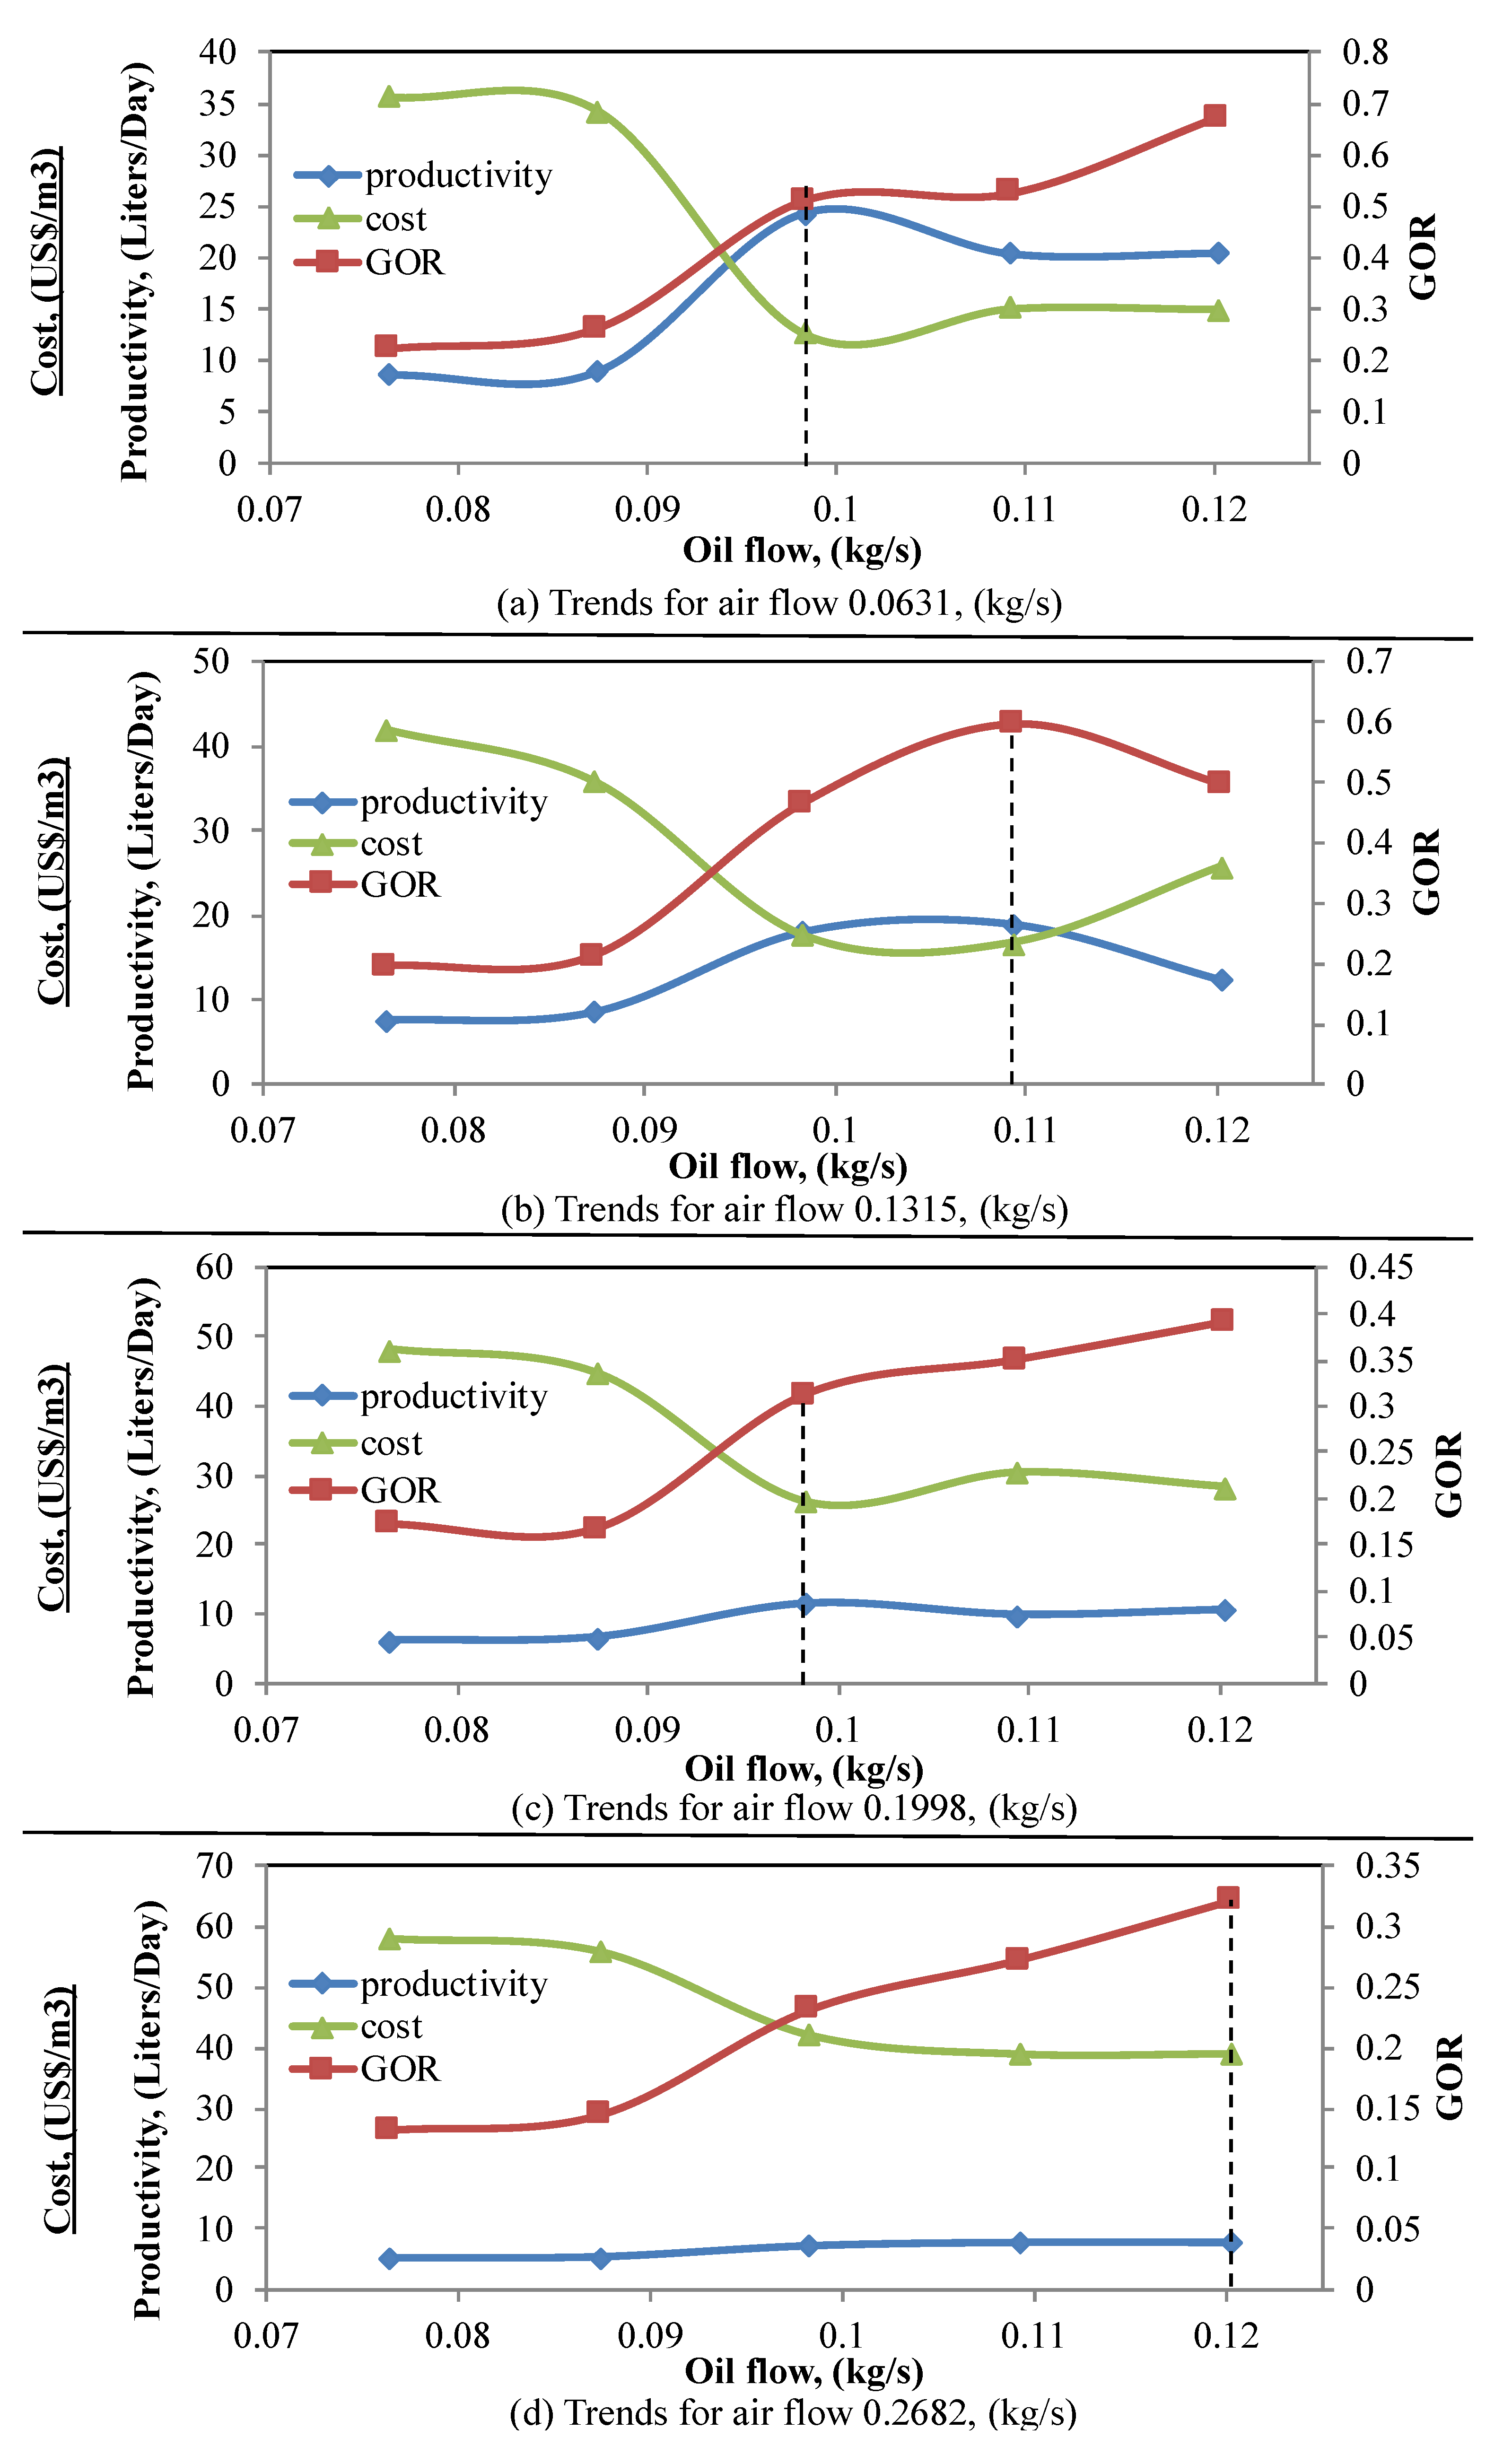
4.8. Optimum Condition
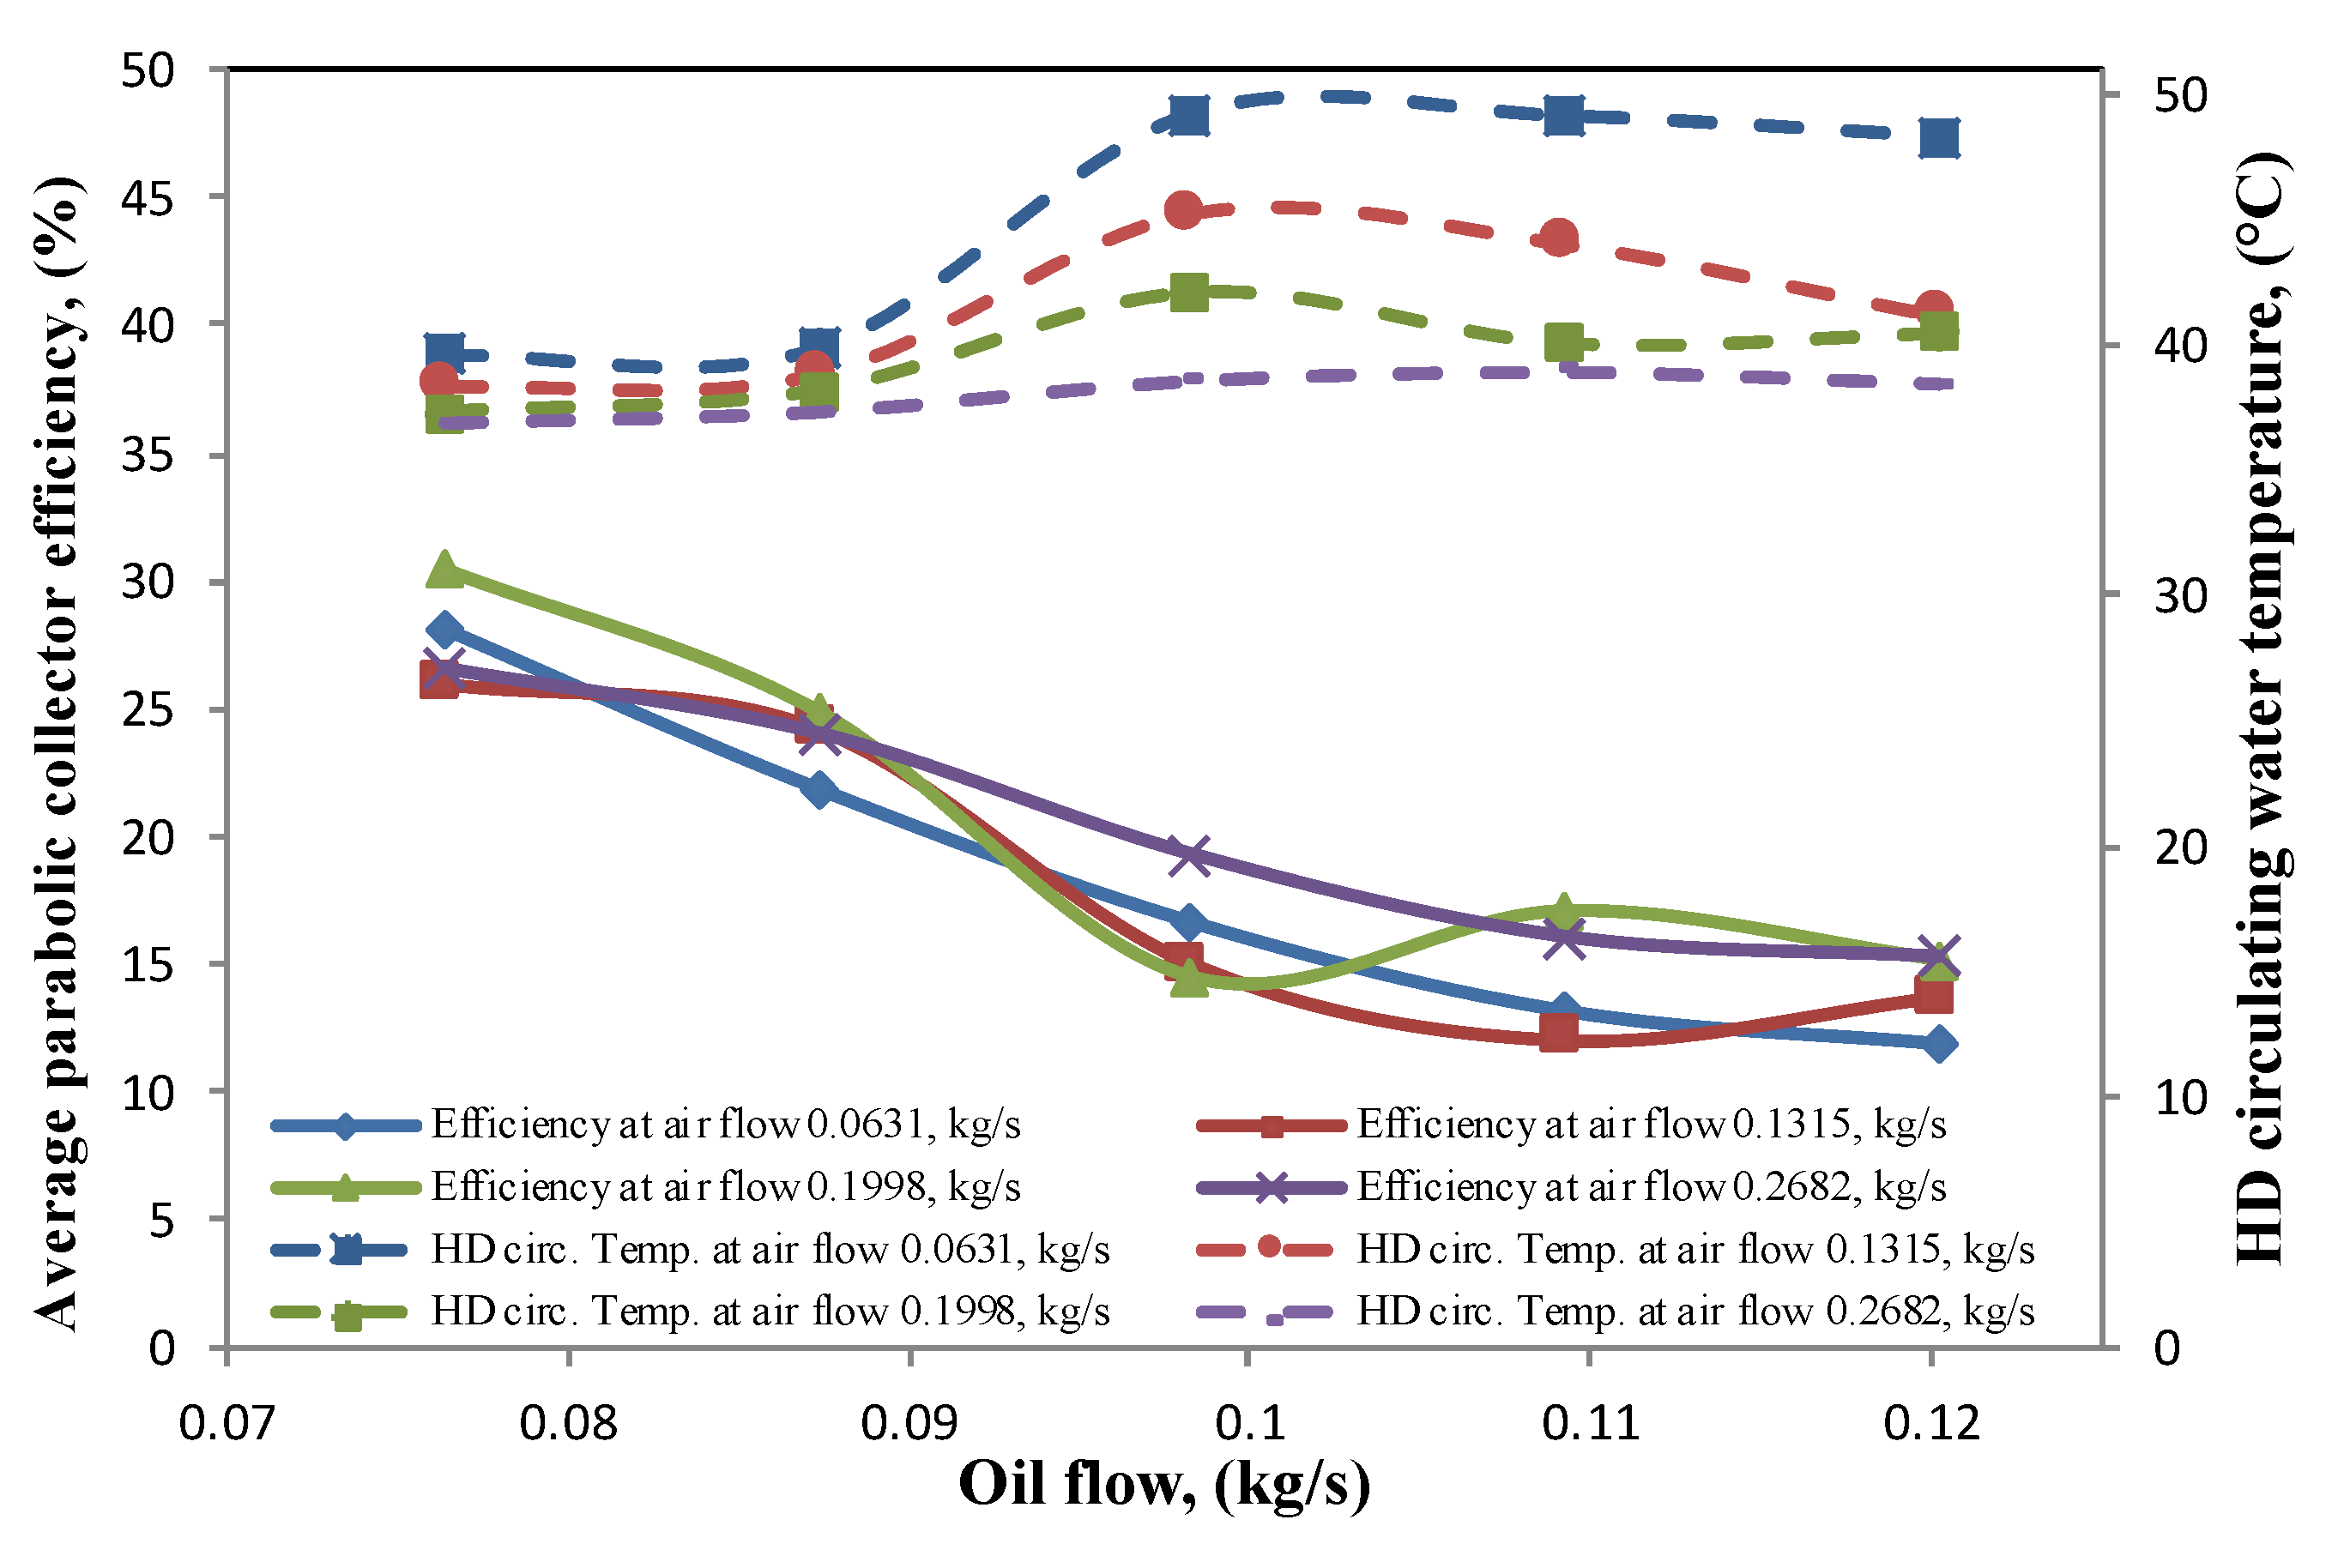
4.9. Collector Efficiency
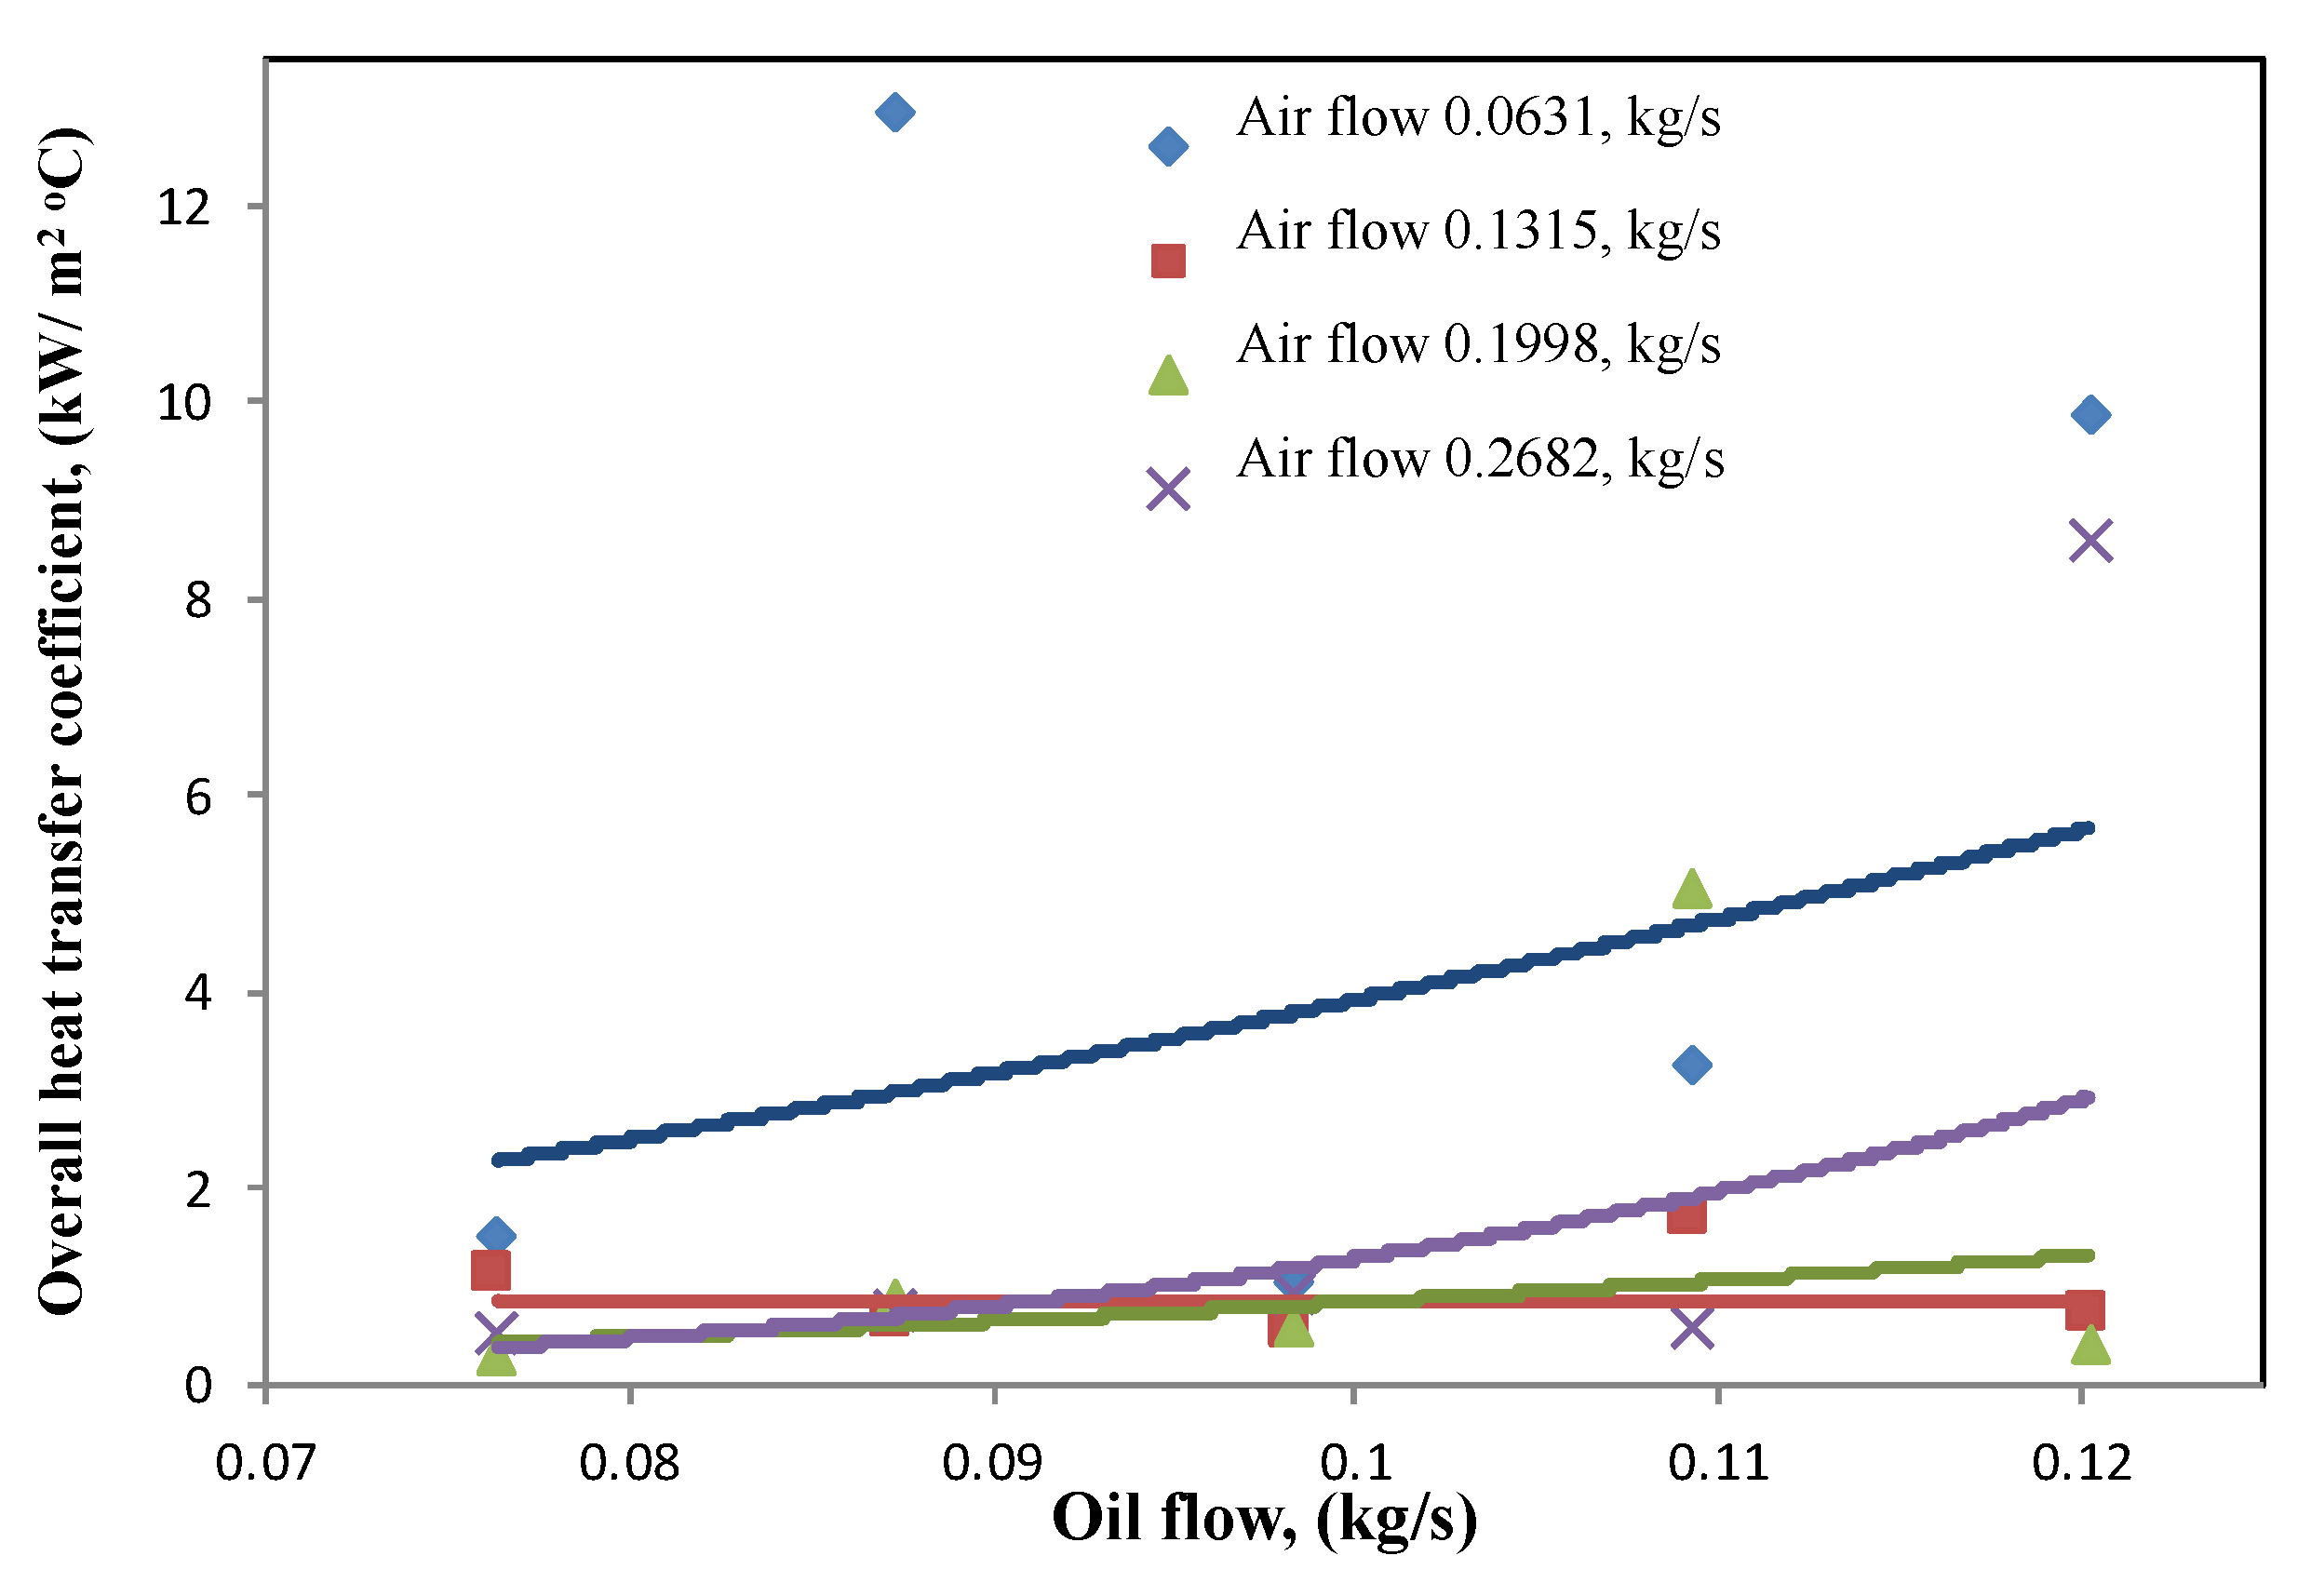
4.10. Absorber Tube Overall Heat Transfer Coefficient
5. Conclusions and Recommendations
5.1. Conclusions
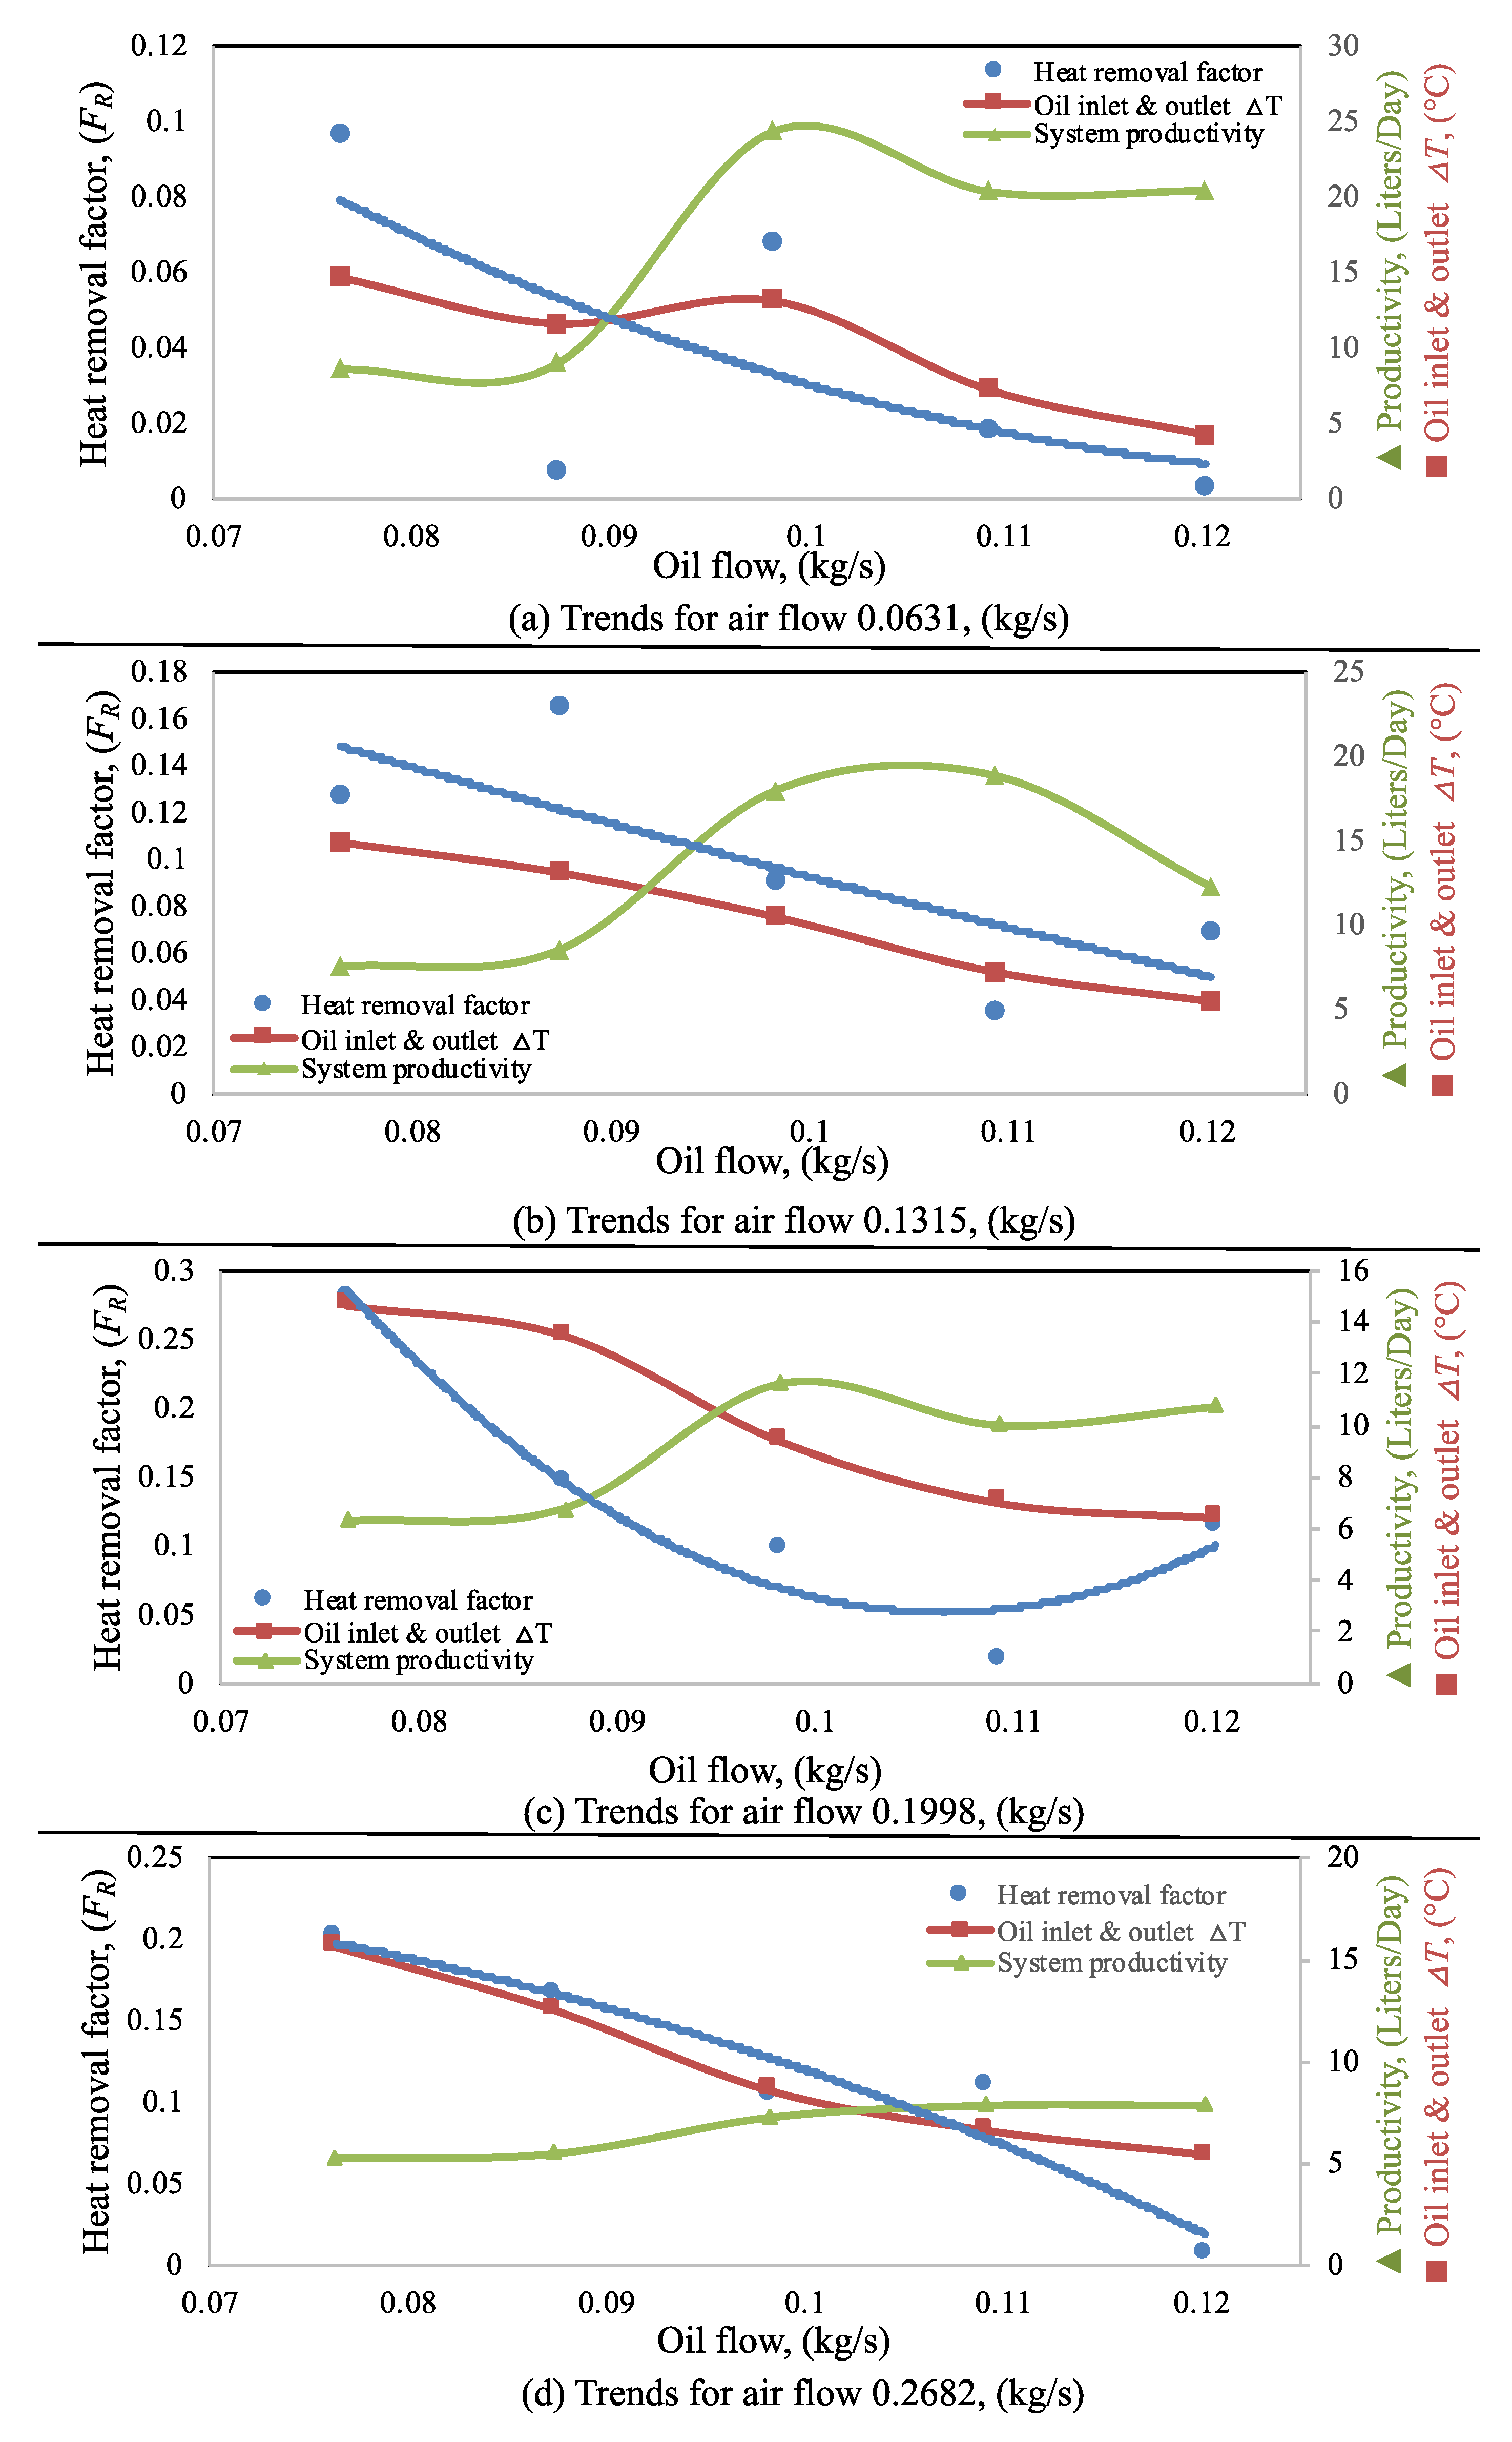
- The HDH system productivity is significantly influenced by the circulating air-to-water flow ratio, and the highest system productivity obtained is 24.31 kg/day. The best productivity curve for all the tested air flow rates is obtained at a 0.0983 kg/s circulating oil flow rate. The system showed a drastic reduction in productivity of 70.1% when the air flow rate increased to 0.2683 kg/s.
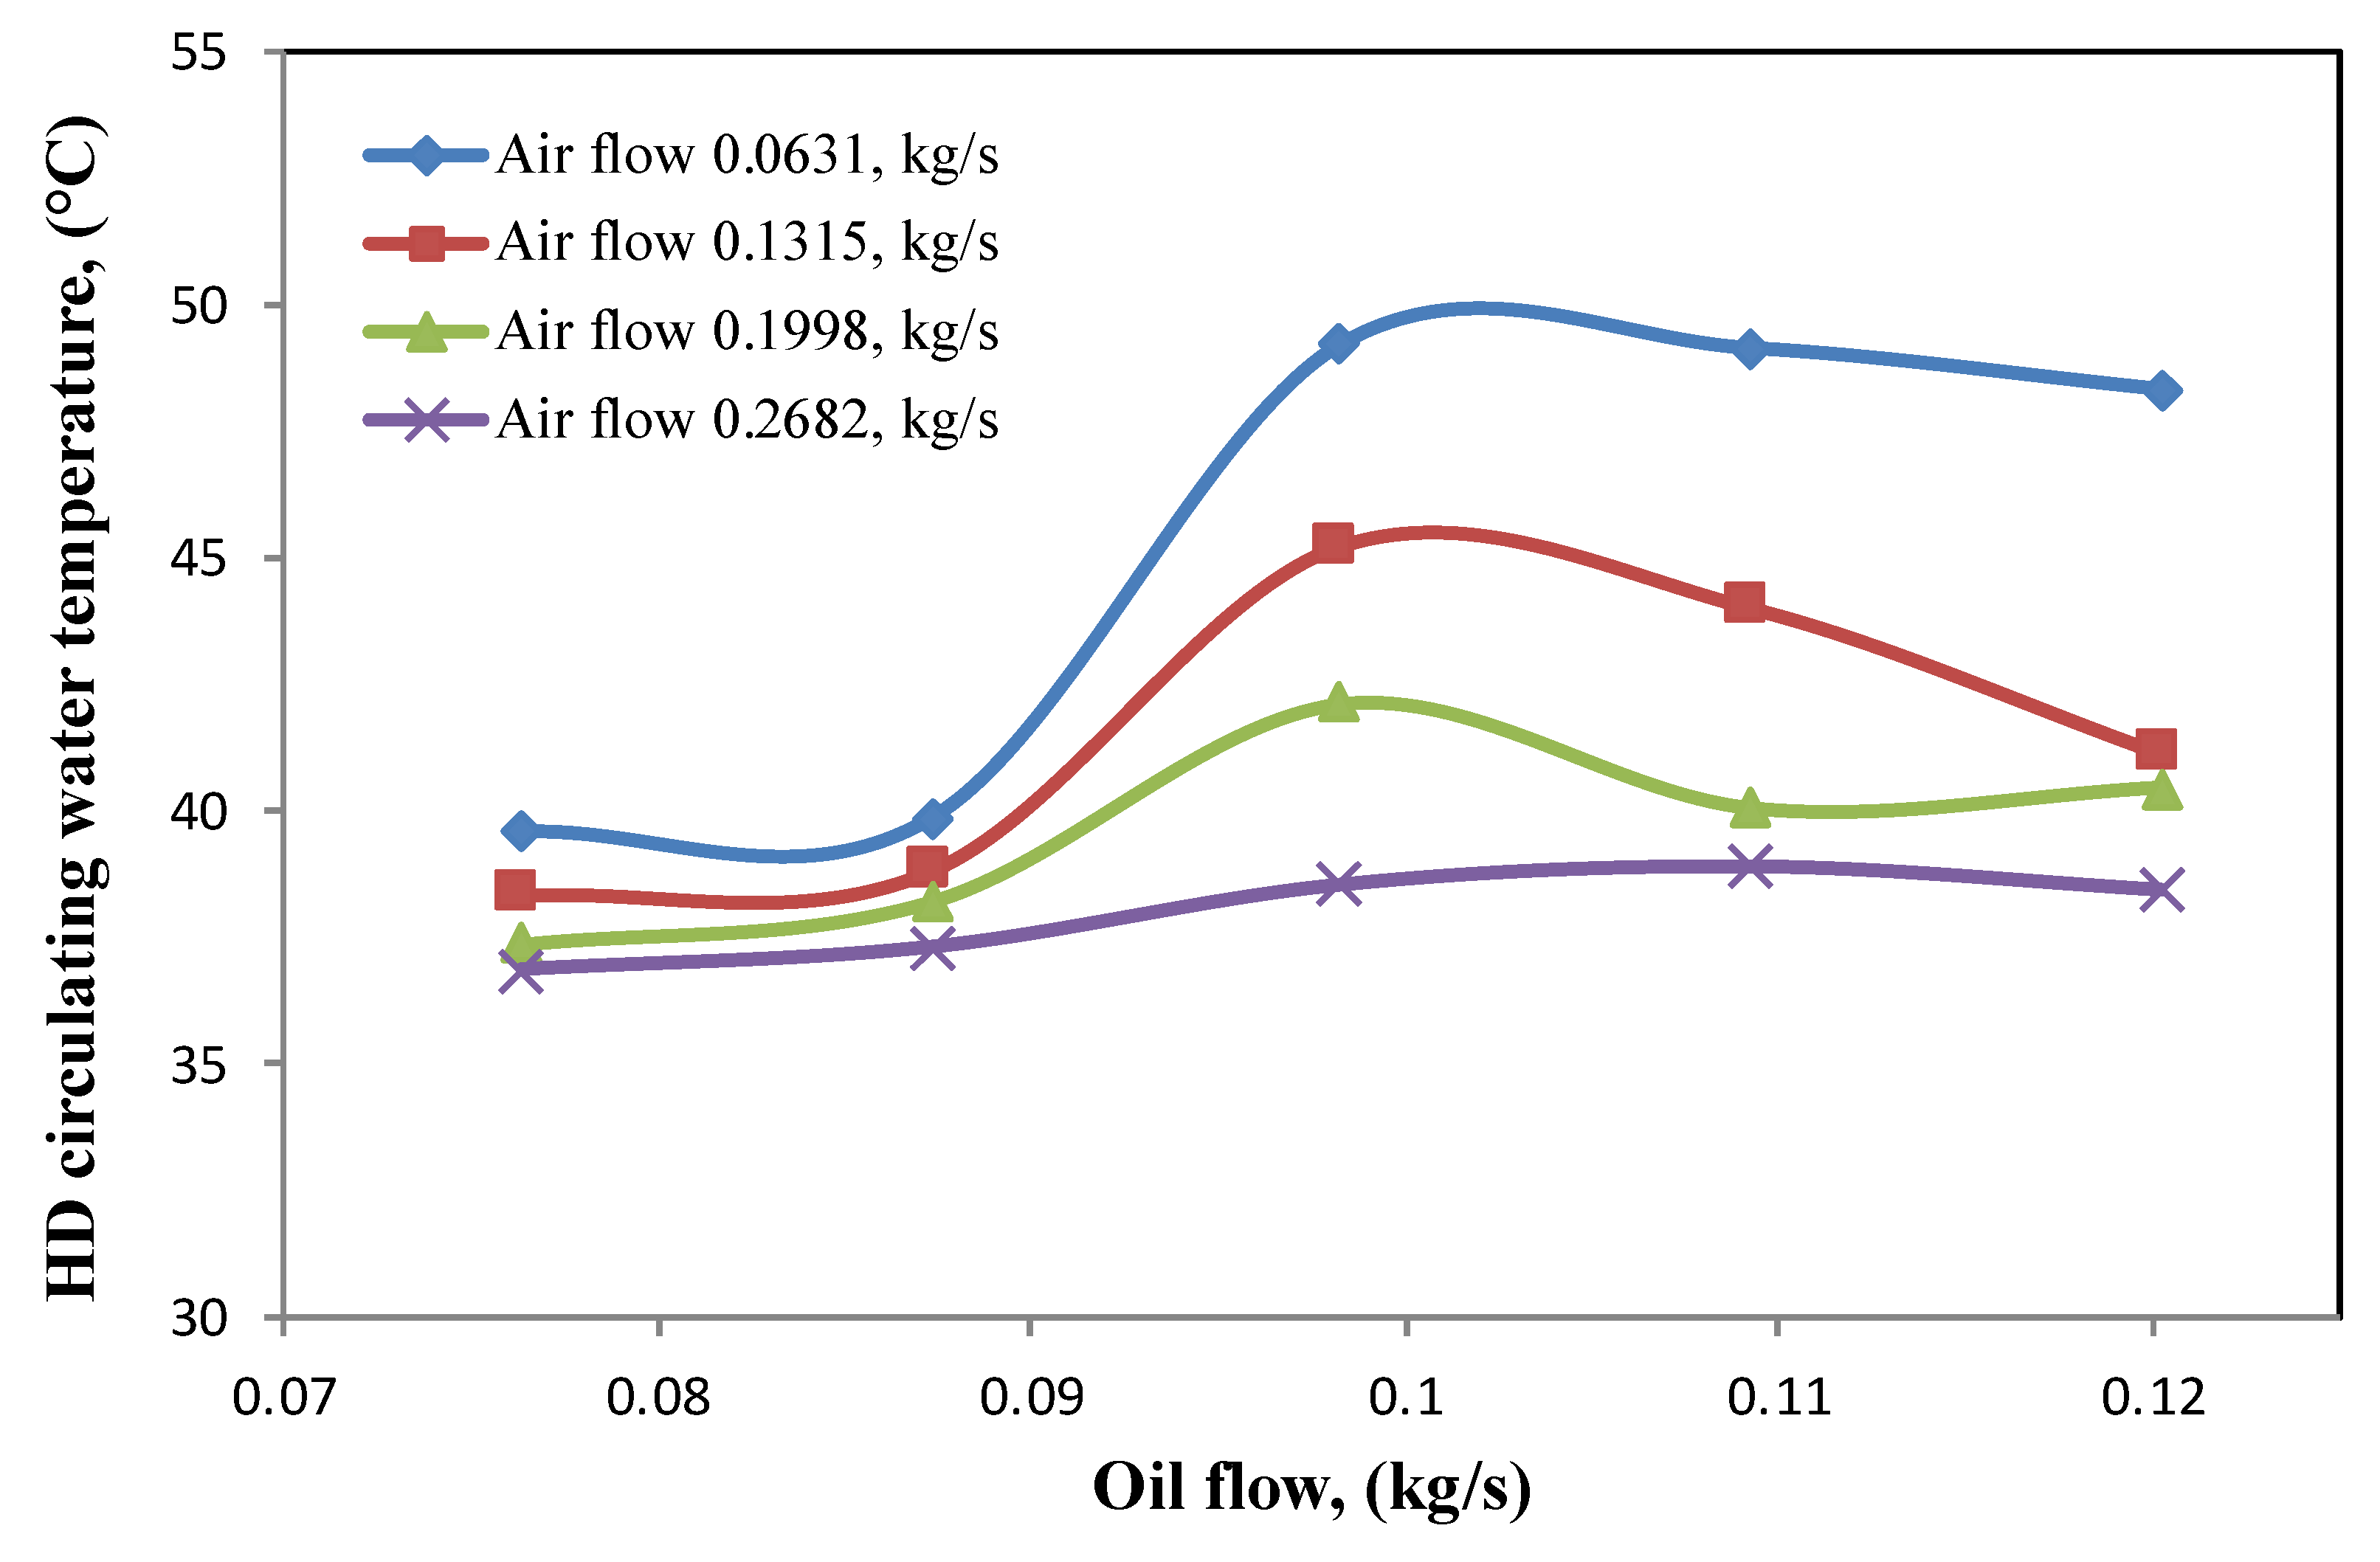
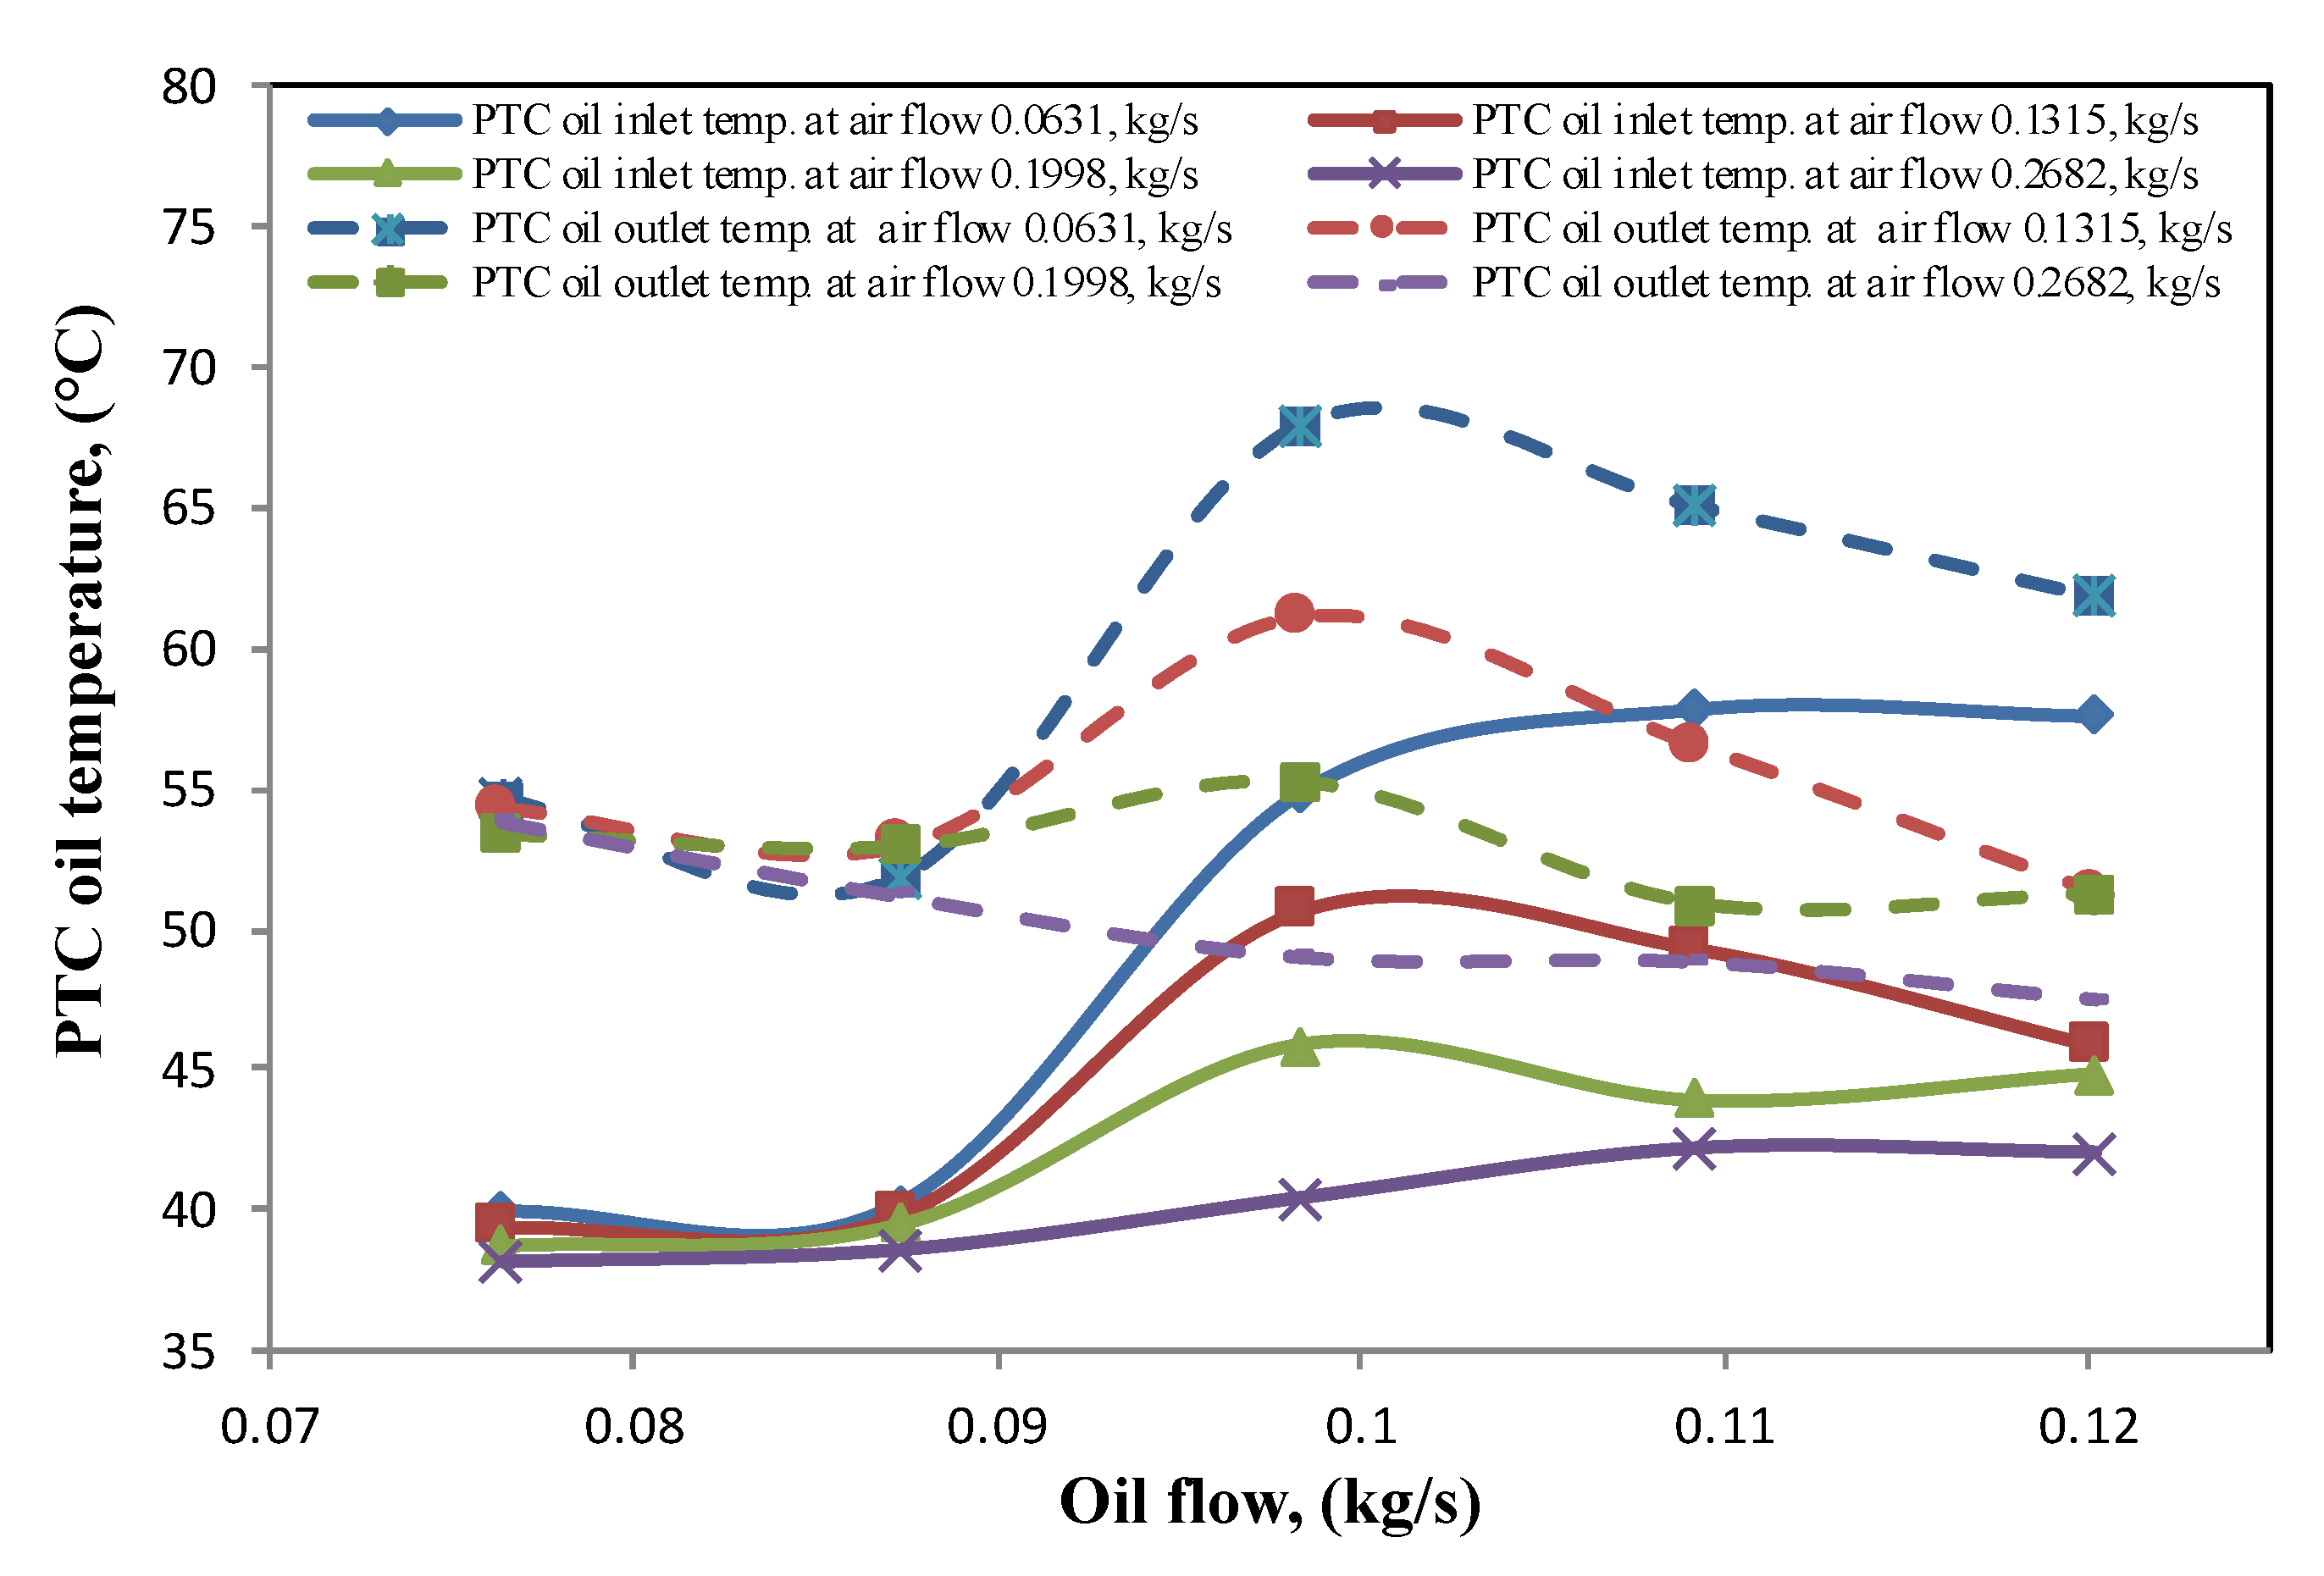
- Increasing the humidifier circulating water temperature positively affects the humidifier productivity. This has been achieved by modulating the heat input to the humidifier by altering the oil circulation through the PTCs. The maximum humidifier circulating water temperature with the highest productivity is 49.23 °C. The circulating water temperature is reduced by 21.7% when the highest circulating air flow rate of 0.2683 kg/s is achieved.
- Increasing the circulating oil flow rate positively influences the system’s productivity until the point when this starts to decline; hence, a tradeoff between either a larger size humidifier heat exchanger or larger PTC surface area is required to enhance productivity.
- The energy consumption of the process under the best conditions varies between 2.39 and 3.07 kWh, and the energy delivered to the humidifier is decreased, when further circulating oil flow is increased, and reached a 39.3% reduction at the highest oil flow rate.
- The humidifier efficiency ranges between 69.1% and 75.6%, and the thermal efficiencies are in the range of 76.6% and 82.94% at a circulating oil flow rate of 0.0983 kg/s.
- The cost analysis of the system indicates a reduction of the production cost under the highest productivity condition. A tradeoff between the cost, productivity, and GOR is necessary. The production cost is 12.54 US$/m3 under a condition where the highest GOR of 0.51 is obtained, and the maximum productivity is achieved.
- The efficiency of the PTCs is calculated, and the results showed a significant increase in the performance at a low circulating oil flow rate. The oil circulation procedure in a closed loop enhances the system efficiency by reducing the losses and enhancing the energy storage in the oil expansion tank.
5.2. Recommendations for Future Work
- The solar-driven HDH system can be coupled with other thermal desalination technologies to increase the desalination process yield. The dual-purpose plants for power and desalination can be significantly improved. The optimization of the dual-purpose system can benefit from and be enhanced using a shortcut method to address the need for conceptual design studies [51]. Moreover, decoupling the mass balances and the heat balances and heat-transfer sizing equations using the linear programming (LP) optimization formulation simplifies the computations and significantly reduces the model size and complexity [52]. A hybrid design can include both thermal and reverse osmosis plants [53]; therefore, economic optimization can be carried out in the overall system to identify the process configuration tradeoffs in various scenarios. Mixed-integer nonlinear programming (MINLP) is used for 20 RO membrane modules, and 58% of savings in freshwater use is achieved as compared to the existing base case operations [54]. The solution to this program provides the optimal arrangement, types, and sizes of the reverse-osmosis units and the booster pumps [55]. Such an application showed an improvement in the optimization, determining the optimal mix of solar energy, thermal storage, and fossil fuel to attain the maximum annual profit of the shale gas production system studied [56], which can be applied to the solar-driven HDH system studied.
- Heat integration can be performed to reduce the operating cost by coupling the HDH desalination system to industrial facilities. This approach has been implemented along with the optimization of multi-effect distillation (MED) and membrane distillation (MD) and revealed a successful cost reduction in different scenarios [57]. Moreover, coupling multi-stage flash (MSF) with MED desalination processes was shown to improve the system output due to the use of the waste heat recovery [58]. Therefore, the HDH desalination can be integrated with solar collectors, absorption refrigeration cycles, and organic Rankine cycles.
- The existing desalination systems can consider the HDH as a modular desalination technology in the retrofitting option, which increases the capacity of the output [59].
- The economic factors are the most important factors relating to project improvement; hence, the low cost-integrated solar HDH desalination system is an option that incorporates sustainability in the design and selection of projects. The metric approach can provide an evaluation of project profitability and promote sustainability related to the capital cost [60].
Author Contributions
Funding
Acknowledgments
Conflicts of Interest
Nomenclature
| A | Surface area, m2 |
| Aa | Total aperture area, m2 |
| Ae | Lost area due to end effect, m2 |
| Af | Geometric ratio, m2 |
| Al | Lost area, m2 |
| C | Collector concentration ratio |
| CA | Annual capital cost, US$ |
| CM | Maintenance cost, US$ |
| COP | Operating cost, US$ |
| Cr | Heat capacity ratio |
| CTOP | Total operating cost, US$ |
| DAB | Mass diffusion coefficient of air in water, m2/s |
| Di | Inside diameter, m |
| Do | Outer diameter, m |
| FR | PTC heat removal factor |
| Gbn | Normal beam radiation, W/m2 |
| H | Enthalpy, kJ/kg |
| I | Solar irradiance, W/m2 |
| Ky | Gas phase mass transfer coefficient of humidifier, Kg/m2 s |
| L | Latitude angel, degrees |
| N | Number of the day in the Gregorian year |
| Nu | Nusselt number |
| P | Capital cost, US$ |
| Pr | Prandtl number |
| PT | Total pressure, mmHg |
| Pv | Vapor pressures, mmHg |
| Qin | Heat transfer rate, W |
| Re | Reynolds number |
| Sc | Schmidt number |
| Ta | Air temperature, °C |
| Tcw | Cooling water temperature, °C |
| TMU | Make water temperature, °C |
| Toil | Oil temperature, °C |
| Tw | Water temperature, °C |
| U | Overall heat transfer coefficient, W/m2 °C |
| Uc | Overall heat transfer coefficient of the absorber tube, W/m2 °C |
| UL | Heat removal coefficient of the absorber tube, W/m2 °C |
| V | Volume of the humidifier, m3 |
| W | Aperture width, m |
| a | Interface area, m−1 |
| ca | Specific heat of humid air, kJ/kg °C |
| cw | Specific heat of water, kJ/kg °C |
| fc | Enthalpy correction factor, kJ/kg |
| h | Hour angle, degrees |
| hab | Oil convective heat transfer coefficient, kJ/s m2 °C |
| hc | Convective heat transfer coefficient, kJ/s m2 °C |
| hfg | Latent heat of evaporation of water at ambient conditions, kJ/kg |
| hm | Convective mass transfer coefficient, m/s |
| hp | Hight of parabola, m |
| i | Interest rate, % |
| k | Thermal conductivity, W/m °C |
| kab | Absorber tube thermal conductivity, kJ/s m2 °C |
| l | Trough length, m |
| ma | Air flow rate, Kg/s |
| mcw | Cooling water flow rate, Kg/s |
| mw | Water flow rate, Kg/s |
| md | Product water flow rate, Kg/s |
| mMU | Make up water flow rate, Kg/s |
| moil | Oil flow rate, Kg/s |
| n | Number of years |
| ts | Solar time, hour |
| Indices | |
| a | Air |
| amb | Ambient condition |
| as | Saturated air |
| avg | Average value |
| DH | Dehumidifier |
| HD | Humidifier |
| lm | Log mean |
| m | Mean value |
| oil | Oil side |
| s | Saturated |
| v | vapor |
| w | water |
| Greek | |
| α | Altitude angel, degrees |
| β | Slop of the PTC surface, degrees |
| γ | Intercept factor |
| δ | Declination angle, degrees |
| ε | Heat exchanger effectiveness |
| ξ | Reflectance of the reflector |
| η | PTC efficiency, % |
| ηH | Humidifier efficiency, % |
| Humidifier thermal efficiency, % | |
| ηo | Optical efficiency, % |
| θ | The incident angle, degrees |
| θz | Zenith angle, degrees |
| λ0 | Latent heat of evaporation of water at base temperature, kJ/kg |
| μ | Dynamic viscosity, kg/m s |
| ρ | Density, kg/m3 |
| τ | Transmittance of the glass cover |
| ϕ | Azimuth angle, degrees |
| ϕs | Surface azimuth angle, degrees |
| ψ | Absorptance of the receiver |
| ω | Absolute humidity, kgwater/kgair |
Appendix A


References
- Al-Rashed, M.F.; Sherif, M.M. Water resources in the GCC countries: An overview. Water Resour. Manag. 2000, 14, 59–75. [Google Scholar] [CrossRef]
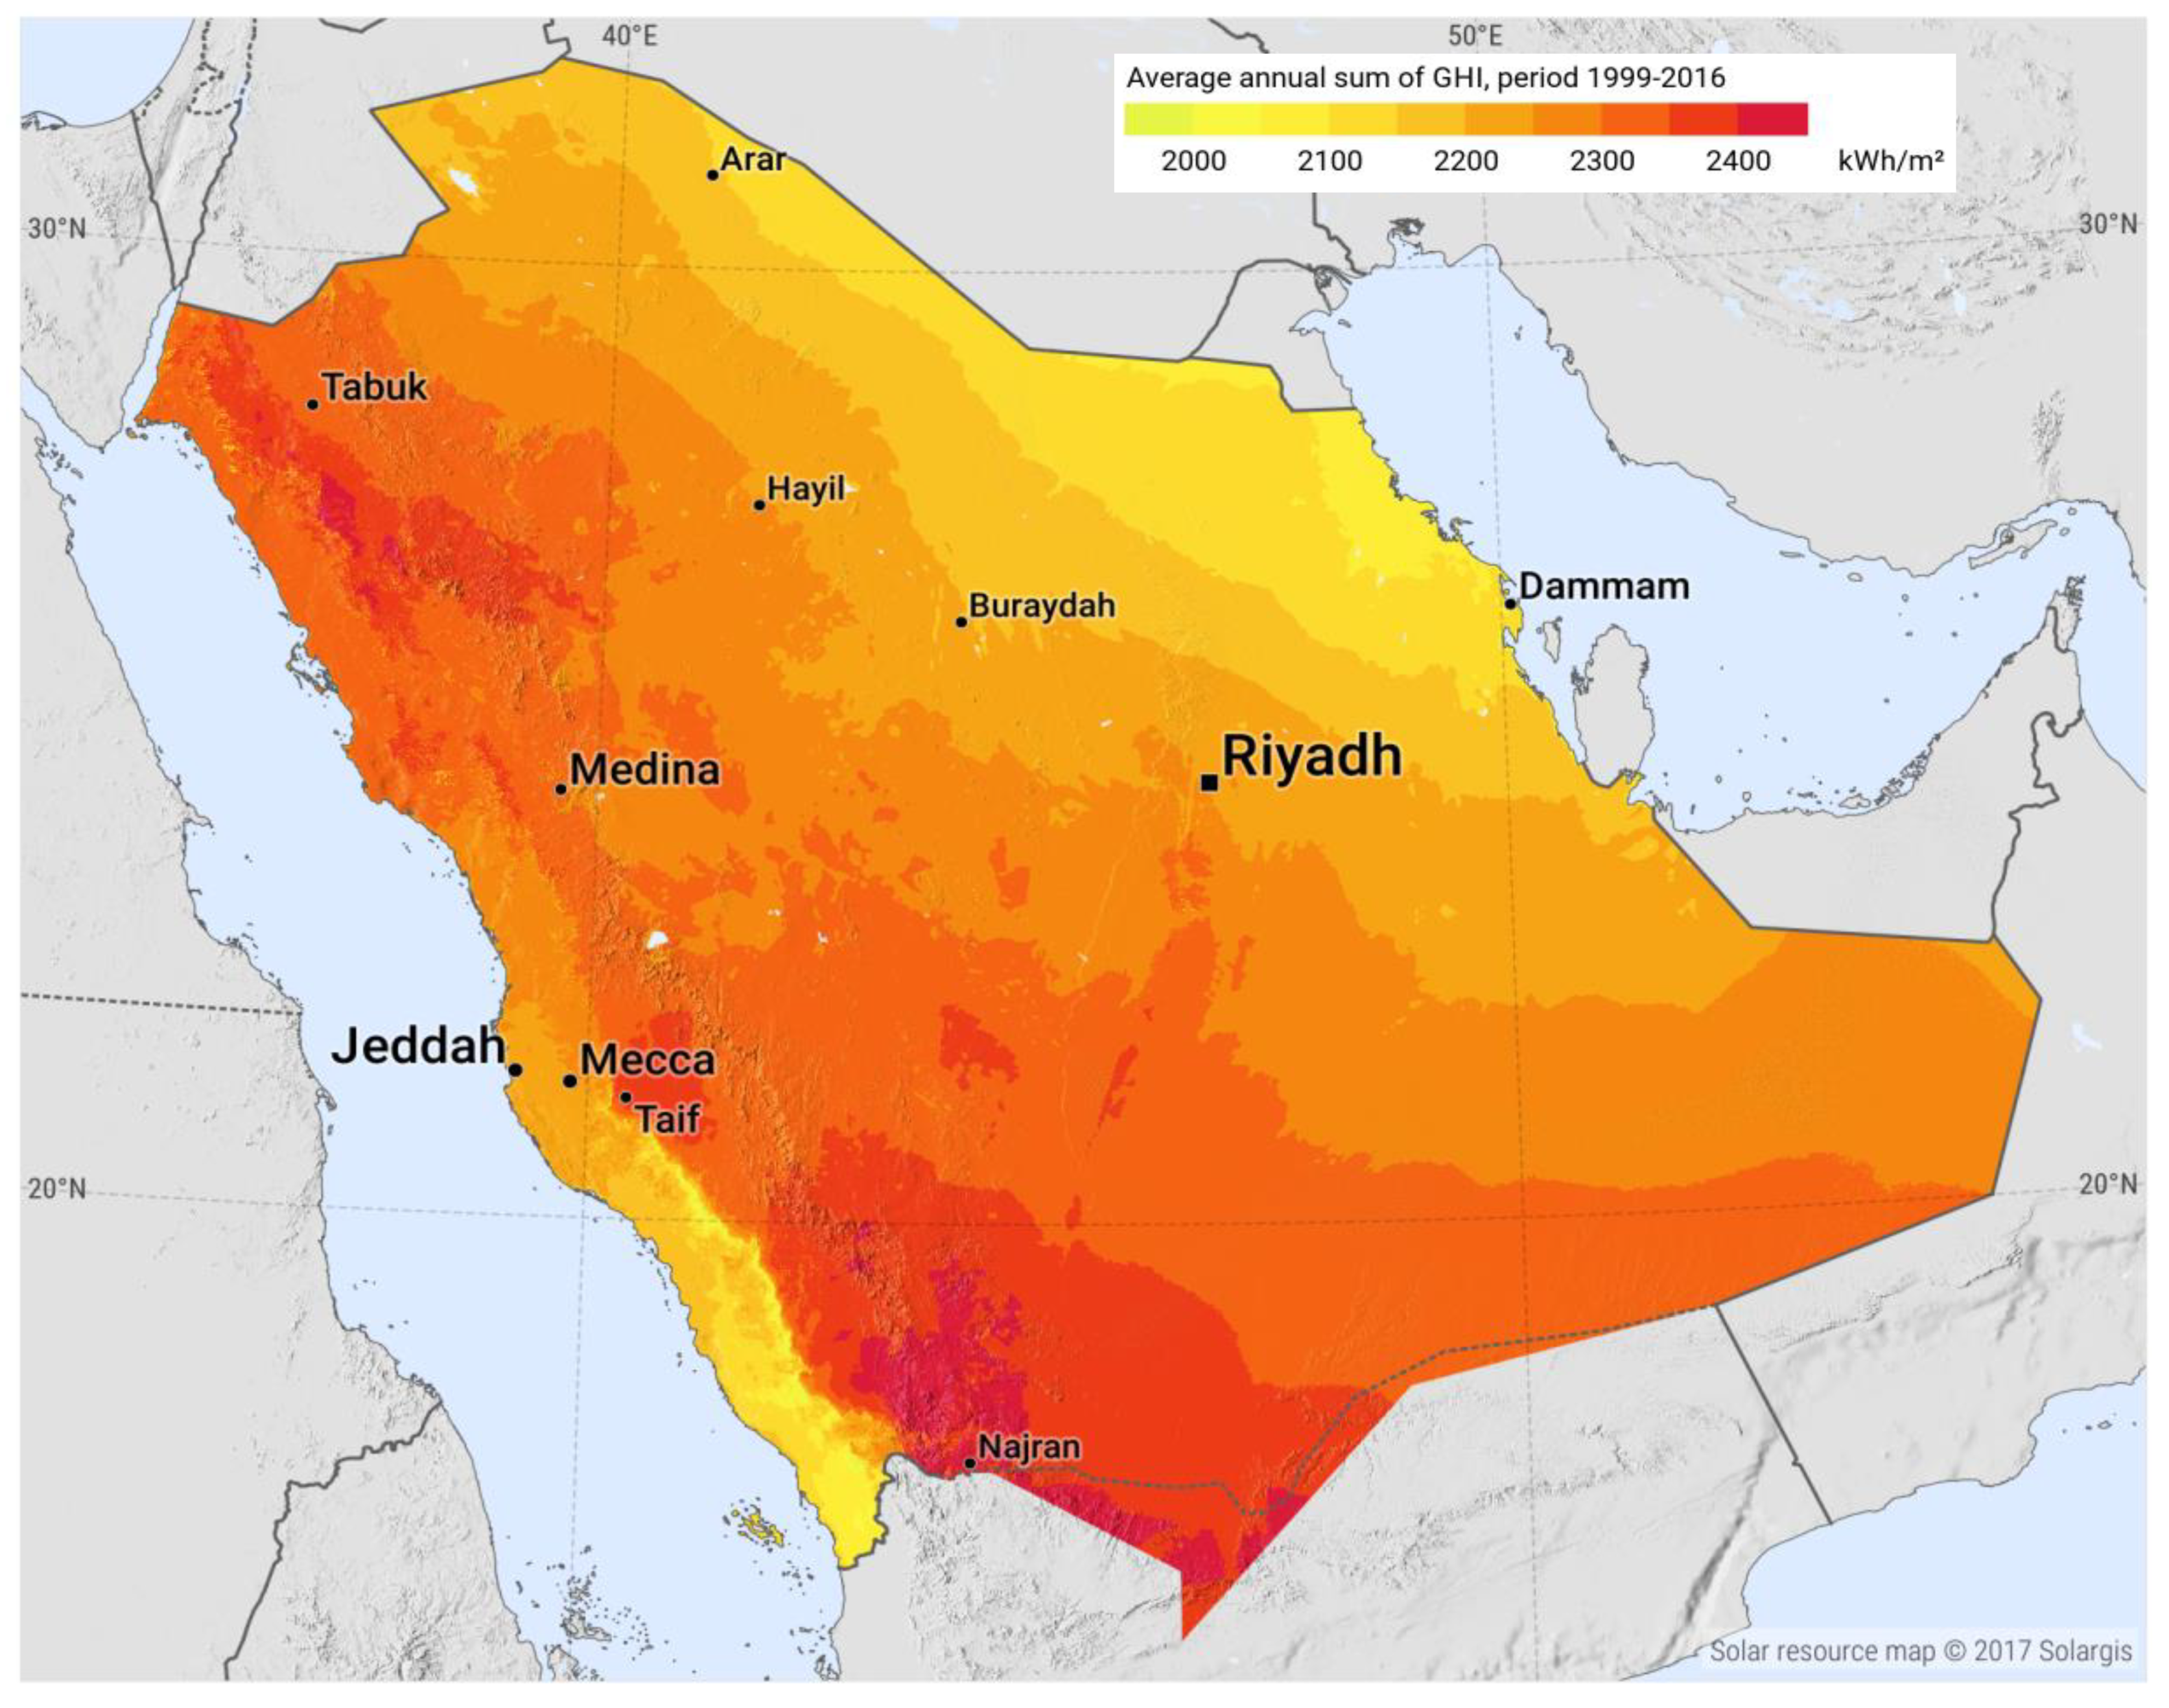
- Almasoud, A.H.; Gandayh, H.M. Future of solar energy in Saudi Arabia. J. King Saud Univ. Eng. Sci. 2015, 27, 153–157. [Google Scholar] [CrossRef]
- Zell, E.; Gasim, S.; Wilcox, S.; Katamoura, S.; Stoffel, S.; Shibli, H.; Engel-Cox, J.; Al Subie, M. Assessment of solar radiation resources in Saudi Arabia. Sol. Energy 2015, 119, 422–438. [Google Scholar] [CrossRef]
- Pazheri, F.R. Solar power potential in Saudi Arabia. Int. J. Eng. Res. Appl. 2014, 4, 171–174. [Google Scholar]
- Solar GIS, Solar Resource Maps of Saudi Arabia. Available online: https://solargis.com/maps-and-gis-data/download/saudi-arabia (accessed on 5 May 2018).
- Tzivanidis, C.; Bellos, E.; Korres, D.; Antonopoulos, K.A.; Mitsopoulos, G. Thermal and optical efficiency investigation of a parabolic trough collector. Case Stud. Therm. Eng. 2015, 6, 226–237. [Google Scholar] [CrossRef]
- Yassen, T.A. Experimental and theoretical study of a parabolic trough solar collector. Anbar J. Eng. Sci. 2012, 5, 109–125. [Google Scholar]
- Murtuza, S.A.; Byregowda, H.V.; Imran, M. Experimental and simulation studies of parabolic trough collector design for obtaining solar energy. Resour. Eff. Technol. 2017, 3, 414–421. [Google Scholar] [CrossRef]
- Jebasingh, V.K.; Joselin, G.M. A review of solar parabolic trough collector. Renew. Sustain. Energy Rev. 2016, 54, 1085–1091. [Google Scholar] [CrossRef]
- Arun, C.A.; Sreekumar, P.C. Modeling and performance evaluation of parabolic trough solar collector desalination system. Mater. Today Proc. 2018, 5, 780–788. [Google Scholar] [CrossRef]
- Elashmawy, M. An experimental investigation of a parabolic concentrator solar tracking system integrated with a tubular solar still. Desalination 2017, 411, 1–8. [Google Scholar] [CrossRef]
- Zohreh, R.; Hatamipour, M.S.; Ghalavand, Y. Solar assisted modified variable pressure humidification-dehumidification desalination system. Energy Convers. Manag. 2018, 162, 321–330. [Google Scholar]
- Mohamed, A.M.I.; El-Minshawy, N.A. Theoretical investigation of solar humidification–dehumidification desalination system using parabolic trough concentrators. Energy Convers. Manag. 2011, 52.10, 3112–3119. [Google Scholar] [CrossRef]
- Fathy, M.; Hamdy, H.; Salem, M. Experimental study on the effect of coupling parabolic trough collector with double slope solar still on its performance. Sol. Energy 2018, 163, 54–61. [Google Scholar] [CrossRef]
- Kabeel, A.E.; Hamed, M.H.; Omara, Z.M.; Sharshir, S.W. Water desalination using a humidification-dehumidification technique—A detailed review. Nat. Resour. 2013, 4, 286–305. [Google Scholar] [CrossRef]
- Srithar, K.; Rajaseenivasan, T. Performance analysis on a solar bubble column humidification dehumidification desalination system. Process Saf. Environ. Prot. 2017, 105, 41–50. [Google Scholar] [CrossRef]
- Zubair, S.M.; Antar, M.A.; Elmutasim, S.M.; Lawa, D.U. Performance evaluation of humidification-dehumidification (HDH) desalination systems with and without heat recovery options: An experimental and theoretical investigation. Desalination 2018, 436, 161–175. [Google Scholar] [CrossRef]
- Hamed, M.H.; Kabeel, A.E.; Omara, Z.M.; Sharshir, S.W. Mathematical and experimental investigation of a solar humidification–dehumidification desalination unit. Desalination 2015, 358, 9–17. [Google Scholar] [CrossRef]
- Ahmed, H.A.; Ismail, I.M.; Saleh, W.F.; Ahmed, M. Experimental investigation of humidification-dehumidification desalination system with corrugated packing in the humidifier. Desalination 2017, 410, 19–29. [Google Scholar] [CrossRef]
- Ghaffour, N.; Bundschuh, J.; Mahmoudi, H.; Goosen, M.F. Renewable energy-driven desalination technologies: A comprehensive review on challenges and potential applications of integrated systems. Desalination 2015, 356, 94–114. [Google Scholar] [CrossRef] [Green Version]
- Li, C.; Goswami, Y.; Stefanakos, E. Solar assisted sea water desalination: A review. Renew. Sustain. Energy Rev. 2013, 19, 136–163. [Google Scholar] [CrossRef]
- Boyes, W. Instrumentation Reference Book, 3rd ed.; Elsevier Butterworth-Heinemann: Burlington, MA, USA, 2003; p. 272. [Google Scholar]
- Kalogirou, S.A. Solar Energy Engineering: Processes and Systems, 2nd ed.; Academic Press: Waltham, MA, USA, 2013. [Google Scholar]
- Rabl, A. Active Solar Collectors and Their Applications; Oxford University Press: New York, NY, USA, 1985. [Google Scholar]
- Camacho, E.F.; Berenguel Soria, M.; Rubio, F.R.; Martínez, D. Control of Solar Energy Systems; Springer Science & Business Media: New York, NY, USA, 2012; pp. 25–47. [Google Scholar]
- Wang, S.K. Handbook of Air Conditioning and Refrigeration, 2nd ed.; McGraw-Hill: New York, NY, USA, 2001. [Google Scholar]
- Coccia, G.; Di Nicola, G.; Hidalgo, A. Parabolic trough Collector Prototypes for Low-Temperature Process Heat; Springer International Publishing AG Switzerland: Basel, Switzerland, 2016. [Google Scholar]
- Goswami, D.Y.; Kreith, F.; Kreider, J.F. Principles of Solar Engineering, 2nd ed.; CRC Press (Taylor and Francis Group): Philadelphia, PA, USA, 2000. [Google Scholar]
- Kreith, F.; Jan, F.K. Principles of Solar Engineering; Hemisphere Pub. Corp.: Washington, WN, USA, 1978. [Google Scholar]
- Duffie, J.A.; Beckman, W.A. Solar Engineering of Thermal Processes; John Wiley & Sons: Hoboken, NJ, USA, 2013. [Google Scholar]
- Abdel-Hady, F.; Shakil, S.; Hamed, M.; Alzahrani, A.; Mazher, A. Simulation and Manufacturing of an Integrated Composite Material Parabolic Trough Solar Collector. Int. J. Eng. Technol. 2016, 8, 2333–2345. [Google Scholar] [CrossRef]
- Incropera, F.P.; Dewitt, D.P.; Bergman, T.L.; Lavine, A.S. Fundamentals of Heat and Mass Transfer, 6th ed.; John Wiley & Sons: Danvers, MA, USA, 2007. [Google Scholar]
- Bejan, A.; Kraus, A.D. Heat Transfer handbook; John Wiley & Sons: Hoboken, NJ, USA, 2003; Volume 1. [Google Scholar]
- Kröger, D.G. Air-Cooled Heat Exchangers and Cooling Towers. Thermal-Flow Performance Evaluation and Design; PennWell Corporation: Tulsa, OK, USA, 2004; Volume 1. [Google Scholar]
- Jaber, H.; Webb, B.L. Design of Cooling Towers by the Effectiveness-NTU Method. ASME J. Heat Transf. 1989, 111, 837–843. [Google Scholar] [CrossRef]
- Narayan, G.P.; Mistry, K.H.; Sharqawy, M.H.; Zubair, S.M.; Lienhard, J.H. Energy effectiveness of simultaneous heat and mass exchange devices. Front. Heat Mass Transf. 2010, 1, 023001. [Google Scholar] [CrossRef]
- Kreith, F. The CRC Handbook of Thermal Engineering; CRC Press LLC: Boca Raton, FL, USA, 2000. [Google Scholar]
- Çengel, Y.A.; Boles, M.A. Thermodynamics: An Engineering Approach, 5th ed.; McGraw-Hill: New York, NY, USA, 2006. [Google Scholar]
- Sinnott, R.K. Coulson & Richardson’s Chemical Engineering, Chemical Engineering Design, 4th ed.; Elsevier Butterworth-Heinemann: Oxford, UK, 2005; Volume 6. [Google Scholar]
- Kabeel, A.E.; El-Said, E.M.S. Applicability of flashing desalination technique for small scale needs using a novel integrated system coupled with nanofluid-based solar collector. Desalination 2014, 333, 10–22. [Google Scholar] [CrossRef]
- Towler, G.; Sinnott, R. Chemical Engineering Design Principles, Practice and Economics of Plant and Process Design; Elsevier Butterworth-Heinemann: Burlington, MA, USA, 2008. [Google Scholar]
- El-Halwagi, M.M. Introduction to Sustainability, Sustainable Design, and Process Integration. In Sustainable Design through Process Integration: Fundamentals and Applications to Industrial Pollution Prevention, Resource Conservation, and Profitability Enhancement, 2nd ed.; IChemE, Elsevier: New York, NY, USA, 2017. [Google Scholar]
- El-Dessouky, H.T.; Ettouney, H. Fundamentals of Salt Water Desalination; Elsevier Science B.V.: Amsterdam, The Netherlands, 2002. [Google Scholar]
- Khisty, J.C.; Mohammadi, J.; Amekudzi, A.A. Systems Engineering with Economics, Probability and Statistics, 2nd ed.; J. Ross Publishing: Lauderdale, FL, USA, 2012. [Google Scholar]
- Saudi Electricity Company Official Web Site. Available online: https://www.se.com.sa/en-us/Customers/Pages/TariffRates.aspx (accessed on 12 March 2018).
- Sharshir, S.W.; Peng, G.; Yang, N.; Eltawil, M.A.; Ali, M.K.A.; Kabeel, A.E. A hybrid desalination system using humidification-dehumidification and solar stills integrated with evacuated solar water heater. Energy Convers. Manag. 2016, 124, 287–296. [Google Scholar] [CrossRef]
- Zhani, K.; Bacha, H.B. Experimental investigation of a new solar desalination prototype using the humidification dehumidification principle. Renew. Energy 2010, 35, 2610–2617. [Google Scholar] [CrossRef]
- Deniz, E.; Çınar, S. Energy, exergy, economic and environmental (4E) analysis of a solar desalination system with humidification-dehumidification. Energy Convers. Manag. 2016, 126, 12–19. [Google Scholar] [CrossRef]
- Zubair, M.I.; Al-Sulaiman, F.A.; Antar, M.A.; Al-Dini, S.A.; Ibrahim, N.I. Performance and cost assessment of solar driven humidification dehumidification desalination system. Energy Convers. Manag. 2017, 132, 28–39. [Google Scholar] [CrossRef]
- Behnam, P.; Shafii, M.B. Examination of a solar desalination system equipped with an air bubble column humidifier, evacuated tube collectors and thermosyphon heat pipes. Desalination 2016, 397, 30–37. [Google Scholar] [CrossRef]
- El-Halwagi, M.M. A Shortcut Approach to the Design of Once-Through Multi-Stage Flash Desalination Systems. Desalin. Water Treat. 2017, 62, 43–56. [Google Scholar] [CrossRef]
- Gabriel, K.J.; Noureldin, M.M.B.; Linke, P.; El-Halwagi, M.M. Optimization of Multi-Effect Distillation Process Using a Linear Enthalpy Model. Desalination 2015, 365, 261–276. [Google Scholar] [CrossRef]
- Gabriel, K.; El-Halwagi, M.M.; Linke, P. Optimization Across Water-Energy Nexus for Integrating Heat, Power, and Water for Industrial Processes Coupled with Hybrid Thermal-Membrane Desalination. Ind. Eng. Chem. Res. 2016, 55, 3442–3466. [Google Scholar] [CrossRef]
- Khor, C.S.; Foo, D.C.Y.; El-Halwagi, M.M.; Tan, R.R.; Shah, N. A Superstructure Optimization Approach for Membrane Separation-Based Water Regeneration Network Synthesis with Detailed Nonlinear Mechanistic Reverse Osmosis Model. Ind. Eng. Chem. Res. 2011, 50, 13444–13456. [Google Scholar] [CrossRef]
- El-Halwagi, M.M. Synthesis of Optimal Reverse-Osmosis Networks for Waste Reduction. AIChE J. 1992, 38, 1185–1198. [Google Scholar] [CrossRef]
- Al-Aboosi, F.Y.; El-Halwagi, M.M. An Integrated Approach to Water-Energy Nexus in Shale Gas Production. Processes 2018, 6, 52. [Google Scholar] [CrossRef]
- Bamufleh, H.; Abdelhady, F.; Baaqeel, H.M.; El-Halwagi, M.M. Optimization of Multi-Effect Distillation with Brine Treatment via Membrane Distillation and Process Heat Integration. Desalination 2017, 408, 110–118. [Google Scholar] [CrossRef]
- González-Bravo, R.; Ponce-Ortega, J.M.; El-Halwagi, M.M. Optimal Design of Water Desalination Systems Involving Waste Heat Recovery. Ind. Eng. Chem. Res. 2017, 56, 1834–1847. [Google Scholar] [CrossRef]
- Baaqeel, H.; El-Halwagi, M.M. Optimal Multi-Scale Capacity Planning in Seawater Desalination Systems. Processes 2018, 6, 68. [Google Scholar] [CrossRef]
- El-Halwagi, M.M. A Return on Investment Metric for Incorporating Sustainability in Process Integration and Improvement Projects. Clean Technol. Environ. Policy 2017, 19, 611–617. [Google Scholar] [CrossRef]
- BIPM; IFCC; IUPAC; ISO. Evaluation of Measurement Data Guide for the Expression of Uncertainty in Measurement; JCGM 100: Sèvres Cedex, France, 2008. [Google Scholar]


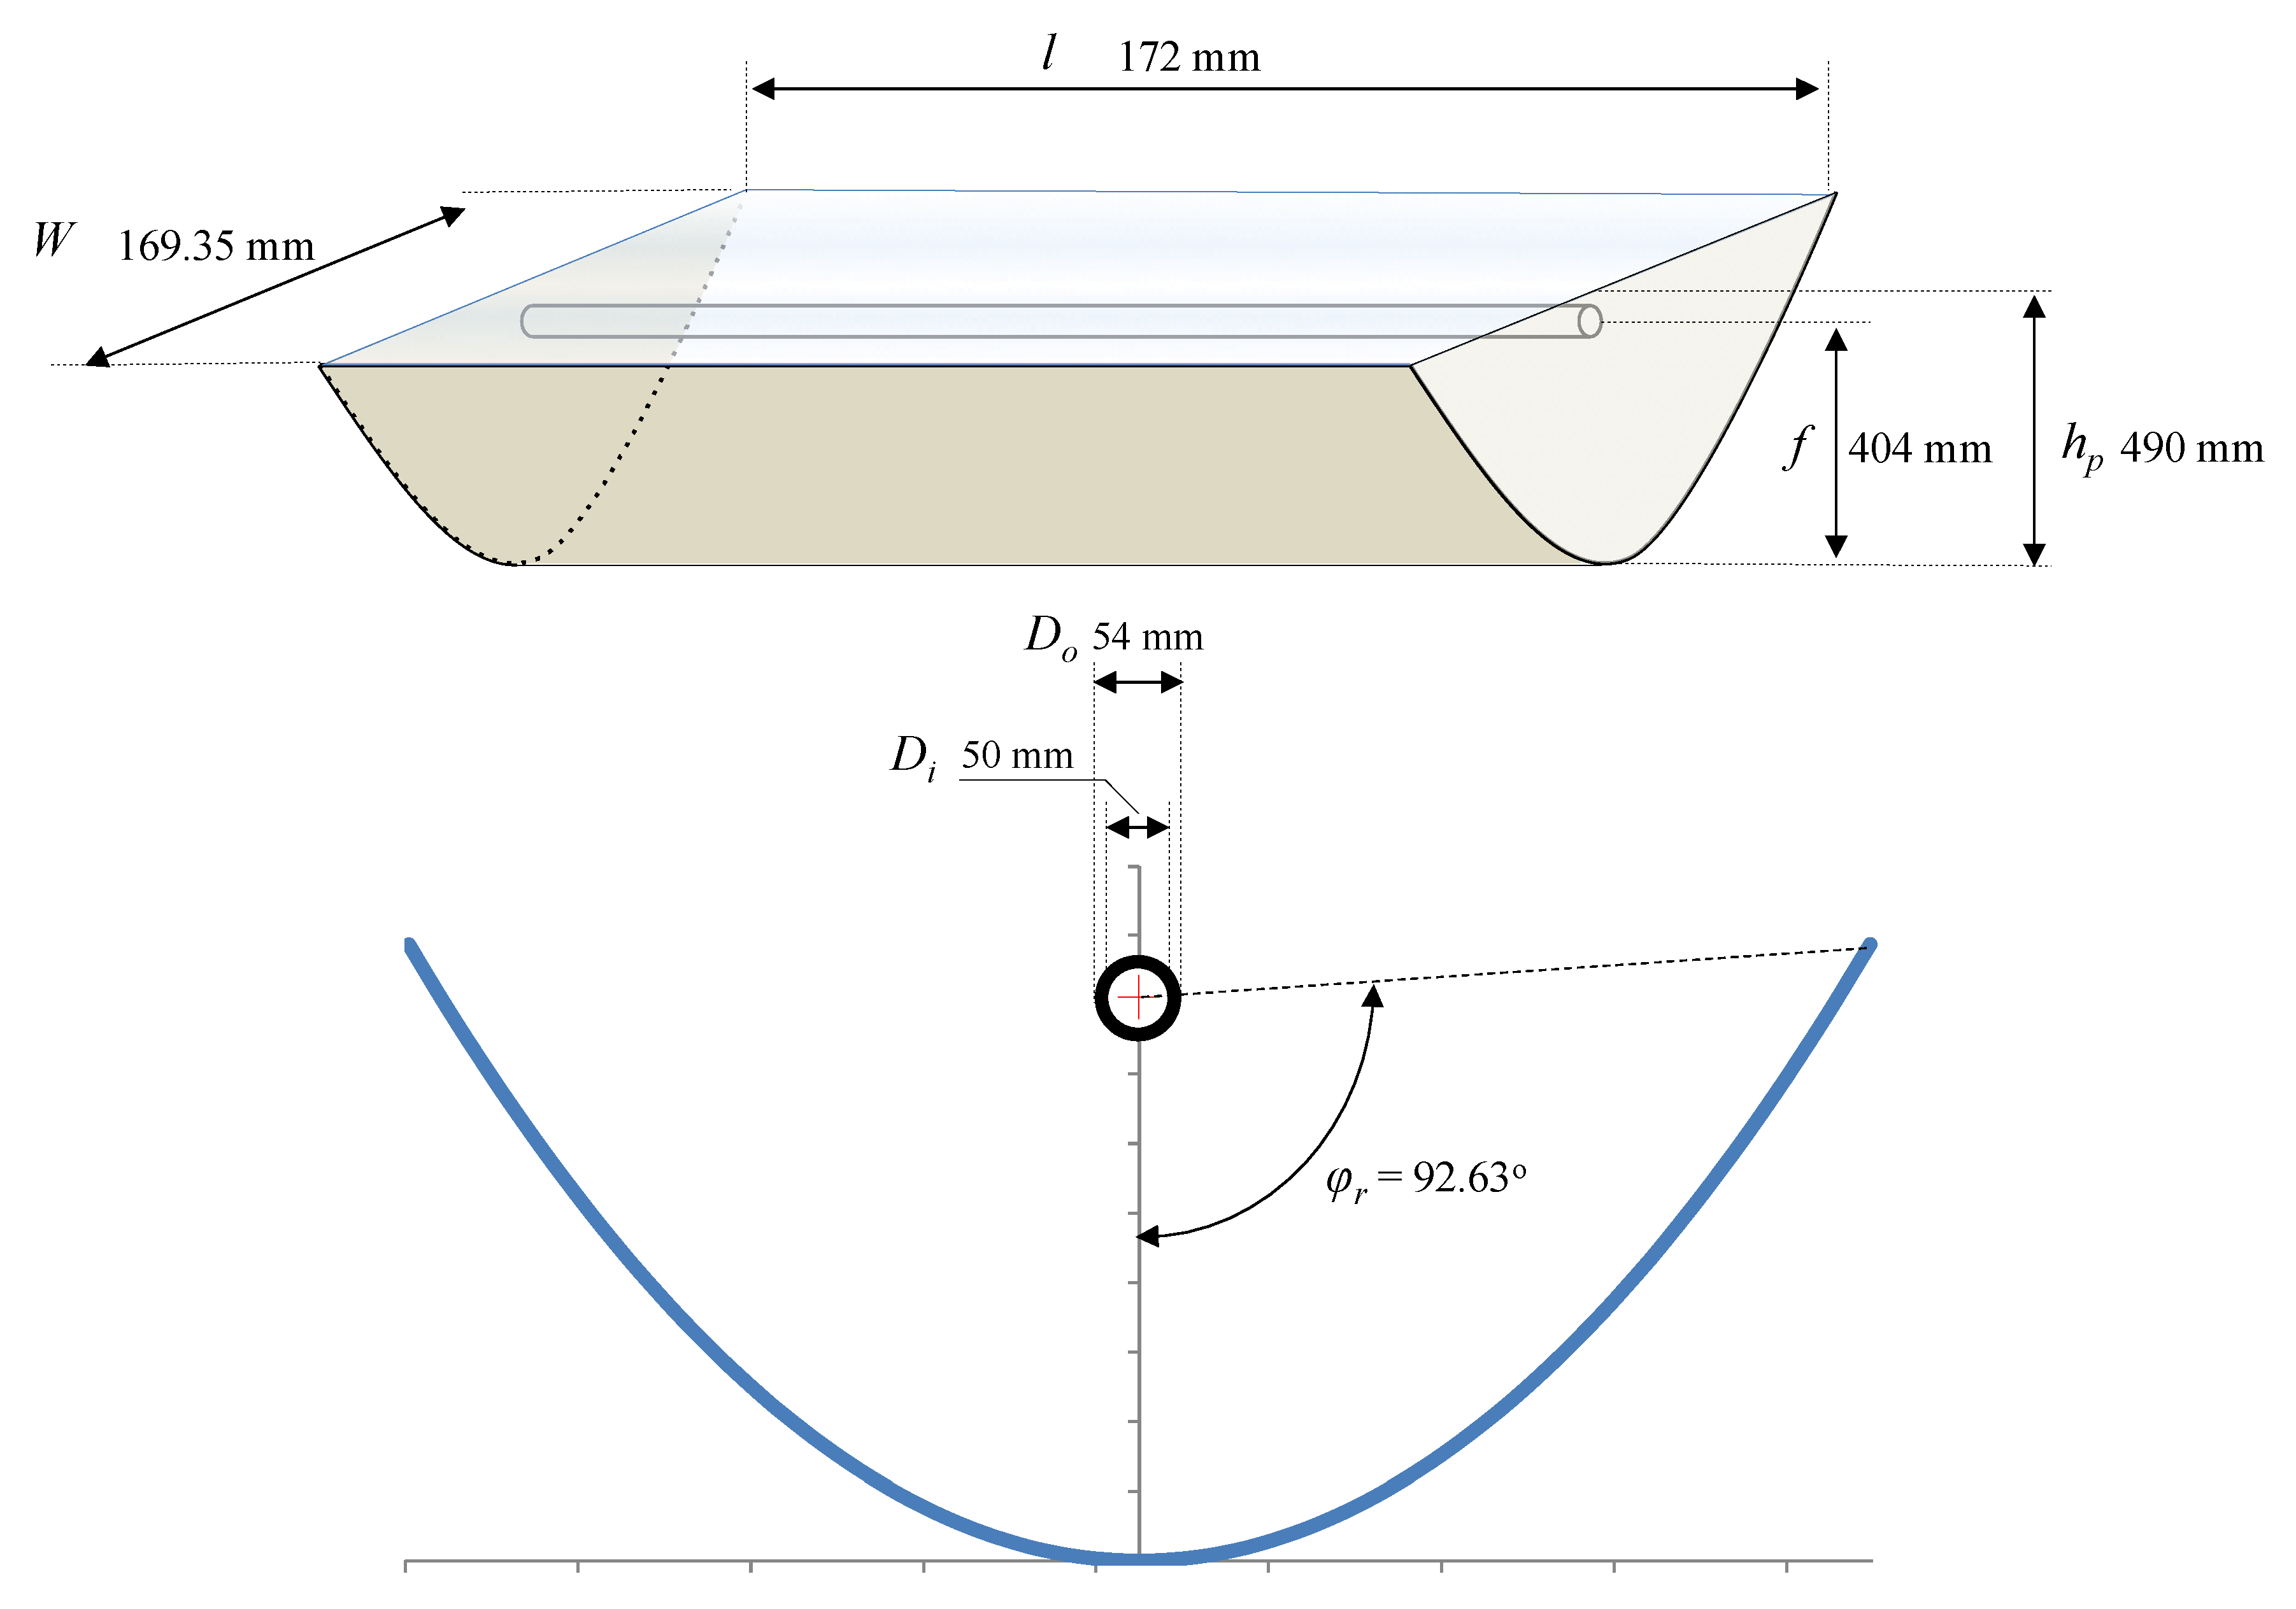
| rr | Rim radius, m | 0.848 |
| φr | Rim angle | 92.63° |
| f | Parabola focal distance, m | 0.404 |
| Do | Receiver outside diameter, m | 0.054 |
| Di | Receiver internal diameter, m | 0.05 |
| θm | Acceptance angle | 2.84° |
| Wa | The aperture width, m | 1.694 |
| hp | Height of the parabola, m | 0.49 |
| l | Trough length, m | 1.72 |
| C | Geometric concentration ratio | 9.89 |
| s | Curve length of the reflective surface, m | 1.966 |
| t | Glass thickness, m | 0.004 |
| J | Reflector thickness, m | 0.001 |
| ξ | Reflectance of the reflector | 0.95 |
| τ | Transmittance of the glass cover | 0.9 |
| ψ | Absorptance of the receiver. | 0.97 |
| γ | Intercept factor | 1.000 |
| T Temp. (K) | ρ Density (kg/m3) | cp Specific Heat (kJ/Kg-c) | μ Viscosity (N-s/m²) | ν Kinematic Viscosity (10−4 m2/s) | k Thermal Conductivity (W/m-K) |
|---|---|---|---|---|---|
| 260 | 908 | 1.76 | 12.23 | 135 | 0.149 |
| 280 | 896 | 1.83 | 2.17 | 24.2 | 0.146 |
| 300 | 884 | 1.91 | 0.486 | 5.50 | 0.144 |
| 320 | 872 | 1.99 | 0.141 | 1.62 | 0.141 |
| 340 | 860 | 2.08 | 0.053 | 0.62 | 0.139 |
| 360 | 848 | 2.16 | 0.025 | 0.30 | 0.137 |
| 380 | 836 | 2.25 | 0.014 | 0.17 | 0.136 |
| 400 | 824 | 2.34 | 0.009 | 0.11 | 0.134 |
| Description | Cost | |
|---|---|---|
| HDH desalination system | 2600 | US$ |
| Oil tank and circulation system | 350 | US$ |
| Control unit and sensors | 750 | US$ |
| Solar concentrator system | 5000 | US$ |
| HDH Capital cost (P) | 8700 | US$ |
| Reference | Description | Productivity, L/day | Cost, US$ |
|---|---|---|---|
| Sharshir et al. [46] | Hybrid solar HDH and solar stills with evacuated solar water heater. | 66.3 | 0.034 |
| Zhani et al. [47] | Flat plate air solar collector and flat-plate water solar collectors with HDH unit. | 20 | 0.093 |
| Hamed et al. [23] | Evacuated tube water solar collector with HDH unit. | 22 | 0.0578 |
| Deniz et al. [48] | Solar air heater and solar water heater with HDH unit. | 10.87 | 0.0981 |
| Zubair et al. [49] | Solar evacuated tubes with HDH unit. | 46.59 | 0.036 |
| Behnam et al. [50] | Solar desalination system equipped with an air bubble column humidifier, evacuated tube collectors and thermosyphon heat pipes. | 6.275 | 0.028 |
| Current work | Solar PTC with HDH unit. | 24.31 | 0.0125 |
© 2018 by the authors. Licensee MDPI, Basel, Switzerland. This article is an open access article distributed under the terms and conditions of the Creative Commons Attribution (CC BY) license (http://creativecommons.org/licenses/by/4.0/).
Share and Cite
Alghamdi, M.; Abdel-Hady, F.; Mazher, A.K.; Alzahrani, A. Integration of Process Modeling, Design, and Optimization with an Experimental Study of a Solar-Driven Humidification and Dehumidification Desalination System. Processes 2018, 6, 163. https://doi.org/10.3390/pr6090163
Alghamdi M, Abdel-Hady F, Mazher AK, Alzahrani A. Integration of Process Modeling, Design, and Optimization with an Experimental Study of a Solar-Driven Humidification and Dehumidification Desalination System. Processes. 2018; 6(9):163. https://doi.org/10.3390/pr6090163
Chicago/Turabian StyleAlghamdi, Mohammed, Faissal Abdel-Hady, A. K. Mazher, and Abdulrahim Alzahrani. 2018. "Integration of Process Modeling, Design, and Optimization with an Experimental Study of a Solar-Driven Humidification and Dehumidification Desalination System" Processes 6, no. 9: 163. https://doi.org/10.3390/pr6090163