1. Introduction
Column chromatography is widely used for both analytical and preparative purification of biopharmaceuticals [
1,
2,
3,
4]. Analytical columns, which have very large bed-height to diameter ratios, and are packed with fine chromatography media (in the 3–10 micron range) give excellent resolution in multi-protein separation [
3,
5]. On the other hand, preparative columns, especially those used for large-scale bioseparation (which have small bed-height to diameter ratios) and are packed with larger resin particles (>30 microns) do not [
3,
6]. While these columns can be loaded with large volumes of feed material, their separation efficiencies are drastically lower than analytical columns.
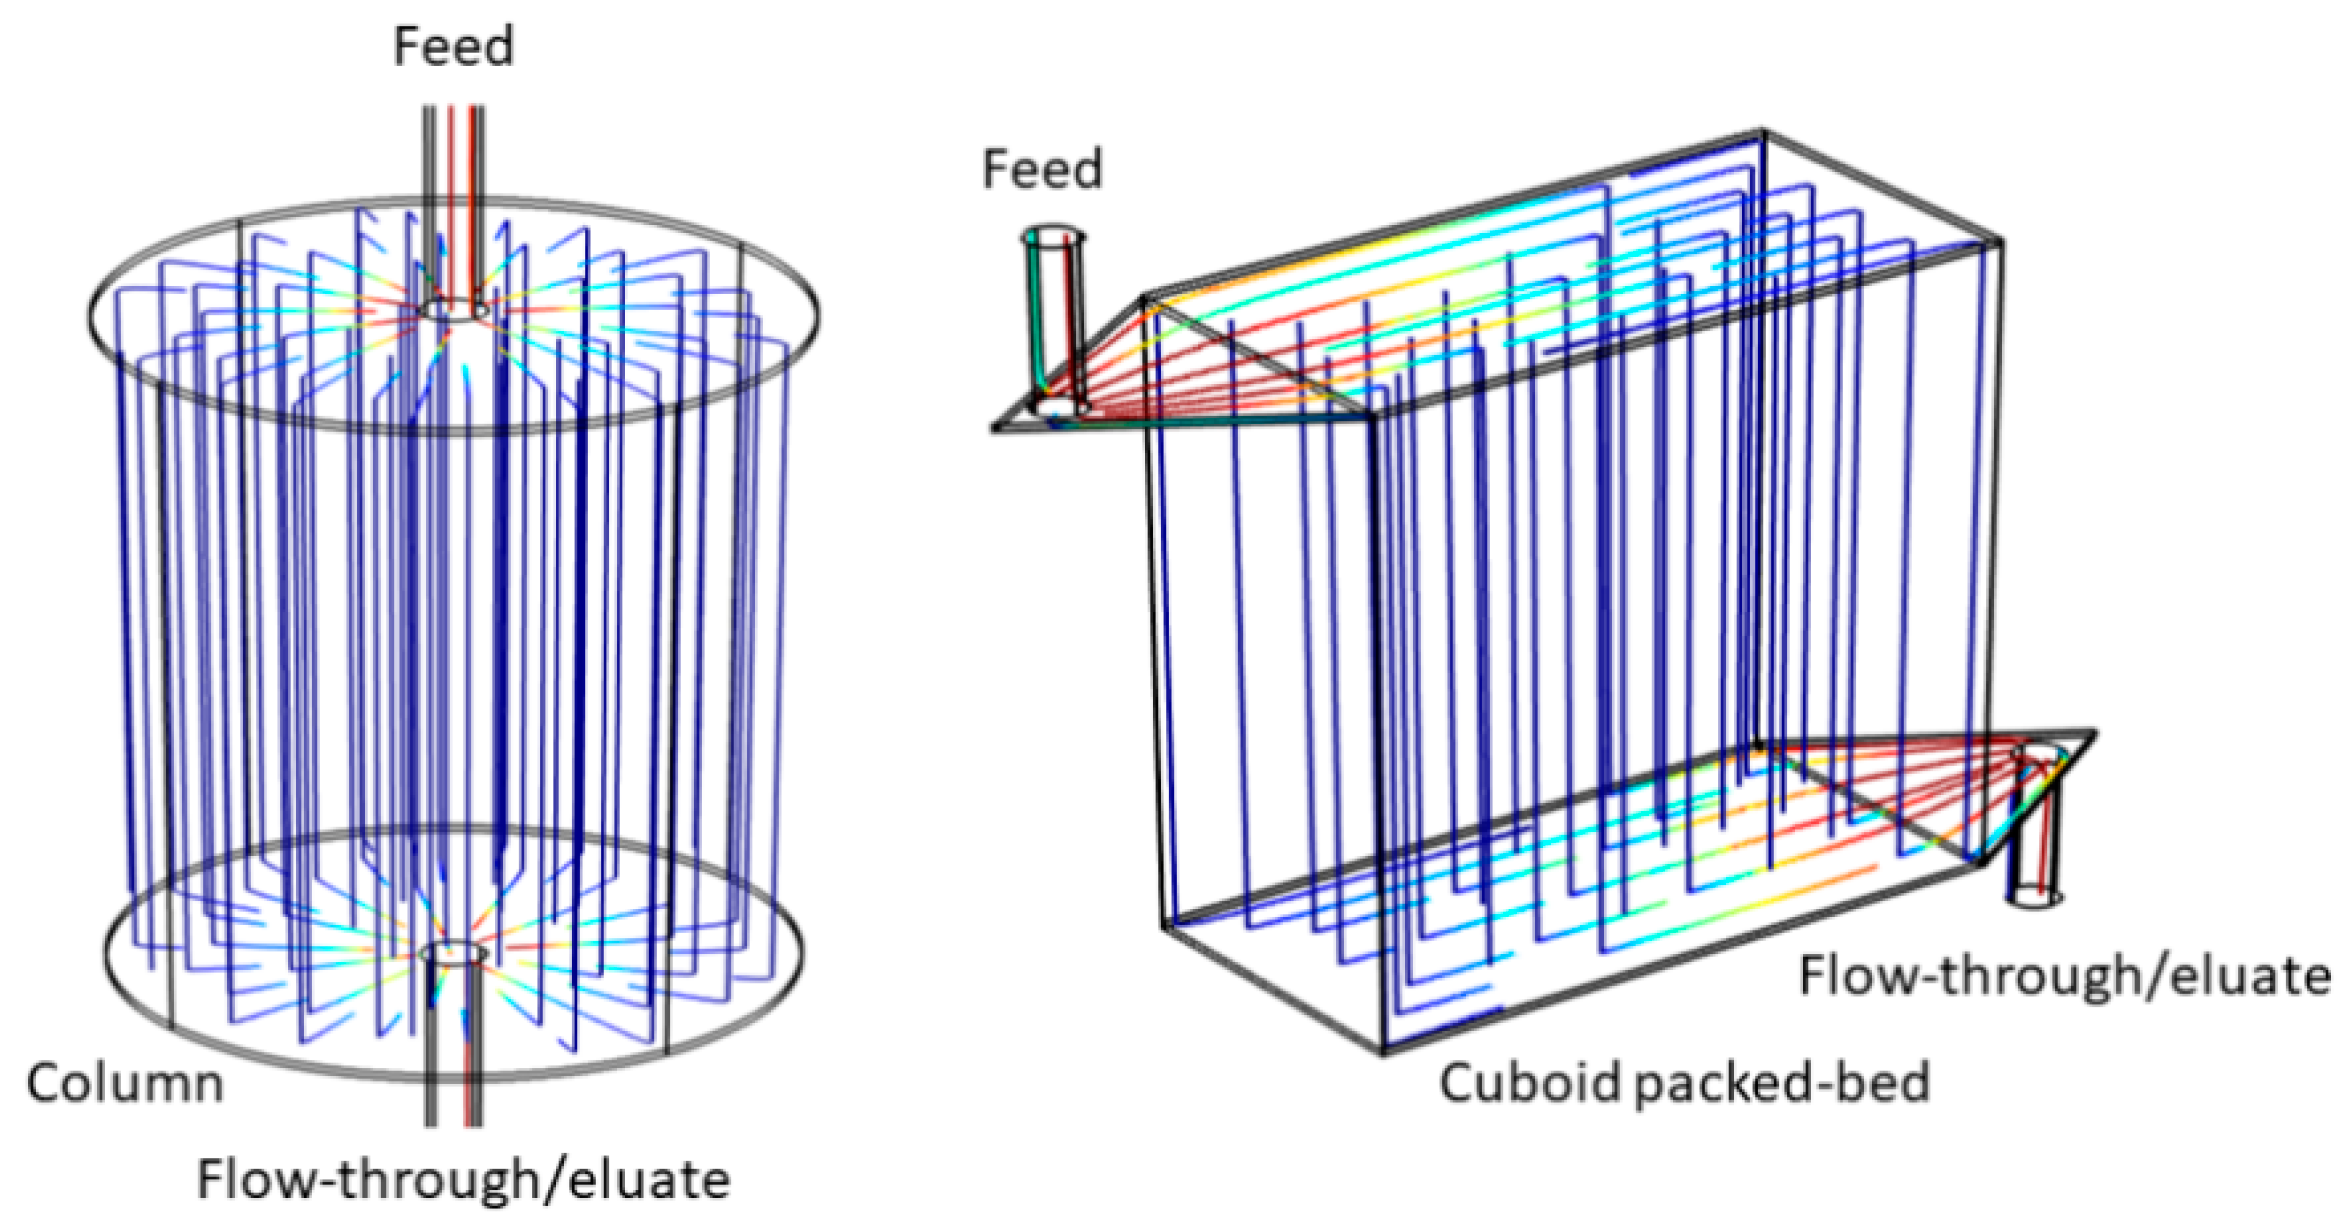
In an analytical column, flow distribution in the radial direction is relatively insignificant compared to that in the axial direction. Also, the volume of sample injected in an analytical column is very small, and therefore solutes move through the column in a “plug-like” manner. When liquid flows into a preparative column, it is distributed in radial and axial directions as shown in
Figure 1 (on the left). In large-scale preparative columns, the diameter is frequently comparable, or even larger than the bed height. For example, in the 20,000 L scale purification process for monoclonal antibodies, the typical column diameter is 100 cm and the typical bed height is 20 cm [
7]. Therefore, efficient radial flow distribution in the column headers is critically important. Column flow maldistribution and consequent poor separation efficiency has been investigated by many researchers [
8,
9,
10,
11,
12,
13]. Poor separation has been mainly attributed to dispersion in peripherals, non-uniform packing and maldistribution in headers [
8,
9]. In addition, radial temperature gradients in the large-diameter columns could affect local superficial velocity and thereby retention parameters [
14]. Non-uniformity of flow within preparative columns results in peak broadening and poor resolution, which decrease recovery, increase operating time and buffer usage, and necessitate subsequent concentration steps [
8,
9,
10,
11,
12,
13,
14].
Researchers have tried to address the problem of column flow maldistribution primarily by modifying and improving the headers [
15,
16,
17,
18,
19,
20,
21,
22,
23]. This includes the use of ribbed, hyperbolic- and parabolic-shaped headers, the use of collimators and manifolds, the use of bifurcating, radially interconnecting and fractal flow distributors, and the use of frits with appropriate porosity. Other approaches include control of column packing [
24,
25,
26], adjustment of the column inlet temperature [
27], and the use of parallel flow [
28], curtain flow [
29], and radial flow [
30] columns.
In recent papers, we have proposed a radically different approach i.e., the use of box-shaped or cuboid packed-bed devices for reducing flow maldistribution [
31,
32]. The design of the cuboid packed bed is inspired by that of lateral-fed membrane chromatography (LFMC) devices [
33,
34,
35,
36,
37,
38]. The cuboid packed-bed device (see
Figure 1, on the right) consists of a box-shaped resin-bed into which liquid is distributed using an upper lateral channel, and from which liquid is collected using a lower lateral channel [
31,
32]. This flow arrangement makes the flow path lengths within the packed bed uniform and narrows down the solute residence time distribution (RTD). Using cuboid packed-bed devices containing different types of ion-exchange media, we were able to demonstrate their superior separation performances relative to their equivalent columns (i.e., containing the same media and having the same bed-height and bed-volume) [
31,
32]. The cuboid packed-bed devices consistently gave sharper and more symmetrical flow-through and eluted peaks, and higher resolution in multi-protein separations. The length-to-width aspect ratios of a cuboid packed-bed device of a given bed height and bed volume could be adjusted in a flexible manner. That brought us to a pertinent question, i.e., was this ratio important? Within a longer device, the velocity gradient in the lateral channels could be expected to be greater. In our earlier study [
32], we hypothesized that the greater the velocity gradient, the poorer the separation. On the other hand, increasing the width of the device and thereby the width of the lateral channels could potentially introduce some non-uniformity of flow along the channel width and thereby affect separation efficiency [
32].
In this paper, we have attempted to optimize the performance of a 5 mL cuboid packed-bed device by systematically examining 6 different cuboid devices having identical bed height and bed volume, but different length-to-width ratios. The performance of these devices was compared based on the number of theoretical plates per meter bed height. A head-to-head comparison of the best-performing cuboid packed-bed device and its equivalent column was also carried out. Performance metrics such as the widths, and dispersion indices of flow-through and eluted protein peaks were compared.
2. Materials and Methods
Trizma base (T1503), trizma hydrochloride (T3253), sodium hydroxide (795429), hydrochloric acid (258148), bovine serum albumin (BSA, isoelectric point 4.8, A7906), lysozyme (isoelectric point 11, L6876) were purchased from Sigma-Aldrich (St. Louis, MO, USA). Sodium chloride (SOD002.205) was purchased from Bioshop (Burlington, ON, Canada). Strong anion exchange Capto Q medium (17-5316-03) and HiTrap Capto Q column (5 mL bed volume, 16 mm diameter, 25 mm bed height, 11-0013-03) were purchased from GE Healthcare Biosciences, QC, Canada. All the buffers and the solutions were prepared using water obtained from a SIMPLICITY 185 water purification unit Millipore (Molsheim, France). Prior to use, buffers and solutions were filtered through a 0.1 μm VVLP membrane (Millipore, MA, USA) and degassed.
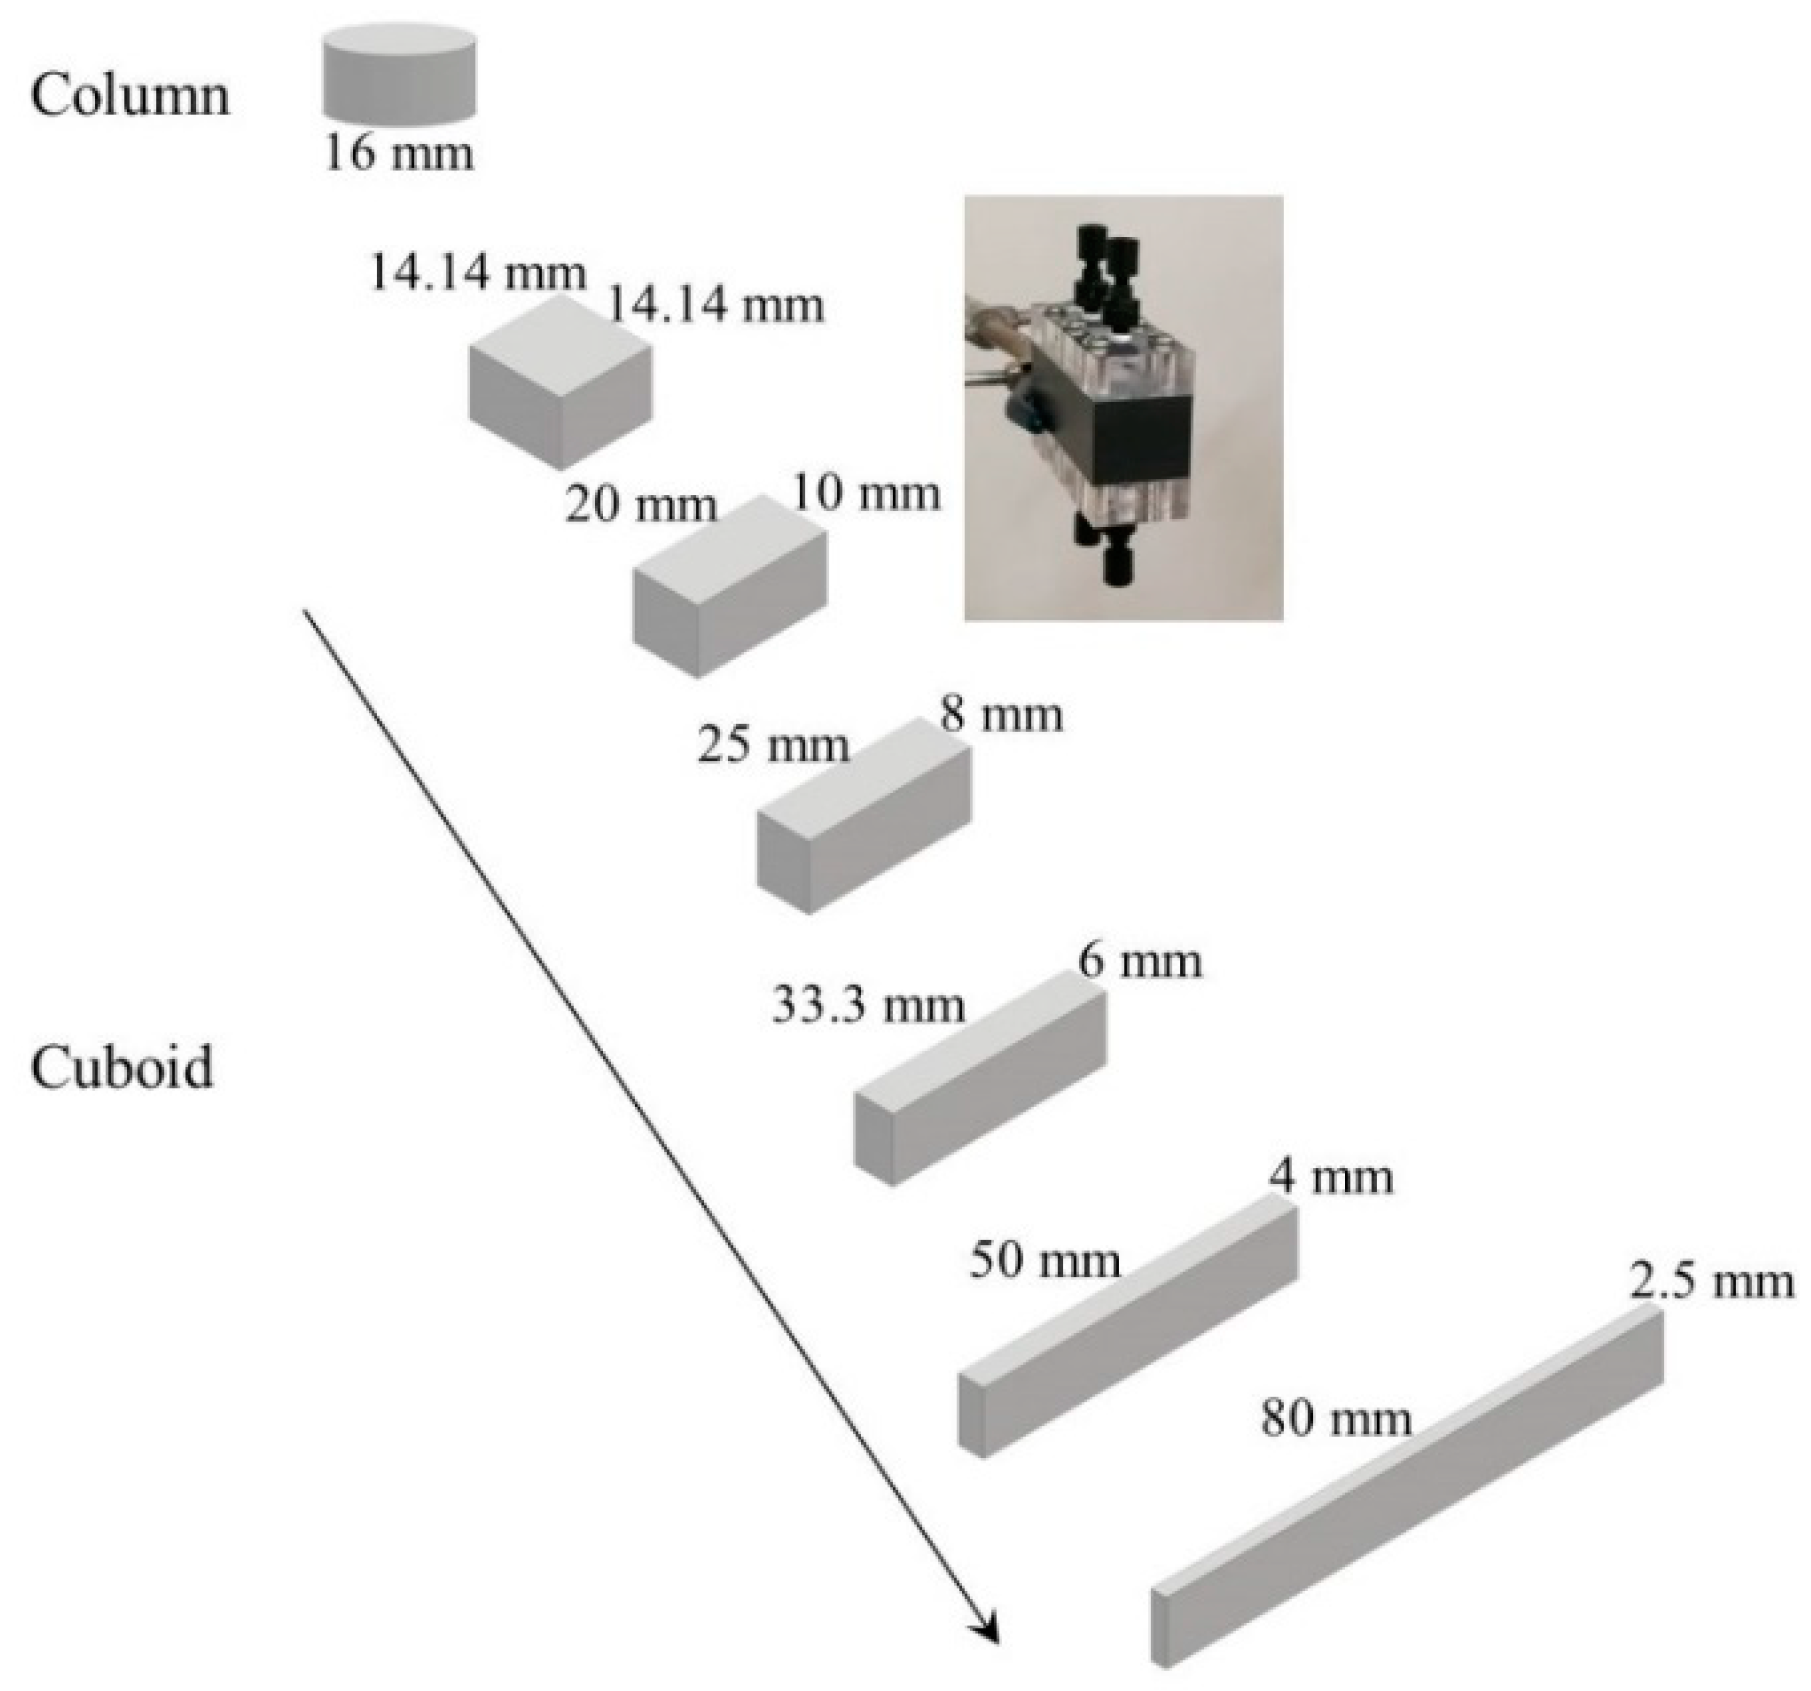
The different 5 mL cuboid packed-bed devices (see
Figure 2), which had the same bed height and cross-sectional area were fabricated in-house (material: acrylic for the transparent top and bottom plates, polyvinyl chloride for the central frame). The dimensions were as follows: 14.14 mm (length) × 14.14 mm (width) × 25 mm (height), 20 mm × 10 mm × 25 mm, 25 mm × 8 mm × 25 mm, 33.3 mm × 6 mm × 25 mm, 50 mm × 4 mm × 25 mm, and 80 mm × 2.5 mm × 25 mm. The basic design of a 5 mL cuboid packed-bed device has been described in detail in our previous paper [
32]. Briefly, it consists of 3 parts: an upper and a lower plate with engraved lateral channel for flow distribution/collection, and a central frame with a rectangular slot for housing the cuboid packed bed. A photograph of the assembled 20 mm × 10 mm × 25 mm device is also shown in
Figure 2 (inset).
Figure 2 also shows the bed dimensions of the equivalent 5 mL HiTrap column (material: polypropylene).
The cuboid packed-bed devices were packed with the Capto Q media using the protocol described in our previous paper [
32]. The chromatography experiments were carried out using an AKTA prime system (GE Healthcare Biosciences, Baie d’Urfe, QC, Canada). The number of theoretical plates in the cuboid packed-bed devices and the column was determined at different flow rates by injecting 100 μL 0.8 M NaCl solution as tracer (2% of the bed volume), using 0.4 M NaCl solution as the mobile phase. The best performing cuboid packed-bed device was selected based on the number of theoretical plates. This device was then compared head-to-head with the equivalent commercial column in terms of widths, asymmetry and tailing factors, and dispersion indices of flow through and eluted protein peaks obtained at different flow rates, using different sample injection loops. In these experiments 50 mM Tris-HCl buffer, pH 8 was used as the binding buffer and 50 mM Tris-HCl buffer + 1 M NaCl, pH 8 was used as the eluting buffer. Flow-through peaks were obtained by injecting different volumes of 1 mg/mL lysozyme solution, while eluted peaks were obtained using 2 mg/mL BSA solution. All experiments with the cuboid devices and their equivalent column were run in duplicate and average values are reported.
3. Results and Discussion
The data for the number of theoretical plates (
N), tailing factor (
TF) and asymmetry factor (
AF) obtained with the six cuboid packed-bed devices and their equivalent column are summarized in
Table 1.
N was calculated as follows [
39]:
where
VR is the residence volume, and
w0.5 is the peak width at half height.
TF was calculated as follows [
39]:
where
is the front peak width at 5% height,
is the rear peak width, also at 5% height.
AF was calculated as follows [
39]:
where
is the front peak width at 10% height, while
is the rear peak width at 10% height.
Five out of the six cuboid packed-bed devices out-performed the column in terms of the number of theoretical plates and other peak attributes. Only the performance of the 80 mm × 2.5 mm cuboid packed-bed device was worse than that of the column. With all the chromatography devices examined, i.e., the column and the six cuboid packed beds, the number of theoretical plates per meter (
) decreased when the flow rate was increased above the optimum flow rate, as expected based on the van Deemter equation. With the column, the number of theoretical plates increased slightly from 1781/m (at 10 mL/min,
vS = 300 cm/h) to 2296/m (at 0.5 mL/min,
vS = 15 cm/h). With the best performing cuboid packed-bed device (i.e., 20 mm × 10 mm × 25 mm) the number increased very significantly from 3000/m at a flow rate of 10 mL/min (
vS = 300 cm/h) to 10327/m at a flow rate of 0.5 mL/min (
vS = 15 cm/h). However, the number of plates did not increase further when the flow rate was decreased below 0.5 mL/min. For instance, the value was 10,207/m at 0.4 mL/min (
vS = 12 cm/h) and 8165/m at 0.2 mL/min (
vS = 6 cm/h) (data not shown in
Table 1), indicating that 0.5 mL/min was the optimal flow rate for the best-performing cuboid packed-bed device. The tailing and asymmetry factor of the salt peaks obtained with the column increased with decrease in flow rate. However, the corresponding values for the cuboid packed-bed device remained consistently close to 1 at all the flow rates examined due to consistently uniform flow distribution.
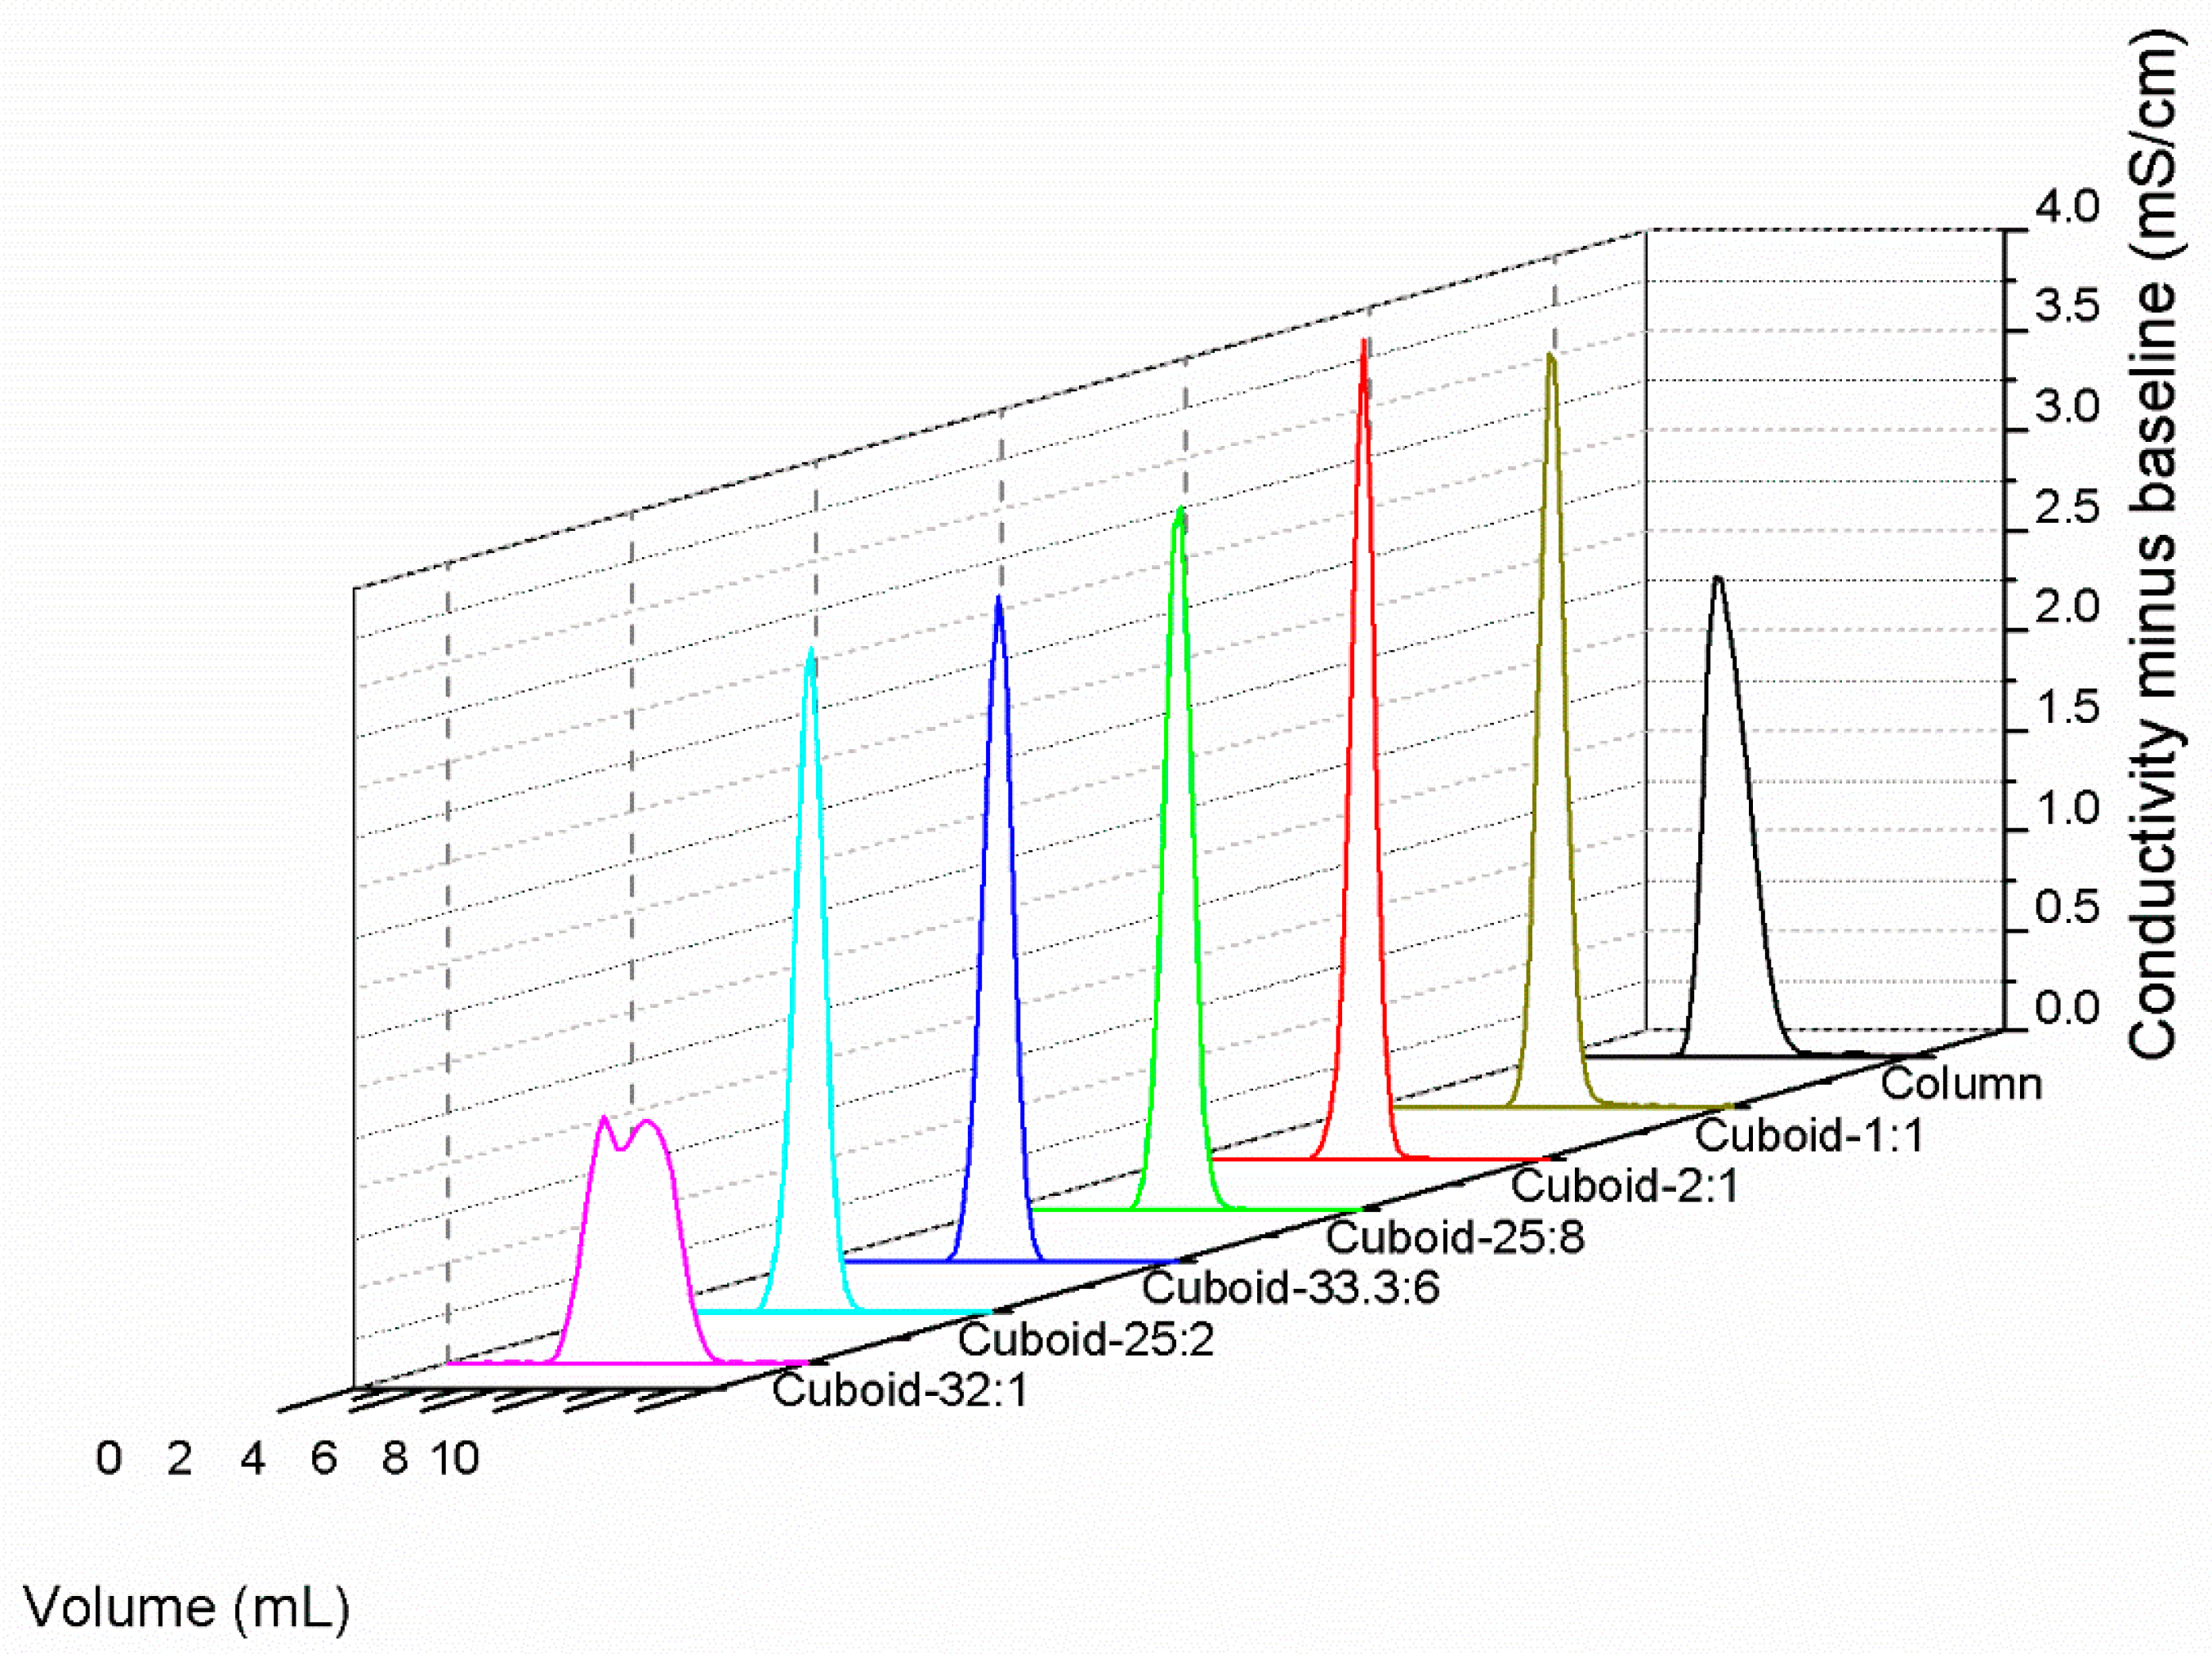
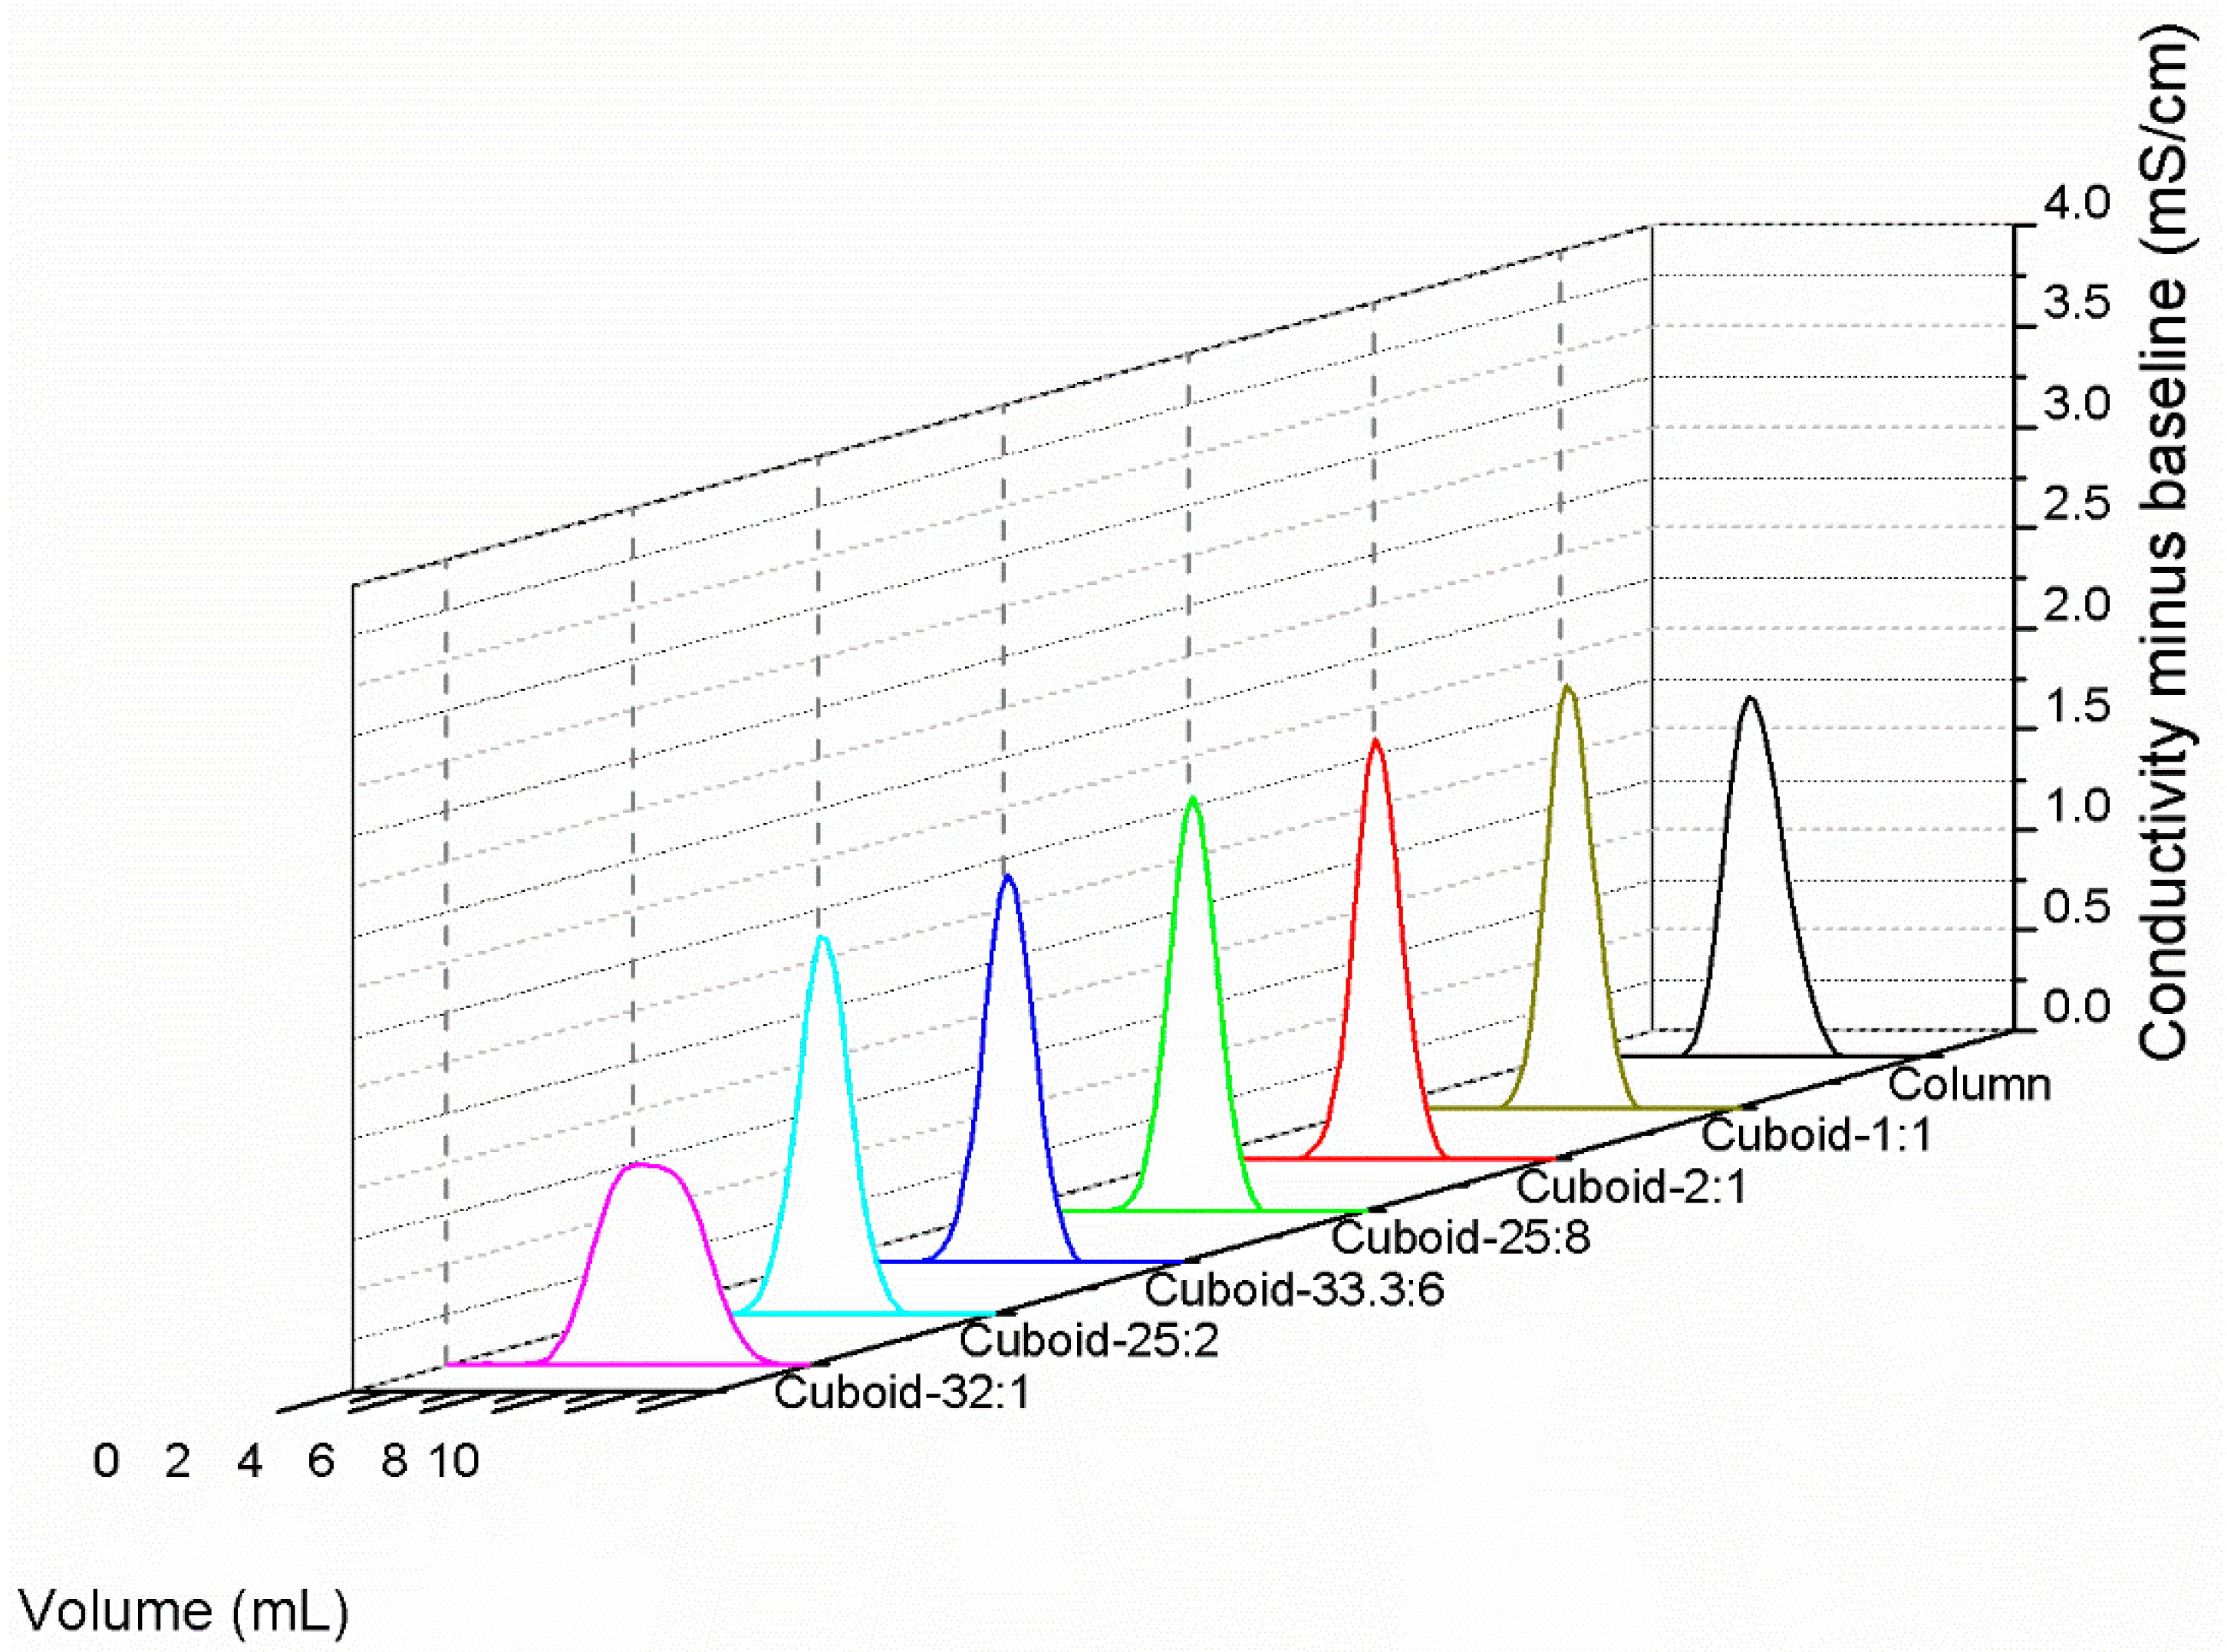
Figure 3 and
Figure 4 show salt peaks obtained with the six cuboid packed-bed devices and the column during the theoretical plate measurement experiments at the flow rates of 0.5 and 10 mL/min respectively. In these experiments, 0.4 M NaCl solution was used as the running buffer while 0.8 M NaCl solution was used as tracer. The volume of tracer injected was 100 μL (i.e., 2% of the bed volume).
In the chromatograms shown in the figure, the conductivity baseline was normalized for ease of comparison by deduction of the conductivity corresponding to 0.4 M NaCl. Consistent with the numerical results summarized in
Table 1, the peaks obtained with the best cuboid packed-bed device (dimension: 20 mm × 10 mm × 25 mm) were sharper than those obtained with the other cuboid packed-bed devices and the column, especially at the lower flow rate i.e., 0.5 mL/min.
The difference between the maximum and minimum residence time within a cuboid packed-bed device would depend primarily on the magnitude of the channel velocity gradient [
32]:
where
τmax is the maximum residence time,
τmin is the minimum residence time,
l is the length of the cuboid packed-bed device,
v0 is the channel inlet velocity, and
vU is the liquid velocity in the upper channel at location
z.
v0 could be obtained by:
where
V is the volumetric flow rate,
h is the channel height, and
w is the width of the channel (and therefore the width of the cuboid packed-bed device).
In an earlier paper it has been shown that [
31]:
where
vS is the superficial velocity which could be obtained by:
Therefore, the difference between the maximum and the minimum residence time within a cuboid packed-bed device would depend on the volumetric flow rate, the channel height, and the area of cross-section of the cuboid packed-bed device. For the six cuboid packed-bed devices studied, the channel height and area of cross-section were maintained the same. Therefore, based on Equation (8), the difference between the maximum and the minimum residence time within a cuboid packed-bed device could be expected to be the same, i.e., they would have the same efficiency. However,
Table 1 shows that this was clearly not the case, i.e., the efficiency depended on the aspect ratio, with the best performance being observed with the device having 2:1 aspect ratio. The efficiency decreased with an increase in this ratio, particularly severely when the ratio was 32:1. This discrepancy with the expectations based on Equation (8) was probably due to the effect of aspect ratio on the pressure drop within the channel. One of the design criteria for obtaining high efficiency in separation with a cuboid packed-bed device is that the channel pressure drop should be significantly lower than the pressure drop across the packed bed [
31,
32]. An equation based on the resistance model used in membrane process [
34] could be used to estimate the pressure drop in the packed bed (Δ
Pv):
where
Rv is the hydraulic resistance offered by the packed bed which would depend on the property of the packed bed and on the flow rate but would be independent of the channel aspect ratio.
In a similar way, the pressure drop in the lateral channel (Δ
Pl) could be estimated as follows:
where
is the average velocity in the upper channel,
Rl is the lateral resistance in the channel.
From Equations (5)–(7) and (11):
The magnitude of both
v0 and
Rl would increase with aspect ratio.
v0 would increase due to a decrease in the area of cross-section of the channel while
Rl would increase due to an increase in channel length. Therefore, the greater the aspect ratio, the greater would be the net pressure differential between the channel extremities. When the channel is long and narrow (i.e., when the aspect ratio is very high), Δ
Pl might become comparable in magnitude to Δ
Pv and thereby the basic design criteria for cuboid packed beds, i.e., the channel pressure drop should be significantly lower than the pressure drop across the packed bed, would not hold good any more. Under such conditions, the higher channel pressure closer to the entrance of a narrow channel would result in more liquid going through the regions of the packed bed closer to the inlet than through the regions of the packed bed further down, i.e.,
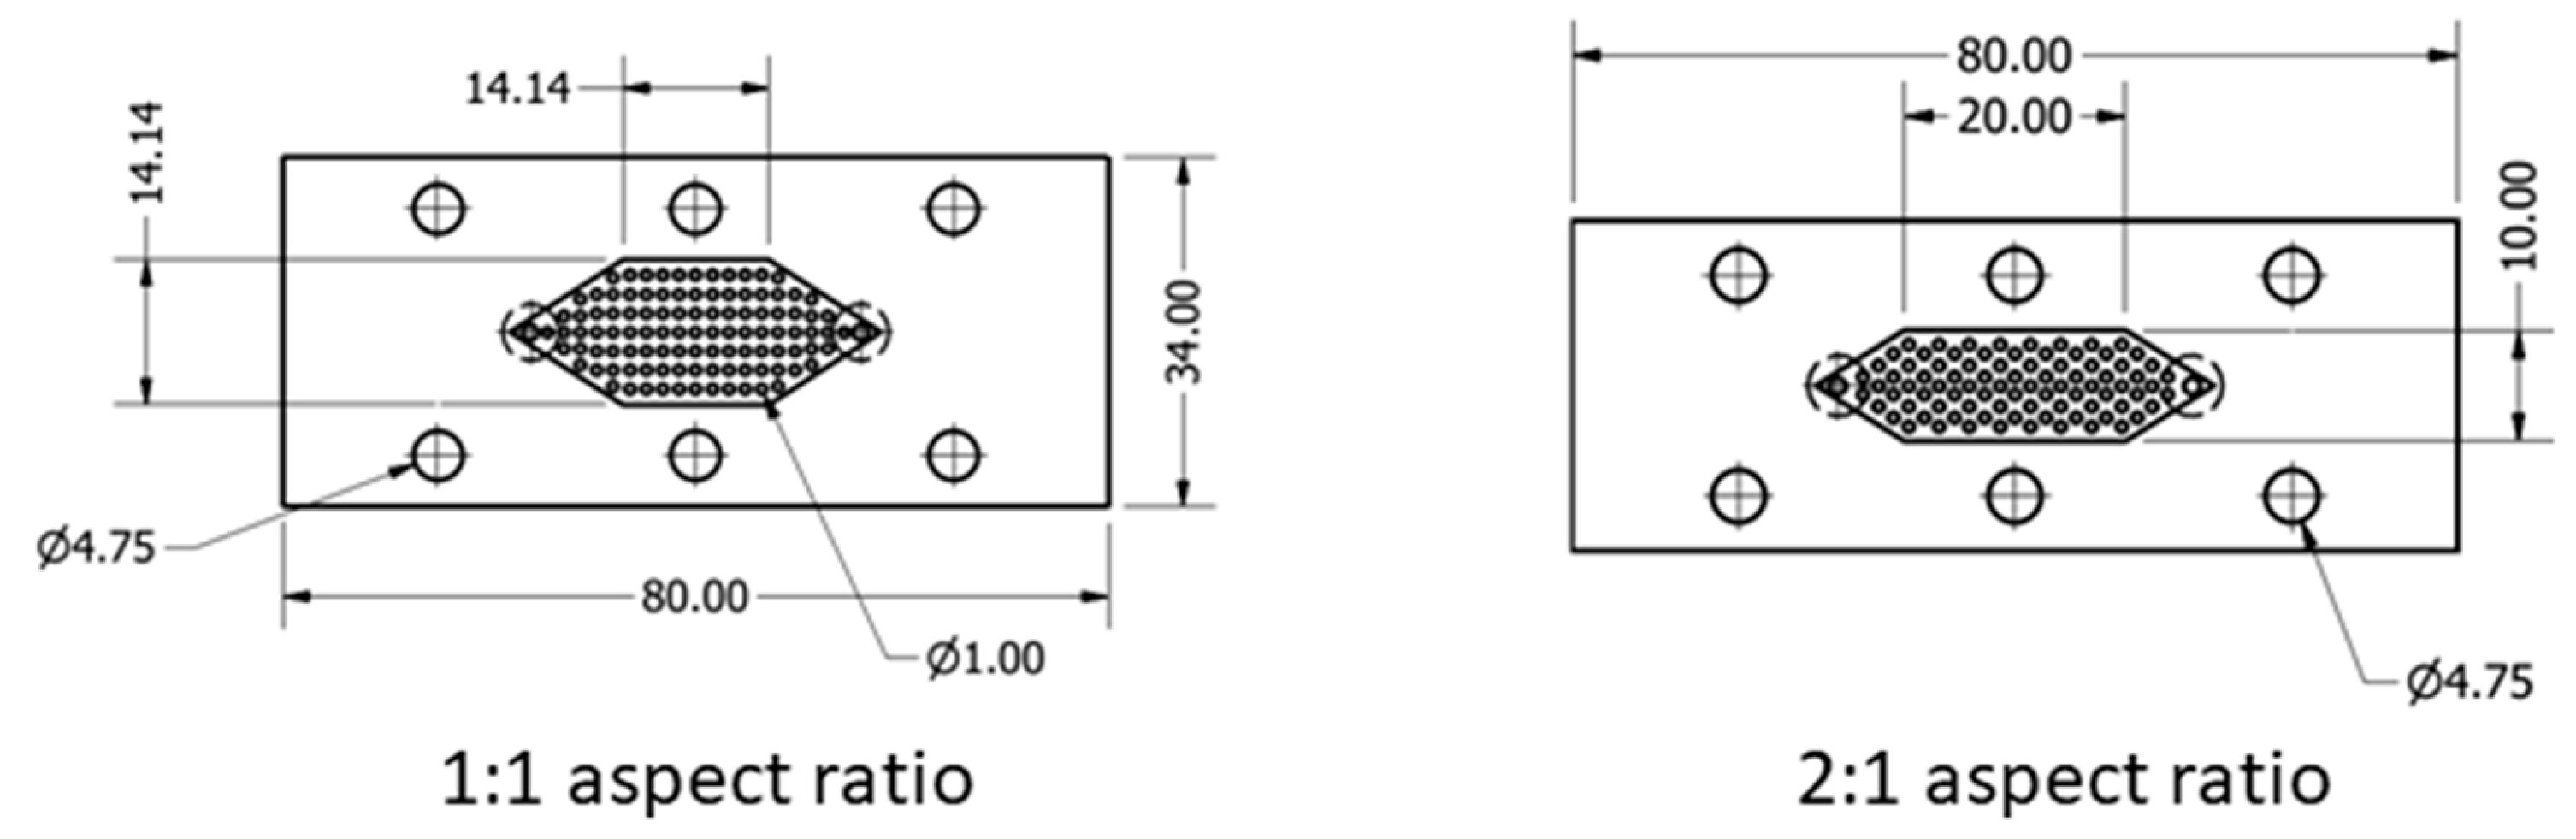
vS would no longer be constant. This would also result in a non-linear channel velocity gradient, making Equation (8) invalid for such a situation. Interestingly, the cuboid packed-bed device with an aspect ratio of 1:1 performed marginally poorer than the one with 2:1 ratio. A lower aspect ratio implies a wider channel. The channels in each of the cuboid packed-bed devices were fed from a narrow inlet and drained through a narrow outlet using a tapered distributor.
Figure 5 shows the diagrams for the tapered distributors corresponding to the 1:1 and 2:1 aspect ratio cuboid packed-bed devices. While such tapered flow distributors worked well at the scale examined in this paper, i.e., 5 mL, they are likely to be less effective with larger devices with wider channels. For such larger devices, a better flow distributor could potentially be required.
The above discussion highlights an efficiency trade-off between the length and the width of a cuboid packed-bed device. Increasing the length would increase the pressure in the channel which could decrease the efficiency of the device. On the other hand, increasing the width of the device could result in flow non-uniformity along the width of the channel which in turn could reduce the efficiency. In this study, the 2:1 aspect ratio cuboid packed-bed device represents the efficiency “sweet spot” for the 5 mL cuboid packed-bed devices examined. However, it should be noted that the difference in efficiency between the 2:1 and 1:1 aspect ratio devices was not very big, particularly at the higher flow rates. For larger devices, non-uniformity along the width of the channel could potentially become a significant factor and advanced flow distribution features to reduce such variability would need to be incorporated.
The 20 mm × 10 mm × 25 mm cuboid packed-bed device which had approximately 4.5 times as many theoretical plates as the column was used in all subsequent head-to-head comparisons with the column. This cuboid packed-bed device is henceforth referred to as the best cuboid packed-bed device to avoid any confusion.
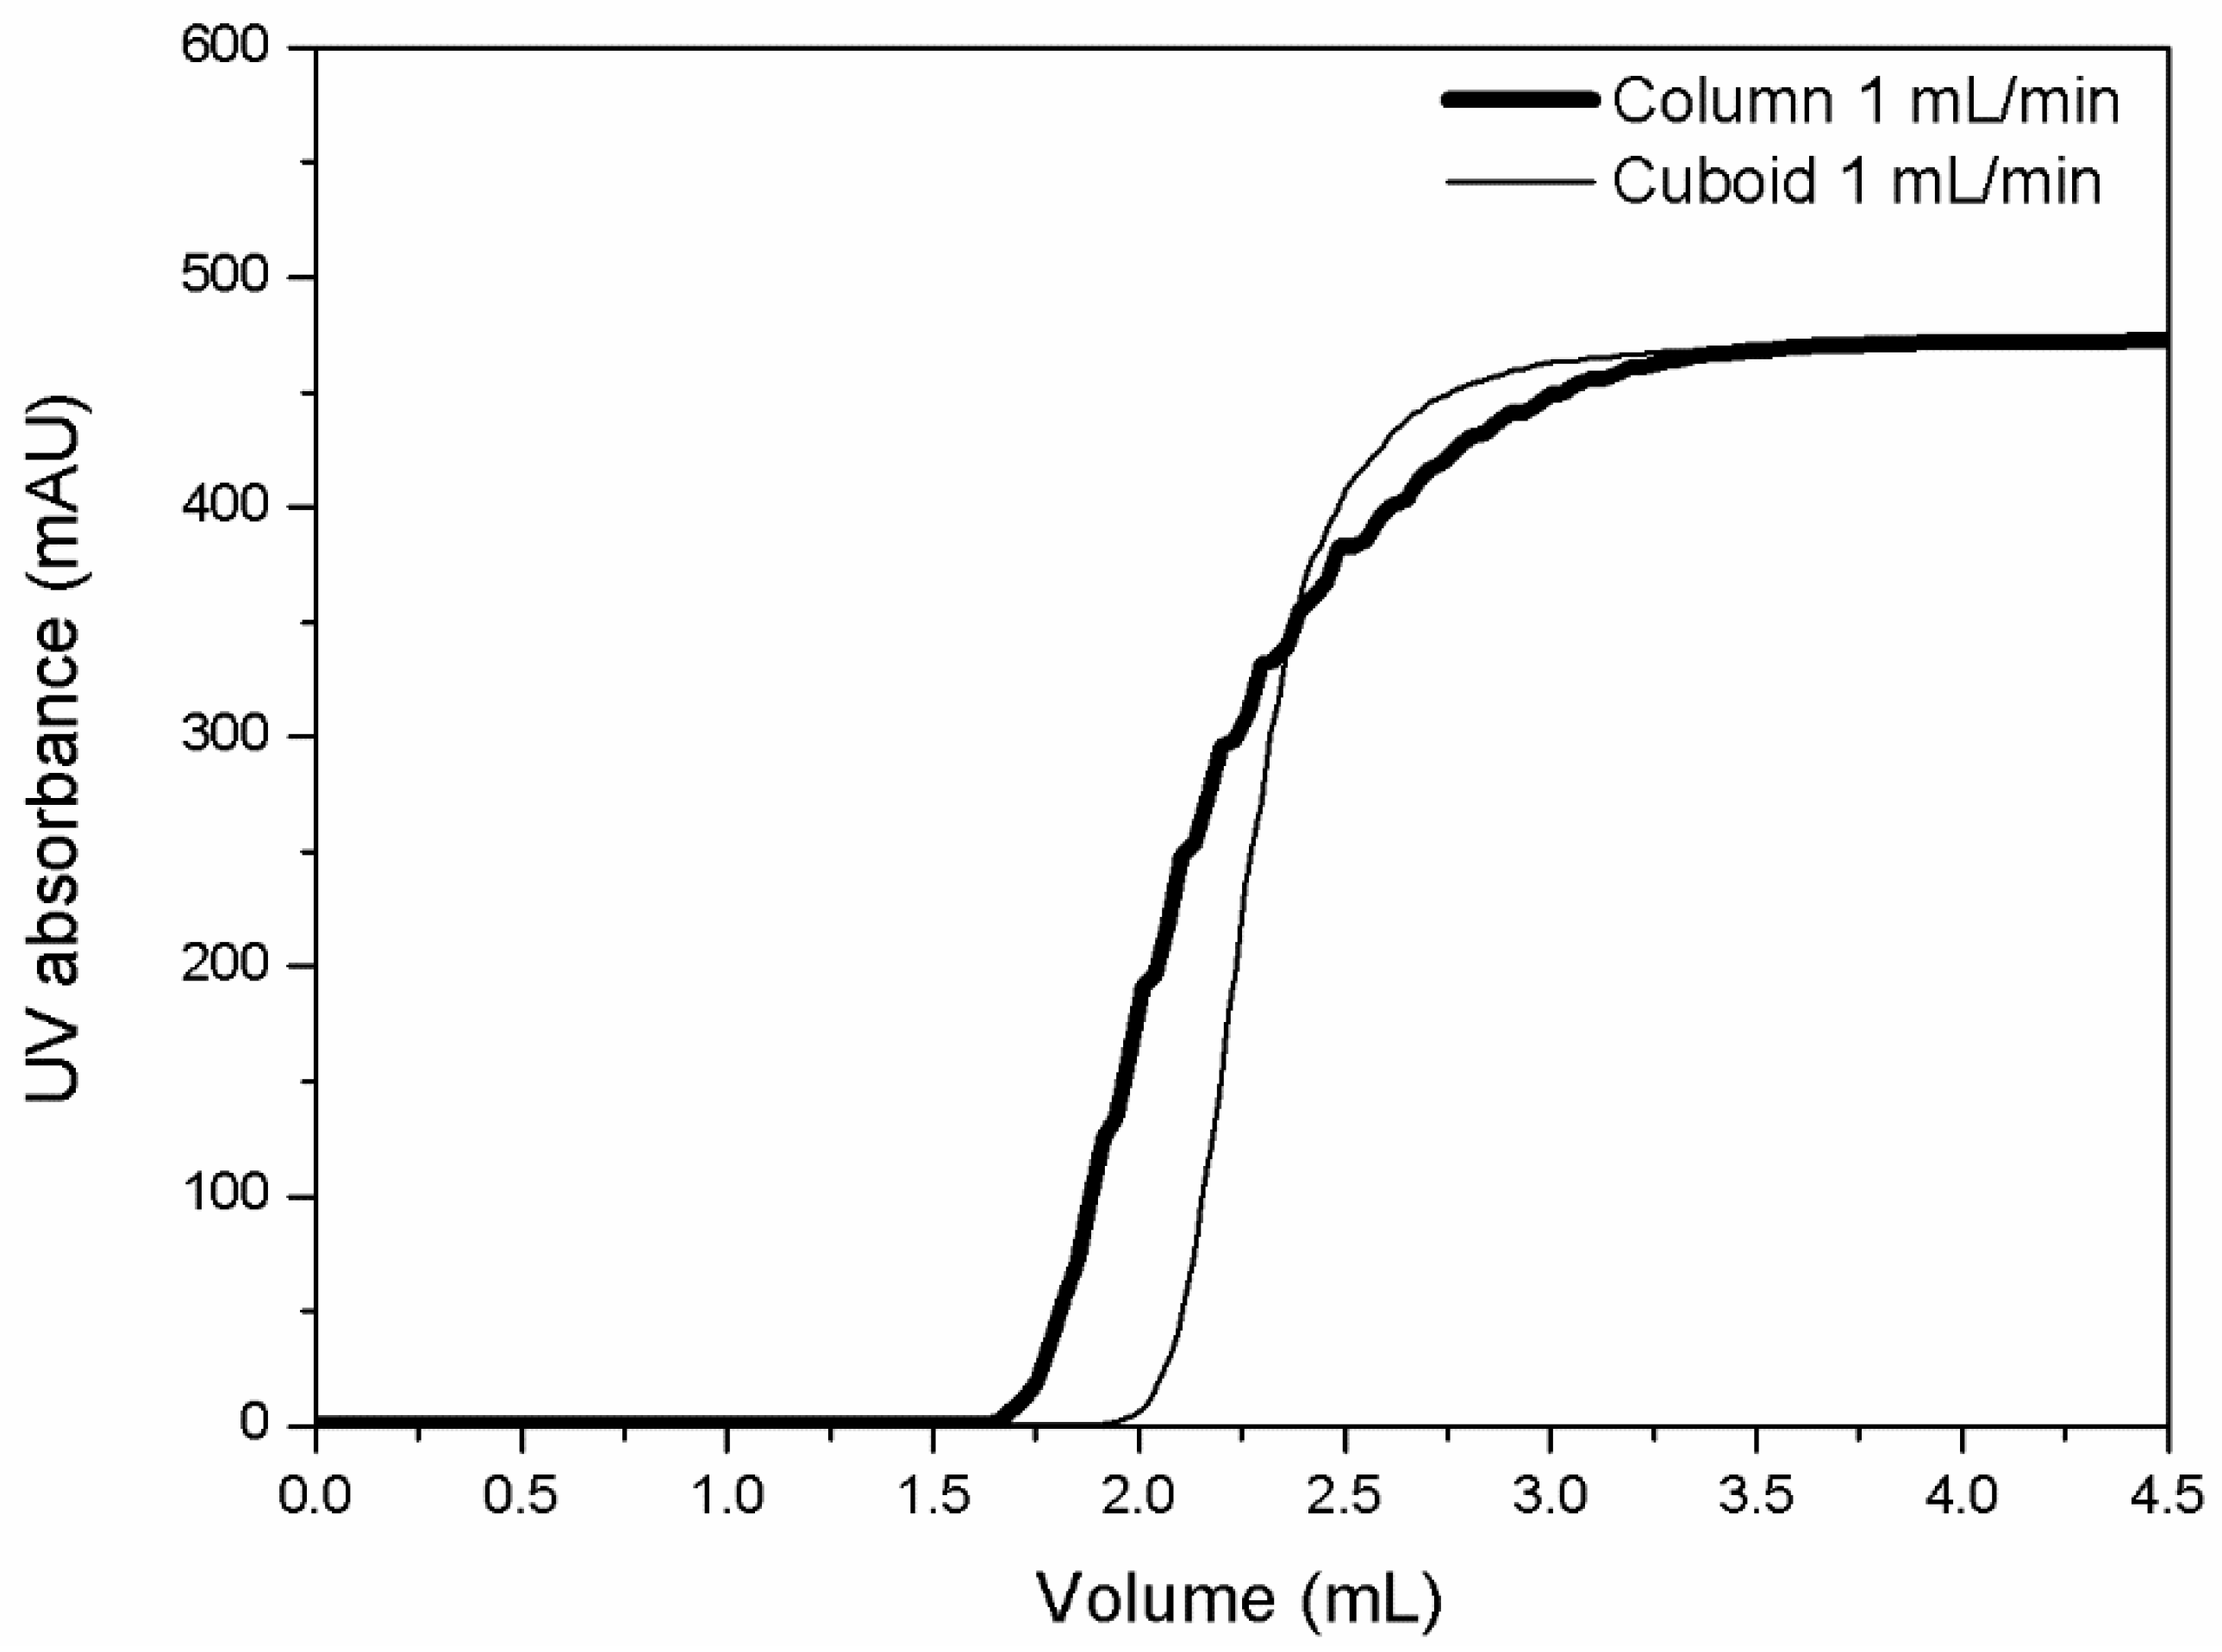
Figure 6 and
Figure S1 (
supplementary information) show the unbound protein (i.e., lysozyme) breakthrough peaks obtained with the column and the best cuboid packed-bed device at different flow rates (1 mL/min and 5 mL/min, i.e., at
vS = 30 cm/h and 150 cm/h respectively). In these experiments, 50 mM Tris-HCl, pH 8 was used as the running buffer and 5 mL of 1 mg/mL lysozyme solution prepared in the running buffer was injected after ultraviolet (UV) absorbance equilibration. The large lysozyme sample volume ensured that the UV absorbance plateaued for a significant duration before decaying back to the baseline. The unbound protein breakthrough curves obtained with the best cuboid packed-bed device were sharper at both flow rates, clearly indicating its superior flow distribution attribute.
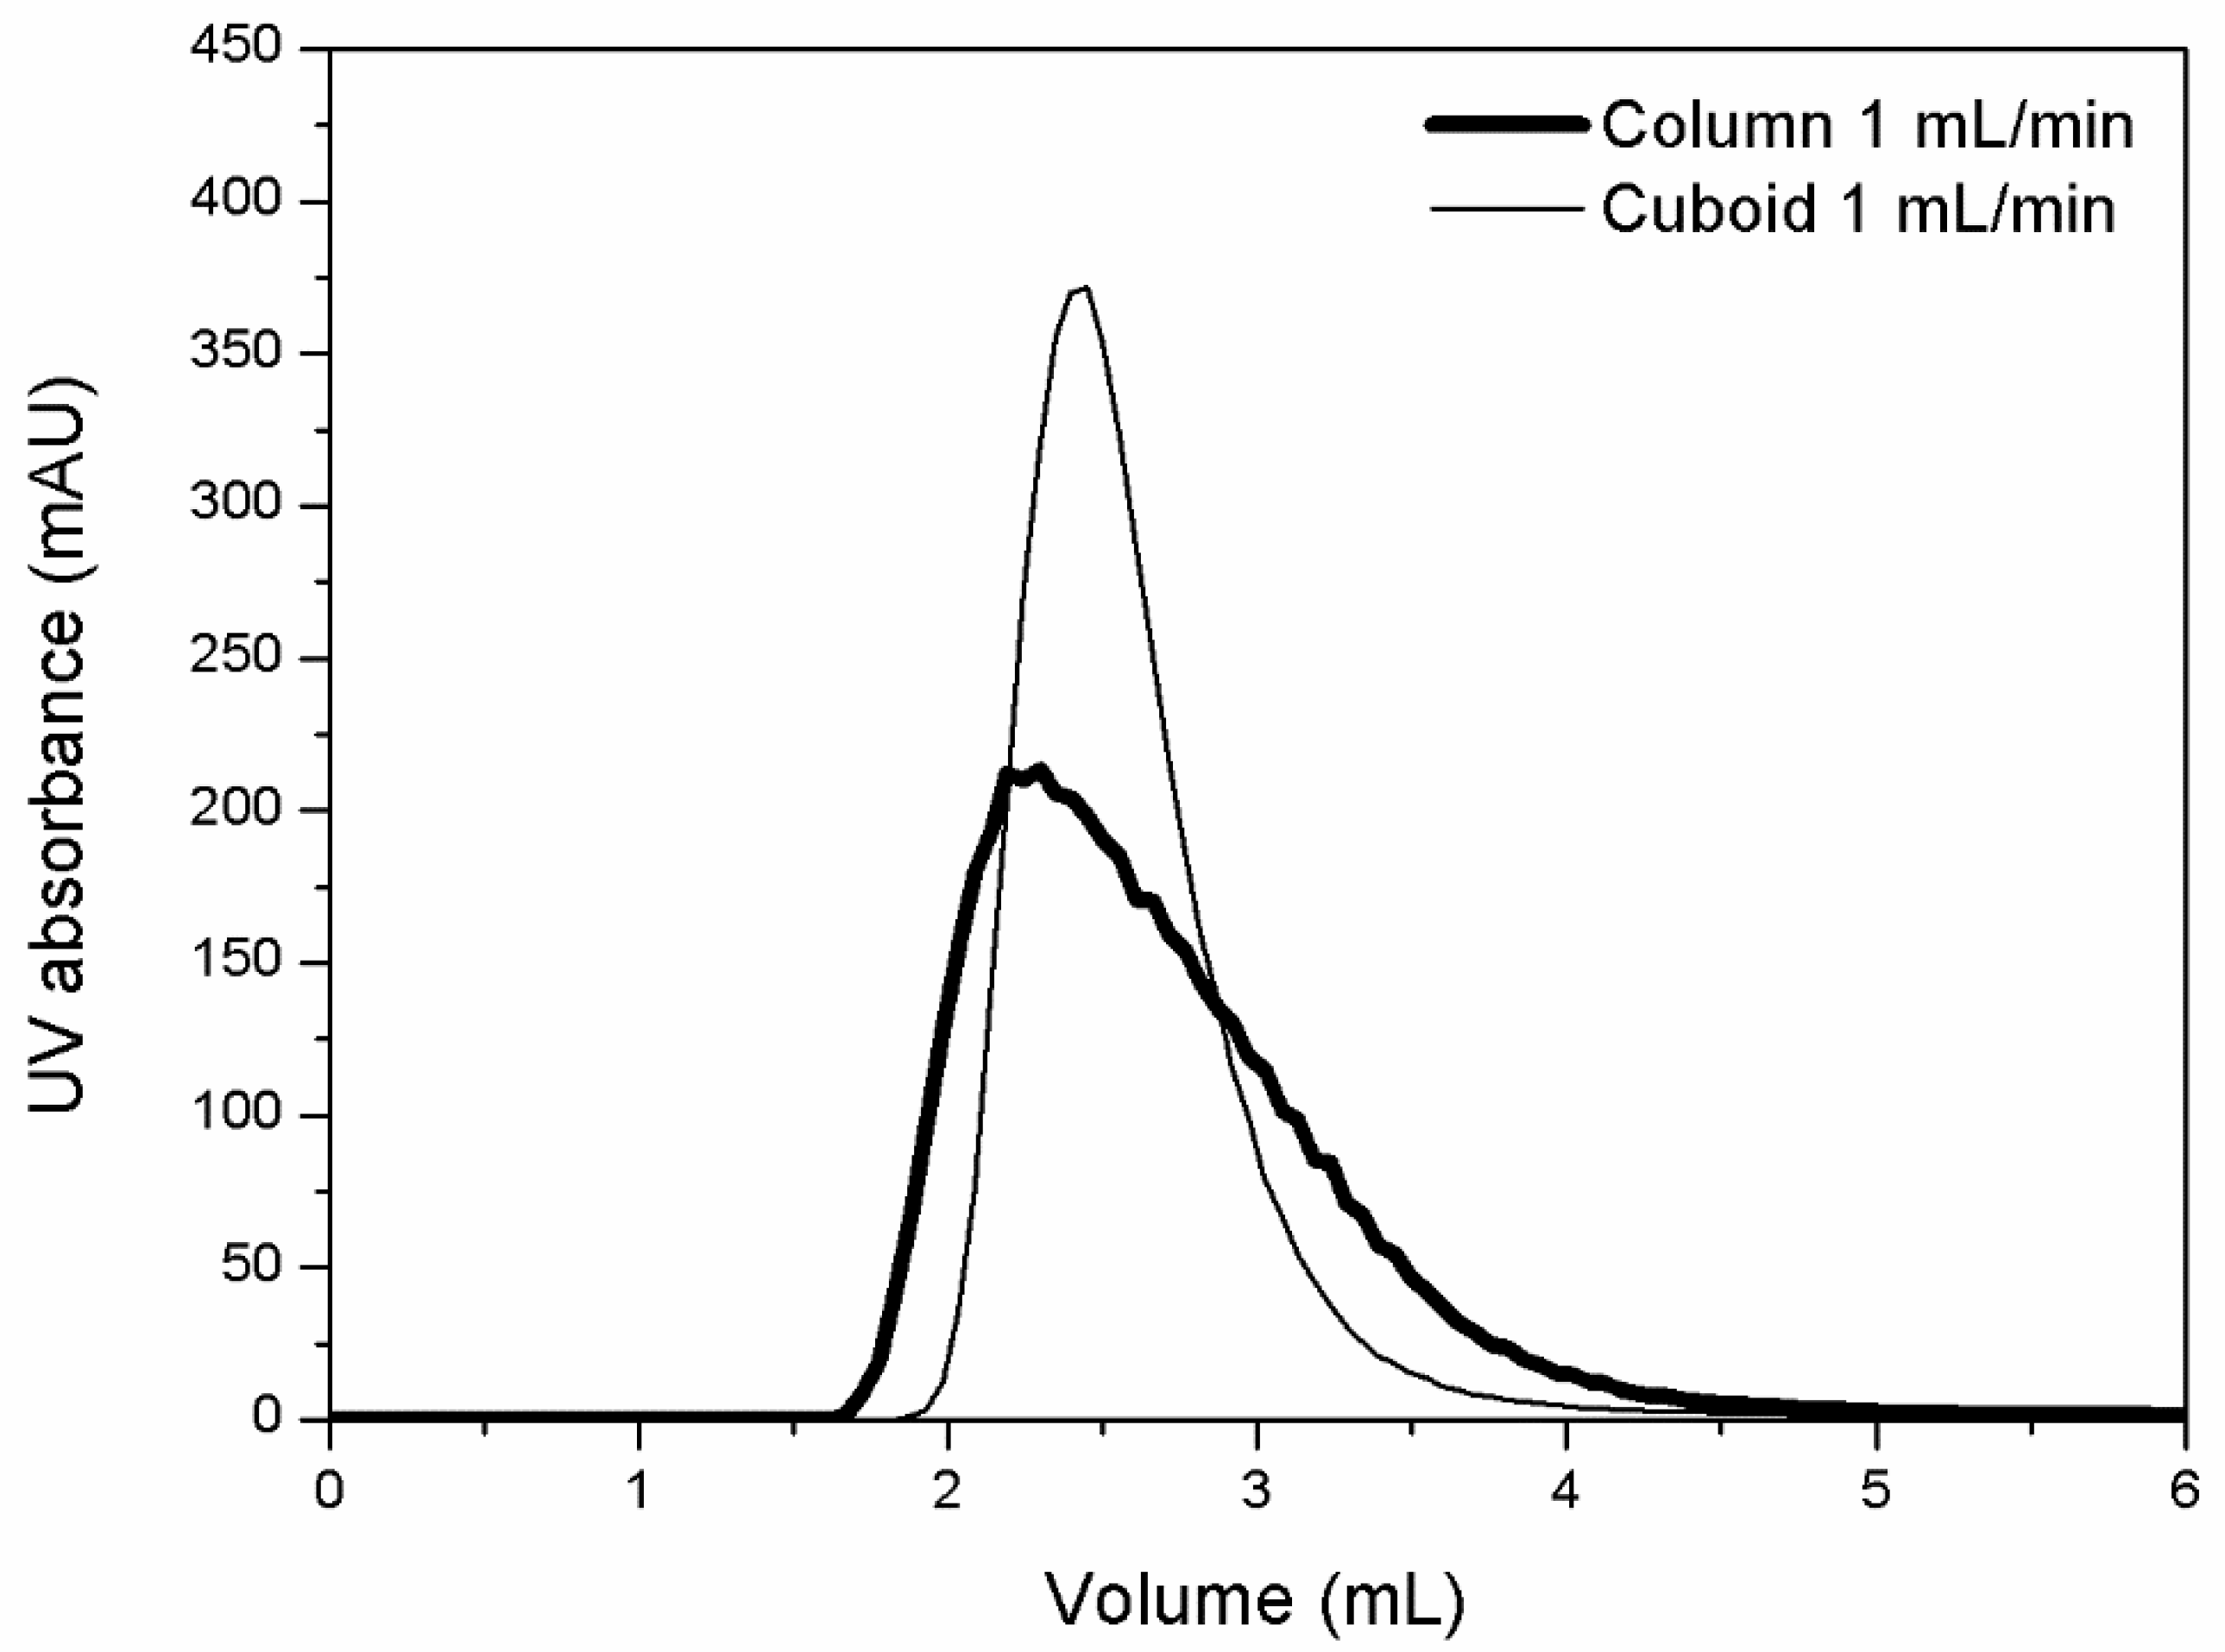
Figure 7 and
Figure S2 (
supplementary information) show lysozyme flow through peaks obtained with the best cuboid packed-bed device and the column, at different flow rates (1 mL/min and 5 mL/min, i.e., at
vS = 30 cm/h and 150 cm/h respectively) by injecting 0.5 mL of 1 mg/mL lysozyme solution. Consistent with the salt peaks shown in
Figure 3 and
Figure 4, the lysozyme flow-through peaks obtained with the best cuboid packed-bed device were significantly sharper and more symmetrical than those obtained with the column. In order to compare the above flow through peaks, a parameter termed dispersion index (
DI) was used, and is defined below:
where
Vinj is the volume injected. The calculated values are summarized in
Table 2.
The peak widths at half height and DI values of the flow through peaks obtained with the best cuboid packed-bed device by injecting 0.5 mL of lysozyme sample were significantly lower than those obtain with the column at the different flow rates. Moreover, the peaks were more symmetrical, the difference in symmetry being greater at the lower flow rate. Once again, these results demonstrate the role of flow distribution in the performance of chromatographic devices.
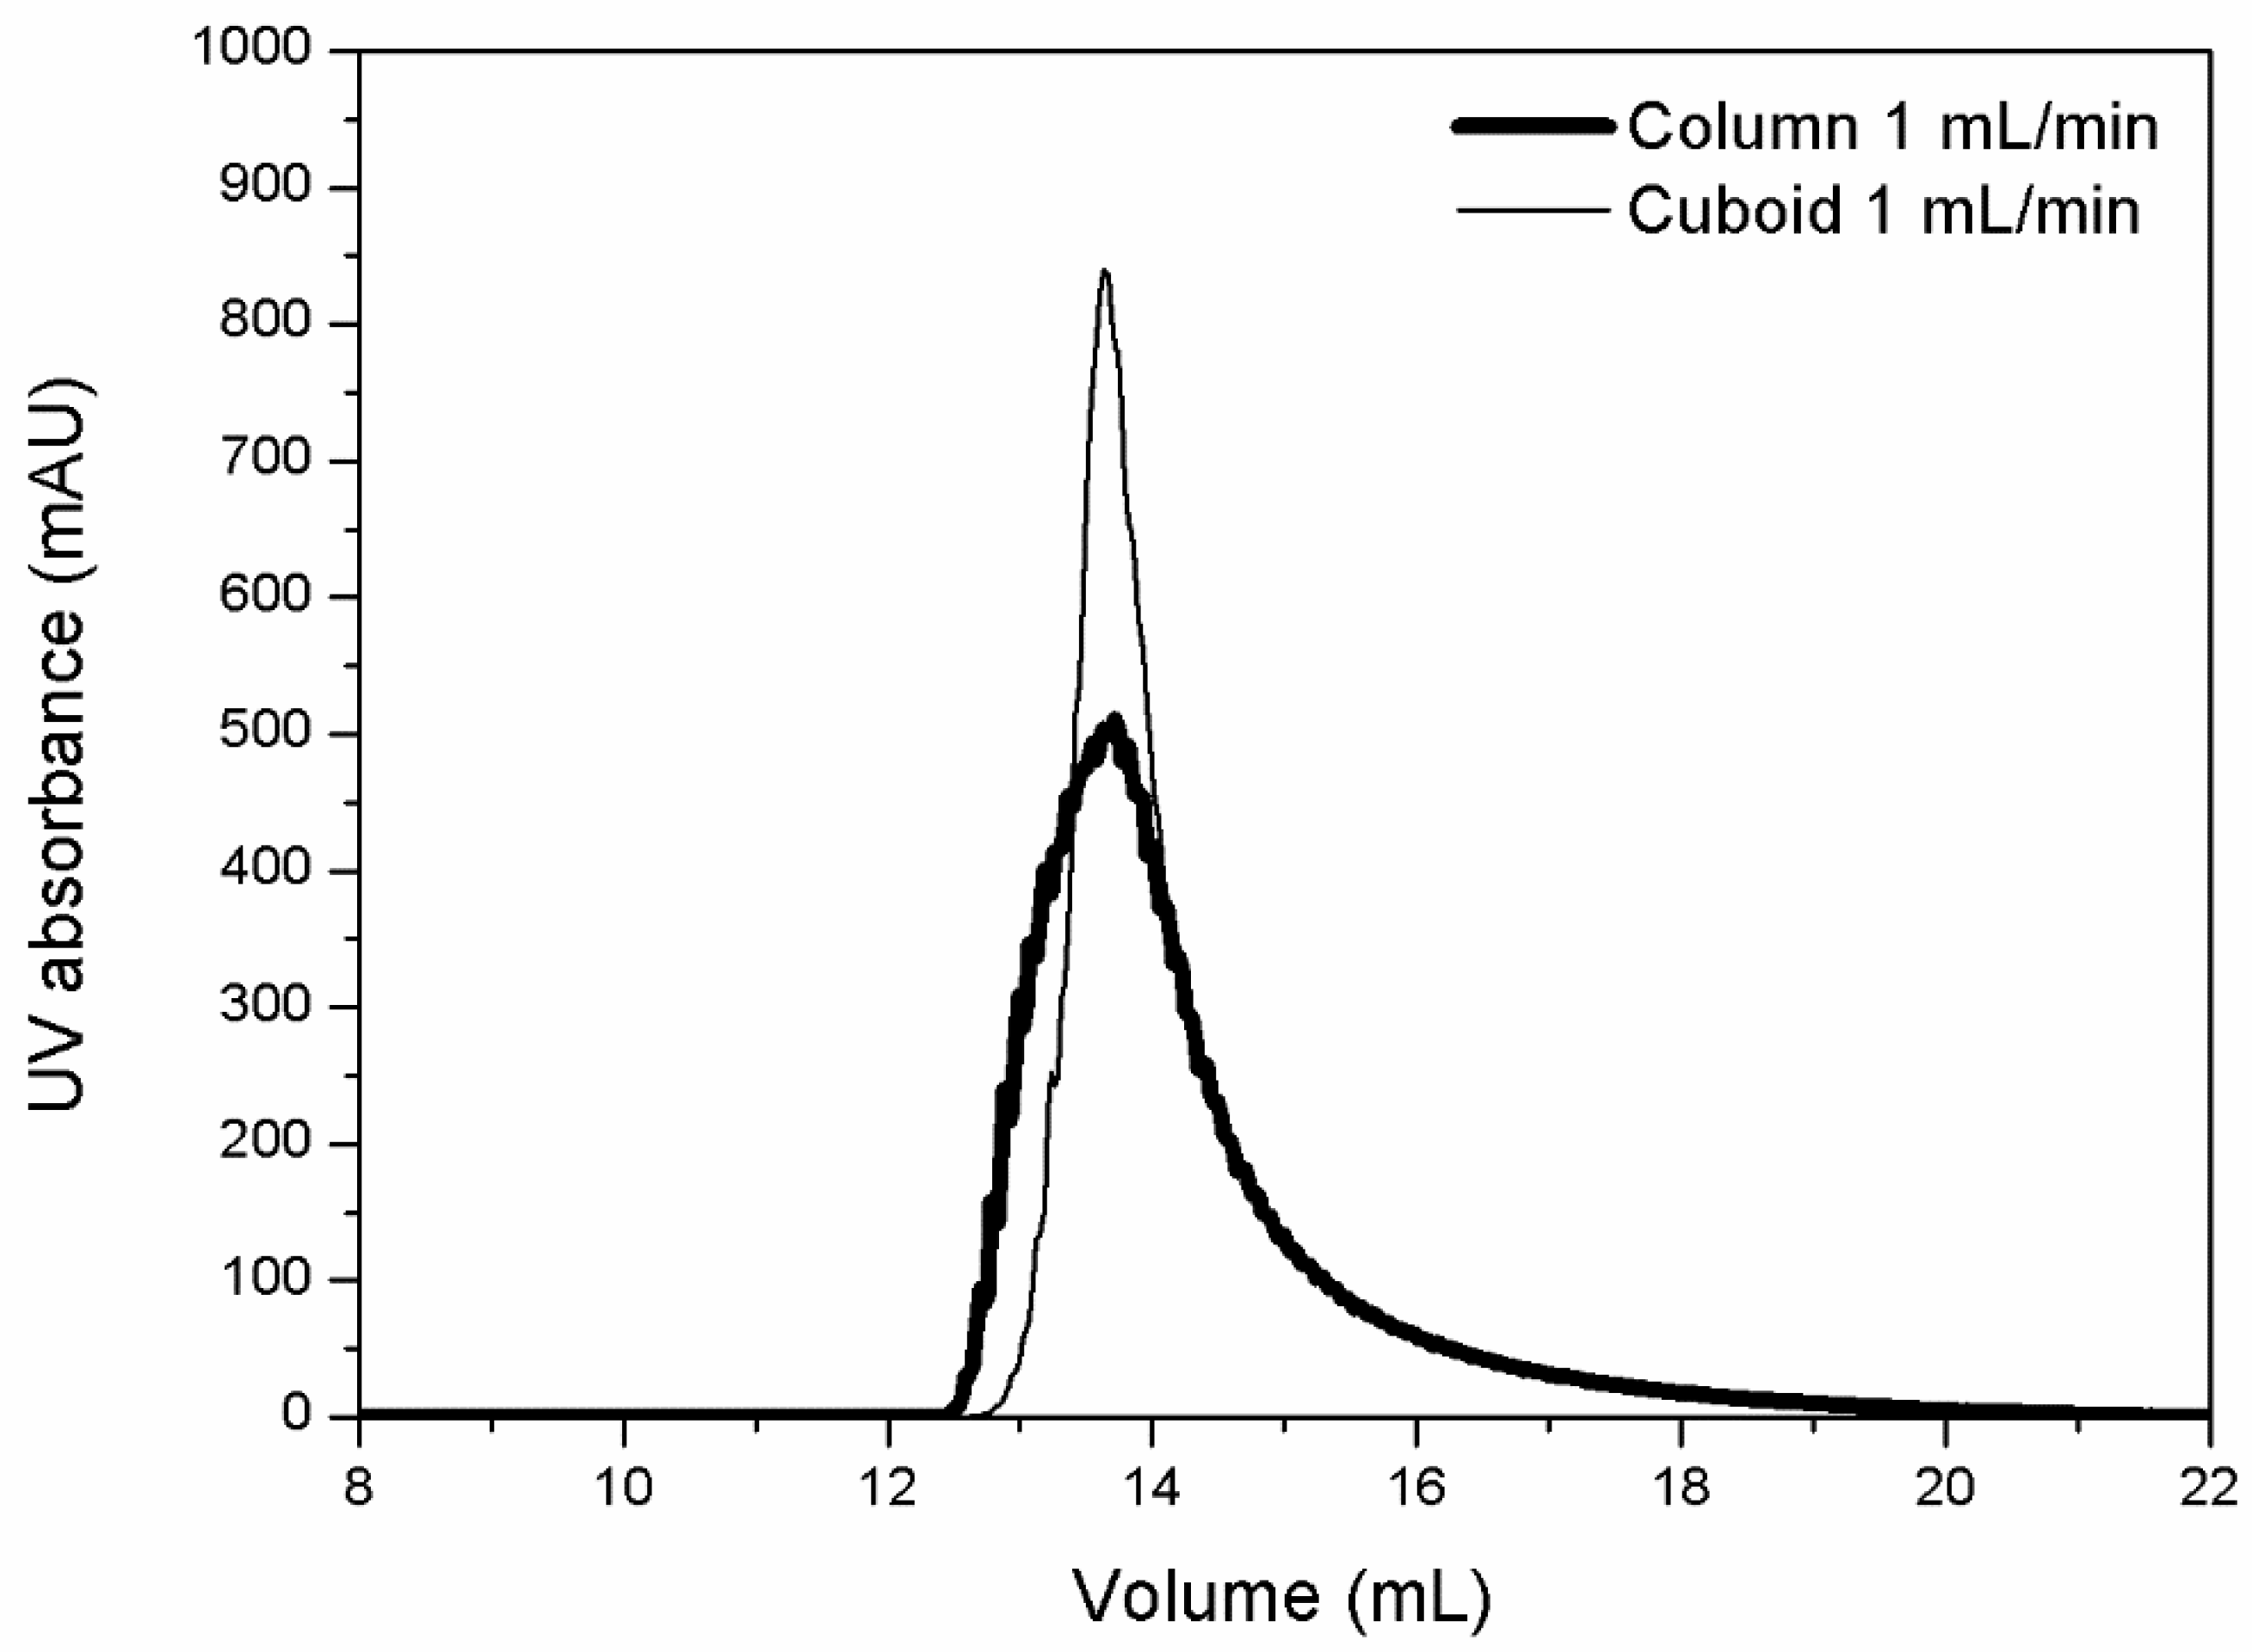
Figure 8 and
Figure S3 (
supplementary information) show the BSA elution peaks obtained with the best cuboid packed-bed device and the column. The binding buffer used in this experiment was 50 mM Tris-HCl buffer, pH 8, while 50 mM Tris-HCl buffer, 1M NaCl, pH 8 was used as the eluting buffer. These experiments were carried out at two different flow rates (1 mL/min and 5 mL/min, i.e., at
vS = 30 cm/h and 150 cm/h respectively) by injecting 5 mL of 2 mg/mL BSA solution.
Figures S4 and S5 (
supplementary information) show the results obtained from similar experiments carried out using 0.5 mL of 2 mg/mL BSA solution. In each case, a step change from the binding buffer to 100% eluting buffer was made immediately after sample injection. At all the different conditions examined (i.e., shown in
Figure 8 and
Figure S3–S5), the BSA elution peaks obtained with the best cuboid packed-bed device were sharper than those obtained with the column. Earlier in the paper, the parameter
DI was used for quantifying the spread of flow through peaks. The corresponding metric for an eluted peak could be referred to as the apparent dispersion index (
ADI), quantified in a similar manner, i.e., using Equation (14). The qualifier “apparent” is necessary for an eluted peak as its spread depends not only on column hydraulics but also on the gradient used for elution. Therefore, for comparison of two eluted peaks using
ADI, the elution gradient has to be identical. The calculated
ADI data obtained from the peaks shown in
Figure 8 and
Figure S3–S5 (
supplementary information) are summarized in
Table 3 and
Table S1 (
supplementary information). At each experimental condition, the peak width at half height and corresponding
ADI obtained with the best cuboid packed-bed device was significantly lower than that obtained with the column.
Chromatography columns used for large-scale purification of biologicals such as monoclonal antibodies have low bed height to diameter ratios. For instance affinity chromatography, anion exchange chromatography, and cation exchange chromatography columns having ratios of 0.15, 0.18 and 0.08, respectively, have been used for 20,000 L scale production of monoclonal antibodies [
7]. The bed height-to-diameter ratio of the cuboid packed-bed devices and colums used in this study is 1.57. Therefore, it may be anticipated that the cuboid packed-bed devices would show even better relative performances when the bed height-to-diameter ratio is lower. The amount of material used to fabricate the wall of a chromatography device is an important factor determining equipment cost. For a given wall thickness, a column would use the least amount of material as the circular cross-section ensures the lowest perimeter for a given cross-sectional area. For the cuboid packed-bed device, the amount of material used to fabricate the wall would depend on the length-to-width aspect ratio, as the perimeter would depend on it, the minimum being when the aspect ratio is one. In terms of wall material cost, the cuboid packed-bed device with an aspect ratio of one would be more expensive than the column by a factor of 1.128. This factor would increase with increase in the aspect ratio. In summary, a cuboid packed-bed device shows significant promise in applications such as large-scale, high-resolution purifications of biologicals.


