Article

Model Development and Validation of Fluid Bed Wet Granulation with Dry Binder Addition Using a Population Balance Model Methodology

by
Shashank Venkat Muddu
1,
Ashutosh Tamrakar
1,
Preetanshu Pandey
2,† and
Rohit Ramachandran
1,*
1
98 Brett Rd., Department of Chemical and Biochemical Engineering, Rutgers-The State University of New Jersey, Piscataway, NJ 08854, USA
2
Drug Product Science and Technology, Bristol-Myers Squibb, New Brunswick, NJ 08854, USA
*
Author to whom correspondence should be addressed.
Currently at Kura Oncology Inc., Drug Product Development, 3033 Science Park Rd., San Diego, CA 92121, USA.
Processes 2018, 6(9), 154; https://doi.org/10.3390/pr6090154
Submission received: 15 June 2018 / Revised: 2 August 2018 / Accepted: 21 August 2018 / Published: 1 September 2018
(This article belongs to the Special Issue Process Modelling and Simulation)

Abstract

:
An experimental study in industry was previously carried out on a batch fluid bed granulation system by varying the inlet fluidizing air temperature, binder liquid spray atomization pressure, the binder liquid spray rate and the disintegrant composition in the formulation. A population balance model framework integrated with heat transfer and moisture balance due to liquid addition and evaporation was developed to simulate the fluid bed granulation system. The model predictions were compared with the industry data, namely, the particle size distributions (PSDs) and geometric mean diameters (GMDs) at various time-points in the granulation process. The model also predicted the trends for binder particle dissolution in the wetting liquid and the temperatures of the bed particles in the fluid bed granulator. Lastly, various process parameters were varied and extended beyond the region studied in the aforementioned experimental study to identify optimal regimes for granulation.

1. Introduction and Objectives

Fluid bed granulation (FBG) is a process widely used in the pharmaceutical industry to manufacture solid dosage products and its importance to the industry has resulted in it being extensively studied over the last few decades [1,2,3]. During an FBG unit operation, size enlargement of circulating primary powder particles takes place within the fluid bed chamber due to the wetting of particles by the sprayed binder solution and the resulting collisions between wetted particles. The particle wetting rates in an FBG are highly dependent on the particle flow pattern which in turn is affected by the flow field of the fluidizing gas [4]. Moreover, the flow behavior of the powder within the granulator also depends on the geometry of the vessel. Due to such inherent complexity, there has been a lack of science-based mathematical models that can be applied to better design and operate FBG processes at scale-up [5]. Several attempts are being made to understand the granular flow pattern, but many aspects of it (i.e., a more detailed study of the vessel geometry, fluid flow field, collision frequencies etc.) using sophisticated modeling tools and techniques are yet to be developed [6]. As the pharmaceutical industries are transitioning towards implementation of US Food and Drug Administration (FDA) recommended Quality by Design (QbD) guidelines, there is a growing effort related to the development of practical and predictive models of particulate processes over the last decade to incorporate discrete particle simulations in the study of particle and particle–fluid flow.
Recently, fundamental modeling approaches such as discrete element modeling (DEM) and computational fluid dynamics (CFD) have become exceedingly popular in capturing particle level physics [4,6,7,8,9,10,11,12,13,14,15]. One such coupled DEM-CFD model for simulating a fluid bed granulation has been elucidated in detail in Tamrakar et al. [16]. However, employing such complex multi-phase simulations requires a steep computational cost. In DEM simulation which models the solid particle phase, for example, the computational algorithm needs to solve a set of momentum equations for each and every particle being handled in the system for very small time intervals (around 10 - 6 s scale) while also tracking their interactions and spatial movements. Similarly, the discretization of the fluid flow field region in CFD simulations into large number of cells to solve Navier Stokes energy and mass conservation equations requires substantial computational power. The high computational cost incurred for implementing a computationally complex model such as DEM-CFD renders it grossly inefficient while developing models for real scale geometries and for simulating actual time length of unit operations. Another significant challenge in the implementation of the mechanistic DEM-CFD model arises from its inability and inefficiency to simulate particle size and property changes resulting from the sub-processes in wet granulation. Since these mechanistic models do not directly relate the captured particle-scale properties back to meso-scopic/macro-scopic quality attributes traditionally utilized by the pharmaceutical standards (such as changes in particle size distribution, average liquid content, etc.), there is a disparity between the needs of the industry and the aims of academic projects. Industrial practitioners generally prefer relations that merely incorporate correction factors and predict properties like bed temperature and bed moisture without simulating the specific system. The same has been described in detail by Gupta in the chapter ’Fluid Bed Granulation and Drying’ [17].
In order to deal with these limitations, an integrated modular meso/macro-scale model development is proposed that will contain the mechanics for binder dissolution, energy balances of the FBG, moisture balance of the granulator and the particulate formation mechanics. This model would be computationally inexpensive too as it does not take any data from DEM/CFD coupled models. This model can be tailor made to adapt to different unit operations and scenarios. The most general rate-based modeling technique used for simulating granulation processes are population balance models (PBMs) that can accommodate various granulation subprocesses (e.g., aggregation, consolidation and breakage) that result in changes to the particle property including size, porosity, liquid content, etc. [10,18,19,20,21,22,23,24]. PBM relies heavily on the different aggregation, breakage, consolidation, etc. rate expressions—also called rate kernels—which describe the sub-mechanisms involved in the size enlargement phenomena during granulation. By summing the effect of different sub-mechanisms for individual size class of particles, PBM is able to offer a net change information on the size of particles within the system in response to different operating conditions. PBMs are thus used to gain insight into the underlying granule growth/attrition rate processes. Dosta et al. [25], for instance, used a one-dimensional PBM to mathematically model FBG where simple fluid bed dynamics were coupled with heat and mass transfer. Traditionally, however, stochastic PBM methods model processes without particle transport, implying that the system is perfectly mixed. Tan et al. [10], on the other hand, developed a kinetic energy (EKE) kernel for PBM to describe the evolution of granule size distributions in fluidized bed melt granulation from kinetic theory of granular flow (KTGF). For heterogeneous granulation behaviors observed in fluidized beds, where all powder particles are not wetted to the same degree, the assumption of uniformity breaks down. In such circumstances, compartmental PBMs have been proposed to account for the heterogeneous nature of liquid addition and powder mixing [26,27]. Another important thing to note for PBM development is that the mechanistic information, used in calculation of aggregation and breakage kernels (i.e., effect of particle properties, spatial and size effect, degree of particle wetting etc.) in different size classes, are usually derived from empirical relations or particle-level models. PBM models, thus, cannot independently capture the detailed granulation behavior without empirical parameters inherent in its kernels. As a result, integrating PBM with binder dissolution mechanics and heat balances using first principles drying mechanics in a commercial programming interface would calculate the parameters in every step of the process and enable one to tune the empirical parameters to available experimental data that can be then used to validate and predict data at other operating conditions.

Objectives

The first goal of this work is to validate the available industrial data on mass fraction based particle size distributions (PSDs) and the derived geometric mean diameters (GMDs). Along with the mass balance equations, the energy balance relations have been developed in this work in order to get estimates on the temperature of the granulation bed over time. The changes in viscosity due to addition of liquid with pre-dissolved binder to the granular bed consisting of dry binder particles have been modeled by employing the binder dissolution model and viscosity prediction model that has been integrated into the aggregation mechanism of the PBM. Upon estimation of the empirical parameters in the model, the simulation design space has been extended beyond the region studied by the industrial experimenters. Conditions have been explored that lead to desired granulation with higher median diameter values (D 50 ) and undesired granulation regimes with a higher amount of fines despite having the optimum D 50 .

2. Materials and Experimental Methods

The materials and experimental methods were performed by Pandey et al. [28] at Drug Product Science and Technology, Bristol-Myers Squibb, New Brunswick, NJ, USA and have been summarized below.

2.1. Materials

The experimental formulation consisted of active pharmaceutical ingredient (API) Lamivuidine, micro-crystalline cellulose (MCC-Avicel PH 102) as excipient, sodium starch glycolate (SSG) as the glidant, hydroxypropyl cellulose (HPC) as the binder and, lastly, magnesium stearate (MgSt) as the extra-granular lubricant. Of these components, Lamivuidine, MCC, SSG and HPC were present in the granulation blend and therefore have been considered for the modeling simulation study in this work. Although it was a multi-component granulation, the multiple components have been modeled as a singular granular blend solid in the subsequent section. In the granulation process, half of the HPC was pre-blended with the other excipients before granulation in the fluid bed; the other half was added as part of the sprayed binder solution.

2.2. Batch Design

Two formulations were evaluated using FBG: one containing 5% w/w SSG, and the other containing 10% w/w SSG. In order to account for the different SSG content in different designs of experiments’ (DOE) settings, the content of the MCC excipient was adjusted accordingly (Table 1).
The mass percentages of the components in the dry granular pre-blend and after the incorporation of the dissolved wet binder onto the granules were accordingly computed as shown (Table 2).
A 2 ( 4 - 1 ) fractional factorial design of experiemnts (DOE) with two center points (10 experiments) was used to study the effect of one formulation factor (level of super-disintegrant) and three process factors (inlet air temperature, spray rate and atomization air pressure) on the moisture profile and granule growth rates of the FBG batches. The study design is listed in Table 3.
The system was modeled only for nozzle atomization pressure of 1 bar as PBMs cannot incorporate the effect of changing nozzle atomization pressures. Coupled CFD studies would be required for the same that incorporate the effect of liquid atomization pressures on the liquid flow patterns. Therefore, the PSD data of experimental runs 1, 2, 7 and 10 were used for calibrating the empirical parameters and validating the experimental data (75% training/calibration & 25% validation) in this study. The parameters obtained were then used for simulating the PSD growth behavior cases for which experimental data were not available at settings beyond the ones covered in the experimental DOE as shown in (Table 4). The study was expanded to include seven L/S ratios, three disintegrant amounts, three inlet air temperatures and three liquid spray rates. Therefore, the total number of runs in the extended simulations was 7 × 3 × 3 × 3 which is a total of 189 simulation cases.

2.3. Fluid Bed Granulation

The experimentation performed by the research group Pandey et al. [28] on the fluidized bed has been described in this section. Fluid-bed wet granulation was performed in a GPGC-2 (Glatt Air Techniques Inc., Ramsey, NJ, USA) with an integrated peristaltic pump. Inlet air temperature and velocity were controlled during processing. A total of 667 g of binder solution was delivered to the blend through a 1 mm spray nozzle positioned in the top spray configuration. Intra-granular components were pre-blended in a 10 L bin blender for 125 revolutions (5 min at 25 rpm). An initial 2 kg mass of the pre-mixed blend was charged into the fluid bed, and pre-warmed using inlet air at the target temperature for 5 min at an initial air flow velocity of 40 m3/h. The addition of binder solution spray was started after this pre-warm time. During the fluid bed granulation process, airflow velocity was increased by 10 m3/h for every 100 g of binder solution added. When the desired amount of binder solution had been sprayed, inlet air temperature was increased to 60 C to facilitate drying of the granulation. Drying continued until the granule moisture content was below 1.5%.

2.4. Particle Size Distribution

The particle size distributions of the initial and final granular material blends were measured by sieve analysis. The screen sizes used for analysis were as follows: 885 μ m, 505 μ m, 335 μ m, 213 μ m, 141 μ m, 79 μ m and 26.5 μ m. The results were reported as mass percentages of material retained on each of the meshes.

3. Mathematical Model Development

3.1. Particle Grid Configuration

As the granular bed contains both solid formulation particles and liquid particles in varying proportions, the particles have been defined on the basis of their solid and liquid contents which are the two key coordinates to describing all of a particle’s dimensions and physical properties such as density, wetted area, etc. The size of the particles have been defined and tracked by the available solid volume content s and liquid volume content l in each different class or ‘bin’ of particles. The solid content and liquid content have been varied independently in a geometric progression. The ratio of the progression has been kept roughly the cubed value of the ratio of sieve size between two consecutive meshes. As eight individual volume amounts of solid and liquid each have been chosen that defined a particle’s contents, there are distinctly 16 different classes of particles in the model and each class is defined by the respective solid and liquid volume content. Therefore, the grid of particles is a two-dimensional (2D) grid and the resulting population balance model developed too is a 2D PBM.

3.2. Particle Wetness Classification

The particles have been modeled as solid spheres consisting of the granular blend composition materials with liquid adhered onto the solid surface. Depending on the volumetric amount of liquid to solid ratio in each particle/bin class, the liquid on the solid has been been modeled either as a concentric layer or as a small circular patch on the spherical solid particle. The wetting behavior of the liquid drop on the solid sphere is determined by the contact angle value. An expression for the radius of the wet patch in case of liquid addition to powder blend consisting of pre-mixed dry binder particles previously used in [29] has been adapted in this work. The expression for the base radius of the wet patch is given as:
R w e t = 3 Π ( θ ) l π 1 3 ,
where Π ( θ ) is a function of the contact angle θ of the liquid on the solid particle, and l is the liquid volume of the particle defined by the grid location ( s , l ) . The expression for the contact angle function is given as:
Π ( θ ) = sin 3 θ 2 - 3 cos θ + cos 3 θ .
The area of the wet patch is therefore given as:
A r e a w e t = π × R w e t 2 .
The fraction of the particle surface covered by liquid has been mathematically as follows in terms of the total external particle surface area and the area of the corresponding wet liquid patch on the particle. It is given as follows:
α w e t = A r e a w e t A r e a p a r t i c l e ,
where A r e a p a r t i c l e is the external surface area of the particle. It must be noted that the wet-patch model calculating the radius of the wet patch on the solid is applicable only to particles in those grids where corresponding R w e t is less than the radius of the solid sphere of the particles. In the cases where the condition doesn’t hold true, the particles have been modeled assuming that the liquid covers the solid particle entirely as a concentric layer. In these cases, it can be seen that the fractional wet area of the particle becomes equal to one ( α w e t = 1 ).

3.3. PBM Configuration

The material balance in the fluid bed granulator (FBG) has been modeled in terms of population balance models (PBMs) which track the change in particle size over time for different classes. PBMs are the established framework for particulate systems with distinct and evolving particle size distributions (PSDs). Moreover, PBMs are nearly indispensable where the rate processes depend on the particle sizes and compositions. Therefore, a semi-mechanistic PBM model has been developed in which the equations were developed from the first principles, but some experimental data and/or material properties were used as input parameters to the rate equations. The granulation process took into account the rate processes of the following phenomena: aggregation of the smaller particles into larger granules, liquid addition due to binder spraying and liquid evaporation due to hot air drying. A basic 2D PBM equation depending on the particle properties (solid and liquid contents) has been formulated as follows:
N ( s , l , t ) t + l N ( s , l , t ) d l d t = a g g ( s , l , t ) ,
where N ( s , l , t ) is the number of particles in bin class ( s , l ) at time point t, d l d t accounts for change in liquid content of the particle due to liquid addition and evaporation and a g g is the aggregation rate of particles of class ( s , l , t ) at time point t. The net aggregation for a general particle of bin class ( s , l ) at time t is defined as follows:
a g g ( s , l , t ) = a g g f o r m ( s , l , t ) - a g g d e p ( s , l , t ) ,
where a g g ( s , l , t ) is the net aggregation rate of any particular particle class, a g g f o r m ( s , l , t ) is the rate of formation of a particle due to aggregation during a binary collision of particles, and a g g d e p ( s , l , t ) is the rate of depletion of particles due to collision with other particles. The rate of formation of a particle of class ( s , l ) due to aggregation of two smaller particles at a given time instant t is given similar treatment as a kinetic reaction and thus has been defined as follows:
a g g f o r m ( s , l , t ) = 1 2 s = s m i n s l = l m i n l β ( s , s - s , l , l - l , t ) N ( s , l , t ) N ( s - s , l - l , t ) ,
where s m i n and l m i n are the respective minimum solid and liquid volumes for a particle, and β ( s , s - s , l , l - l , t ) indicates the specific aggregation rate of any two particles whose net respective bin volumes equate to ( s , l ) . The above equation takes into account all the possible ordered pair combinations such that the net volume of the colliding particles is equal to the volume of the particle use formation rate is being tracked. The product of the aggregation kernel and the number of particles of each colliding ordered pair is multiplied by half as each possible combination is counted twice while performing the ordered pair multiplication. The rate of depletion of a particle due to aggregation of the particle with another at a given time instant t is given as follows:
a g g d e p ( s , l , t ) = N ( s , l , t ) s = s m i n s l = l m i n l β ( s , s , l , l , t ) N ( s , l , t ) .
It can be seen from Equation (6) that the aggregation of particles is overall a second order process, and is directly proportional to the number/quantity of each colliding particle bin/ size class.

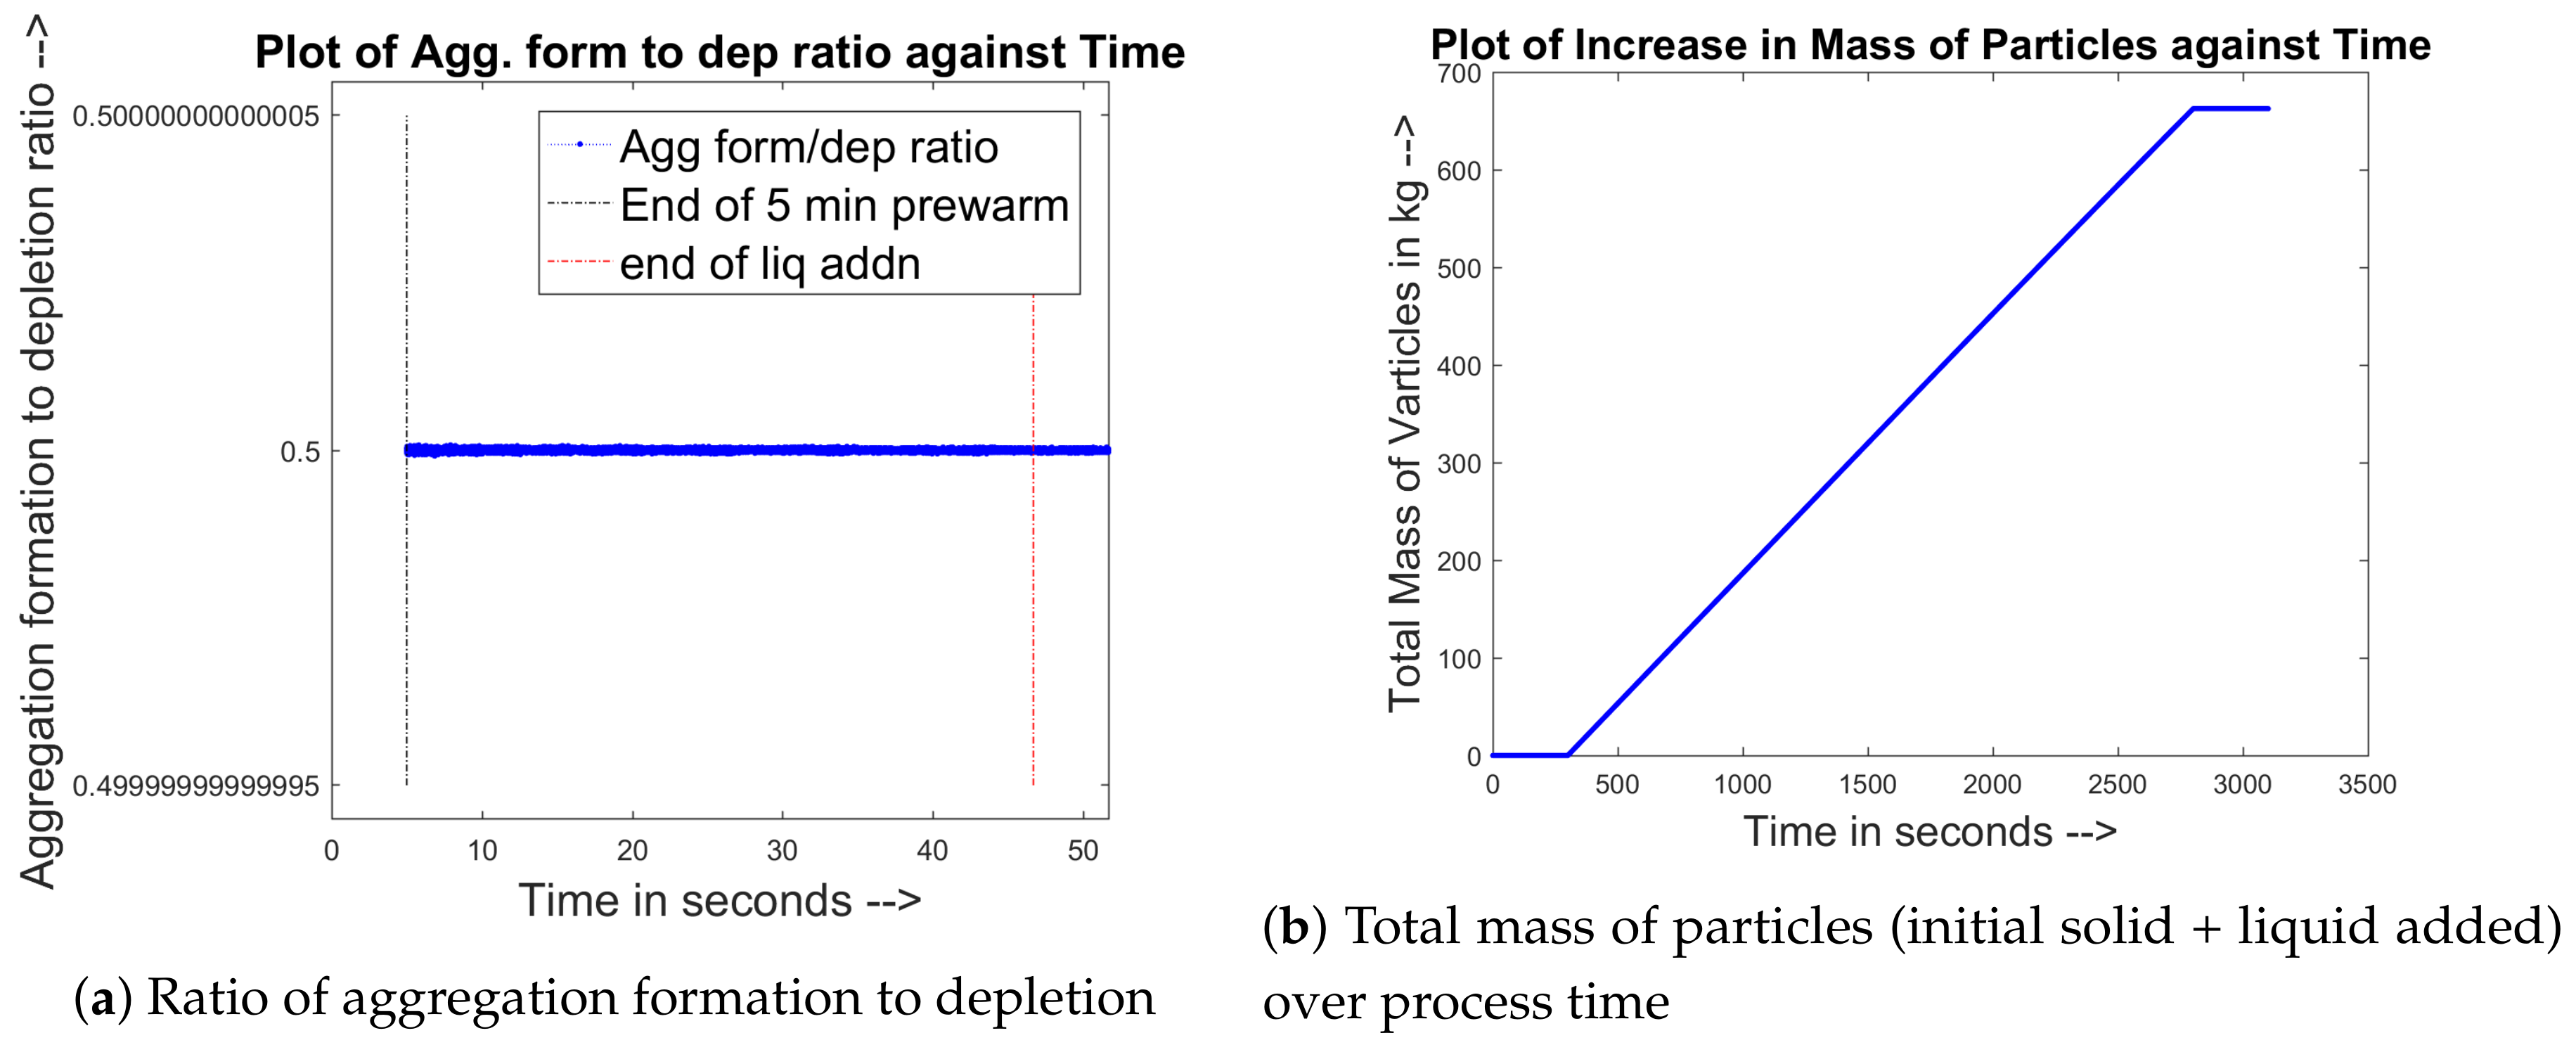
3.4. Aggregation Kernel Development

The aggregation rate kernel is akin to a kinetic reaction rate constant. However, in the PBM model developed in our study, the kernel rather depends on the properties of the colliding particles/granules. The kernel that was developed in [29] has been adapted in this work and has been described as follows:
β ( s , s - s , l , l - l , t ) = β 0 × ψ p h y s i c a l ( s , s - l , l , l - l , t ) × ψ g e o m e t r i c ( s , s - s , l , l - l ) ,
where β 0 is an empirical rate constant, ψ p h y s i c a l ( s , s - s , l , l - l , t ) is a physical success parameter and ψ g e o m e t r i c ( s , s - s , l , l - l ) is a geometric success parameter for aggregation to occur. The physical and geometric success parameters have been developed along the similar lines as in [7]. The physical success factor for aggregation depends on the Stokes number and critical Stokes number of the system. The Stokes number for any ordered pair of particles was defined by [30] as follows:
S t i j = u o ρ 18 μ d i a i d i a j ( ( d i a i + d i a j ) 2 ) d i a i 3 + d i a j 3 ,
where S t i j is the Stokes’ Number for an ordered pair of colliding particles i and j, respectively, u o is the magnitude of the velocity of the colliding particles, μ is the viscosity of the liquid binder film wetting/covering the surface of the particles, ρ is the density of the solid component of the particles, and d i a i and d i a j are the diameters of the solid spherical parts of the colliding particles i and j, respectively. The magnitude of the velocity of the particles u o is given by the expression from [7] as:
u o = 3 2 π × T b e d ,
where T b e d is the average temperature of the bed of particles in the fluid bed granulator. The critical Stokes’ Number has been defined as follows:
S t * = 1 + 1 e r e s t l n h o , i + h o , j h a , r e d ,
where e r e s t is the coefficient of restitution of the colliding particles, h o , i and h o , j are the depth of the liquid on the solid particle surfaces for the ordered pair of particles i and j, respectively, and, lastly, h a , r e d is the harmonic mean of the asperity values of the particles i and j. The value of the physical success factor ψ p h y s i c a l is binary and is determined by the comparison of the Stokes’ number S t i j of the ordered pair of particles with the critical Stokes’s number S t * for the same ordered set. It has been defined as follows:
ψ p h y s i c a l = 1 , S t S t * , 0 , o t h e r w i s e .
The geometric success factor for aggregation upon collision of two particles i and j depends upon the fractional wetted surface area α w e t in accordance with [7] as follows:
ψ g e o m e t r i c = 1 - ( 1 - α i ) × ( 1 - α j ) .
The above expression in Equation (14) takes into account the possibility of collisions in all the combinations of directions: wet surface on wet surface and wet surface on dry surface of particles.

3.5. Liquid Balance of the Particle Bed

The liquid balance for the particles due to liquid addition and aggregation has been developed as follows:
- l N ( s , l , t ) d l d t = N l , s p r a y ( s , l , t ) + N l , e v a p ( s , l , t ) .
Here, N l , s p r a y is the rate of particles being formed due to spray liquid addition into the bin ( s , l ) and N l , e v a p is the rate of particles being depleted due to liquid evaporation from the the bin ( s , l ) at time t. The net rate of particles being formed due to liquid addition into the bin ( s , l ) can be described as follows:
N l , s p r a y ( s , l , t ) = N l , s p r a y , f o r m ( s , l , t ) - N l , s p r a y , d e p ( s , l , t ) ,
where N l , s p r a y , f o r m is the rate of particles formed in bin ( s , l ) and N l , s p r a y , d e p is the rate of particles lost from bin ( s , l ) at time t due to the liquid sprayed. The rate of particles being formed in bin ( s , l , t ) due to liquid addition is given as follows:
N l , s p r a y , f o r m ( s , l , t ) = v ˙ s p r a y ( v l ( l ) - v l ( l - 1 ) ) × N ( s , l - 1 , t - 1 ) v s ( s ) v s ( s ) N ( s , : , t - 1 ) ,
where the particles are being formed in bin ( s , l ) due to liquid addition in bin ( s , l - 1 ) . Here, it is assumed that the spray liquid is being distributed according to the volume of the solid content in the bin ( s , l - 1 ) . It is to be noted that the number of particles N ( s , l - 1 , t - 1 ) is used, as the calculations for the time point t are done using the data available at time point ( t - 1 ) . This is in accordance with the 1st order forward difference principles being used in the discretization of all the partial differential equations in the modeling of the system. The discretization has been described further in Section 3.8. The rate of particles being depleted in bin ( s , l , t ) due to liquid addition is given in a similar vein as follows:
N l , s p r a y , d e p ( s , l , t ) = v ˙ s p r a y ( v l ( l + 1 ) - v l ( l ) ) × N ( s , l , t - 1 ) v s ( s ) v s N ( t - 1 ) ,
where particles are moving from bin ( s , l ) to bin ( s , l + 1 ) due to liquid addition. The net rate of particles being formed due to liquid evaporation from the bin ( s , l ) can be described as follows:
N l , e v a p ( s , l , t ) = N l , e v a p , f o r m ( s , l , t ) - N l , e v a p , d e p ( s , l , t ) ,
where N l , e v a p , f o r m is the rate of particles formed in bin ( s , l ) and N l , e v a p , d e p is the rate of particles lost from bin ( s , l ) at time t due to the liquid being evaporated from convective heat transfer from the surrounding air in the granulator. The rate of particles being formed in bin ( s , l , t ) due to liquid evaporation is given as follows:
N l , e v a p , f o r m ( s , l , t ) = m ˙ e v a p ( s , l + 1 ) ρ ( s , l + 1 ) × N ( s , l + 1 , t - 1 ) ( v l ( l + 1 ) - v l ( l ) ) ,
where the particles are being formed in bin ( s , l ) due to liquid evaporation from bin ( s , l + 1 ) . Here, m ˙ e v a p ( s , l + 1 ) is the evaporation rate of liquid from one particle of bin ( s , l + 1 ) . The rate of particles being formed in bin ( s , l , t ) due to liquid evaporation is given as follows:
N l , e v a p , d e p ( s , l , t ) = m ˙ e v a p ( s , l ) ρ ( s , l ) × N ( s , l , t - 1 ) ( v l ( l ) - v l ( l - 1 ) ) ,
where the particles are being depleted from bin ( s , l ) into the bin ( s , l - 1 ) due to liquid evaporation from bin ( s , l ) The bed evaporation rate ( m ˙ e v a p ) is calculated as [31]:
m ˙ e v a p = A w e t k ρ a i r ( x s a t - x o u t ) ,
where ρ a i r is the density of air, x s a t and x o u t are the saturation moisture content and moisture content of the air leaving the compartment, respectively. It is to be noted that, technically, the evaporation rate would be proportional to the difference between the saturated moisture content and the average moisture content in the air inside the fluid bed granulator. However, in this work, the outlet air moisture content has been assumed to be the same as the average moisture content inside the granulator. This is due to the lumped vessel approach used for modeling where the spatial variation of the granule and air properties have not been considered.
The saturated moisture content of the vapor in the air is calculated from the saturated pressure equation as follows:
x s a t = 0 . 621 1013325 - P s a t ,
where it has been assumed that the fluid bed granulator is operated at 1 atm pressure and P s a t is the saturated pressure of water vapor in Pascals at temperature T a i r . The saturated pressure of water vapor P s a t is given as a relation of the air temperature T a i r by Antoine’s relation as follows:
P s a t = e x p 21 . 8261 - 3130 . 7984 T a i r - 70 . 6573 .
The Sherwood Number S h of water in a fluidised bed is related to the Schmidt number S c and Reynolds number by the following relation given in [31]:
S h = 2 + 0 . 6 ( S c ) 1 / 3 ( R e ) 1 / 2 ,
where S c is the Schmidt number and R e is the Reynolds number. Furthermore, at low fluidization velocity, the Sherwood number can be assumed to be 2 in value. The Sherwood number is physically defined as the ratio of convective mass transfer rate to the diffusive mass transfer rate. It is given in the following expression:
S h = d i a p k D w a t e r ,
where d i a p is the characteristic length for diffusion i.e., the diameter of a particle in the fluidized bed, k is the drying coefficient of water and D w a t e r is the diffusion of coefficient of water. Therefore, the coefficient of mass transfer of the moisture from the particle to the surrounding air due to diffusion is given from the above expressions as:
k ( s , l ) = 2 D w a t e r d i a p ( s , l ) .
D w a t e r is the diffusivity of water and d i a p the particle diameter of the corresponding bin ( s , l ) .

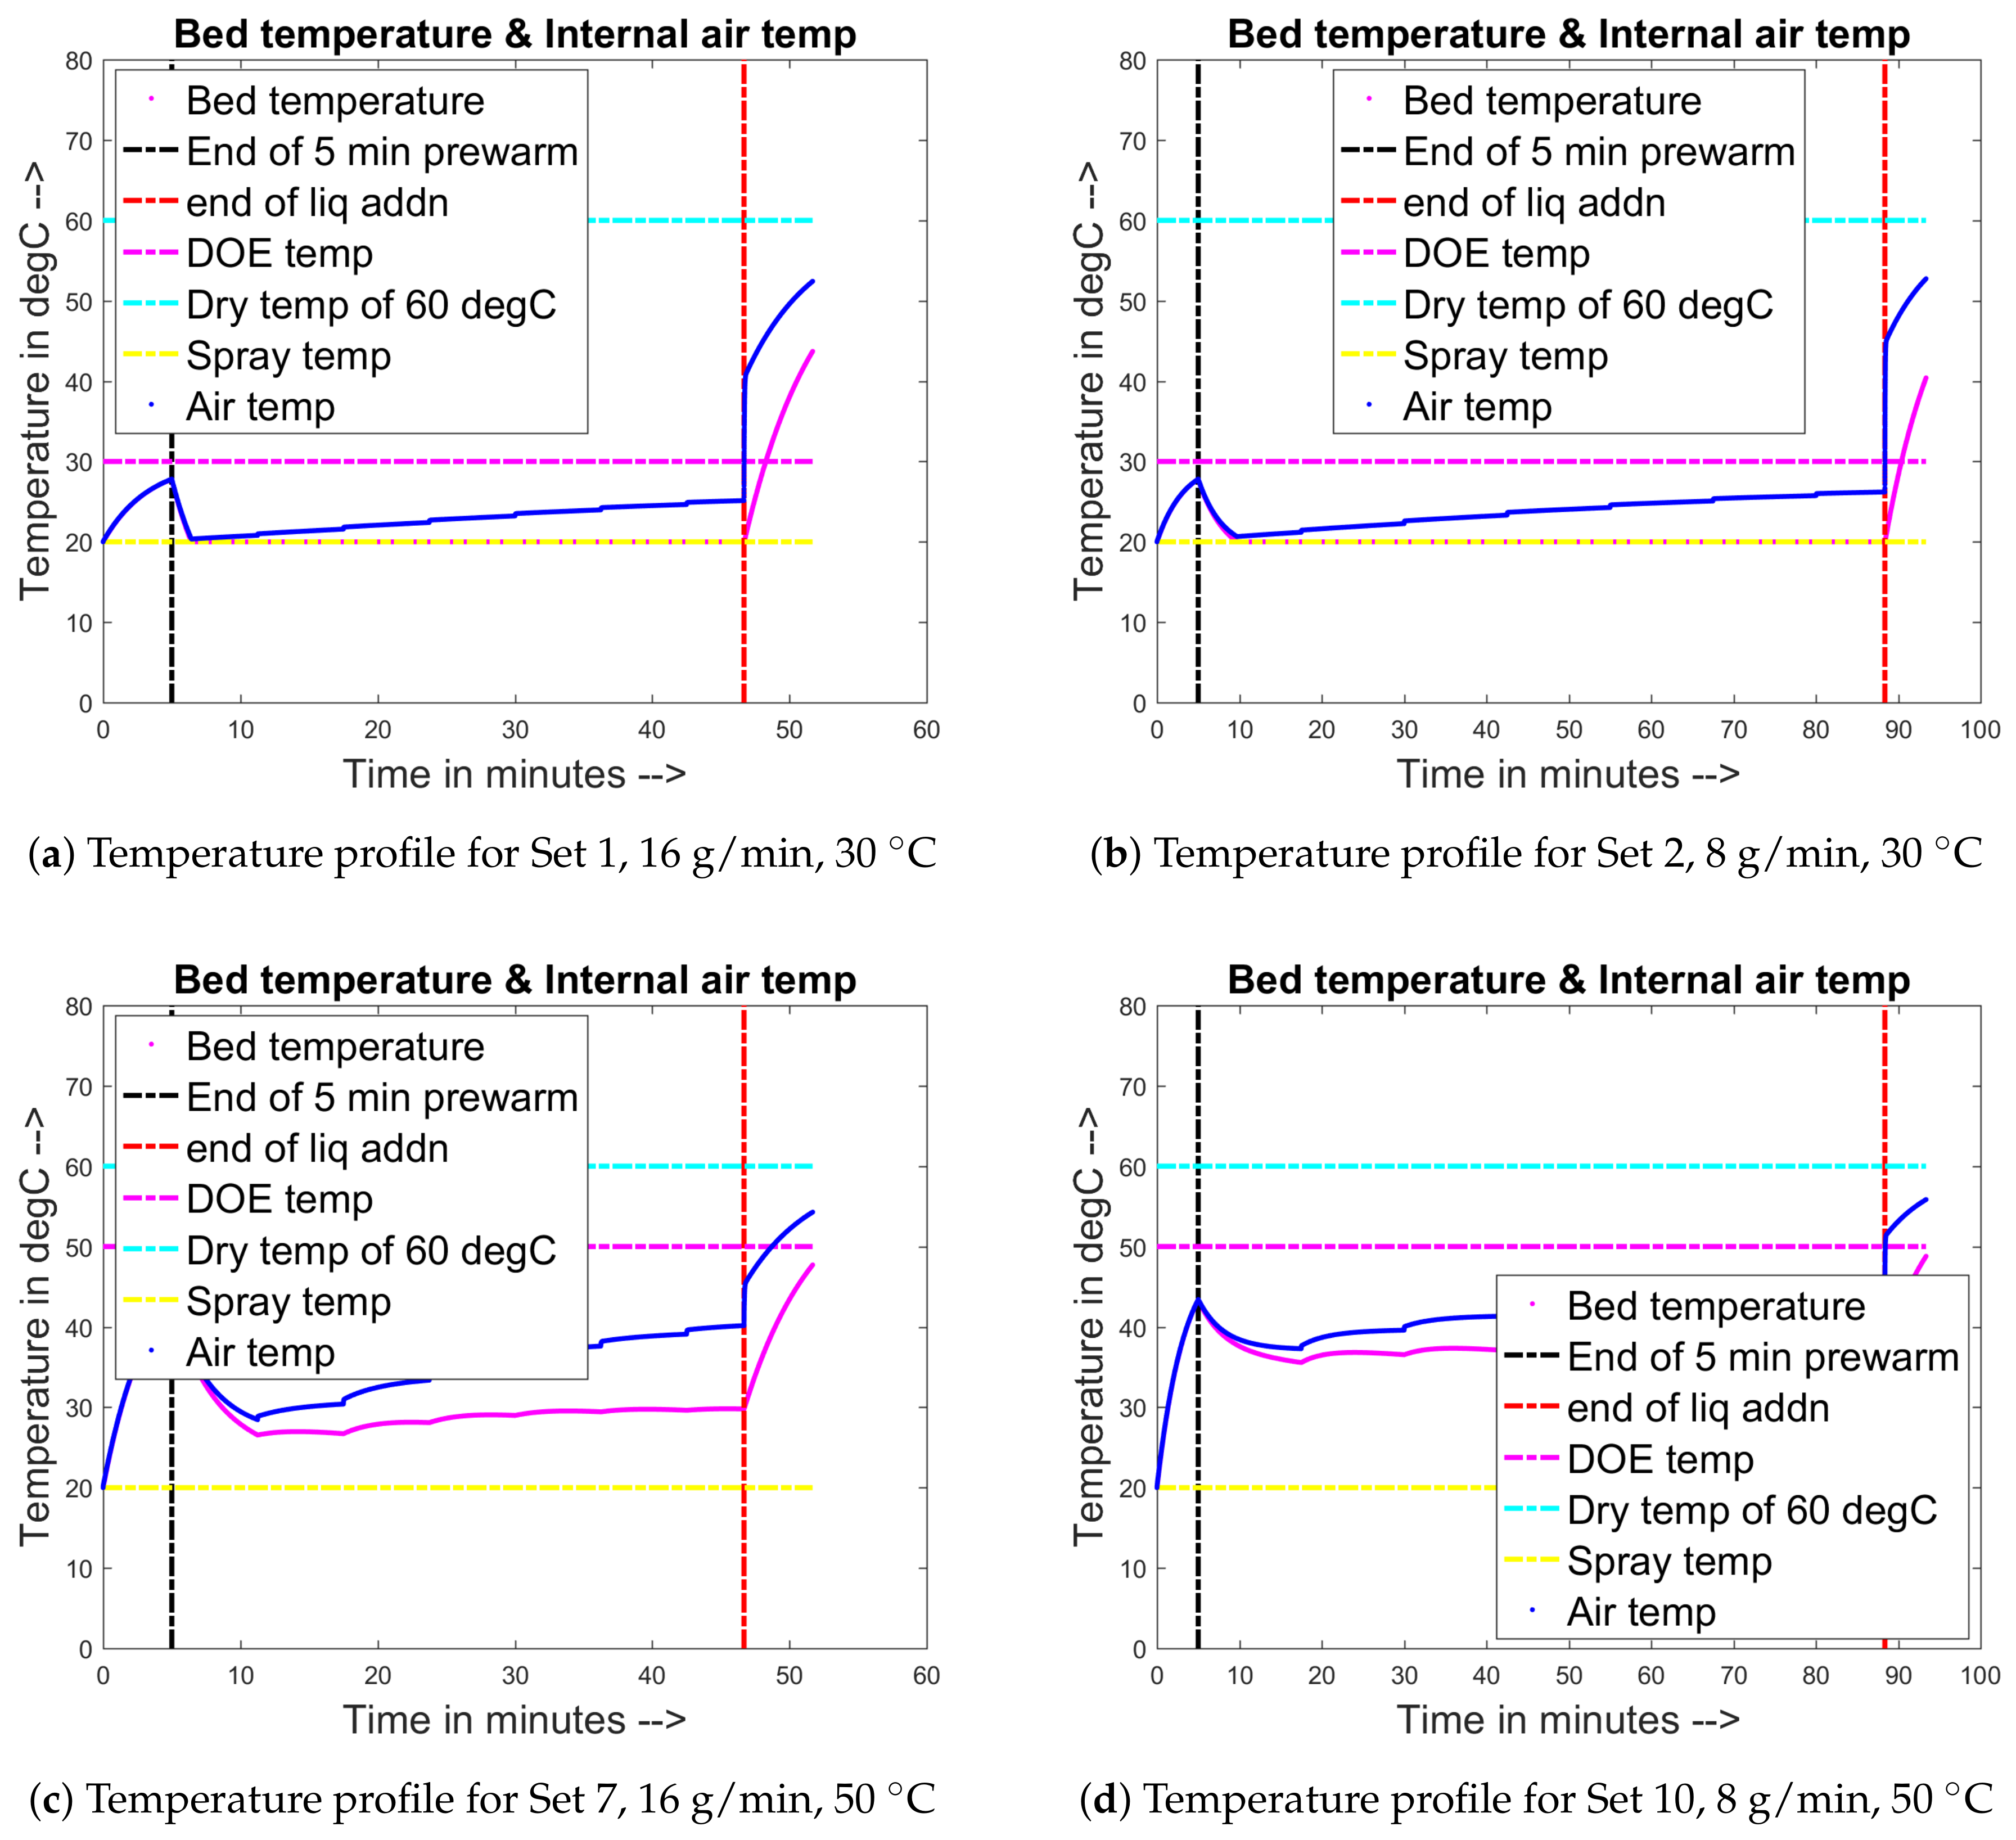
3.6. Integration of Heat Balance and Liquid Evaporation Due to the Heating of Particle Bed

The heat and liquid evaporation model coupled with population balance model helps in tracking the variation in bed temperature and outlet air temperature in the fluid bed granulation. This model is developed by considering the energy balance of bed along with the energy balance of the system air inside the granulator. In order to estimate drying or evaporation rates under different temperature and relative humidty conditions, the concept of “drying coefficient” is applied [32]. This model predicts the bed temperature, air outlet temperature and air outlet moisture content as a function of time in the fluid bed granulator. The equations were developed by using the film model as used in [14,25,33]. The rate of heat transfer from the bed to the spray liquid due to the cooling effect of the binder Q s p r a y is given as:
Q s p r a y = m ˙ s p r a y C p , l i q u i d ( T s p r a y - T b e d ) ,
where C p , l i q u i d is the heat capacity of the binder spray liquid and ( T s p r a y - T b e d ) is the difference in temperature between the binder spray liquid and the particles, respectively. The temperature of the inlet spray liquid T s p r a y is a given input parameter constant at 25 C (298 K). The heat lost due to cooling by the binder spray liquid is included subsequently in the modeling of particle bed temperature in Equation (36). The expression for the heat transferred from the surrounding air inside the granulator to the bed of particles is given as follows:
Q t = h A b e d ( T a i r - T b e d ) ,
where A b e d is the total external surface area of all the particles in the bed, T a i r is the temperature of the air inside the granulator and h is the convective heat transfer coefficient. The convective heat transfer is calculated from the diffusive bulk heat transfer coefficient in a manner similar to the mass transfer coefficient.The expression for the same is given as follows:
h = 2 k t N ( s , l , t ) . × d i a p ( s , l ) 2 N ( s , l , t ) . × d i a p ( s , l ) 3 ,
where 2 k t is the heat transfer conductivity of moisture in air. The conductivity is described as a function of the air moisture content x a i r :
k t = 0 . 0243 x a i r 273 . 2 .
The total mass balance equation of the dry part of the air in the fluid bed granulator can be expressed as:
d M a i r , d r y d t = m ˙ a i r , d r y [ ( 1 - x i n ) - ( 1 - x a i r ) ] - a l l s a l l l d N d t - N l , e v a p ρ a i r ( 1 - x a i r ) ,
where m ˙ a i r , d r y is the mass flow rate of the air flowing through the granulator, and ρ a i r is the density of the air at the temperature T a i r . x i n is the moisture content of the inlet air and x a i r is the moisture content of the air inside the granulator and the outlet air. Here, the moisture content of the air inside the system is equivalent to the moisture content of the air flowing out owing to the lumped system approach applied in the energy balance equations. The mass balance expression for the total water vapor present in the air inside the granulator is given similarly as:
d M a i r , w e t d t = m ˙ a i r , w e t [ x i n - x a i r ] - a l l s a l l l d N d t - N l , e v a p ρ a i r x A i r + M e v a p .
Here, the term M e v a p is the total evaporation rate of the moisture from the bed that is obtained by summing the product of evaporation rate m e v a p and the number of particles in the corresponding bins N over all the bins. The expression for the density of air ρ a i r is given from the ideal gas approximation as:
ρ a i r = ( 101 . 325 × 28 . 96 ) 8 . 314 × T a i r .
The total energy balance equation of the air in the fluid bed granulator can be expressed as:
d T a i r d t = m ˙ a i r ( C p , a i r ( ( 1 - x i n ) T i n - ( 1 - x a i r ) T a i r ) ) - Q t ( M a i r , d r y C p , a i r + M a i r , w e t C p , w a t e r v a p ) - d M a i r , d r y d t C p , a i r + d M a i r , w e t d t C p , w a t e r v a p × T a i r M a i r , d r y C p , a i r + M a i r , w e t C p , w a t e r v a p ,
where C p , a i r is the heat capacity of the solid components in the particle bed and C p , w a t e r v a p is the heat capacity of water vapor in the system. The total energy balance equation for the particle bed of the fluidized granulation system is as follows:
d T b e d d t = Q t + Q s p r a y - M e v a p λ v a p m p a r t i c l e , d r y N C p , s o l i d + m p a r t i c l e , w e t N C p , w a t e r - d N d t m p a r t i c l e , d r y C p , s o l i d + d N d t m p a r t i c l e , w e t C p , w a t e r × T b e d m p a r t i c l e , d r y N C p , s o l i d + m p a r t i c l e , w e t N C p , w a t e r ,
where λ v a p is the latent heat of vaporization of water, C p , s o l i d is the heat capacity of the solid components in the particle bed and C p , l i q u i d is the heat capacity of the liquid water.

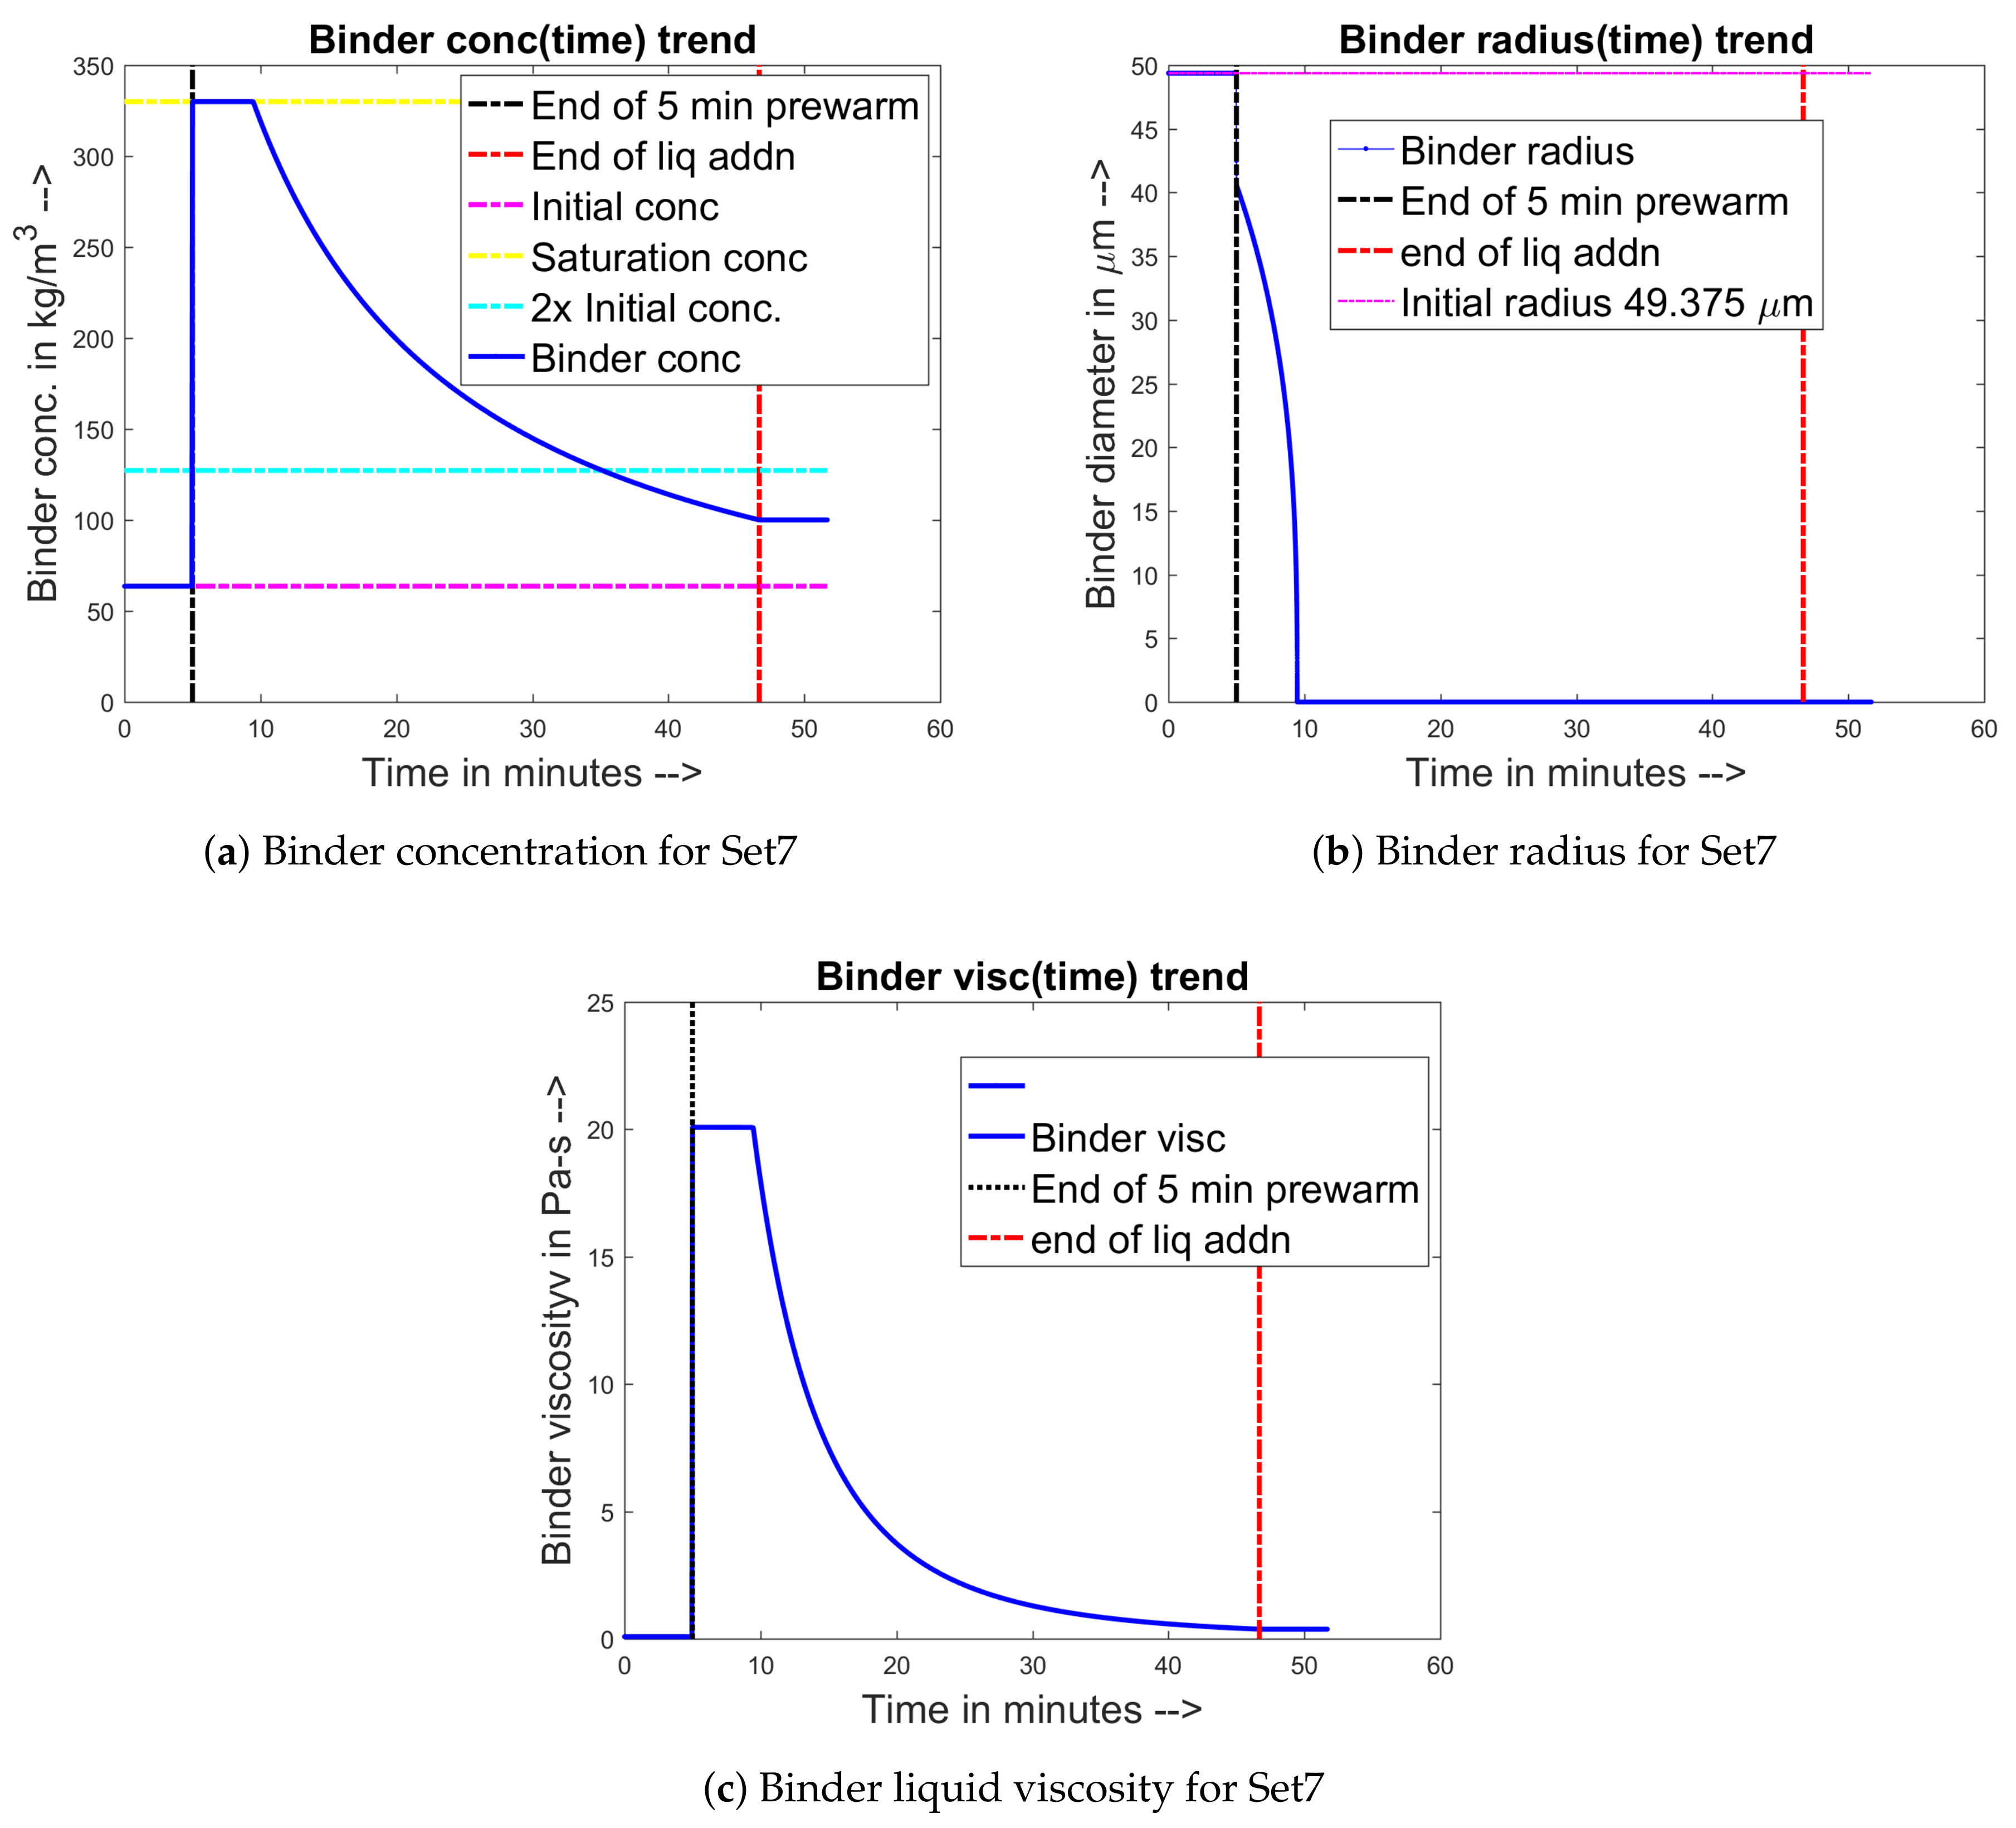
3.7. Binder Dissolution Module

The dissolution model for the dry binder particles in liquid solvent was developed according to the work published in [29,34]. The expression for the change in radius of the binder due to dissolution is given as follows:
d R a d b i n d e r d t = - D H P C ρ H P C ( C s a t , H P C - C b u l k , H P C ) 1 y b i n d e r + 1 R a d b i n d e r ,
where R a d b i n d e r is the radius of the binder, D H P C is the diffusion coefficient of the binder component HPC in water, ρ H P C is the density of the HPC binder, C s a t , H P C is the maximum possible concentration of the HPC binder in the liquid solvent under saturation conditions, C b u l k , H P C is the current concentration of the HPC binder in the liquid solvent and y b i n d e r is the diffusion layer thickness for the HPC binder.
As the system experimented upon and modeled contains half of the binder dissolved in the liquid solvent prior to granulation, the expression for the bulk concentration of the binder is therefore formulated as:
C b u l k , H P C = 0 . 5 × m H P C , i n i t i a l + ρ H P C N H P C 4 3 π ( R a d b i n d e r , 0 3 - R a d b i n d e r 3 ) L i q u i d t o t a l ,
where m H P C , i n i t i a l is the initial mass of HPC binder in the granular bed, N H P C is the estimated number of binder particles, R a d b i n d e r , 0 is the initial radius of the binder particles and L i q u i d t o t a l is the total amount of liquid present in the system at a particular instance.

3.8. Numerical Techniques

While the aggregation and liquid phenomena happen during liquid addition and wet granulation, the growth rate of the mass of particles is linear as the liquid was sprayed at a constant linear rate during the experimental conditions. However, as mentioned in Section 3.1, the grid of particle sizes used for developing the PBM is exponential in nature. Therefore, the number of particles was allocated in the appropriate grid locations, and the cell average technique as developed in [35] was employed where lever rule techniques are used to distribute particles in nearest grid locations by linear interpolations.
Since the various equations formulated in the model for emulating the system consist of differential equations, an appropriate discretization technique must be utilized in order to solve them over time given the initial conditions. Therefore, the solution comes down to an initial-value problem of a few coupled differential equations. The differential equations were discretized using Euler’s first order finite forward difference method where the value of the unknown property at a subsequent time-step is given by the value at the present time-step, the rate expression governing the property and the time-step chosen.
The issue arising during development of the numerical solution of the coupled differential equations over the process time is the value of the time-step chosen for the simulations. An adaptive time-step method was chosen where the time-step or interval of discretization is computed according to the CFL (Courant-Fredrichs-Lewis) condition. The time-step chosen was such that the interval was small enough to come well within the bounds of the CFL conditions for all the differential equations involved in the computation.

4. Results and Discussion

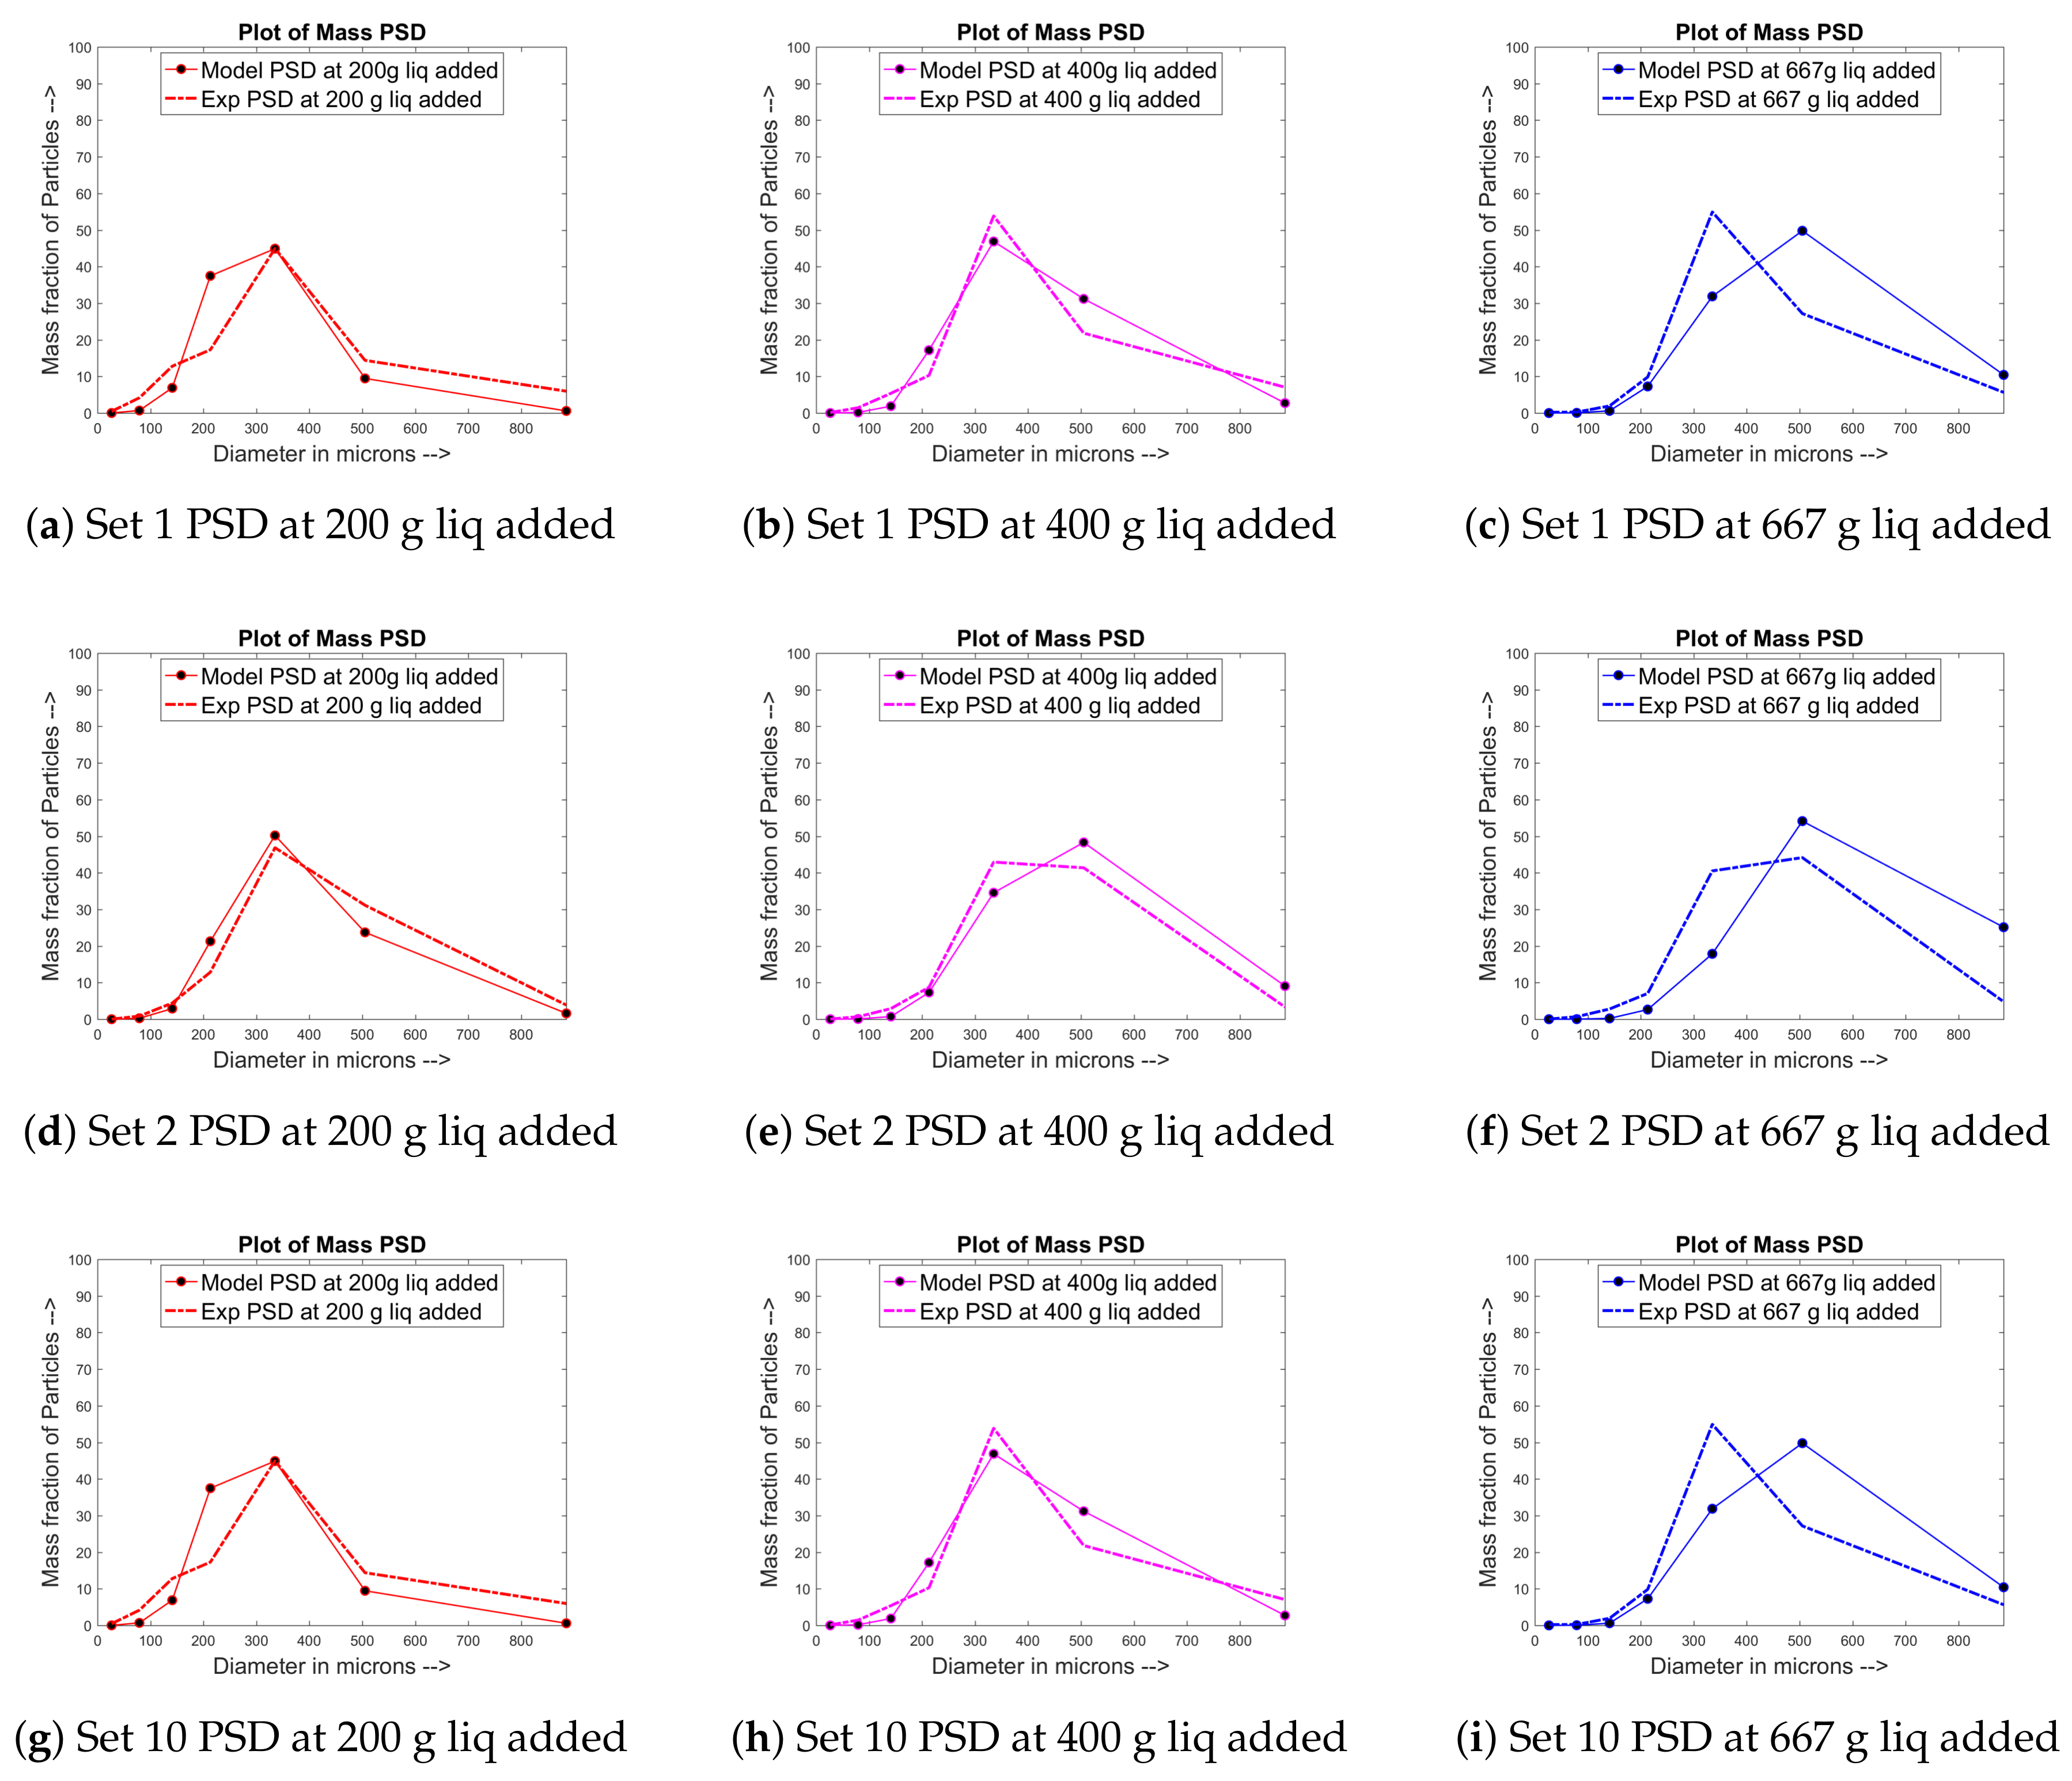
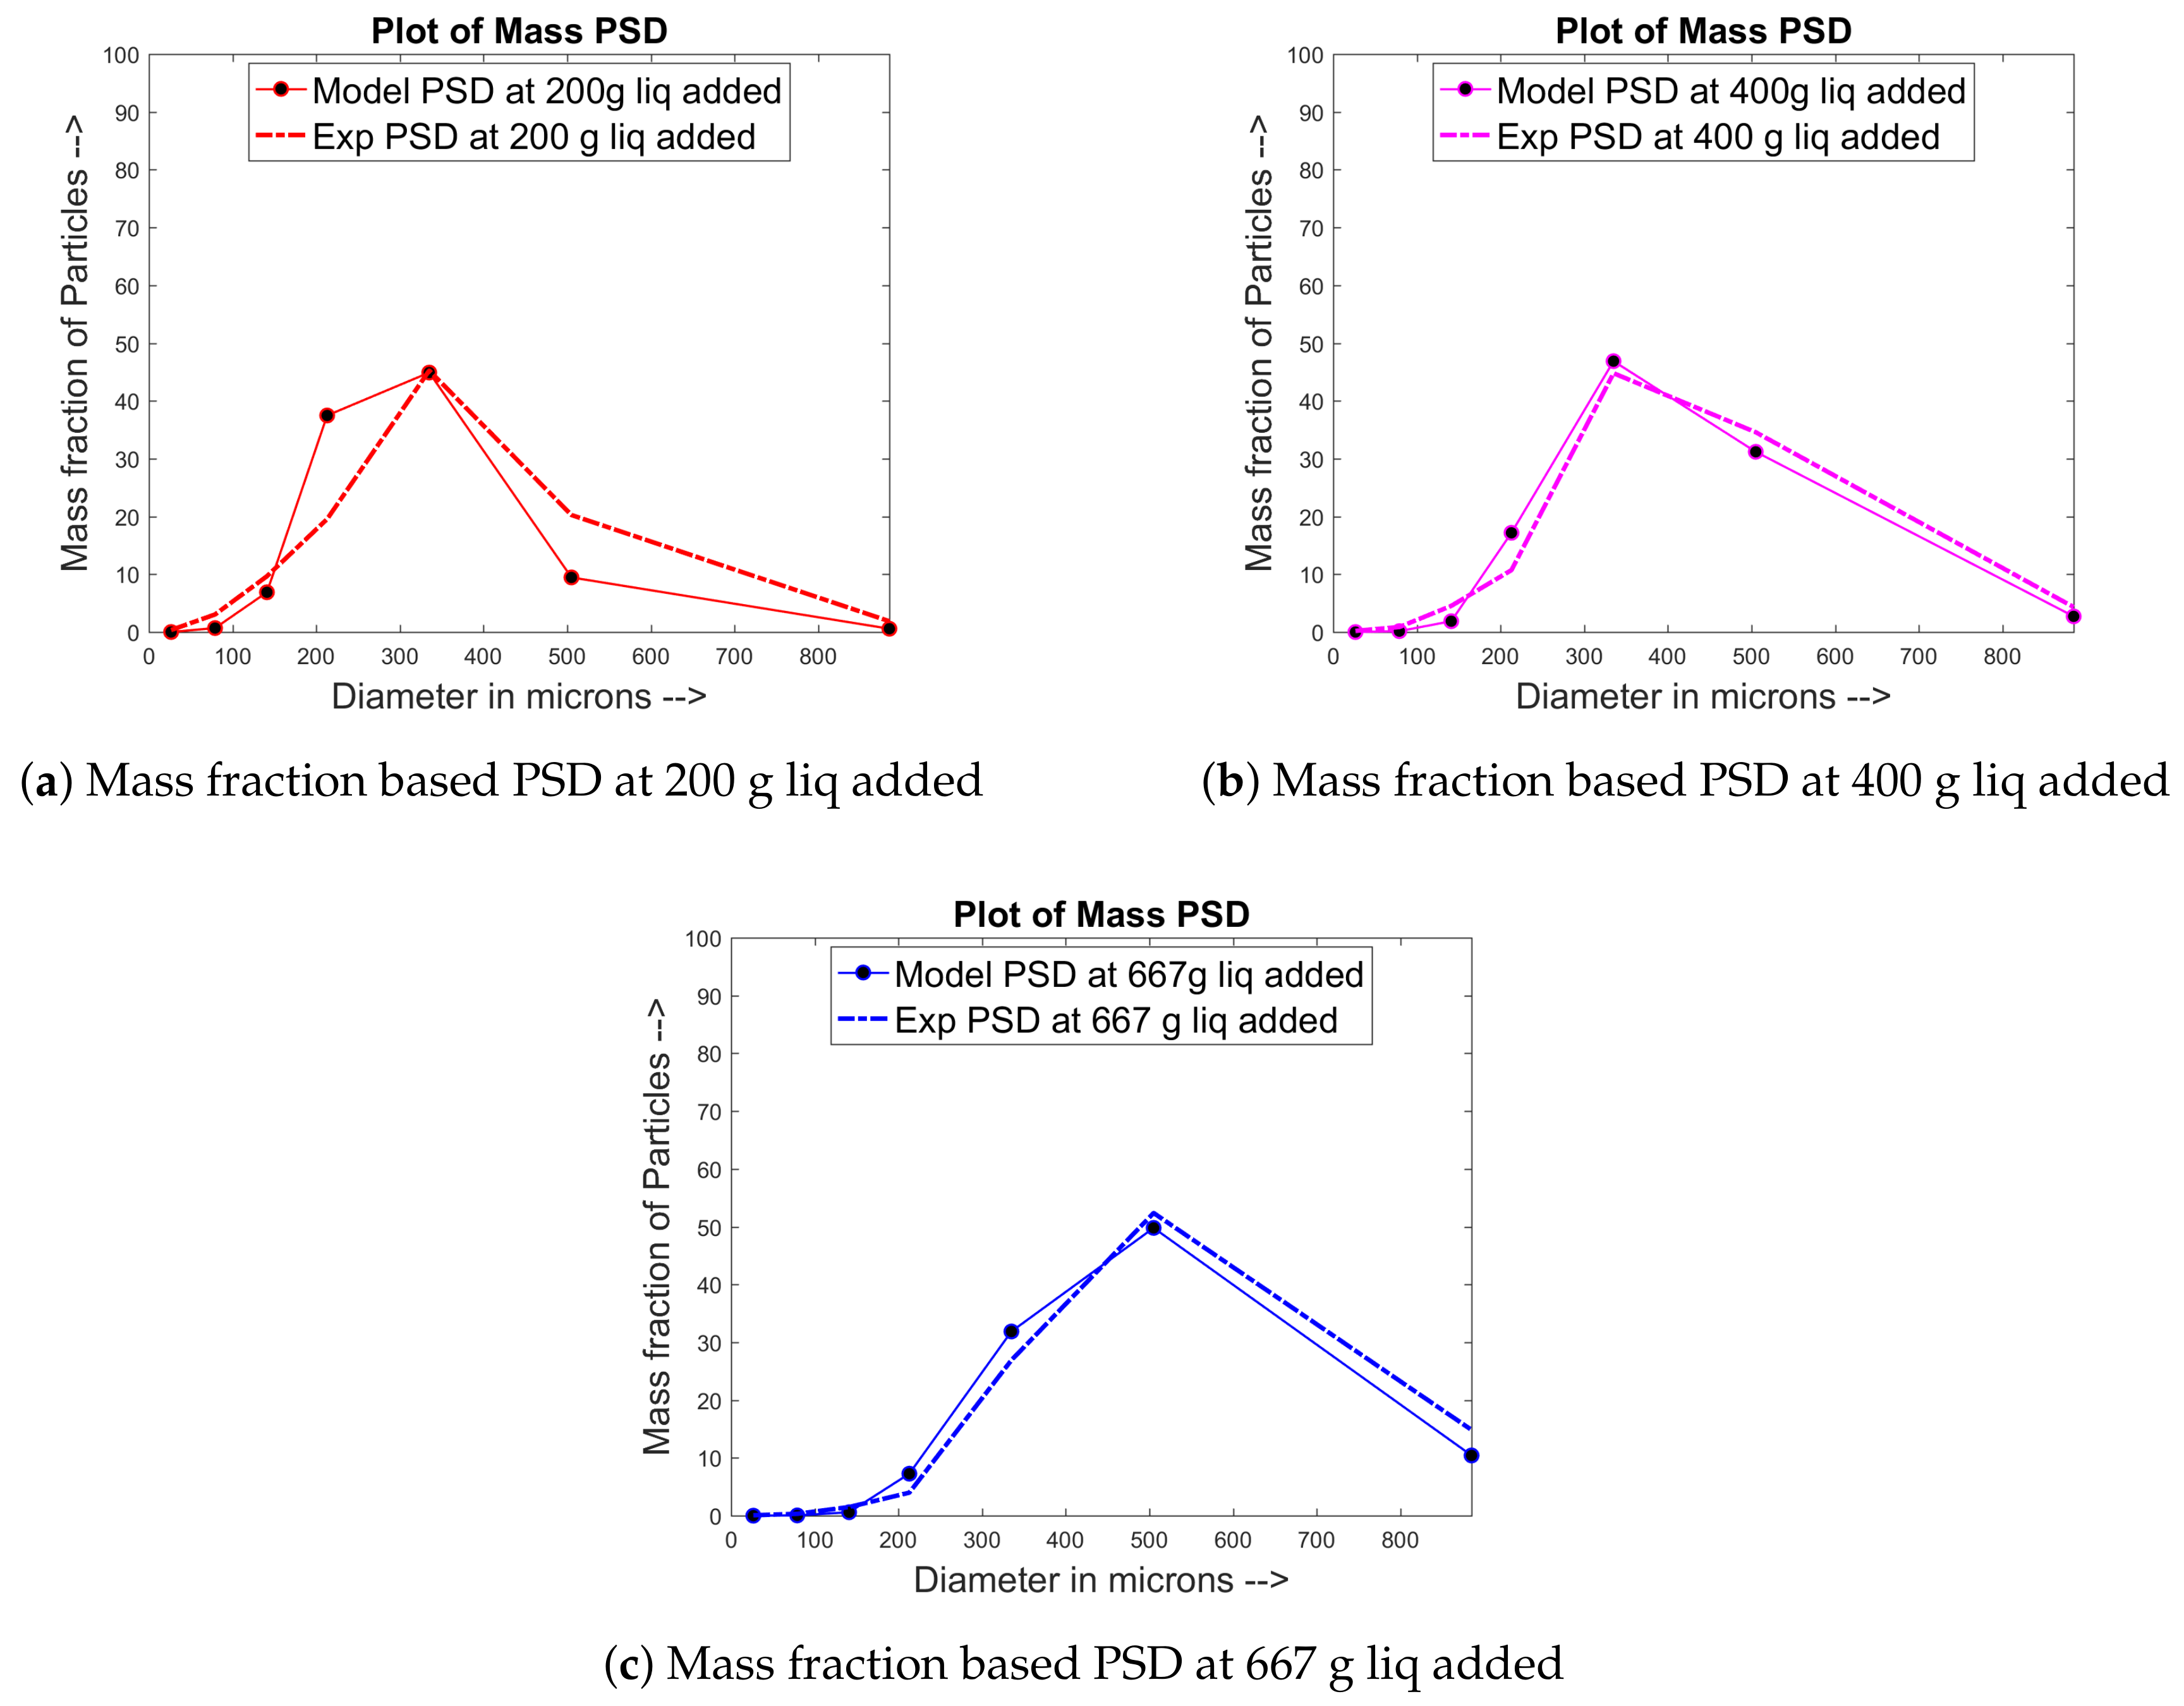
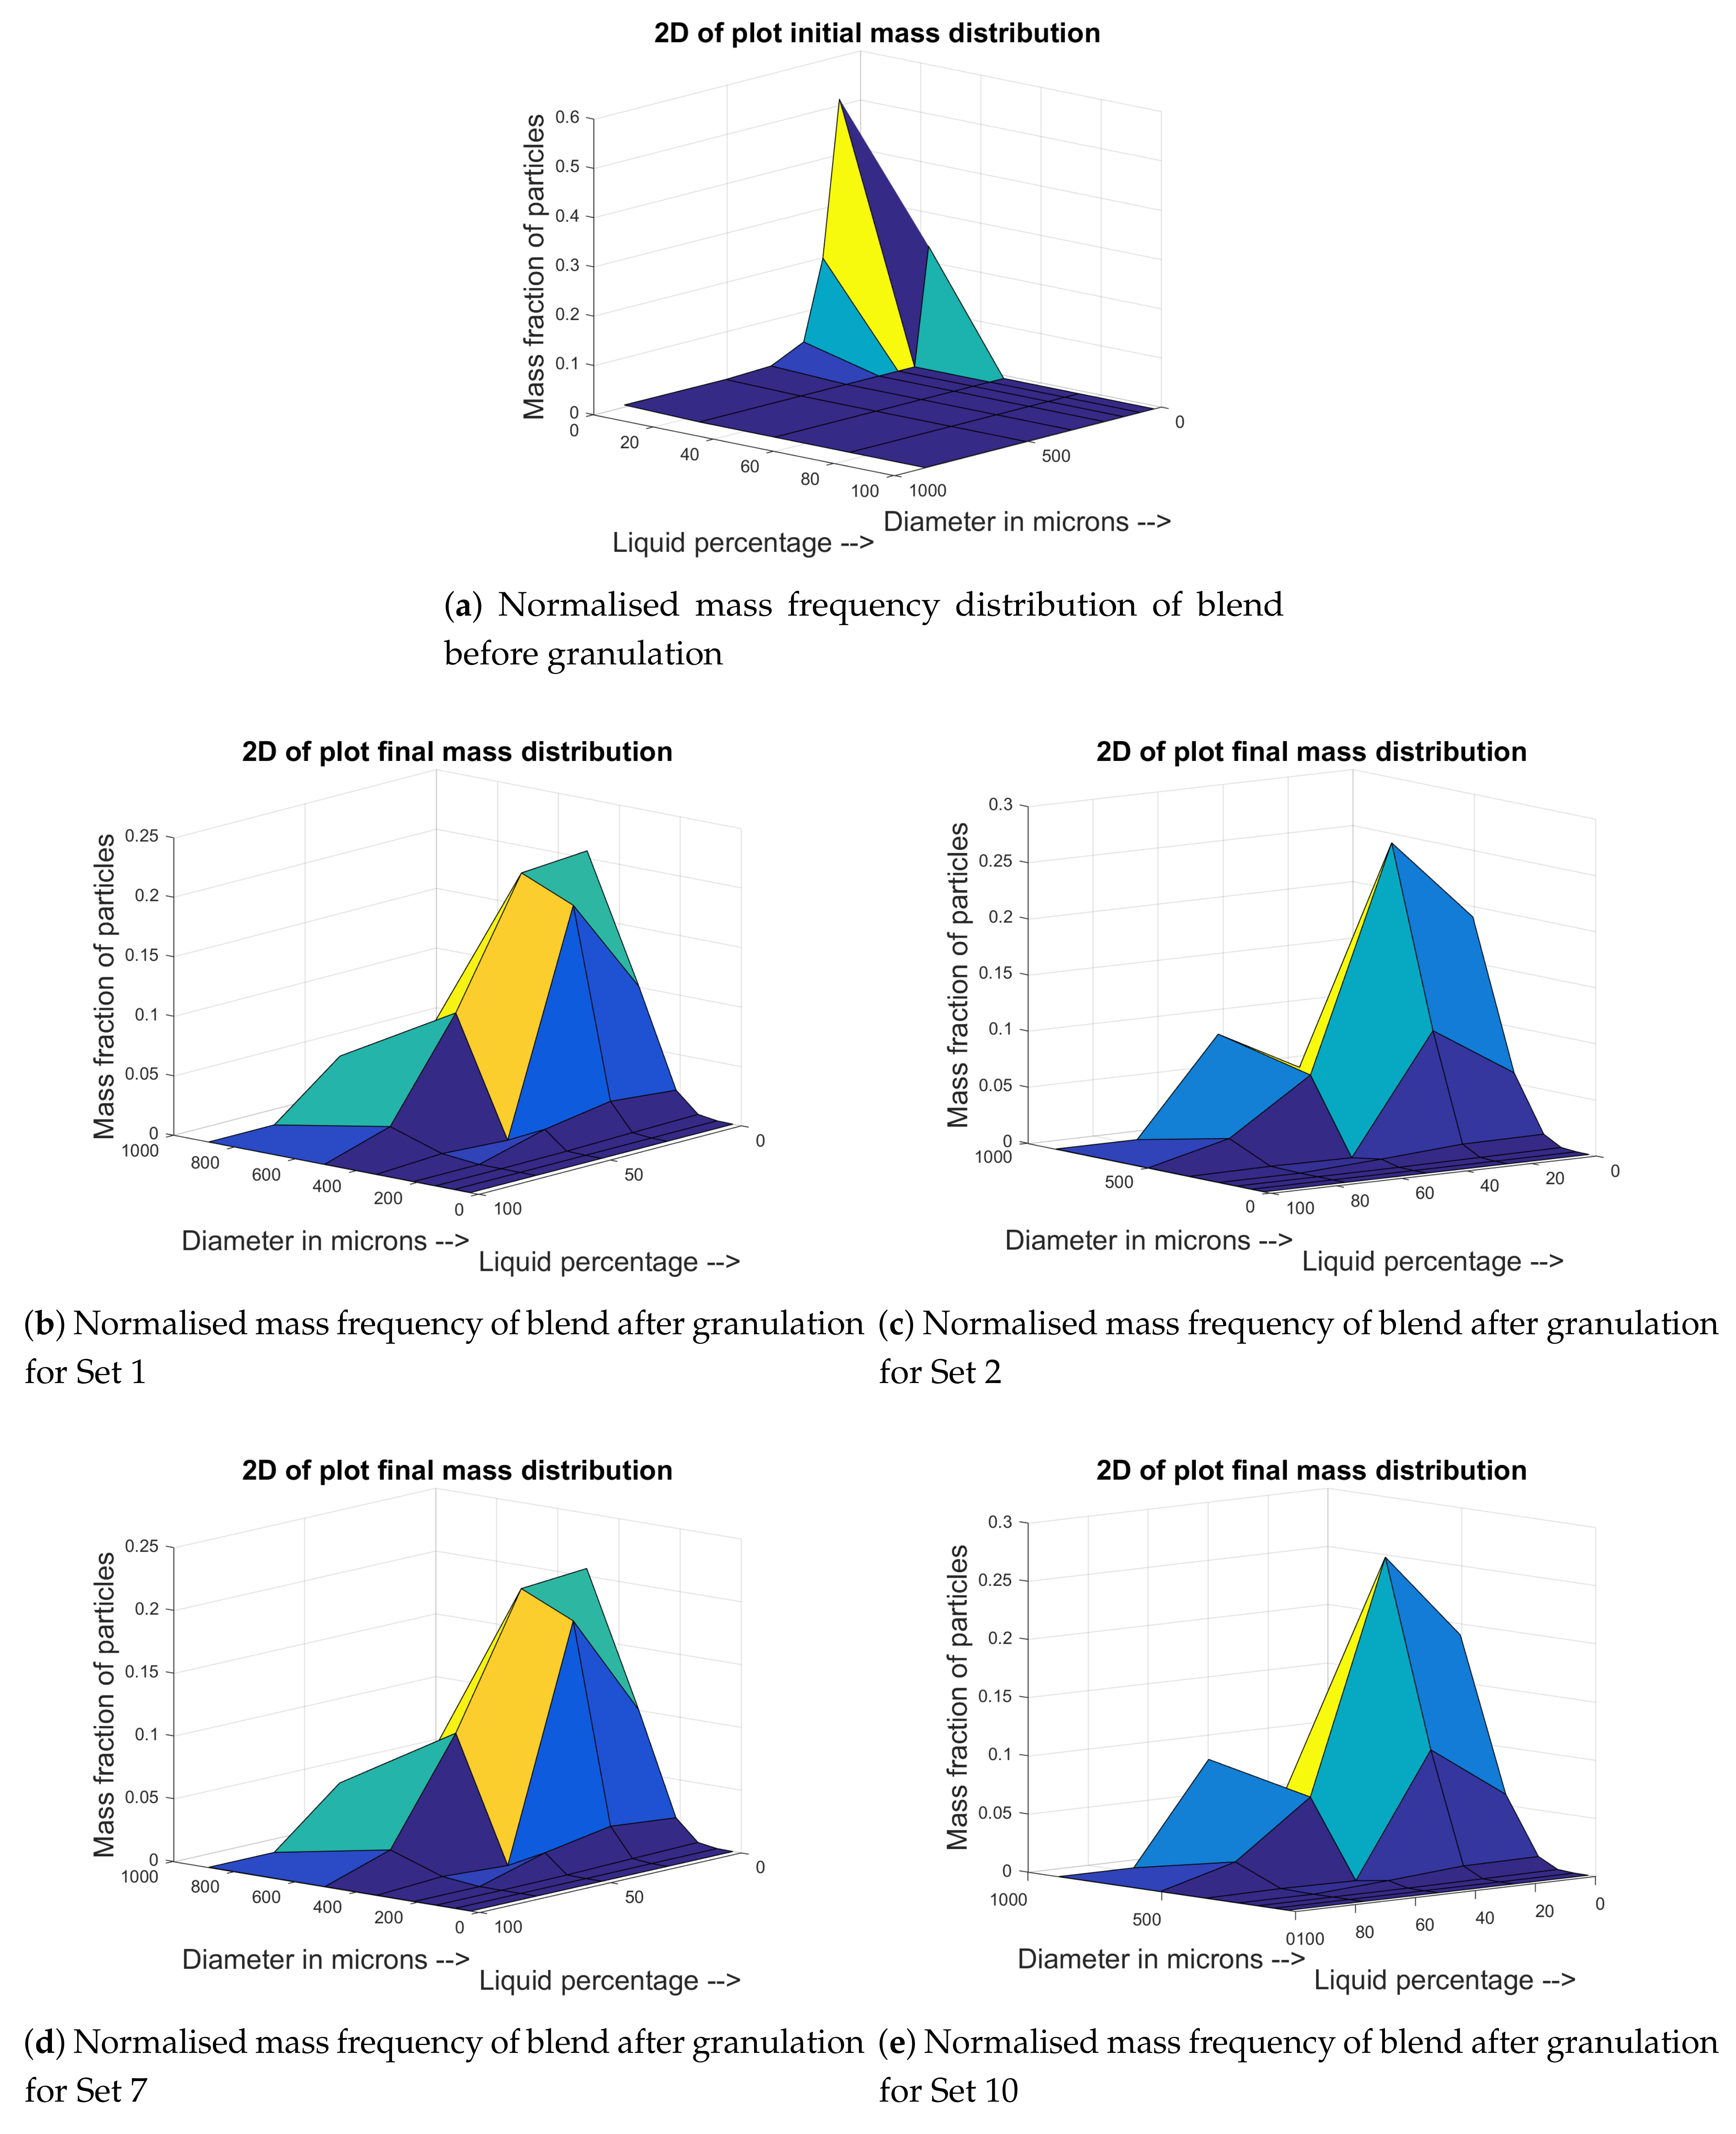
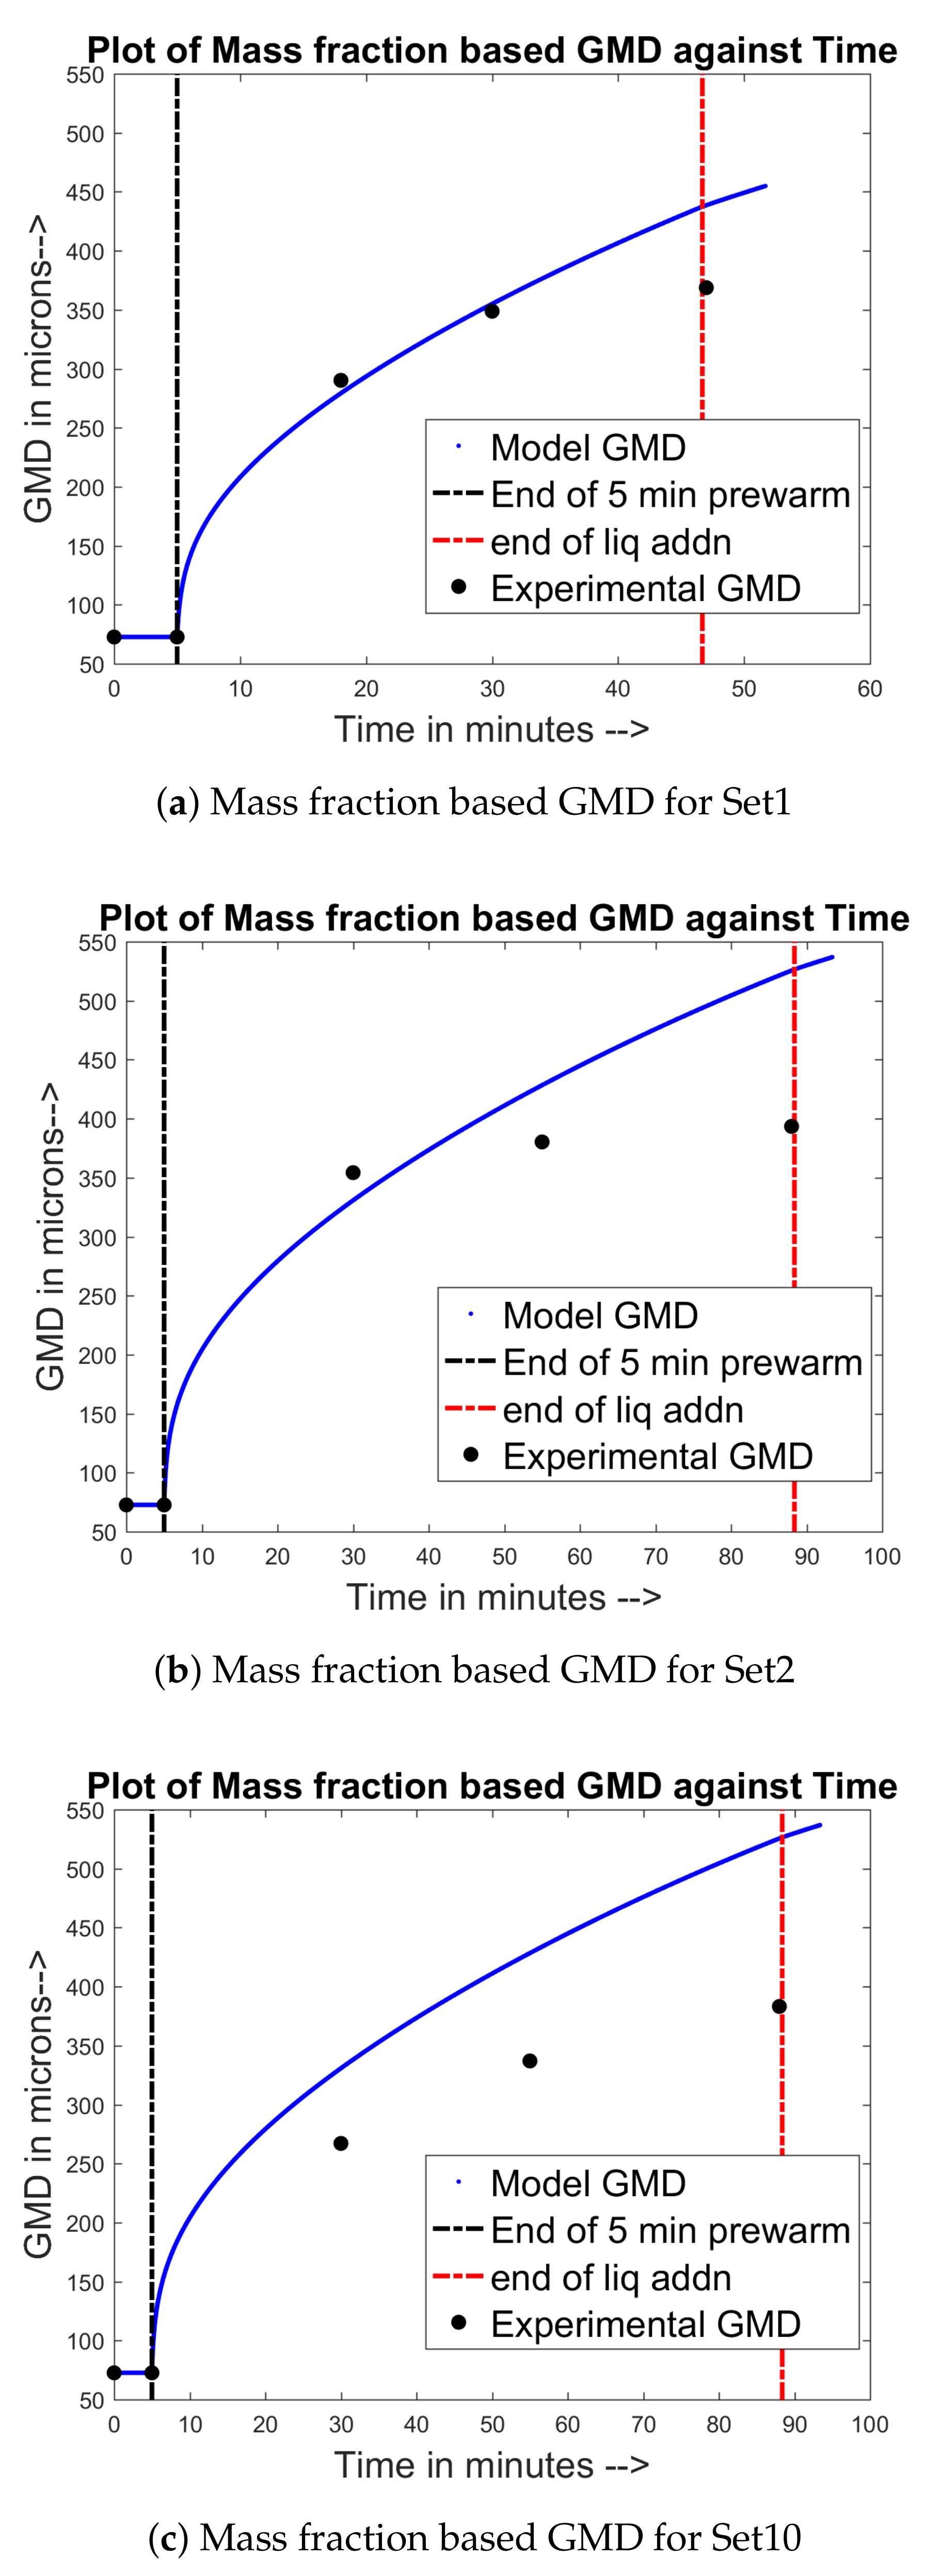
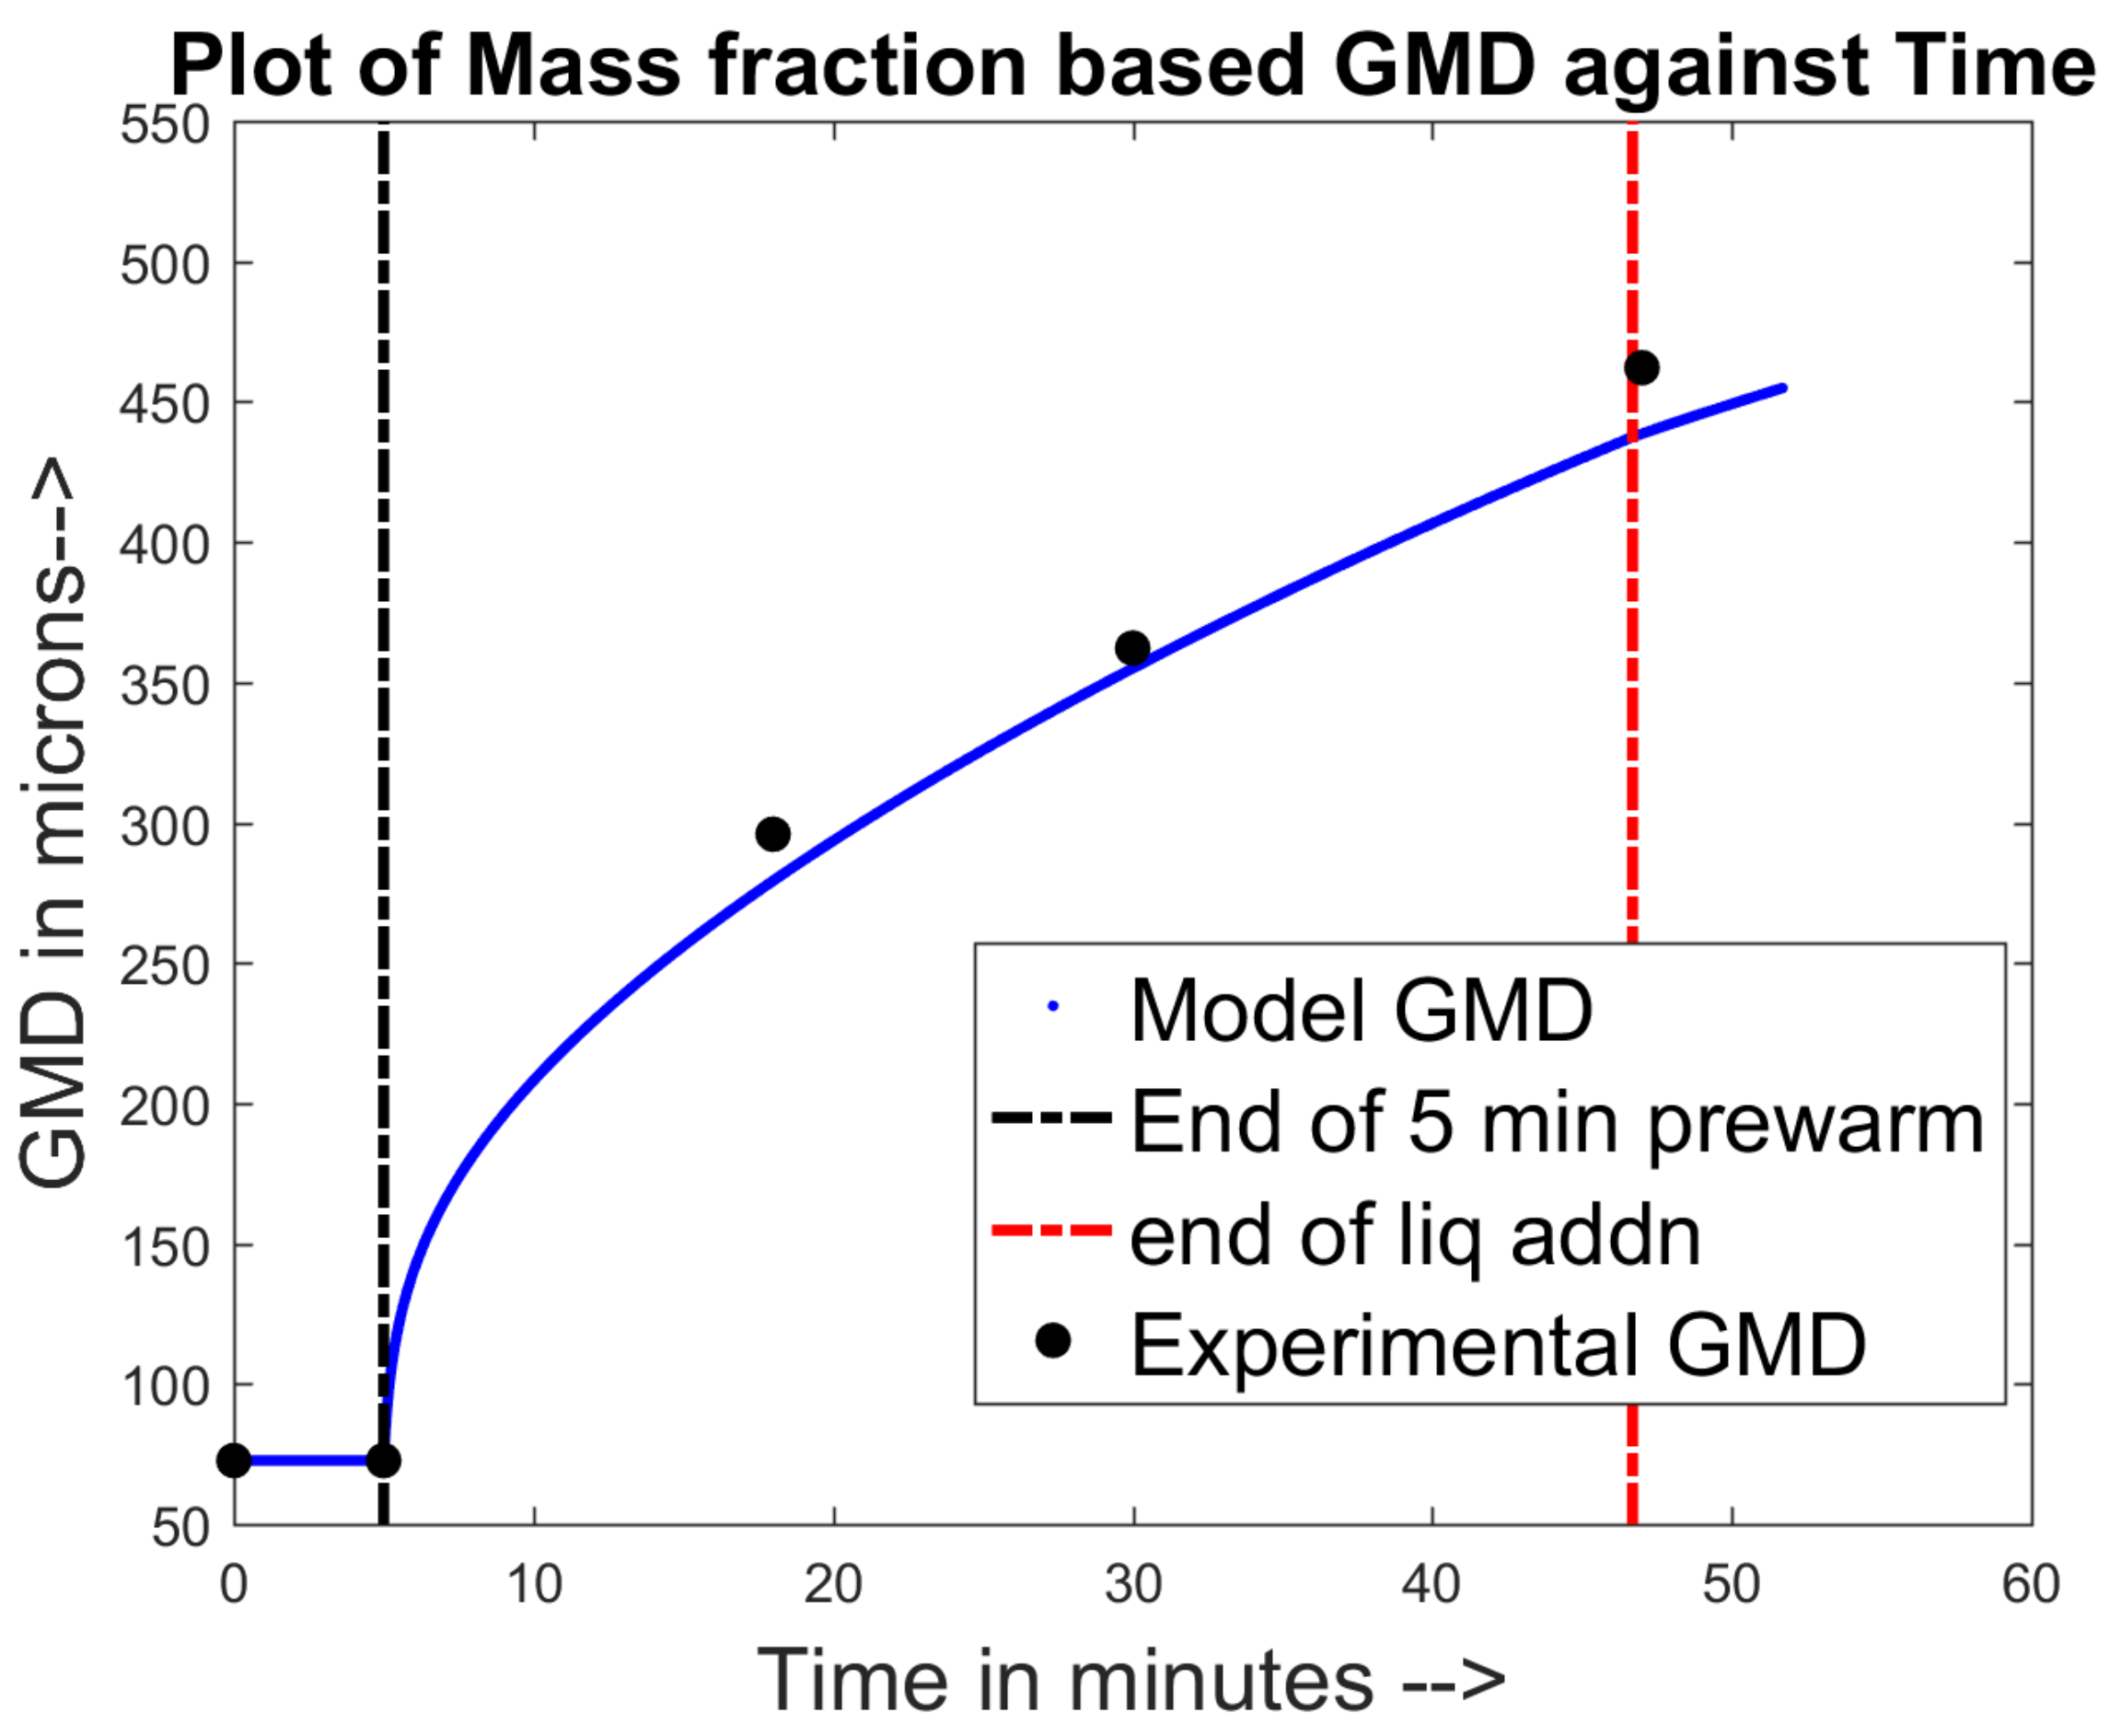
4.1. Training and Validation of the Model to Experimental Data

The experimental runs simulated are No. 1, 2 and 10 for training the model to the data and consequently arrive at the optimal parameters for the aggregation kernel constant β o , the coefficient of restitution for binary collision of particles e r e s t and the contact angle θ . The values of the various constants and parameters used in the integrated model have been given below in Table 5.
The model PSD and GMD results have been compared against their experimental counterparts for the aforementioned cases.
The prediction of the PSDs against the corresponding experimental values have been shown in Figure 1. During experimentation, the granules were sampled at 200 g (red curves), 400 g (pink curves) and 667 g (blue curves) of liquid added. The granules were sieved and the mass fraction based PSDs were obtained accordingly.
It is seen from the figures that the mass fraction of material in larger bins were overpredicted in the model when compared to the experimental data. However, the PSD trends were closer to the experimentally reported values in the validation Set 7 (see Figure 2) for the same tunable model parameters. This leads us to infer that the overprediction in the training experimental data (Set 1, 2 and 10) may plausibly be due to under-measurement of the experimental PSD data given by the authors in [28]. However, it must be noted that all four of these sets were run only once without any duplicates/triplicates by the authors responsible for the generation of experimental data in Pandey et al. [28].
The previously shown distributions were one-dimensional distributions where the evolution of particle size trends were shown with respect to their sizes at various points of liquid addition. Another interesting approach to look at these results would be to classify them both with particle size and liquid content. The charts in Figure 3 showcase the same for the readers’ interest.
From Figure 3a,b, it can be that less particles are formed containing higher liquid mass content. This may probably have been due to the higher spray rate of the granulation liquid as the particles received more liquid coming onto them each time.
On the other hand, the particle mass frequency in the lower spray rate conditions were higher in the lower liquid content regions. Therefore, we observe from these figures that one must ideally aim for lower liquid spray rates to have lower liquid content at the end of granulation.
The simulated GMDs were also compared against their model counterparts and have been shown in the Figure 4 and Figure 5.
From Figure 4a,b, one can see that the model predicted the growth trend fairly well until the point where 400 g of liquid had been added. However, beyond this point, the model results were more than the data obtained experimentally. It should be noted that only experimental points at 667 g liquid added were available to compare the difference. It might be plausible that they were erroneous points/outlier points in their respective data sets. However, the model overpredicted the experimental GMD at even the point when just 200 g liquid was added. From Figure 5, it was seen that the model predicted the trends for Set 7 fairly well. The explanation for the same is beyond the scope of this work.
Similar results were obtained when the training and validation sets were mixed and matched. Therefore, the estimated values for the empirical aggregation rate constant, coefficient of restitution and contact angle were accepted to be true for the purpose of this work and were used for further simulation studies. This was done in order to predict the system behavior at points in the expanded DOE. The estimation was carried out by minimizing the sum of the relative errors between the experimental and model predicted PSD values at all the sieve sizes for 200 g liquid added, 400 g liquid added and 667 g liquid added time points. This was carried out in MATLAB (R2016b, Mathworks, Inc., Natick, MA, USA) using the inbuilt f m i n s e a r c h function.
The overall minimisng objective function can be written as follows in Equation (39):
S S R E = 200 g l i q a d d e d 667 g l i q a d d e d a l l s i e v e s M a s s f r a c e x p - M a s s f r a c m o d e l M a s s f r a c e x p 2 .
The veracity of the model results has been tested by computing the ratio of rate of formation of particles due to aggregation to the rate of depletion of particles due to aggregation. Theoretically, the ratio should always be ‘0.5’ because the aggregation of particles was modelled to be due to binary collisions between combination pairs. It is described as follows in Equation (40):
R a t i o = a g g f o r m ( s , l , t ) a g g d e p ( s , l , t ) .
From Figure 6a, it can be seen that the range of values on the y-axis is very small. This is indicative of the fact that the developed model was correct for the working precision of the MATLAB software and that the aggregation mechanism is computed properly throughout the iterative steps despite being closely integrated with the heat and mass balance of the moisture content and the binder dissolution mechanics. Along with the ratio, the total amount of liquid added over time to the system is an indication that the rate processes are being calculated correctly over every time step (see Figure 6b).

4.2. Prediction of Other Data for the Experimental Sets

The simulated bed temperatures for the four experimental sets have been recorded and shown as follows in Figure 7.
It can be seen from the temperature plots in Figure 7 that the inlet temperature of the air (shown in the charts as cyan colour and labelled as DOE temp.) and the binder liquid addition rate are most significant in determining the temperature profile of the particle bed over time. It can be seen that, during pre-warm stage, the temperature of the bed (solid pink curve) rises until it reaches closer to the inlet air temperature. Then, during liquid addition/granulation stage, the temperature initially falls approaching the temperature of the binder liquid spray. The temperature rises whenever the airflow rate is increased due to increased heat transferred from the air to the bed of particles. It can be seen from Figure 7a,b that the rate of temperature decrease is the same when the temperature of the inlet air is 30 C. Moreover, the temperature of the bed doesn’t rise after reaching the spray temperature of 25 C in these experiments. This is because the heat provided by the inlet air is not sufficient to raise the temperature of the bed after negating the cooling effects of the binder spray liquid. It can be seen that, once the addition of binder spray liquid has stopped, the temperature of the bed increases until it reaches the inlet temperature of air during drying i.e., 60 C. From the the four charts in Figure 7, it can be seen that the predicted bed temperature for Set 10 (i.e., 8 g/min and 50 C ) was the highest. This may possibly be due to the combination of higher inlet air temperature during granulation and the lower binder addition rate that would lead to the bed particles losing lesser heat as the amount of liquid coming in an instant of time is too small to cause the bed temperature to fall/not rise.
The various charts in Figure 8 show the results obtained from the integrated binder dissolution models in the overall system PBM. It can be seen from Figure 8a that, during pre-warm stage of the granulation, the binder concentration remained constant. Upon addition of binder initially at 5 min, the binder concentration increased and reached its maximum value. This may possibly due to the initial rapid dissolution of the binder particles in the minimal amount of liquid that has been sprayed until this time. The binder concentration remained at the highest, saturated concentration for another 5 min during which all of the binder particles dissolved completely into the spraying liquid until they reached the theoretical minimum radius. The binder concentration started decreasing after the binder dissolution was over, during which only dilution of the liquid occurs due to the addition of further liquid into the system.

4.3. Prediction of Regimes That Lead to Good Granulation

The identification of optimal regimes for granulation were identified by running all of the one-hundred eighty-nine (189) cases in the extended DOE as described previously in Table 4. The resulting 189 PBM trials were carried out using the p a r f o r feature of MATLAB in a 16 core PC, where any 16 trials were run simultaneously, and the resulting PSDs were compared in terms of the span and the D50 of the particles with respect to the initial dry powder charge PSD. The expression for the span of a bed of particles is given as follows in Equation (41):
S p a n = D 90 - D 10 D 50 ,
where D 90 , D 10 and D 50 are the diameter sizes below which 90 % , 10 % and 50 % of the particles in the granulator bed exist at any point of time. Upon examining the results of the extended DOE model, it was found that the higher amount of total liquid added, the lower amount of SSG in the blend and the lower inlet temperature yielded the greatest increase in D 50 while keeping the fines to a minimum extent as possible. The total amount of liquid added during granulation seems to have had a significant influence on the PSDs. This may be explained by the fact that the addition of liquid would lead to a shift of a greater number of particles to the bins of higher sizes. This outweighs the dampening effect on aggregation by the lowering of viscosity of the system, thereby leading to higher Stokes’ criterion numbers for the particles. The effect of lower inlet air temperature on the greater growth of particles is more intuitive to grasp as the lowering of temperature would cause lower moisture evaporation rates from the bed, thereby leading to formation of bigger particles.
On the other hand, conditions have been observed for cases where the D 50 remains in the same ballpark as in the optimal case, but the span is larger thereby leading to a wider distribution and greater amount of fines. The identification of the DOE setting has been achieved by implementing an f m i n s e a r c h algorithm. The initial guess for the DOE setting was given as the one that gave optimal final PSD of the granule, and the objective function was defined as the sum of relative error in the D 50 with respect to the D 50 obtained at the optimum settings and the inverse of the span. The expression for the objective function for the identification of granulation regimes leading to wider PSD is given as follows in Equation (42):
F o b j = a b s D 50 - D 50 , o p t i m a l D 50 , o p t i m a l + 1 S p a n .
It was observed that a greater amount of fines was obtained in the simulations of the systems having greater SSG amount and higher inlet air temperature. The cumulative PSDs for initial powder bed, optimal run setting and the run yielding a greater amount of fines have been shown below in Figure 9.

5. Conclusions

An attempt has been made to validate the model results with the available experimental results limited in both quantity and quality. This goal has been achieved by developing a semi-mechanistic population balance model with aggregation and liquid addition mechanisms that tracked the growth rate of smaller dry particles into larger wet particles. Furthermore, the mass balance equations have been integrated with the energy balance equations of the system with the goal of profiling the temperature of the bed particles over time.The second objective has been achieved by modeling the bed and the air as two individual lumped systems with no spatial variations of temperature for any of them. The experimental PSD and GMD industrial data have been compared. Furthermore, regimes were found that led to poor granulation, indicated by wider spans and lower D10 values.
Thus, the overall model could also simulate the binder dissolution trend and change in kinematic viscosity over time due to the interplay of different mechanisms taking place in the system. With more detailed experimentation, data such as temperature of particle beds at various locations of the bed along the height and the flow patterns at different time points would enable one to discretize the model even along the height and observe the effects of preferential wetting and preferential drying, if any is present.

Author Contributions

S.V.M. and R.R. contributed theory and modeling methods. P.P. provided the experimental data. S.V.M. modeled the system, performed the simulations and wrote the paper. A.T. wrote the introduction section of the paper.

Funding

This work is supported by the National Science Foundation CAREER program through grant no. 1350152.

Acknowledgments

The authors would like to thank Anik Chaturbedi and Indu Mutancheri (affiliated with Dept. of Chem. and Biochem Engg., Rutgers, the State University of New Jersey, USA) for their valuable help in providing their insights of the model formulation. We would also like to thank Christopher Lewins, Steve Pafiakis, Brian Zacour, Dilbir Bindra, Jade Trinh, David Buckley, Shruti Gour, Shasad Sharif and Howard Stamato (from Drug Product Science and Technology, Bristol-Myers Squibb, New Brunswick, NJ, USA) for having generated the experimental data used in this work [28]. Moreover, special thanks is extended to Maksym Dosta at the Dept. of Chem. Engg, TU Hamburg, Germany for having helped with his expertise in the modeling of the energy balance component of the fluidized bed model.

Conflicts of Interest

The authors declare no conflicts of interest.

References

  1. Boerefijn, R.; Hounslow, M. Studies of fluid bed granulation in an industrial r&d context. Chem. Eng. Sci. 2005, 60, 3879–3890. [Google Scholar]
  2. Haapaniemi, H. Development and Validation of Near Infrared Method and Manufacture of Tablet Calibration Set by Fluidized Bed Granulation. Master’s Thesis, Aalto University, Espoo, Finland, October 2017. Available online: https://aaltodoc.aalto.fi/handle/123456789/28499 (accessed on 22 August 2018).
  3. Abouzaid, A.S.; Salem, M.Y.; Elzanfaly, E.S.; el Gindy, A.E.; Hoag, S.; Ibrahim, A. Screening the fluid bed granulation process variables and moisture content determination of pharmaceutical granules by nir spectroscopy. Eur. J. Chem. 2017, 8, 265–272. [Google Scholar] [CrossRef]
  4. Fries, L.; Antonyuk, S.; Heinrich, S.; Palzer, S. DEM-CFD modeling of a fluidized bed spray granulator. Chem. Eng. Sci. 2011, 66, 2340–2355. [Google Scholar] [CrossRef]
  5. Lourenco, V.; Lochmann, D.; Reich, G.; Menezes, J.C.; Herdling, T.; Schewitz, J. A quality by design study applied to an industrial pharmaceutical fluid bed granulation. Eur. J. Pharm. Biopham. 2012, 81, 438–447. [Google Scholar] [CrossRef] [PubMed]
  6. Sen, M.; Barrasso, D.; Singh, R.; Ramachandran, R. A multi-scale hybrid cfd-dem-pbm description of a fluid–bed granulation process. Processes 2014, 2, 89–111. [Google Scholar] [CrossRef]
  7. Rajniak, P.; Stepanek, F.; Dhanasekharan, K.; Fan, R.; Mancinelli, C.; Chern, R. A combined experimental and computational study of wet granulation in a wurster fluid bed granulator. Powder Technol. 2009, 189, 190–201. [Google Scholar] [CrossRef]
  8. Drumm, C.; Attarakih, M.M.; Bart, H.-J. Coupling of CFD with DPBM for an RDC extractor. Chem. Eng. Sci. 2009, 64, 721–732. [Google Scholar] [CrossRef]
  9. Yan, W.; Luo, Z.-H.; Guo, A.-Y. Coupling of CFD with PBM for a pilot-plant tubular loop polymerization reactor. Chem. Eng. Sci. 2011, 66, 5148–5163. [Google Scholar] [CrossRef]
  10. Tan, H.; Goldschmidt, M.; Boerefijn, R.; Hounslow, M.; Salman, A.; Kuipers, J. Building population balance model for fluidized bed melt granulation: Lessons from kinetic theory of granular flow. Powder Technol. 2004, 142, 103–109. [Google Scholar] [CrossRef]
  11. Yuu, S.; Umekage, T.; Johno, Y. Numerical simulation of air and particle motions in bubbling fluidized bed of small particles. Powder Technol. 2000, 110, 158–168. [Google Scholar] [CrossRef]
  12. Bokkers, G.; Annaland, M.V.; Kuipers, J. Mixing and segregation in a bidisperse gas–solid fluidised bed: A numerical and experimental study. Powder Technol. 2004, 140, 176–186. [Google Scholar] [CrossRef]
  13. Fries, L.; Antonyuk, S.; Heinrich, S.; Dopfer, D.; Palzer, S. Collision dynamics in fluidised bed granulators: A DEM-CFD study. Chem. Eng. Sci. 2013, 86, 108–123. [Google Scholar] [CrossRef]
  14. Dosta, M.; Antonyuk, S.; Heinrich, S. Multiscale simulation of the fluidized bed granulation process. Chem. Eng. Technol. 2012, 35, 1373–1380. [Google Scholar] [CrossRef]
  15. Dosta, M.; Antonyuk, S.; Heinrich, S. Multiscale simulation of agglomerate breakage in fluidized beds. Ind. Eng. Chem. Res. 2013, 52, 11275–11281. [Google Scholar] [CrossRef]
  16. Tamrakar, A.; Devarampally, D.R.; Ramachandran, R. Advanced multiphase hybrid model development of fluidized bed wet granulation processes. Comput. Aided Chem. Eng. 2018, 41, 159–187. [Google Scholar]
  17. Pandey, P.; Bharadwaj, R. Predictive Modeling of Pharmaceutical Unit Operations; Woodhead Publishing: Sawston, UK, 2016. [Google Scholar]
  18. Barrasso, D.; Walia, S.; Ramachandran, R. Multi-component population balance modeling of continuous granulation processes: A parametric study and comparison with experimental trends. Powder Technol. 2013, 241, 85–97. [Google Scholar] [CrossRef]
  19. Ramachandran, R.; Immanuel, C.D.; Štěpánek, F.; Litster, J.D.; Doyle, F.J., III. A mechanistic model for breakage in population balances of granulation: Theoretical kernel development and experimental validation. Chem. Eng. Res. Des. 2009, 87, 598–614. [Google Scholar] [CrossRef]
  20. Heinrich, S.; Peglow, M.; Ihlow, M.; Henneberg, M.; Mörl, L. Analysis of the start-up process in continuous fluidized bed spray granulation by population balance modelling. Chem. Eng. Sci. 2002, 57, 4369–4390. [Google Scholar] [CrossRef]
  21. Tan, H.; Salman, A.; Hounslow, M. Kinetics of fluidized bed melt granulation–ii: Modelling the net rate of growth. Chem. Eng. Sci. 2006, 61, 3930–3941. [Google Scholar] [CrossRef]
  22. Vreman, A.; van Lare, C.; Hounslow, M. A basic population balance model for fluid bed spray granulation. Chem. Eng. Sci. 2009, 64, 4389–4398. [Google Scholar] [CrossRef] [Green Version]
  23. Cryer, S.A. Modeling agglomeration processes in fluid–bed granulation. AIChE J. 1999, 45, 2069–2078. [Google Scholar] [CrossRef]
  24. Chaudhury, A.; Niziolek, A.; Ramachandran, R. Multi-dimensional mechanistic modeling of fluid bed granulation processes: An integrated approach. Adv. Powder Technol. 2013, 24, 113–131. [Google Scholar] [CrossRef]
  25. Dosta, M.; Heinrich, S.; Werther, J. Fluidized bed spray granulation: Analysis of the system behaviour by means of dynamic flowsheet simulation. Powder Technol. 2010, 204, 71–82. [Google Scholar] [CrossRef]
  26. Börner, M.; Peglow, M.; Tsotsas, E. Derivation of parameters for a two compartment population balance model of wurster fluidised bed granulation. Powder Technol. 2013, 238, 122–131. [Google Scholar] [CrossRef]
  27. Liu, H.; Li, M. Two-compartmental population balance modeling of a pulsed spray fluidized bed granulation based on computational fluid dynamics (CFD) analysis. Int. J. Pharm. 2014, 475, 256–269. [Google Scholar] [CrossRef] [PubMed]
  28. Pandey, P.; Levins, C.; Pafiakis, S.; Zacour, B.; Bindra, D.; Trinh, J.; Buckley, D.; Gour, S.; Sharif, S.; Stamato, H. Enhancing tablet disintegration characteristics of a highly water-soluble high-drug-loading formulation by granulation process. Pharm. Dev. Technol. 2016, 23, 1–9. [Google Scholar] [CrossRef] [PubMed]
  29. Chaturbedi, A.; Bandi, C.; Reddy, D.; Pandey, P.; Narang, A.; Bindra, D.; Tao, L.; Zhao, J.; Li, J.; Hussain, M.; et al. Compartment based population balance model development of a high shear wet granulation process via dry and wet binder addition. Chem. Eng. Res. Des. 2017, 123, 187–200. [Google Scholar] [CrossRef]
  30. Ennis, B.J.; Tardos, G.; Pfeffer, R. A microlevel-based characterization of granulation phenomena. Powder Technol. 1991, 65, 257–272. [Google Scholar] [CrossRef]
  31. Hu, X.; Cunningham, J.; Winstead, D. Understanding and predicting bed humidity in fluidized bed granulation. J. Pharm. Sci. 2008, 97, 1564–1577. [Google Scholar] [CrossRef] [PubMed]
  32. Stakic, M.; Stefanovic, P.; Cvetinovic, D.; Skobalj, P. Convective drying of particulate solids–packed vs. fluid bed operation. Int. J. Heat Mass Transf. 2013, 59, 66–74. [Google Scholar] [CrossRef]
  33. Fries, L.; Dosta, M.; Antonyuk, S.; Heinrich, S.; Palzer, S. Moisture distribution in fluidized beds with liquid injection. Chem. Eng. Technol. 2011, 34, 1076–1084. [Google Scholar] [CrossRef]
  34. Wang, J.; Flanagan, D.R. General solution for diffusion-controlled dissolution of spherical particles. 1. Theory. J. Pharm. Sci. 1999, 88, 731–738. [Google Scholar] [CrossRef] [PubMed]
  35. Chaudhury, A.; Kapadia, A.; Prakash, A.V.; Barrasso, D.; Ramachandran, R. An extended cell-average technique for a multi-dimensional population balance of granulation describing aggregation and breakage. Adv. Powder Technol. 2013, 24, 962–971. [Google Scholar] [CrossRef]
Figure 1. Experimental vs. model particle size distributions (PSDs) for Sets 1, 2 and 10 that were used for training the model.
Processes 06 00154 g001
Figure 2. Experimental vs. model PSDs for validation Set 7.
Processes 06 00154 g002
Figure 3. 2-dimesional mass frequency of particles with respect to both diameter and moisture content.
Processes 06 00154 g003
Figure 4. Experimental vs. model PSDs for Sets 1, 2 and 10 that were used for training the model.
Processes 06 00154 g004
Figure 5. Experimental vs. model geometric mean diameters (GMDs) for validation Set 7.
Processes 06 00154 g005
Figure 6. Plots showcasing the veracity of the results obtained from the integrated population balance, energy balance, binder dissolution and viscosity prediction models.
Processes 06 00154 g006
Figure 7. Plots showcasing the temperature profiles of the particle bed for the various experimental cases.
Processes 06 00154 g007
Figure 8. Simulated data for the binder liquid obtained by integrating the binder dissolution and viscosity prediction models into the main mass and energy balance model of the system.
Processes 06 00154 g008
Figure 9. Mass PSDs for inital powder blend, final granular blends at optimum D50 run settings and at setting generating more fines.
Processes 06 00154 g009
Table 1. Formulation compositions for fluid-bed wet granulation batches.
Formulation5% SSG7.5% SSG10% SSG
Ingredient% w/w% w/w% w/w
Intra-granular
Lamivudine (API)70.0070.0070.00
MCC (Excipient)20.2517.7515.25
SSG (super-disintegrant)2.503.755.00
HPC (binder-dry)2.002.002.00
HPC (binder-soln)2.002.002.00
Extra-granular
SSG (super-disintegrant)2.503.755.00
Mg Stearate (glidant)0.750.750.75
Total100100100
Table 2. Intra-granular blend components’ compositions.
Formulation5% SSG7.5% SSG10% SSG
Ingredient% w/w% w/w% w/w
Dry blendAll HPC boundDry blendAll HPC boundDry blendAll HPC bound
Lamivudine73.8872.3574.8773.3075.8874.27
MCC21.3720.9318.9818.5916.5316.18
SSG2.642.584.013.935.425.31
HPC2.114.132.144.192.174.24
Total100100100100100100
Table 3. Various design of experiemnts (DOE) settings for fluid bed granulation (FBG) batches.
Batch #Atomization Air Pressure (Bar)Disintegrant Amount % w/wInlet Air Temp. (°C)Binder Spray Rate (g/min)
11103016
215308
32.57.54012
445508
54105016
6453016
7155016
82.57.54012
9410308
10110508
Table 4. The DOE settings for other modeled FBG cases at 1 bar nozzle atomization pressure.
Varied ParameterParameter Values
Ratio of total liquid added to initial solid bed mass0.1334, 0.2001, 0.2668, 0.3335, 0.4002, 0.4669 and 0.5336
Total SSG amt in formulation5%, 7.5% and 10%
Inlet air temperature during liquid addition30 °C, 40 °C and 50 °C
Liquid spray rate8 g/min, 12 g/min and 16 g/min
Table 5. The values of various constants and parameters.
SymbolMeaningParameter Value
θ Contact Angle42.7 °
β o Aggregation kernel constant6.87 Number - 1 ·s - 1
e r e s t Coefficient of restitution0.326
C p , a i r Heat Capacity of air1006 Jkg - 1 ·K - 1
C p , l i q u i d Heat Capacity of liquid water4187 Jkg - 1 ·K - 1
C p , w a t e r v a p Heat Capacity of water vapor1996 Jkg - 1 ·K - 1
C p , s o l i d Heat Capacity of solids1000 Jkg - 1 ·K - 1
λ e v a p Latent heat of evaporation for water2.27×10 6 J·kg - 1
D H P C Diffusivity of HPC8.3×10 - 9 m 2 ·s - 1
ρ H P C Density of HPC500 kg·m - 3
C s a t , H P C Saturated concentration of HPC330 kg·m - 3
R a d b i n d e r , o Initial radius of HPC binder particles49.375 μ m
x i n Moisture content of inlet air 1 . 5 % w.r.t. dry air

