Article

Multiresponse Optimization of Ultrasonic-Assisted Extraction for Aurantii Fructus to Obtain High Yield of Antioxidant Flavonoids Using a Response Surface Methodology

1
Hunan Key Laboratory of Traditional Chinese Veterinary Medicine, Hunan Agricultural University, Changsha 410128, China
2
Horticulture and Landscape College, Hunan Agricultural University, Changsha 410128, China
*
Authors to whom correspondence should be addressed.
These authors contributed equally to this work.
Processes 2018, 6(12), 258; https://doi.org/10.3390/pr6120258
Submission received: 6 November 2018 / Revised: 29 November 2018 / Accepted: 7 December 2018 / Published: 10 December 2018
(This article belongs to the Special Issue Microwave Applications in Chemical Engineering)

Abstract

:
Aurantii fructus (zhiqiao, ZQ) is a traditional Chinese medicine (TCM) and raw material of TCM healthcare food (TCM-HF), mainly focused on the regulation of gastrointestinal disorders and the abundant application of antioxidants. Pharmacological investigations of ZQ flavonoids have identified them as the main bioactive components in recent years, but little has been reported on the extraction processes of antioxidant flavonoids (AFs). The aim of this study was to establish an efficient ultrasonic-assisted extraction (UAE) method for the extraction of AFs from ZQ using a response surface methodology (RSM), analyze the composition of AFs, and develop a qualitative evaluation method for ZQ. Flavonoid yield and antioxidant ability were selected as the responses to optimize the extraction of AFs, and the multiple effects of independent variables were investigated. The optimized conditions for the extraction of AFs based on the Box-Behnken design (BBD) were as follows: ethanol concentration, 58%; extraction temperature, 70 °C; and extraction time, 17 min. The flavonoid yield and antioxidant activity reached 241.70 mg/g and 59.42%, respectively, which matched the predicted values. Furthermore, optimized UAE processes were first established for the efficient and fast extraction of AFs. Flavanones and polymethoxyflavonoids (PMFs) were identified as potential AFs using time-of-flight mass spectrometry. Meanwhile, the quality of ZQ was evaluated using the criteria importance through intercriteria correlation (CRITIC) method for the first time, and Yuanjiang ZQ was considered as an excellent raw material of TCM-HF.

1. Introduction

The importance of traditional Chinese medicine (TCM) has been accepted as a sustainable health treatment resource around the world. In recent years, the conception of TCM healthcare food (TCM-HF) has fast developed from a traditional treatment to dietotherapy [1]. Therefore, it has become increasingly important to explore active compounds from natural sources using essential extraction and isolation procedures in the application of pharmaceutic preparations, functional food components, dietary supplements, nutraceuticals, and food additives [2]. Research and development regarding TCM-HF mainly include formulae, quality standards and process procedures, and optimization of process procedures is essential. Moreover, antioxidant activity is one of the key indexes of TCM-HF and has been shown to eliminate or reduce the amount of free radicals and to decrease the incidence of diseases [3].
Aurantii fructus (zhiqiao, ZQ), a TCM and a raw material of TCM-HF, is harvested from the immature, green fruit of Citrus aurantium L., mainly focused on the treatment of gastrointestinal dysfunction, the improvement of qi stagnation, and the remission of chest pain in traditional therapies [4,5,6]. The secondary metabolites of ZQ include flavonoids, alkaloids, triterpenes, volatile oils, and coumarins [7,8,9,10]. Based on pharmacologic studies and clinical practice, flavonoids are considered as the main medicinal components with an enriched content and play an important role in pharmacological effects, such as anti-oxidation, anti-inflammation, the treatment of cardiovascular disease, and the promotion of gastrointestinal motility [11,12,13,14]. Although many studies have been carried out on the pharmacology and analytical chemistry of ZQ, there are few studies on the extraction technology of ZQ extract [15]. As a potential raw material of TCM-HF, it is important to develop an efficient and concise extraction procedure for the extraction of health-promoting compounds from ZQ. In pre-experiments for this study, we found that the flavonoid yield was positively correlated with antioxidant activity. According to the basic requirement of TCM-HF, extraction procedures for antioxidant flavonoids (AFs) from ZQ should be further studied [16].
In previous research, common extraction methods of ZQ flavonoids mainly included ultrasonic extraction [5,8], hot-water extraction [17,18], and reflux extraction [19]. Concerning the current study, there is no report on the ultrasonic-assisted hot-water extraction (UAE) method for the extraction of AFs from ZQ. In this study, UAE variables such as raw material concentration, sample size, extraction solvent, solvent concentration, extraction time, and extraction temperature were optimized using single-factor tests; among these, ethanol concentration, extraction temperature, and time were selected as the individual variables for the response surface methodology (RSM) by performing a three-level, three-variable Box-Behnken design (BBD) [20,21] to study the appropriate extraction conditions for AFs from ZQ. Then, we analyzed the main components of AFs from ZQ using liquid chromatography combined with quadrupole time-of-flight mass spectrometry (LC–Q–TOF–MS) [7] and evaluated the quality of ZQ from different habitats using the criteria importance through intercriteria correlation (CRITIC) method [22].

2. Materials and Methods

2.1. Materials, Chemicals, and Reagents

ZQ samples were collected from a series of raw materials of Hunan Province in China and identified by Prof. Qi Tang (Hunan Agricultural University). The fresh ZQs were continuously dried in 60 °C oven until a constant weight. The dried ZQ samples were milled with a grinder, sieved through a series of sieves, and stored in a desiccator at ordinary temperature (25 °C) until the tests. Standard substances (narirutin, naringin, eriocitrin, neoeriocitrin, poncirin, hesperidin, neohesperidin, nobiletin, and tangeretin) with high purities of over 98% were purchased from Yuan-ye Bio-Technology Co., Ltd. (Shanghai, China). Methanol, ethanol, acetone, ethyl acetate, ether, and petroleum ether were the analytical reagents (Sinopharm Chemical Reagent Co., Ltd., Shanghai, China). Acetonitrile and formic acid were of the chromatographic grade for the mass analysis (Sinopharm Chemical Reagent Co., Ltd., Shanghai, China).

2.2. Optimal Extraction of AFs from ZQ

An extractive procedure was optimized for the extraction of AFs; in short, 50 mg of each dried ZQ sample was added to 20 mL of 58% ethanol, and extracted for 17 min in a 70 °C water bath by use of a KM5200DV ultrasonic instrument with a constant power (200 W, 40 Hz; Kunshan Ultrasonic Instrument Co., Ltd., Kunshan, China).

2.3. Determination of Flavonoid Yield

The flavonoid yield of each extract was determined by Lay et al. [23], with few modifications. Each standard solution of naringin (200 µL) within a set concentration range (10, 40, 80, 120, 160, 200, 400 µg/mL) was added to 5.0 mL of 0.01 mol/L AlCl3 solution (dissolved in methanol), respectively, incubated for 10 min in the dark at room temperature, and then measured at 310 nm on an 1800 UV spectrophotometer (Shimadzu Corp., Kyoto, Japan). A calibration curve was established: Y = 0.0009X − 0.0039, where Y was the absorbance (Abs), and X was the naringin concentration (µg/mL), R2 = 0.9969.
An extract solution of 100 µL and 100 µL methanol solvent were mixed, and the same procedure was then repeated, as described above. The concentration of flavonoids was determined based on the calibration curve measured, and the flavonoid yield in the extract was calculated according to the naringin equivalent (mg of flavonoids/g of extract).

2.4. Analysis of Antioxidant Activity

The antioxidant activity of the ZQ extract was analyzed according to the free-radical scavenging activity and measured using the 1,1-diphenyl-2-picrylhydrazyl (DPPH) method. This method was performed as proposed by Lay et al. [23], with a minor modification. An extract solution of 3.0 mL was added to a tube and then mixed with 3.0 mL of 80 µg/mL DPPH/methanol solution. The mixture was incubated for 30 min in dark conditions at room temperature. After the reaction, the absorbance was recorded at a wavelength of 517 nm on an 1800 UV spectrophotometer. Methanol was used as a blank control. The antioxidant activity of the tested sample was expressed as the DPPH radical scavenging rate (SR).
The calculated equation was:
% SR = [(A0 − A1)/A0] × 100%,
where A0 is the blank control and A1 is the absorbance sample.

2.5. Experimental RSM Design

Based on the single-factor tests, several independent variables which had a significant influence on flavonoid yield and antioxidant activity were selected as the factor variables and studied using the BBD of RSM.

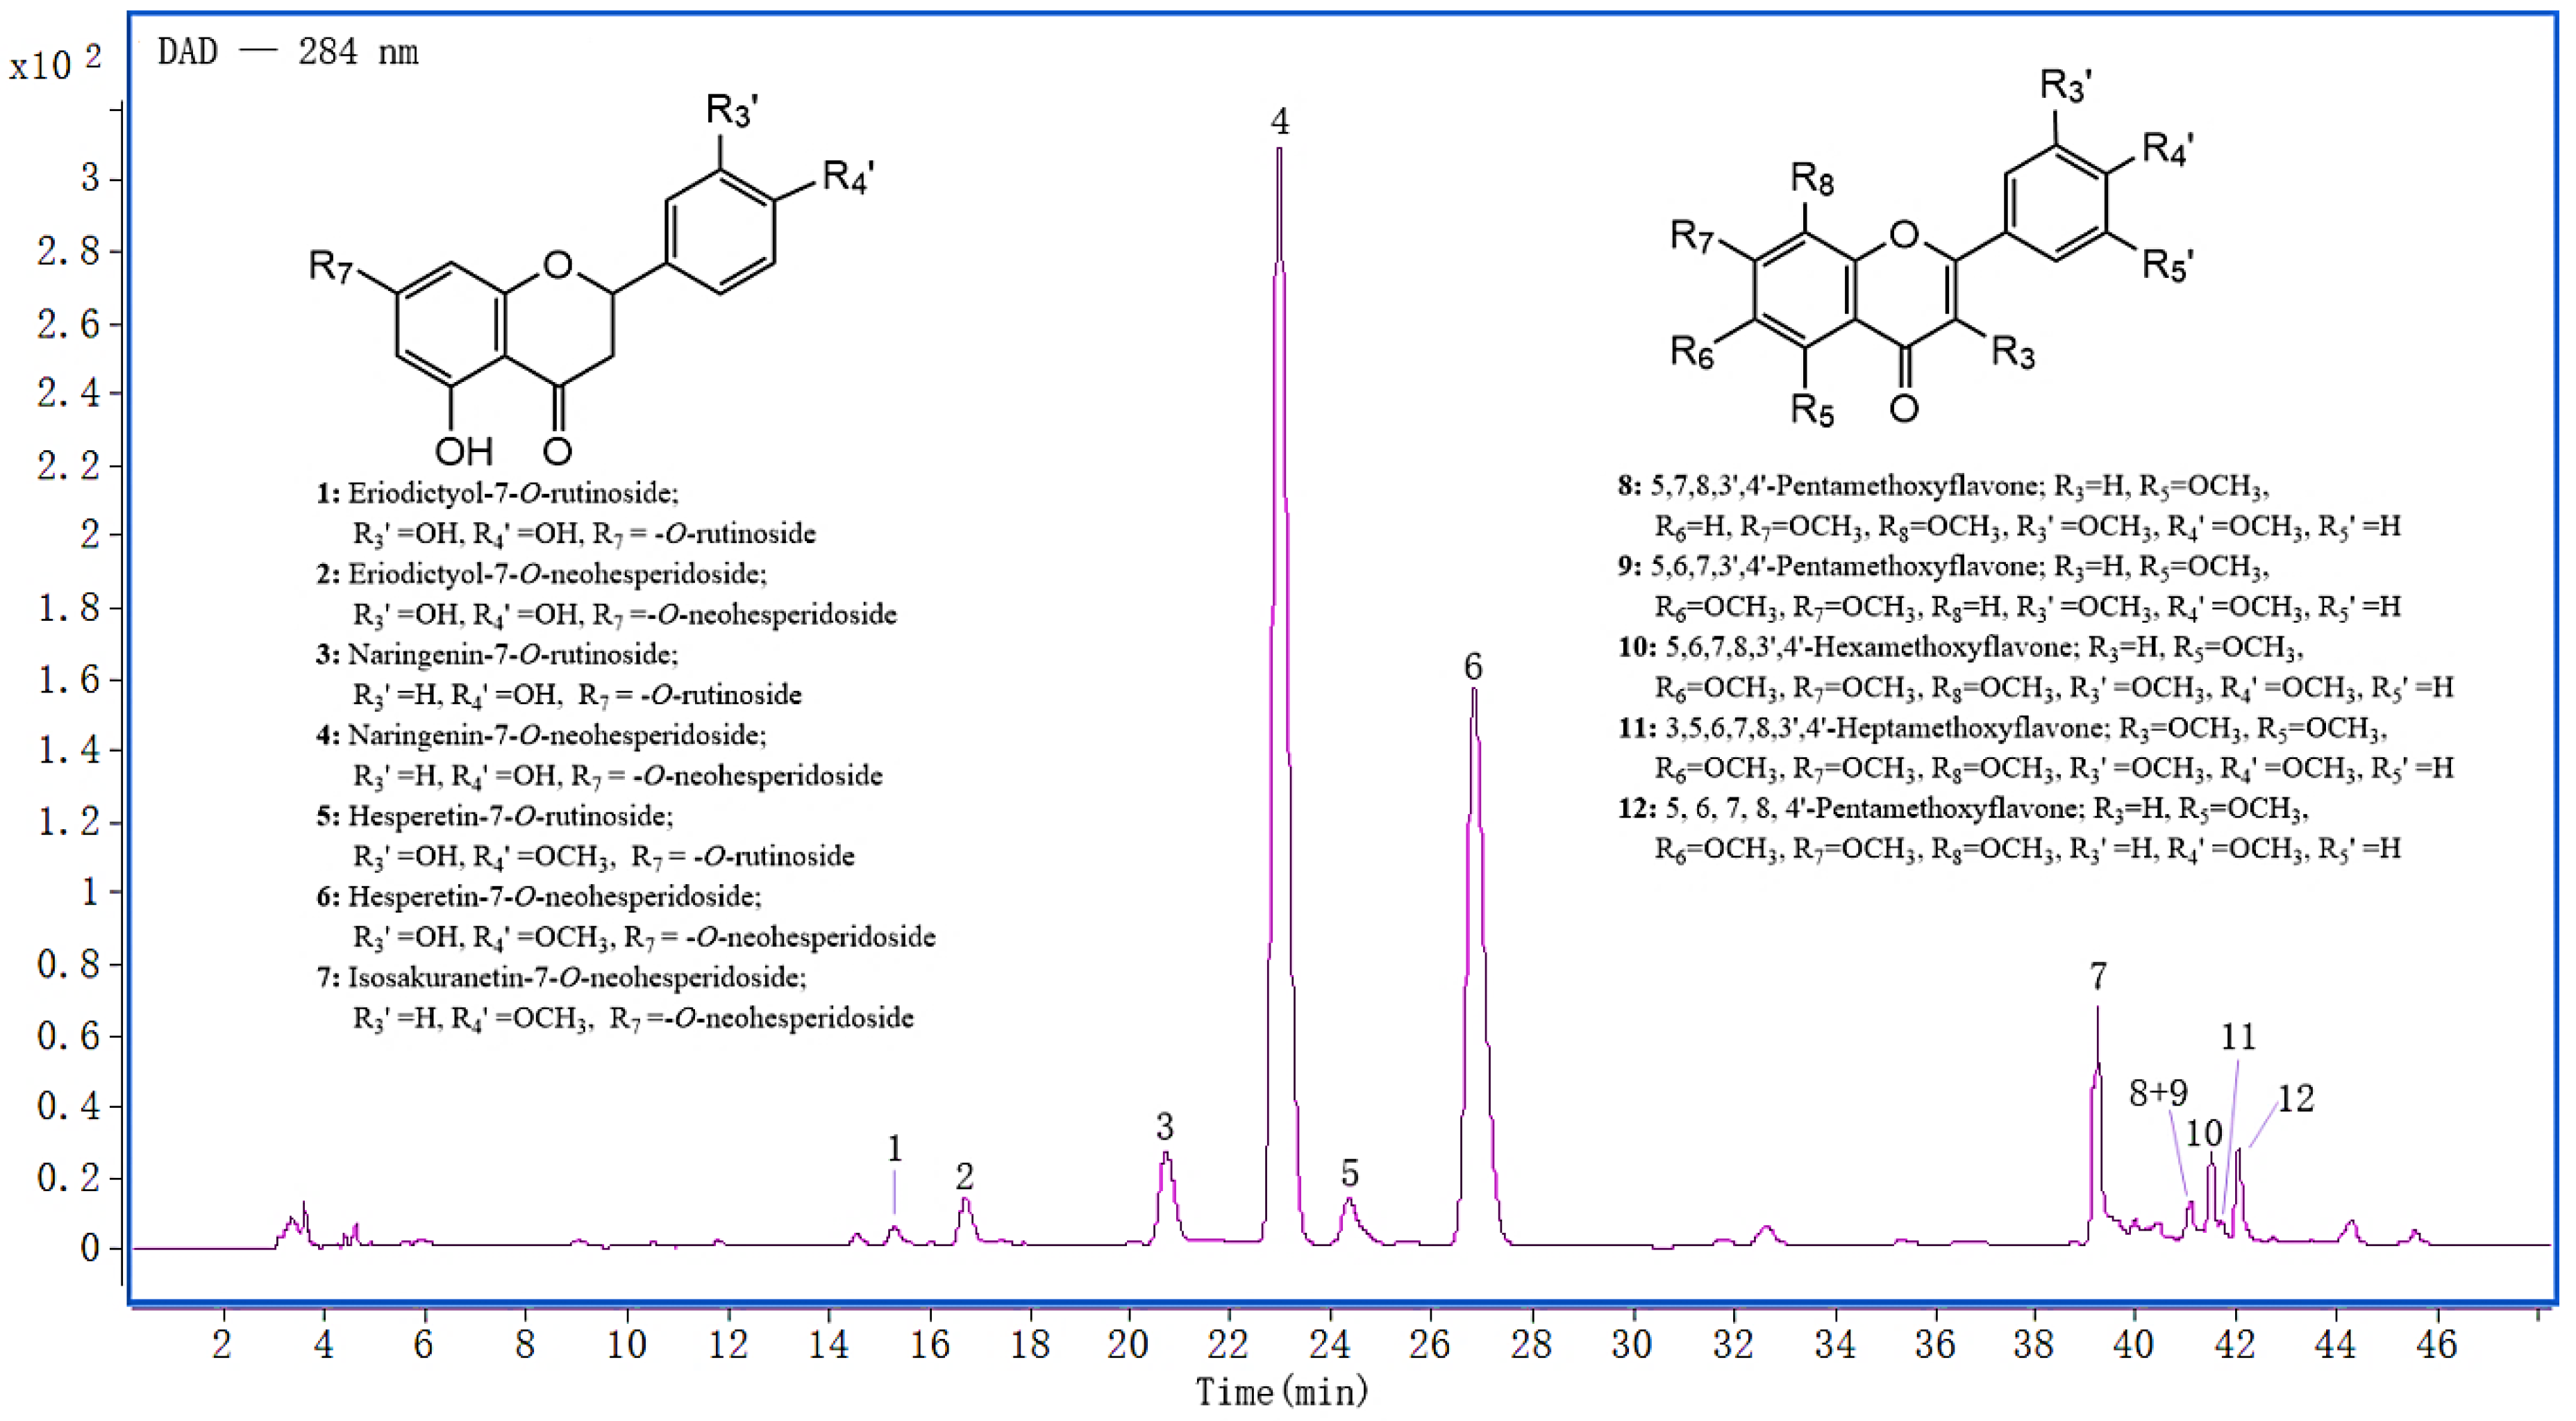
2.6. Identification of AFs

The identification of AFs was conducted on an Agilent 1290 HPLC system (Agilent Technologies, Palo Alto, CA, USA), combined with an accurate-mass mass spectrometer of Agilent 6530 Q-TOF-MS (Agilent Technologies, Palo Alto, CA, USA). Chromatographic separation was carried out on an Agilent-ZORBAX SB-C18 column (250 mm × 4.6 mm, 5 µm, Agilent Technologies, Palo Alto, CA, USA), with a gradient elution (0–45 min, 10–90% acetonitrile). The other experimental conditions were consistent with our previous study [7].

2.7. Quality Evaluation of ZQ

Based on the optimal extraction conditions, the flavonoid yield and antioxidant activity of ZQ samples from 16 different habitats of Hunan Province were determined, and the criteria importance through intercriteria correlation (CRITIC) method was employed for the ZQ quality evaluation.

3. Results and Discussion

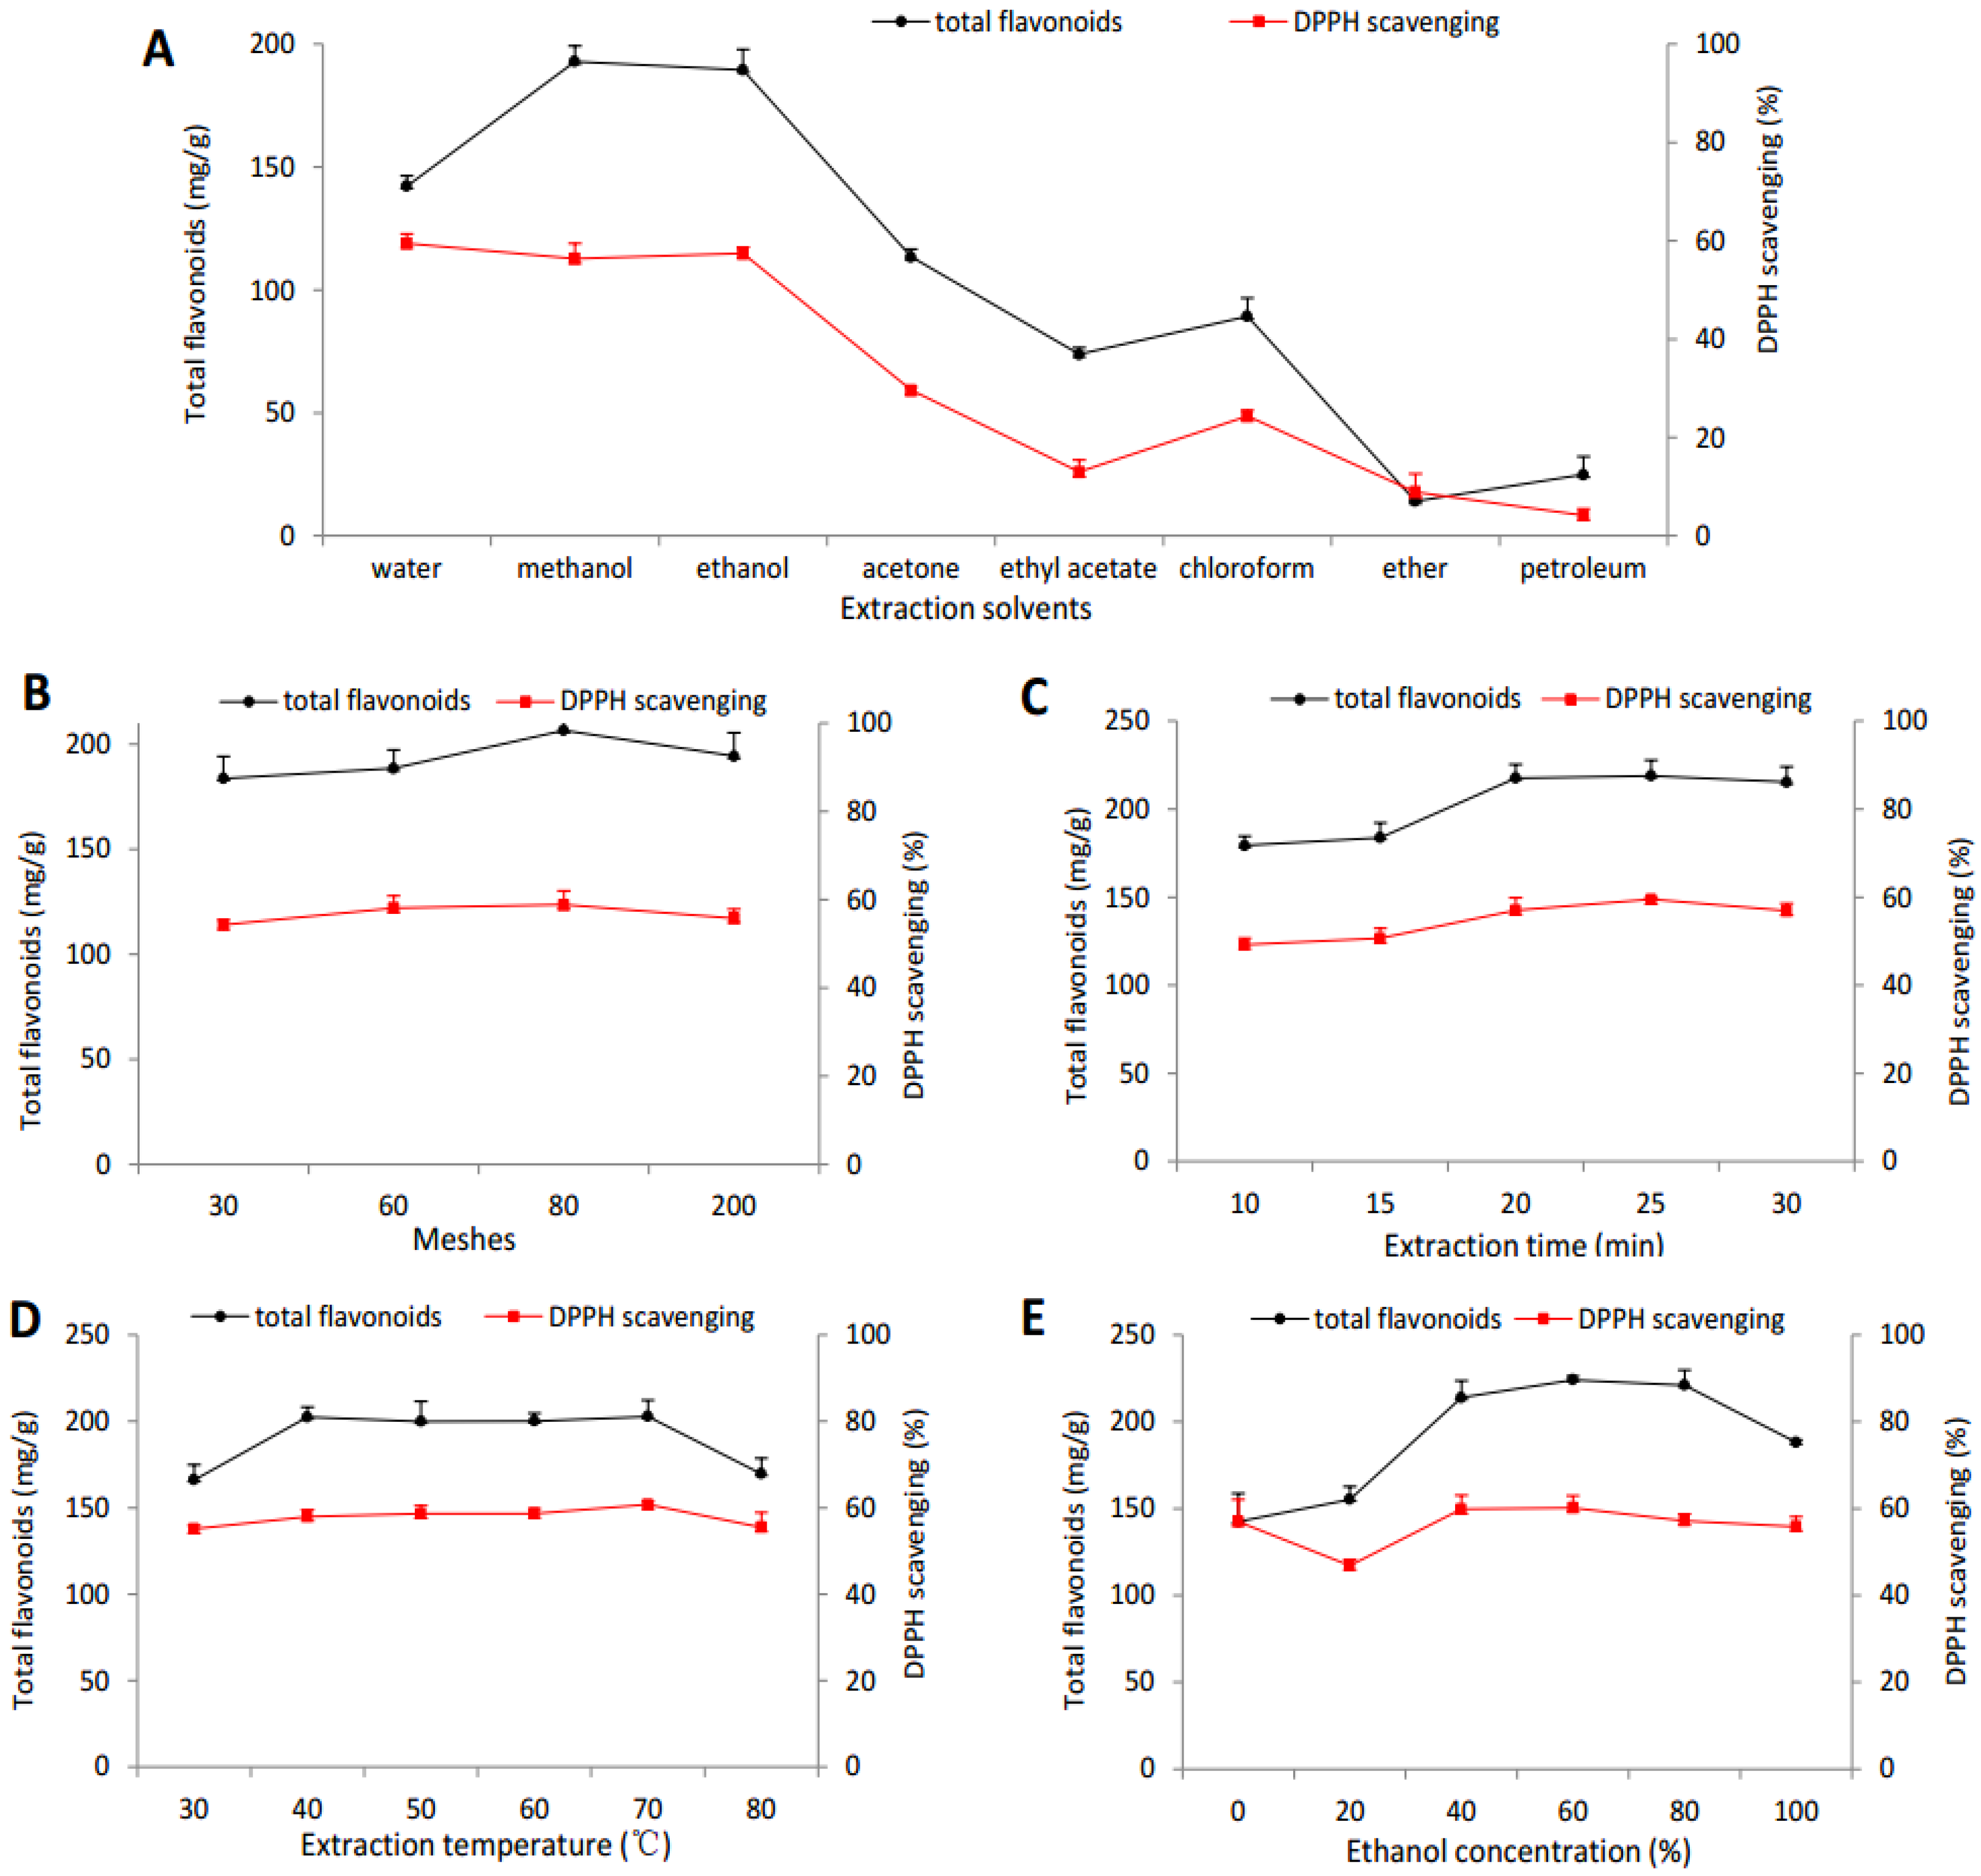
3.1. Selection of Optimization Factors

The solubility of AFs is affected by various variables. In this study, the ratio of solid/solvent was set to 50 mg/20 mL in the pre-test, which guaranteed an adequate dissolution of AFs, and a UAE with a consistent ultrasonic power of 200 W, 40 Hz was employed, which was mild for the molecular structure of the AFs. Furthermore, other independent variables were carefully screened using single-factor tests.

3.1.1. Selection of Organic Solvent for Extraction

Extraction solvents have a significant influence on extraction yield. The solubility of flavonoids is controlled by the polarity of the solvents used. Therefore, it is important to employ suitable solvents to ensure the optimal extraction of ZQ flavonoids. The ZQ flavonoids were extracted using different solvents from low polarity to high polarity, and their antioxidant activities were analyzed. The results showed that, compared to other solvents, the solubility of ZQ flavonoids in methanol and ethanol solution increased significantly, but there was no significant difference between them, and the antioxidant activity of ZQ extract in ethanol solution was better than in methanol (Figure 1A). In consideration of green environmental chemistry, which encourages low toxicity, environmental friendliness, and relative safety, ethanol solution was chosen as the extraction solution. Then, its concentration was tentatively set to 60% for further optimization (Figure 1E).

3.1.2. Selection of Sieves

It was found that the sieve sizes were not very significant, being in the range of 30–200 meshes, but it was still clear that the flavonoid yield and antioxidant activity obtained from 80 meshes were suitable for ZQ extraction (Figure 1B).

3.1.3. Selection of Extraction Time

The effect of different extraction times on the flavonoid yield and antioxidant activity was studied. The results showed that both indexes first increased, and then decreased with longer extraction times (Figure 1C). An extraction time at 20 min was selected for further extraction optimization.

3.1.4. Selection of Extraction Temperature

Temperature had a great influence on flavonoid yield and antioxidant activity, but there was not a very significant difference in the range of 40–70 °C. As shown in Figure 1D, the composition of ZQ was relatively stable in this range, and there was a downward trend when the temperature rose. Therefore, the extraction temperature was tentatively selected at 50 °C for further optimization.

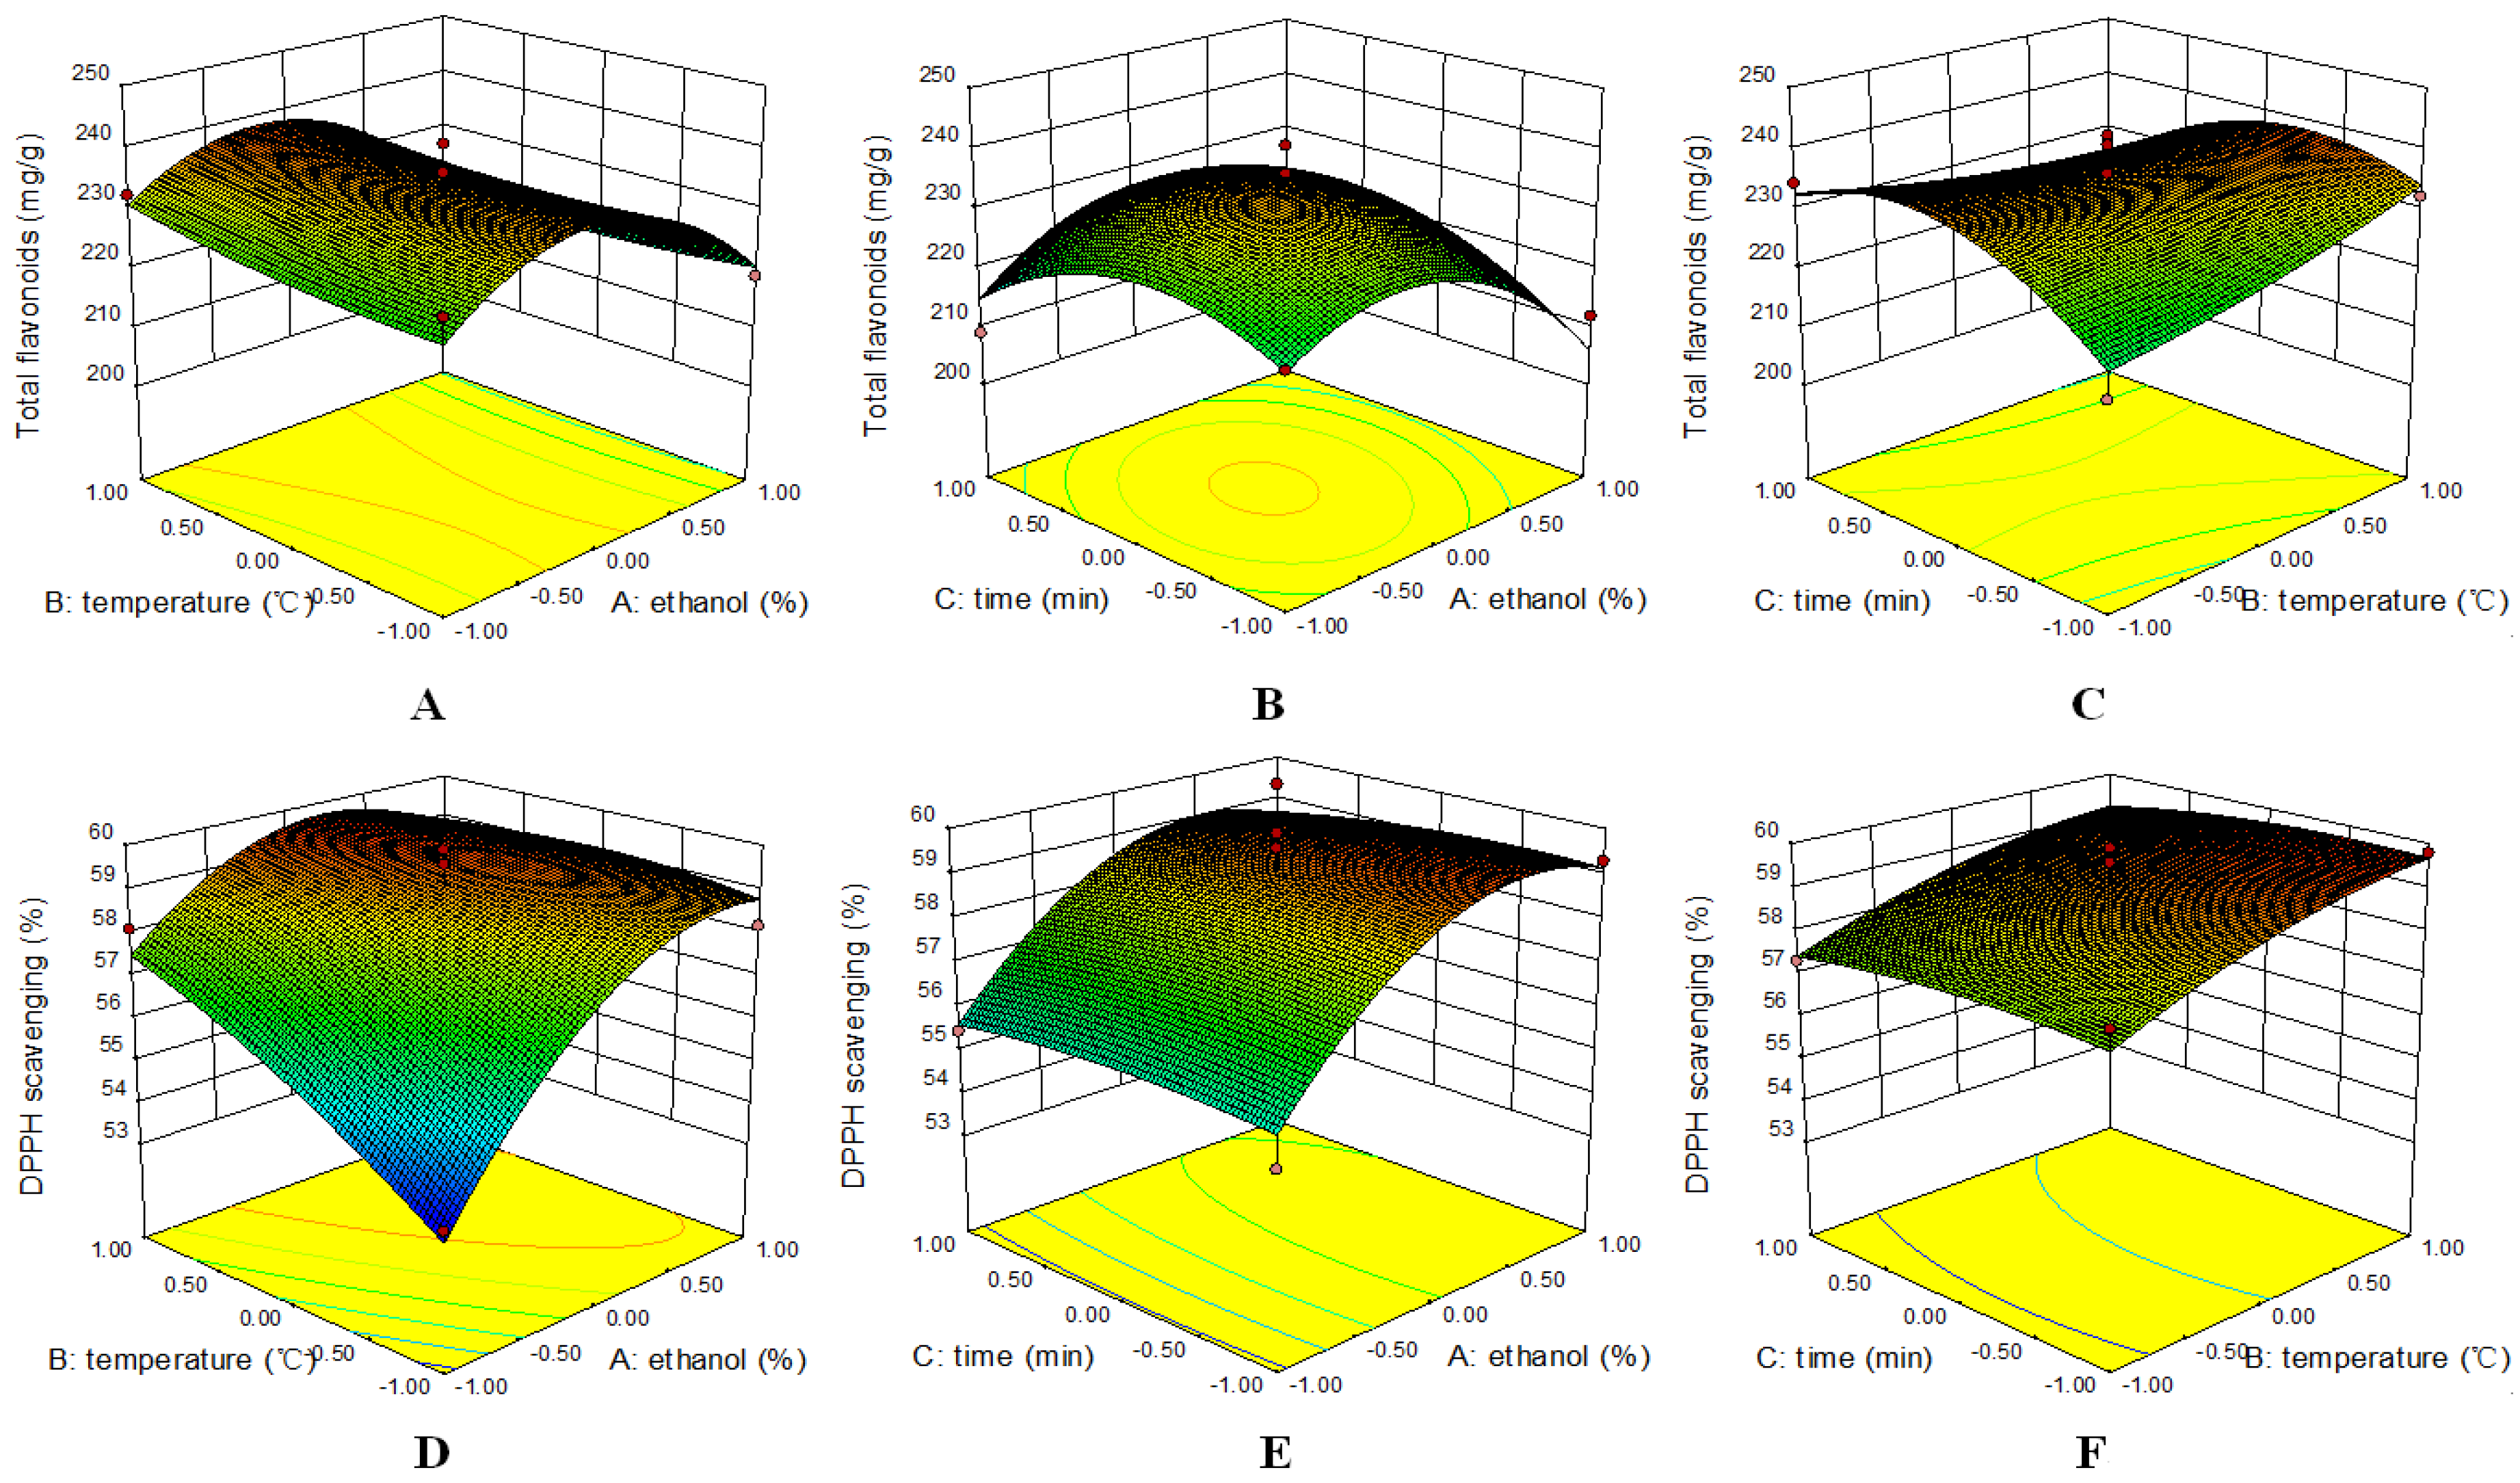
3.2. Optimization of Extraction Conditions Using RSM

Based on the single-factor tests mentioned above, three variables—ethanol concentration, extraction time, and extraction temperature—were selected as the guiding factors for further RSM optimization in the experiments, which affected the flavonoid yield and antioxidant activity in the extraction procedures.
A Box-Behnken design (BBD) of RSM was employed to investigate the effects of three variables—ethanol concentration (X1), extraction temperature (X2), and extraction time (X3)—on the flavonoid yield (Y1) and antioxidant activity (Y2). The independent variables were coded at three levels (−1, 0 and 1), in detail, ethanol concentration (40%, 60%, and 80%), temperature (30, 50, and 70 °C) and extraction time (10, 20, and 30 min) were investigated (Table 1). This design was composed of 17 tested points, including five replications of the zero points (all variables were coded as zero), and the response results were obtained as shown in Table 2.

3.3. Effect of Extraction Conditions on Flavonoid Yield and Antioxidant Activity

The average flavonoid yield and antioxidant activity of each of the 17 tests under the various experimental UAE conditions are shown in Table 2. The highest flavonoid yield of 240.65 mg/g and antioxidant activity of 59.89% were obtained in experimental run number 16, with 60% ethanol, a temperature of 50 °C, and a time of 20 min. The yield from this test was excellent compared to previous data. Two second-order regression equations were established to fit with this experiment as follow:
Flavonoids yield = 235.5 − 4.2A + 1.0B + 0.3C − 1.5AB + 3.5AC − 5.2BC − 12.9A2 + 1.4B2 − 8.8C2,
Antioxidant activity = 59.0 + 1.6A + 0.96B − 0.2C − 1.0AB − 0.1AC − 0.1BC − 1.6A2 − 0.4B2 − 0.2C2.
The expected regression coefficients and analysis of variance (ANOVA) of the flavonoid yield and antioxidant activity were presented using the BBD. A quadratic regression model of flavonoid yield was significant (p < 0.05), while the lack of fit was not significant (p > 0.05), suggesting that this model was highly consistent with the experimental results of the flavonoid yield. Similarly, the quadratic regression model of antioxidant activity was also feasible. The regression coefficients of the two indexes were R2 = 0.87 and R2 = 0.91, respectively, which indicated a good degree of consistency between the experimental data and the predicted yield. The calibration coefficients of the index model were R2Adj = 0.70 and R2Adj = 0.80, respectively, which indicated that the results were reliable.

3.4. Response Surface Analysis

Based on the equations mentioned above, three-dimensional (3D) surface values were depicted to show the influences of the UAE variables (ethanol concentration, extraction temperature, and extraction time) on the flavonoid yield and antioxidant activity (Figure 2).
The results for the combined effect of ethanol concentration and extraction temperature suggested that the effects of low and high levels of ethanol concentration and extraction temperature on the extraction were significant. When the extraction temperature was at a constant value, the flavonoid yield initially increased and then decreased with the increase in ethanol concentration. However, at a constant ethanol concentration, it was not significant that the increase in extraction temperature impacted the flavonoid yield (Figure 2A). From Figure 2B, the results indicated that the interactional effects between ethanol concentration and extraction time were remarkable when the other variables were set at a fixed value. From Figure 2C, it can be seen that when the extraction time was set at a constant value, the increase in extraction temperature had little influence on the flavonoid yield. However, when the temperature was constant, the flavonoid yield underwent a significant change, from a low level to a high level, with the increase in extraction time. The response surface suggested that the flavonoid yield showed a significant correlation with the ethanol concentration and extraction time, but little influence was obtained in relation to the extraction temperature. This was highly consistent with previous data from single-factor tests.
Similarly, for the antioxidant activity analysis, the results suggested that ethanol concentration and extraction temperature had a significant influence on the antioxidant activity of ZQ extract, with a low influence for extraction time (Figure 2D–F).

3.5. Theoretical Extraction Conditions and Verification

Based on the Design Expert software (Version10.0, Stat-Ease Inc., Minneapolis, MN, US), the desirability function of RSM was employed to obtain the optimal conditions for the flavonoid yield and antioxidant activity, and the optimum yield was achieved and set up with the following applied parameters: ethanol concentration, 58.4%; extraction temperature, 70 °C; and extraction time, 16.8 min. The estimated values were obtained (flavonoids, 239.04 mg/g; antioxidant activity, 59.59%).
The verification of the estimated results was validated using practical experiments under optimal conditions. The results indicated that the practical values (flavonoids, 241.70 mg/g; antioxidant activity, 59.42%) were consistent with the predicted values, the flavonoids yield was significant higher than previous reported data [15], and possessed high antioxidant activity at the same time. Therefore, the extraction conditions obtained using RSM were reliable and practical. The adjusted extraction conditions were: ethanol concentration, 58%; extraction temperature, 70 °C; and extraction time, 17 min. In contrast to traditional techniques, this model takes into account the interactions among several independent variables.

3.6. Identification of AFs from ZQ

The AFs from ZQ were identified using the HPLC–Q–TOF–MS method by comparing standards, fragmentation patterns and previously reported data [6] (Figure 3); flavanones and polymethoxyflavonoids (PMFs) were identified as the main AFs from ZQ (Table 3). In detail, flavanones including eriocitrin, neoeriocitrin, narirutin, naringin, hesperidin, neohesperidin, and poncirin, and PMFs including isosinensetin, sinensetin, nobiletin, 3,5,6,7,8,3′,4′-heptamethoxyflavone, and tangeretin were identified as the flavonoids with antioxidant properties. It was suggested that those antioxidant flavonoids might be effective ZQ ingredients for healthcare.

3.7. Quality Evaluation of ZQ

The objective weight (Wj) according to the CRITIC method was expressed based on the characteristic conflict (Rj), the correlation of indicators (rij), the amount of information (Cj), and the standard deviation (σj). The calculated formulae were as follows:
R j = i = 1 n ( 1 r i j )
C j = σ j R j
W j = C j j = 1 n C j
The flavonoid yield and antioxidant activity of ZQs were determined, the data matrix was established according to the standardized data and formulae (experimental values − experimental minimum)/(experimental maximum − experimental minimum), and their objective weights were calculated according to the formulae mentioned above (Table 4).
Then, according to the objective weight of the flavonoid yield and antioxidant activity, a qualitative evaluation method for ZQ was efficiently established, and the comprehensive scores of ZQ from different habitats were analyzed. As shown in Table 5, ZQ from Sanyantang, Fuqiushan, and Chishanzhen of Hunan Province showed excellent comprehensive scores and good quality levels.

4. Conclusions

This study clearly identified that the extraction processes of antioxidant flavonoids from ZQ could be improved by optimizing several key factors using RSM. Furthermore, the basic structures of potential antioxidant flavonoids were preliminarily illustrated using LC–Q–TOF–MS, and the comprehensive scores of AF quality from different habitats were then comparatively analyzed. As a raw material of TCM-HF, AFs of ZQ are an extract source with great potential for application in pharmaceutic preparations, functional food ingredients, dietary supplements, nutraceuticals, food additives, and so on.

Author Contributions

Y.H., H.X. and Q.T. conceived and designed the experiments; Y.H., Y.C., Y.S., H.T. performed the experiments and designed the figures; Y.H., Y.C., and Y.S. analyzed and helped in data interpretation; Q.T. collected the materials; Y.H. wrote the manuscript and K.Z. assisted language modification; J.Z. provided funding support; H.X. and Q.T. edited and supported suggestions for the manuscript.

Funding

This research was funded by the China Agriculture Research System (No. CARS-21), the Project of Hunan Science and Technology Innovation (No. S2017SFXYZ0116), the Major Projects of Hunan Provincial Science and Technology Department (No. 2015SK1001, 2014SK2005), the Project of Hunan Natural Science Foundation (No. 2017JJ2119), the Project of Hunan Postgraduate Research and Innovation (No. CX2016B311), the Science and Technology Project of Hunan Education Department (17A093), and National key laboratory cultivation base construction project (16KFXM15).

Conflicts of Interest

The authors declare no conflicts of interest.

References

  1. Wai Chon Ng, H.H. From medicine to food: Evolution of TCM health food sector in China. Int. J. Transit. Innov. Syst. 2014, 3, 16. [Google Scholar]
  2. Xu, Q.; Shen, Y.; Wang, H.; Zhang, N.; Xu, S.; Zhang, L. Application of response surface methodology to optimise extraction of flavonoids from fructus sophorae. Food Chem. 2013, 138, 2122–2129. [Google Scholar] [CrossRef] [PubMed]
  3. Hou, W.; Zhang, W.; Chen, G.; Luo, Y. Optimization of Extraction Conditions for Maximal Phenolic, Flavonoid and Antioxidant Activity from Melaleuca bracteata Leaves Using the Response Surface Methodology. PLoS ONE 2016, 11, e0162139. [Google Scholar] [CrossRef] [PubMed]
  4. Pharmacopoeia of the People Republic of China; Chinese Medical Science and Technology Press: Beijing, China, 2015.
  5. Lin, Z.; Wang, H.; Xu, Y.; Dong, J.; Hashi, Y.; Chen, S. Identification of antioxidants in Fructus aurantii and its quality evaluation using a new on-line combination of analytical techniques. Food Chem. 2012, 134, 1181–1191. [Google Scholar] [CrossRef] [PubMed]
  6. He, Y.; Li, Z.; Wang, W.; Sooranna, S.R.; Shi, Y.; Chen, Y.; Wu, C.; Zeng, J.; Tang, Q.; Xie, H. Chemical Profiles and Simultaneous Quantification of Aurantii fructus by Use of HPLC-Q-TOF-MS Combined with GC-MS and HPLC Methods. Molecules 2018, 23, 2189. [Google Scholar] [CrossRef] [PubMed]
  7. He, Y.; Cheng, P.; Wang, W.; Yan, S.; Tang, Q.; Liu, D.; Xie, H. Rapid Investigation and Screening of Bioactive Components in Simo Decoction via LC-Q-TOF-MS and UF-HPLC-MD Methods. Molecules 2018, 23, 1792. [Google Scholar] [CrossRef] [PubMed]
  8. Li, P.; Zeng, S.L.; Duan, L.; Ma, X.D.; Dou, L.L.; Wang, L.J.; Li, P.; Bi, Z.M.; Liu, E.H. Comparison of Aurantii Fructus Immaturus and Aurantii Fructus based on multiple chromatographic analysis and chemometrics methods. J. Chromatogr. A 2016, 1469, 96–107. [Google Scholar] [CrossRef] [PubMed]
  9. Zhao, S.Y.; Liu, Z.L.; Shu, Y.S.; Wang, M.L.; He, D.; Song, Z.Q.; Zeng, H.L.; Ning, Z.C.; Lu, C.; Lu, A.P.; et al. Chemotaxonomic Classification Applied to the Identification of Two Closely-Related Citrus TCMs Using UPLC-Q-TOF-MS-Based Metabolomics. Molecules 2017, 22, 1721. [Google Scholar] [CrossRef]
  10. He, Y.; Zhu, S.; Wu, C.; Lu, Y.; Tang, Q. Bioactivity-Guided Separation of Potential D2 Dopamine Receptor Antagonists from Aurantii Fructus based on Molecular Docking Combined with High-Speed Counter-Current Chromatography. Molecules 2018, 23, 3135. [Google Scholar] [CrossRef]
  11. Liu, X.Y.; Fan, M.L.; Wang, H.Y.; Yu, B.Y.; Liu, J.H. Metabolic profile and underlying improved bio-activity of Fructus aurantii immaturus by human intestinal bacteria. Food Funct. 2017, 8, 2193–2201. [Google Scholar] [CrossRef]
  12. Su, M.S.; Shyu, Y.T.; Chien, P.J. Antioxidant activities of citrus herbal product extracts. Food Chem. 2008, 111, 892–896. [Google Scholar] [CrossRef]
  13. Tan, W.; Li, Y.; Wang, Y.; Zhang, Z.; Wang, T.; Zhou, Q.; Wang, X. Anti-coagulative and gastrointestinal motility regulative activities of Fructus Aurantii Immaturus and its effective fractions. Biomed. Pharmacother. 2017, 90, 244–252. [Google Scholar] [CrossRef] [PubMed]
  14. Kang, M.; Kim, J.H.; Cho, C.; Chung, H.S.; Kang, C.W.; Kim, Y.; Shin, M.; Hong, M.; Bae, H. Anti-ischemic effect of Aurantii Fructus on contractile dysfunction of ischemic and reperfused rat heart. J. Ethnopharmacol. 2007, 111, 584–591. [Google Scholar] [CrossRef] [PubMed]
  15. Chen, J.Y.; Jia, W.; Zeng, Y.E.; Cao, C.; Wang, S.L. Optimal extracting conditions for flavonoids in Fructus Aurantii Immaturus with central composite design and response surface method. Chin. J. Pharm. Anal. 2012, 32, 5. [Google Scholar]
  16. Mohamed Mahzir, K.A.; Abd Gani, S.S.; Hasanah Zaidan, U.; Halmi, M.I.E. Development of Phaleria macrocarpa (Scheff.) Boerl Fruits Using Response Surface Methodology Focused on Phenolics, Flavonoids and Antioxidant Properties. Molecules 2018, 23, 724. [Google Scholar] [CrossRef] [PubMed]
  17. Zhou, D.Y.; Xing, R.; Xu, Q.; Xue, X.Y.; Zhang, F.F.; Liang, X.M. Polymethoxylated flavones metabolites in rat plasma after the consumption of Fructus aurantii extract: Analysis by liquid chromatography/electrospray ion trap mass spectrometry. J. Pharm. Biomed. Anal. 2008, 46, 543–549. [Google Scholar] [CrossRef] [PubMed]
  18. Zhou, D.Y.; Xu, Q.; Xue, X.Y.; Zhang, F.F.; Jing, Y.; Liang, X.M. Rapid qualitative and quantitative analyses of flavanone aglycones in Fructus aurantii by HPLC ion-trap MS. J. Sep. Sci. 2007, 30, 858–867. [Google Scholar] [CrossRef]
  19. Zhang, J.; Gao, W.; Liu, Z.; Zhang, Z.; Liu, C. Systematic Analysis of Main Constituents in Rat Biological Samples after Oral Administration of the Methanol Extract of Fructus Aurantii by HPLC-ESI-MS/MS. Iran. J. Pharm. Res. IJPR 2014, 13, 493–503. [Google Scholar]
  20. Tomaz, I.; Maslov, L.; Stupic, D.; Preiner, D.; Asperger, D.; Karoglan Kontic, J. Multi-response optimisation of ultrasound-assisted extraction for recovery of flavonoids from red grape skins using response surface methodology. Phytochem. Anal. PCA 2016, 27, 13–22. [Google Scholar] [CrossRef]
  21. Nipornram, S.; Tochampa, W.; Rattanatraiwong, P.; Singanusong, R. Optimization of low power ultrasound-assisted extraction of phenolic compounds from mandarin (Citrus reticulata Blanco cv. Sainampueng) peel. Food Chem. 2018, 241, 338–345. [Google Scholar] [CrossRef]
  22. Liu, D.; Zhao, X. Method and application for dynamic comprehensive evaluation with subjective and objective information. PLoS ONE 2013, 8, e83323. [Google Scholar] [CrossRef] [PubMed]
  23. Lay, M.M.; Karsani, S.A.; Banisalam, B.; Mohajer, S.; Abd Malek, S.N. Antioxidants, phytochemicals, and cytotoxicity studies on Phaleria macrocarpa (Scheff.) Boerl seeds. BioMed Res. Int. 2014, 2014, 410184. [Google Scholar] [CrossRef] [PubMed]
Figure 1. Influence of the main factors ((A) extraction solvents, (B) meshes, (C) extraction time, (D) extraction temperature, (E) ethanol concentration) on flavonoids and DPPH scavenging of Aurantii fructus.
Processes 06 00258 g001
Figure 2. Response surface plots of ethanol concentration, extraction time, and temperature on the total flavonoids (A–C) and DPPH scavenging (D–F).
Processes 06 00258 g002
Figure 3. Representative chromatogram of flavonoids with antioxidant properties from ethanol extract of Aurantii fructus obtained using HPLC–DAD (λ = 284 nm) coupled with Q–TOF–MS.
Processes 06 00258 g003
Table 1. Independent factors and their levels used in the response surface design.
FactorsFactor Level
Coded levels−101
A: Percentage of ethanol (%)406080
B: Extraction temperature (°C)305070
C: Extraction time (min)102030
Table 2. The experimental values for the responses of total flavonoids and 1,1-diphenyl-2-picrylhydrazyl (DPPH) scavenging at different levels.
Std.RunA (%)B (°C)C (min)Total Flavonoids (mg/g)DPPH Scavenging (%)
71−101208.9555.45
920−1−1217.1958.07
13−1−10229.6653.85
10401−1232.1859.78
45110215.2958.45
176000235.1158.92
37−110232.2458.09
6810−1211.8559.28
291−10218.8758.17
810101213.0759.34
1611000235.9459.56
1412000235.7058.36
11130−11234.4057.31
1514000229.9958.50
1215011228.6258.74
1316000240.6559.89
517−10−1221.5455.02
Table 3. Mass spectrometry data of the main flavonoids with antioxidant properties from Aurantii fructus.
NumberCompound[M+H]+/[M−H]Frag. (ESI+)MWFormula
Flavanones
1Eriodictyol-7-O-rutinoside (eriocitrin) a597/595435, 289596C27H32O15
2Eriodictyol-7-O-neohesperidoside (neoeriocitrin) a597/595435, 289596C27H32O15
3Naringenin-7-O-rutinoside (narirutin) a581/579419, 273580C27H32O14
4Naringenin-7-O-neohesperidoside (naringin) a581/579419, 273580C27H32O14
5Hesperetin-7-O-rutinoside (hesperidin) a611/609449, 303610C28H34O15
6Hesperetin-7-O-neohesperidoside (neohesperidin) a611/609449, 303610C28H34O15
7Isosakuranetin-7-O-neohesperidoside (poncirin) a595/593433, 287594C28H34O14
Polymethoxyflavonoids (PMFs)
85,7,8,3′,4′-Pentamethoxyflavone (isosinensetin)373/—358, 343, 315372C20H20O7
95,6,7,3′,4′-Pentamethoxyflavone (sinensetin)373/—358, 343, 312372C20H20O7
105,6,7,8,3′,4′-Hexamethoxyflavone (nobiletin) a403/—373, 355, 327402C21H22O8
113,5,6,7,8,3′,4′-Heptamethoxyflavone433/—403, 388, 385432C22H24O9
125, 6, 7, 8, 4′-Pentamethoxyflavone (tangeretin) a373/—358, 325, 297372C20H20O7
a These compounds were accurately identified with reference standards.
Table 4. Comparison of intensity, conflict, information, and objective weight of evaluation indexes.
Evaluation IndexesIntensity (σj)Conflict (Rj)Information (Cj)Objective Weight (Wj)
Total flavonoids0.2310.3580.0830.440
DPPH scavenging0.2940.3580.1050.560
Table 5. Comprehensive evaluation of Aurantii fructus from different areas in Hunan Province based on the intercriteria correlation (CRITIC) method (n = 3).
SamplesRegionTotal Flavonoids (mg/g)DPPH Scavenging (%)Comprehensive ScoreRanking
S4Sanyantang, Yuangjiang356.5375.3497.331
S8Fuqiushan, Taojiang284.4776.3289.132
S6Chishanzhen, Yuangjiang264.3679.1188.633
S2Shijihu, Yuangjiang252.5078.6686.844
S9Heshanqu, Yiyang283.8272.2186.145
S11Nongda, Changsha277.2471.8285.056
S10Yangjixiang, Anren273.9672.1484.887
S7Longhushan, Yuangjiang249.7274.5483.588
S14Yanwanghuzhen, Hanshou242.6475.7783.589
S13Ningyuan, Yongzhou303.7662.4781.7110
S15Bailuqiaozhen, Hanshou253.5470.5581.2311
S5Tuanshanzhen, Yuangjiang231.8874.0681.0412
S12Fenglinzhen, Lilin252.3968.6279.7413
S16Xinning, Shaoyang212.3661.7069.8814
S1Xinwanzhen, Yuangjiang182.9955.2561.6915
S3Nanjuzhen, Yuangjiang151.2351.2454.9416

