Information Extraction from Retinal Images with Agent-Based Technology

 ,
,  ,
, 
Abstract
:1. Introduction
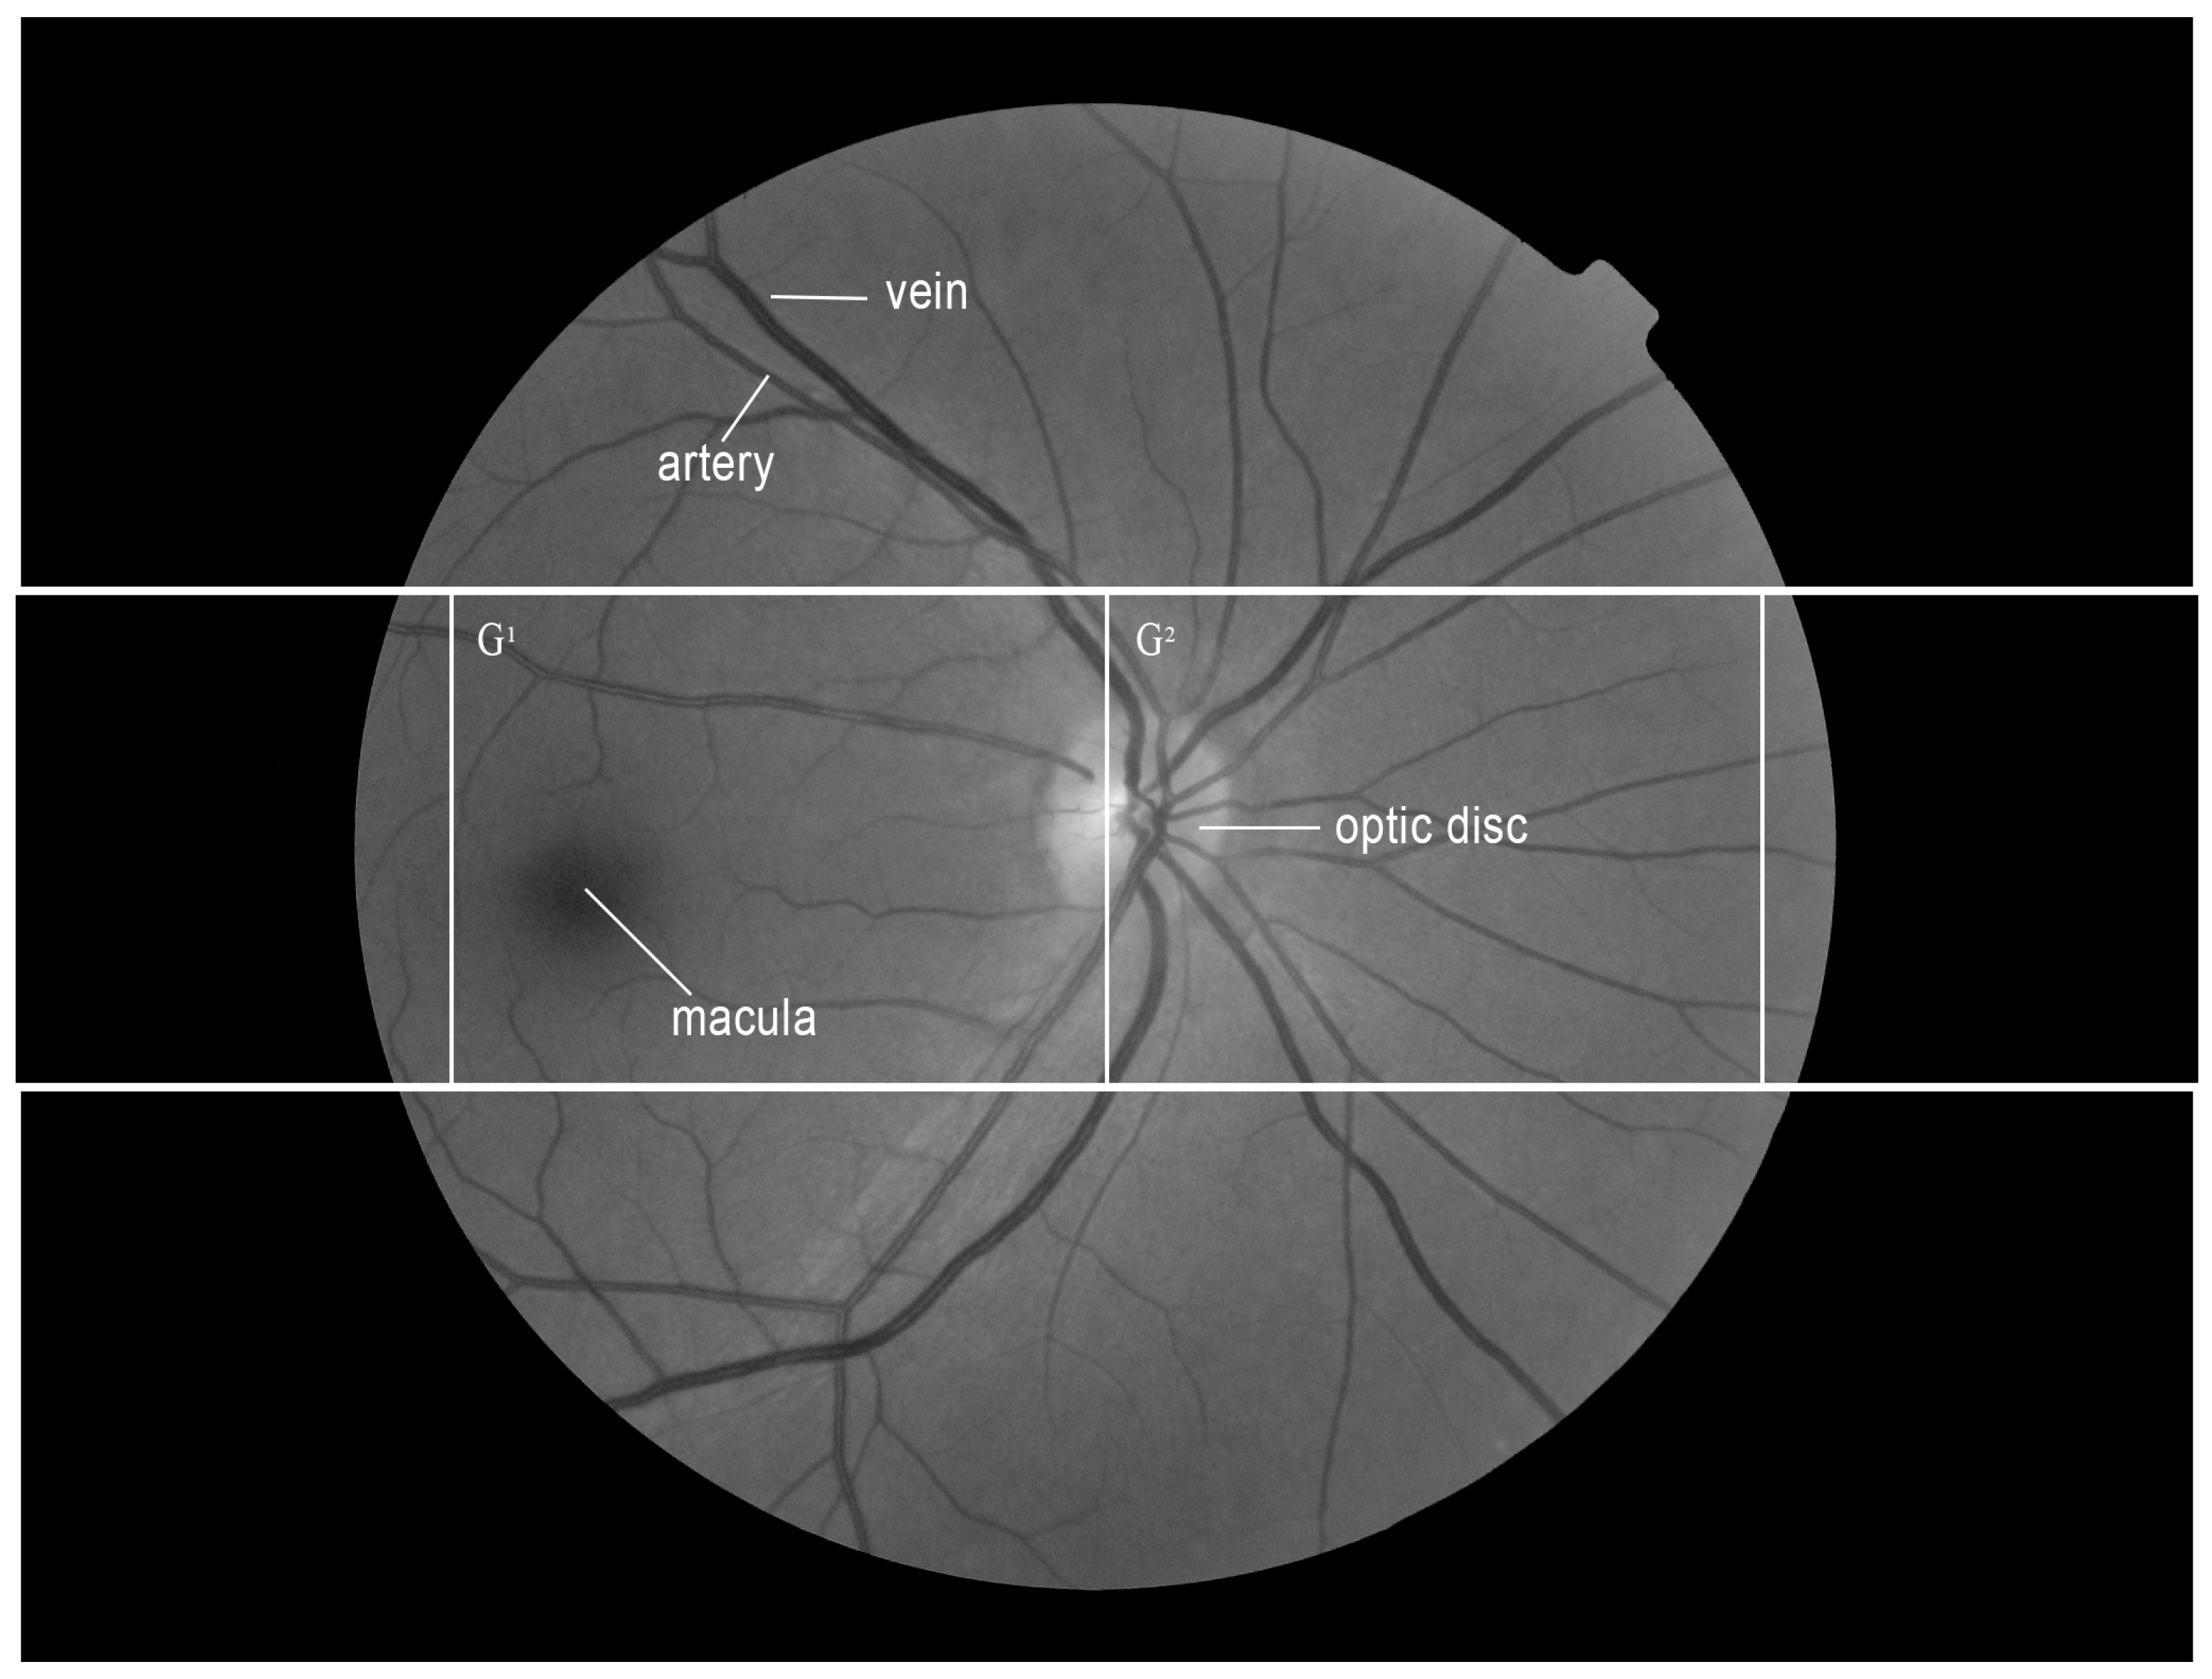
2. Fundus Image Analysis
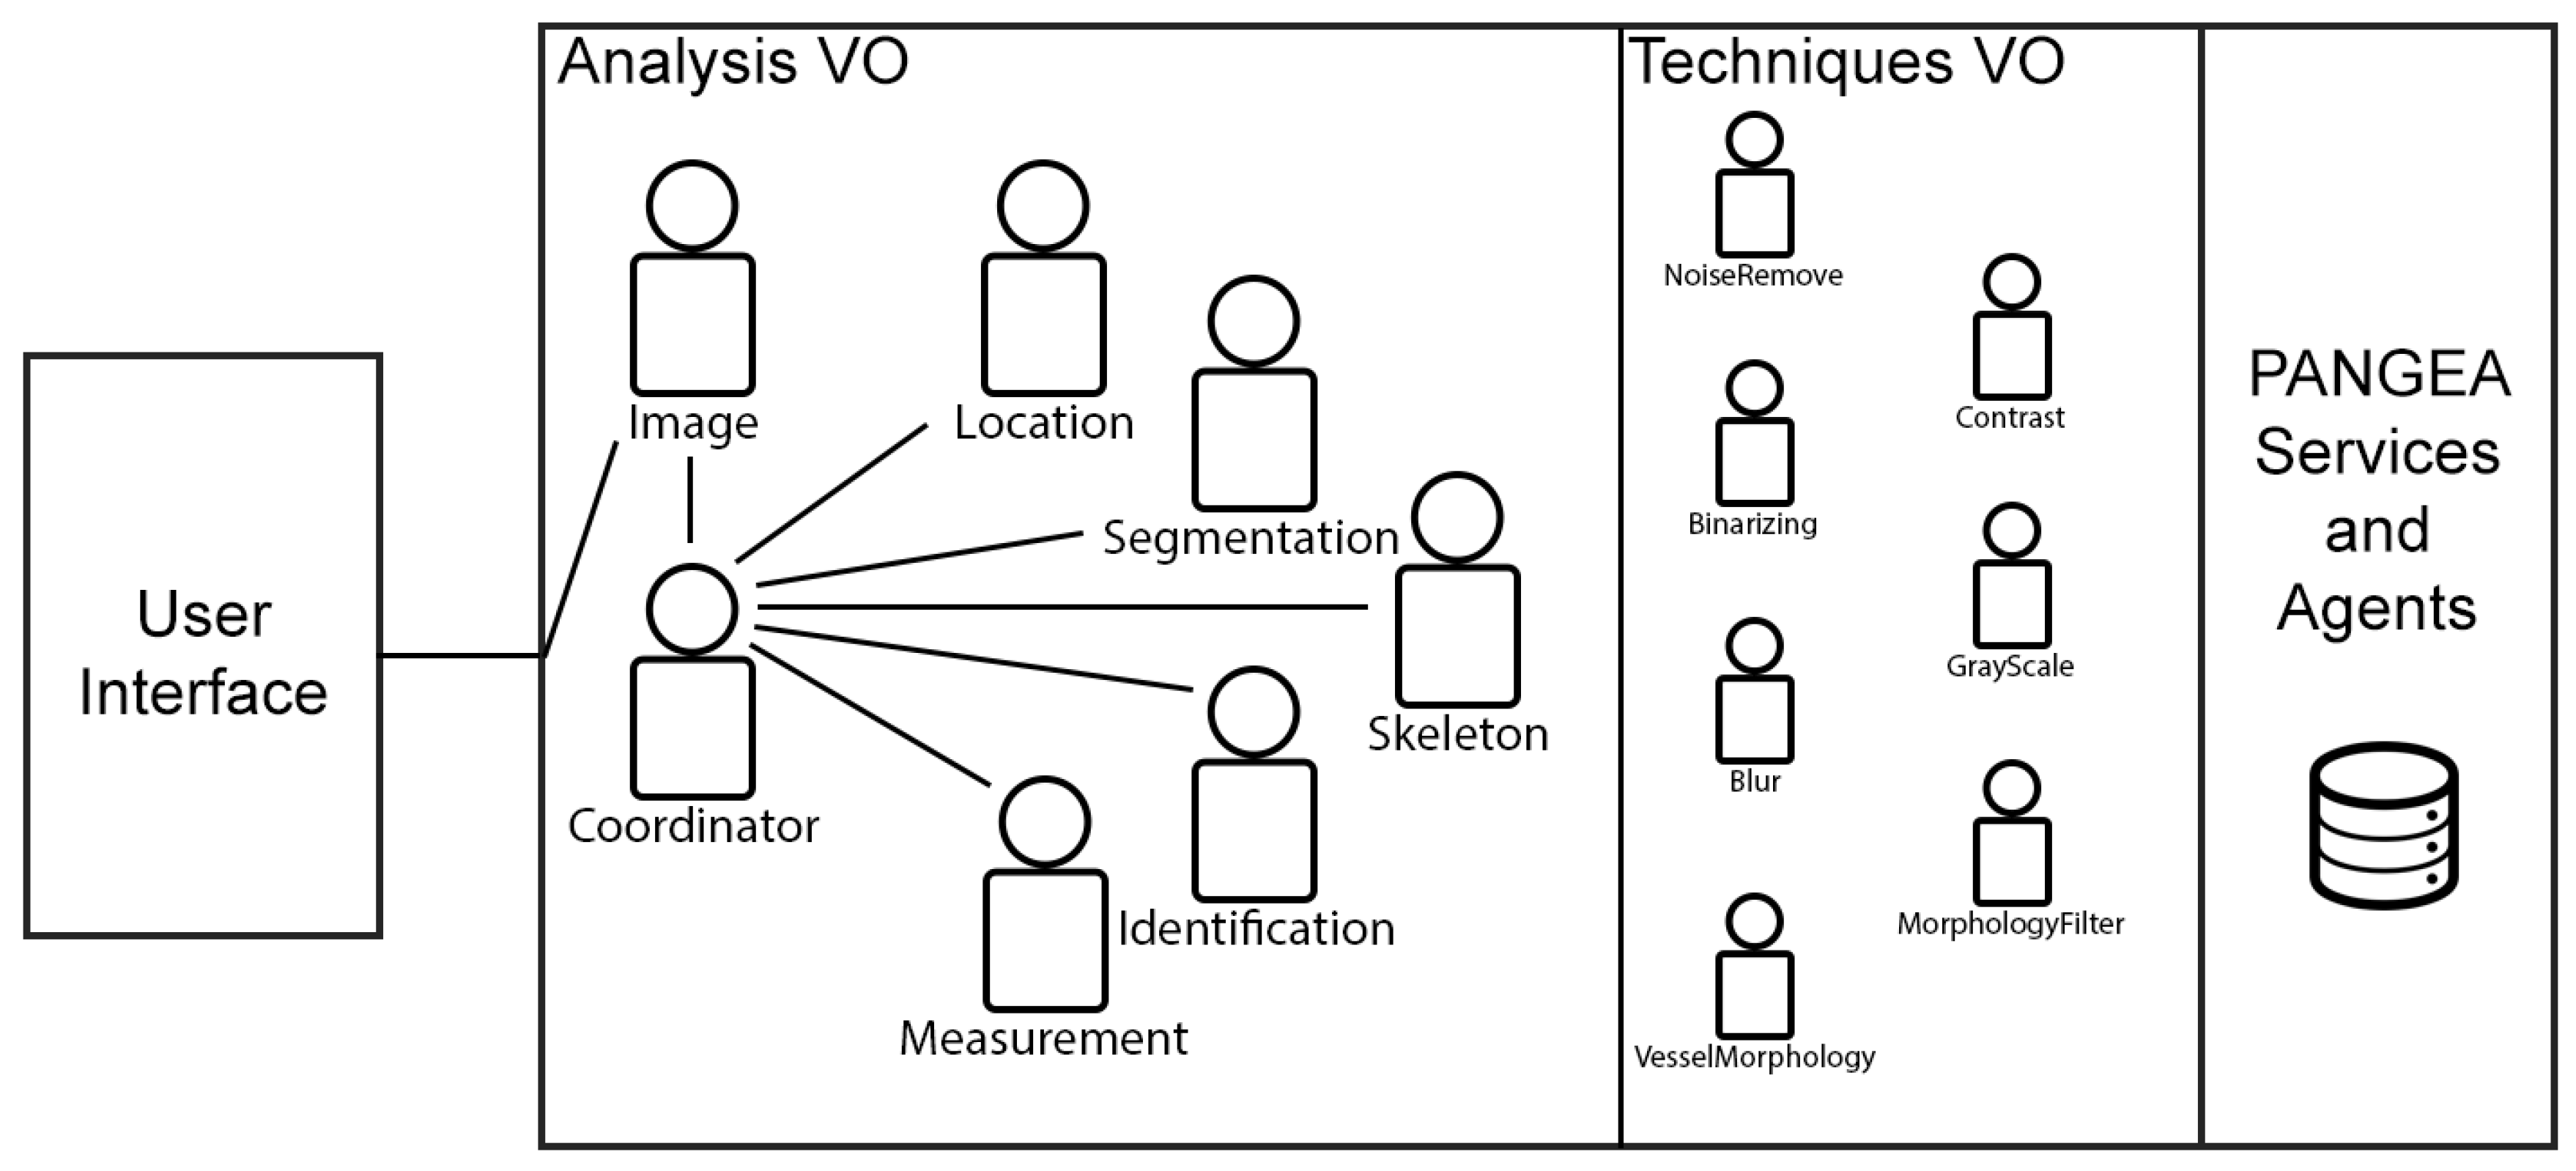
3. Virtual Organizations
4. Automatic Image Analyzer to Assess Retinal Vessel Caliber (ALTAIR): A Virtual Organization Based Fundus Image Analyzer Platform
4.1. Virtual Organizations
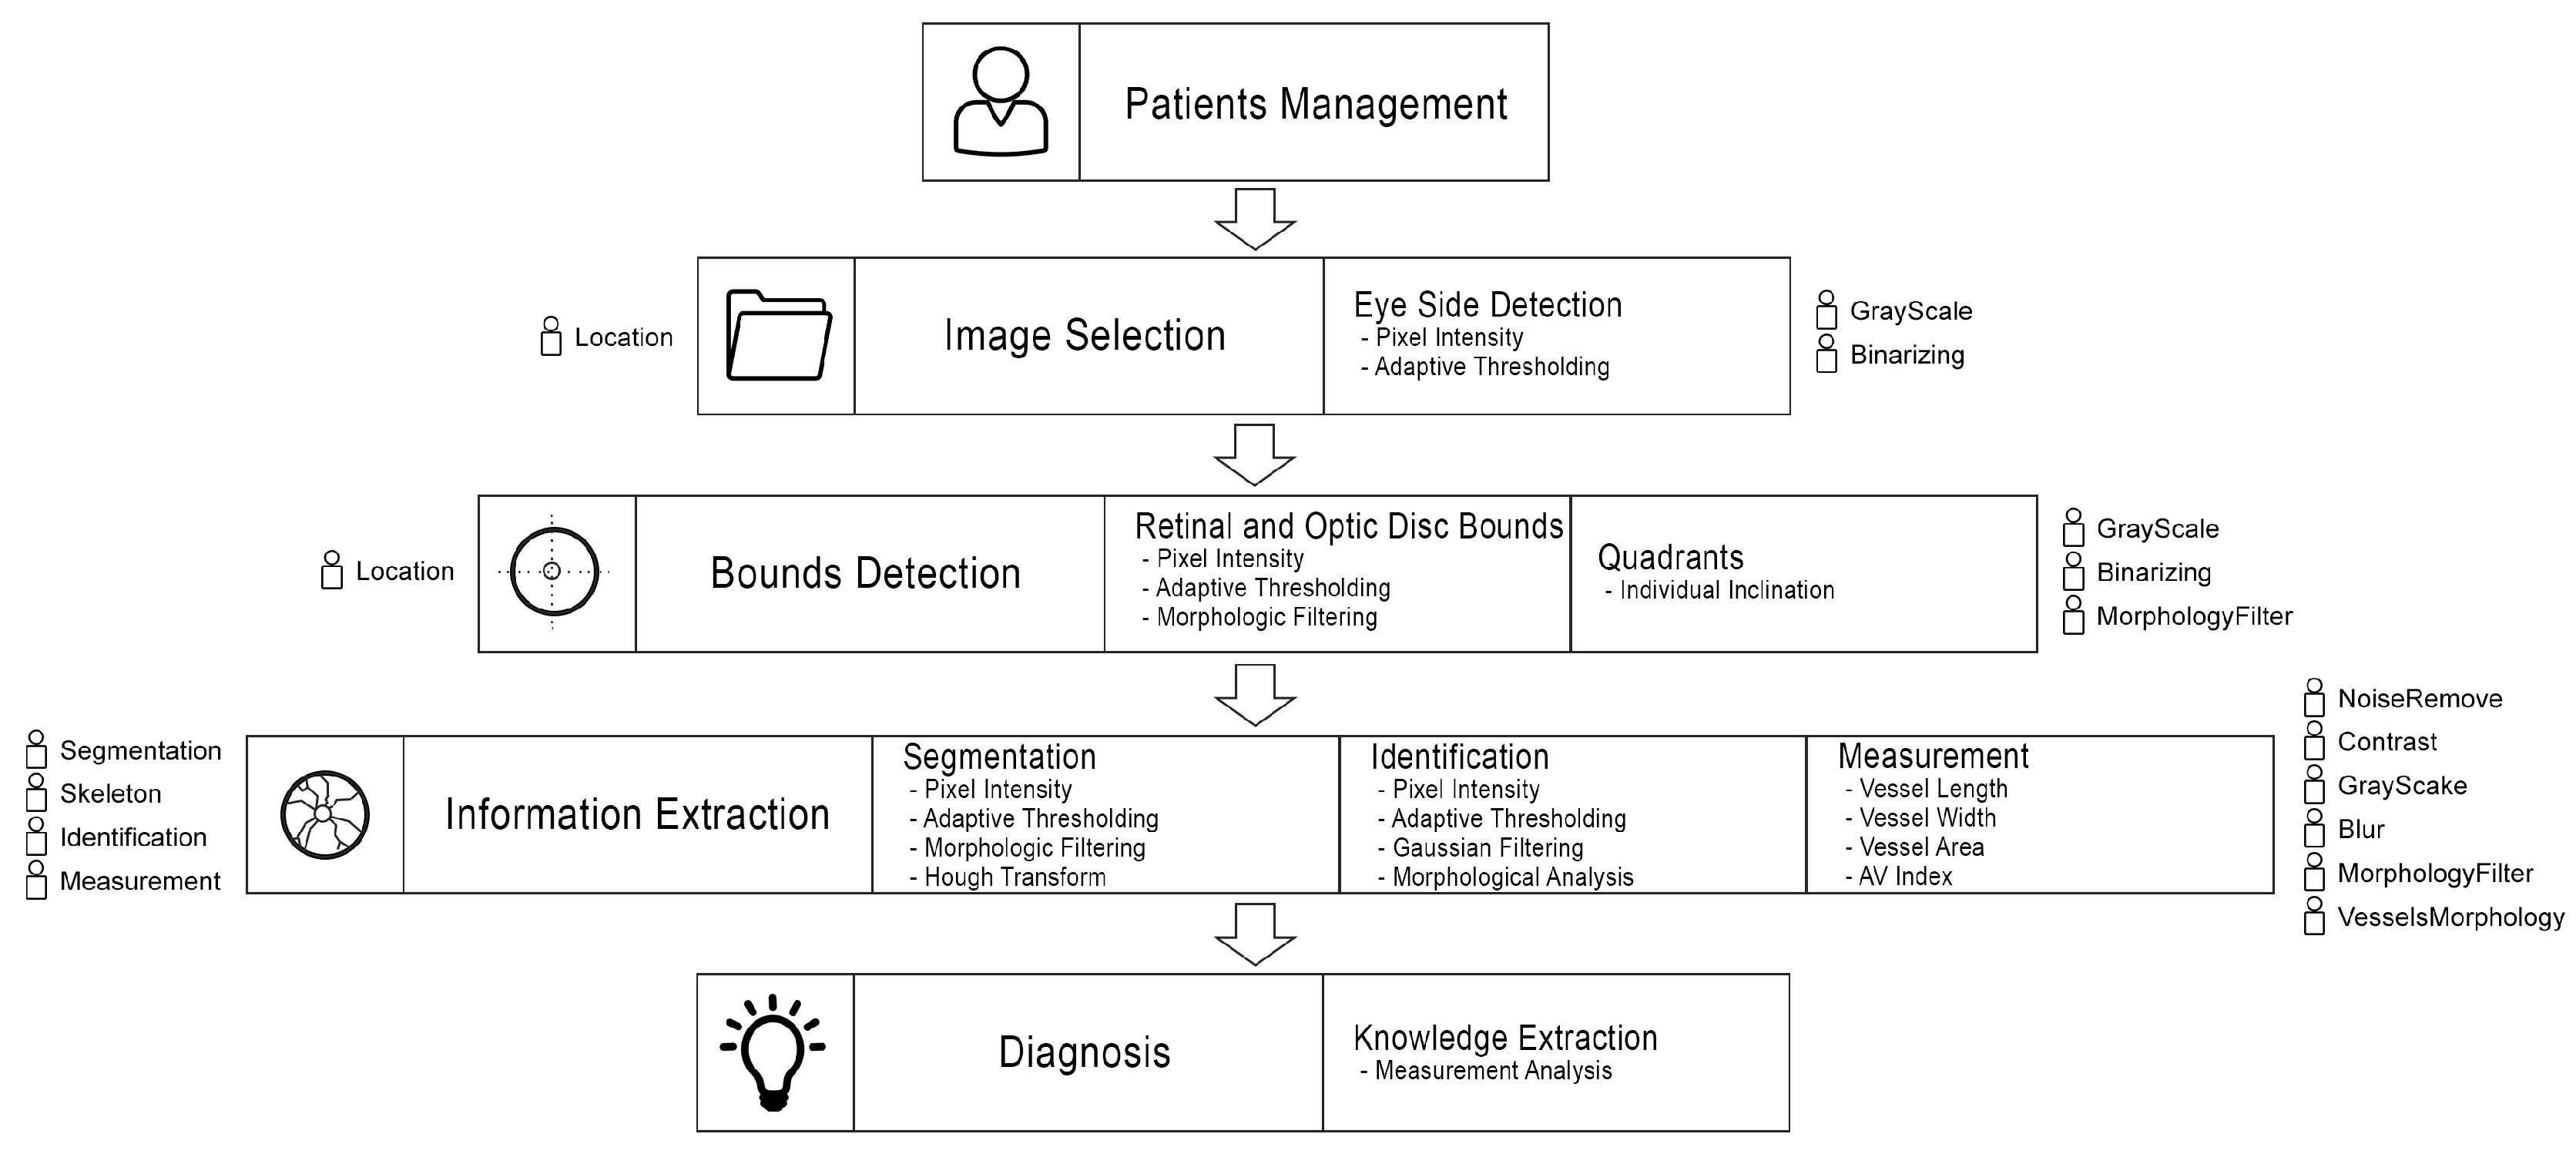
4.2. Information Extraction Methodology
4.2.1. Image Selection (Eye Side Detection)
| Algorithm 1: Eye side detection |
| // w and h are the image I width and height Input: Output: // ; ; // ; ; ; ; if then | ; else | ; end |
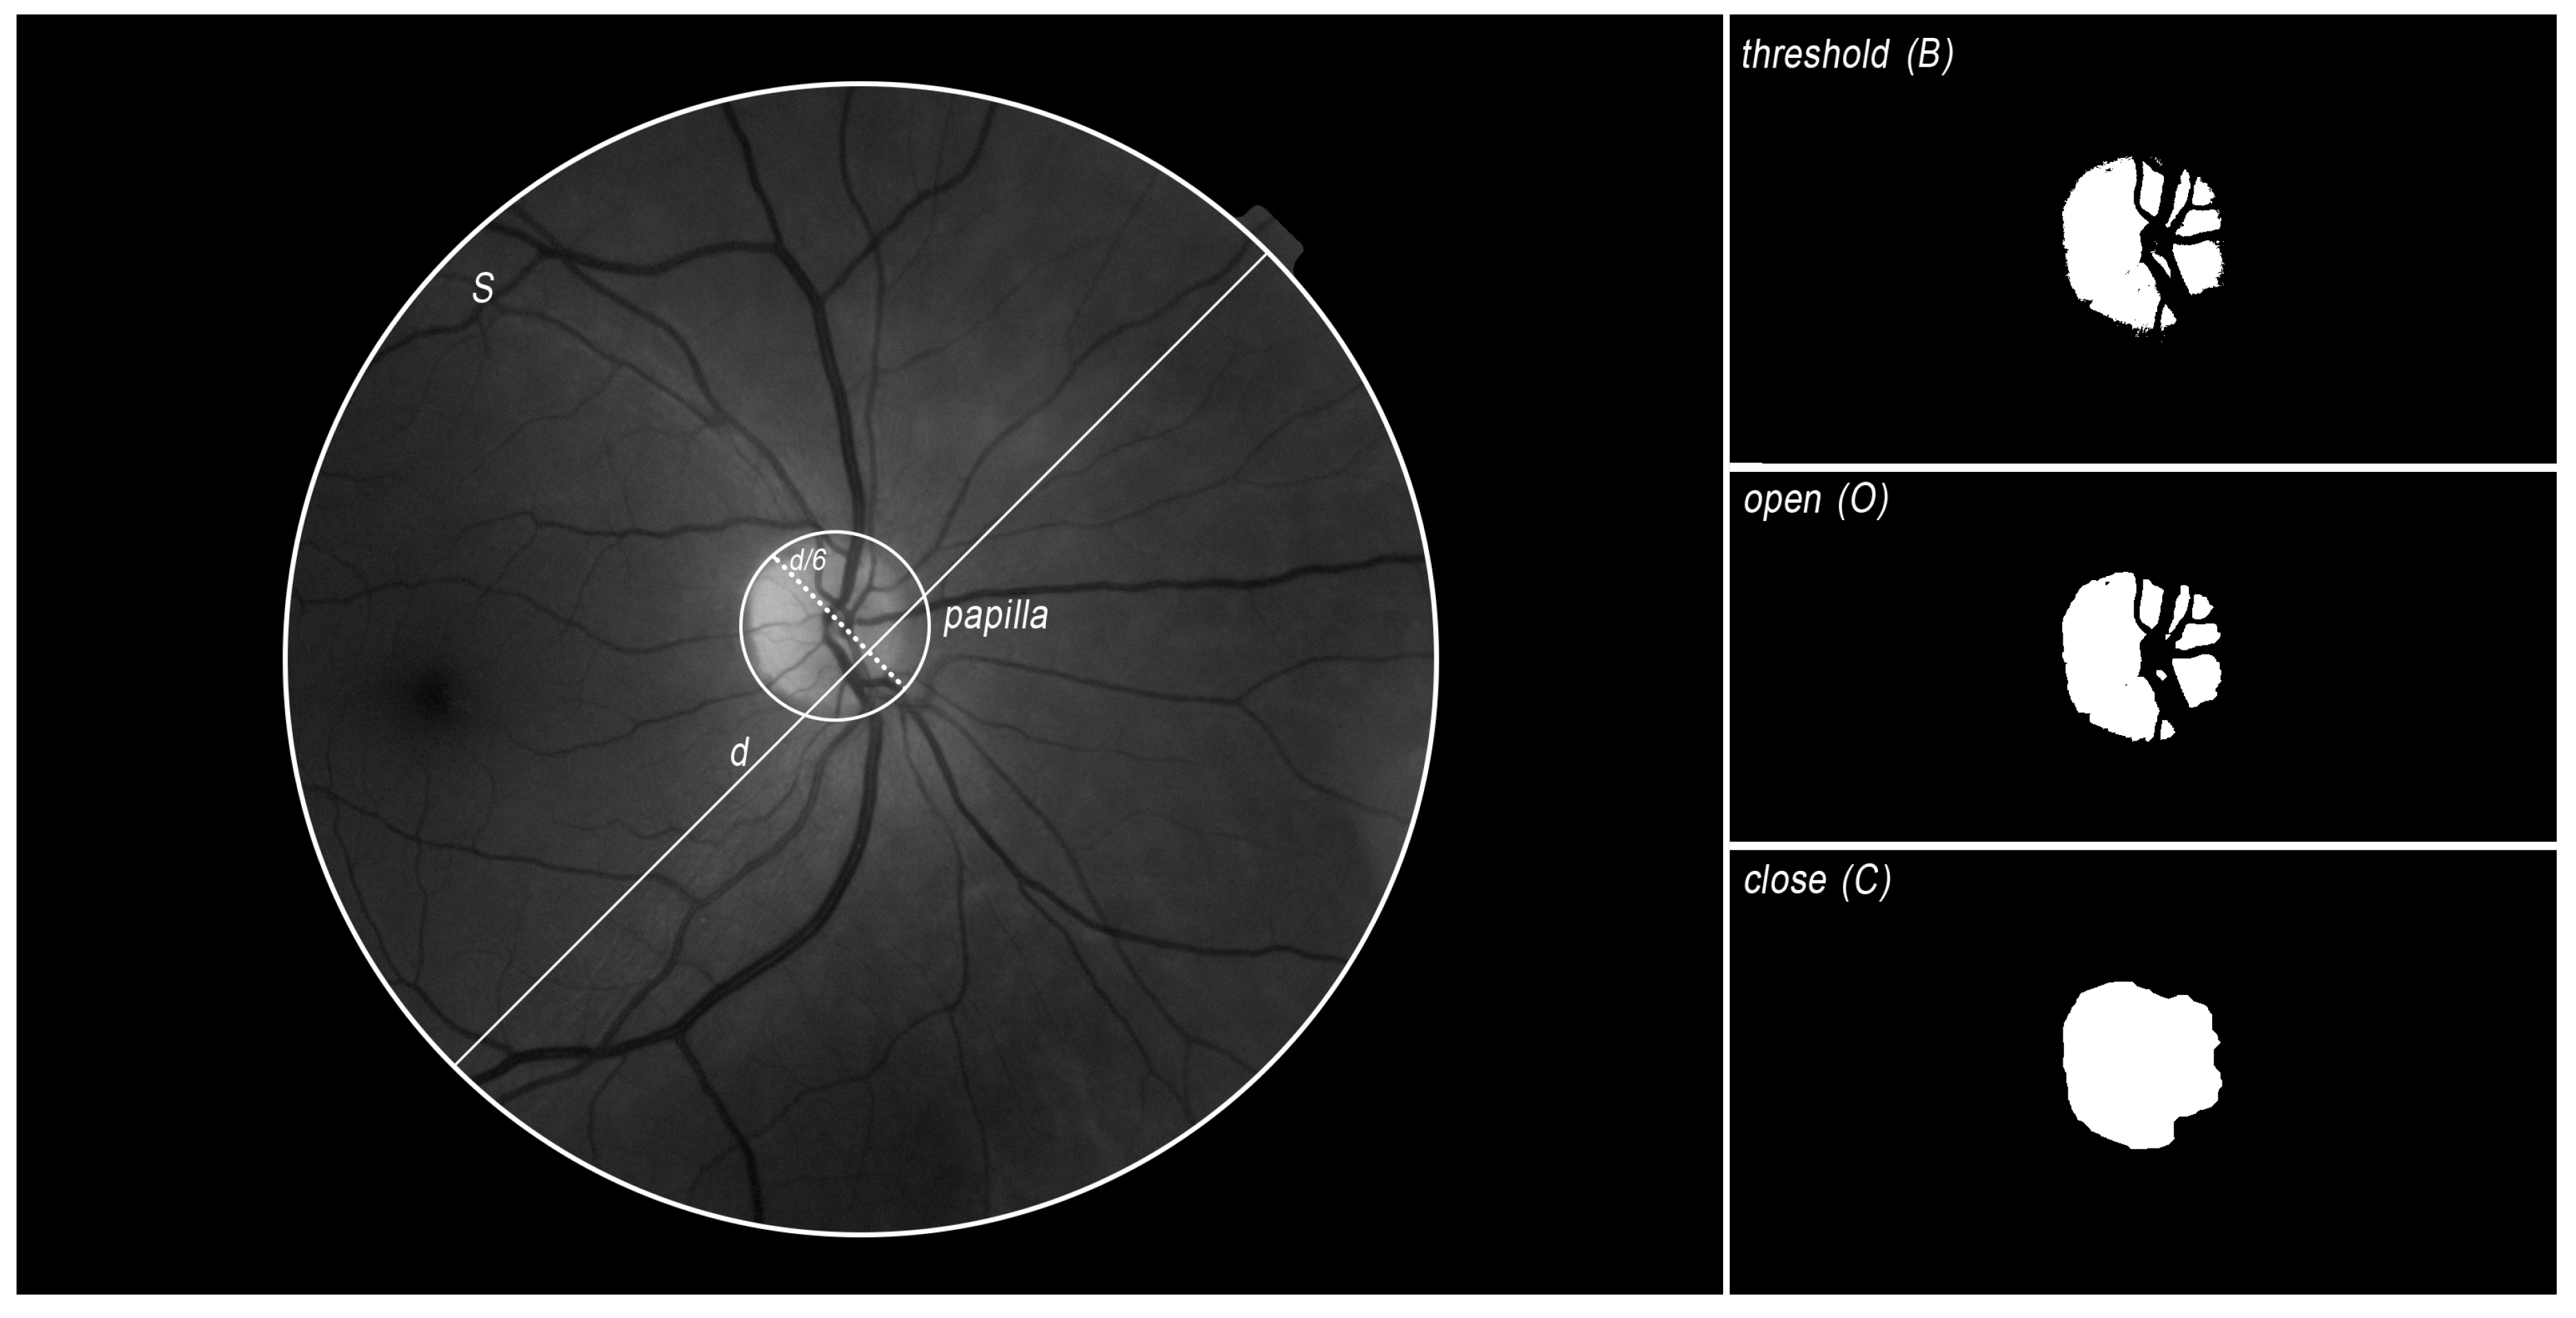
4.2.2. Bounds Detection
| Algorithm 2: Retina edge detection |
| // w, h and d are the image I width, height and diameter Input: Output: d ; // c is the background color, is the number of c color point // is the initial diameter point, is the end diameter point ; ; ; ; ; for to w do  end |
| Algorithm 3: Optic disc location |
| // is the x coord of the retina center, is the y coord of the retina center and d is the diameter of the retina // is the x,y coords of the papilla Input: Output: // ; ; // Papilla size is always about 6 times lower than the the retina ; ; ; ; // Open filter to erode and dilate the image B ; // Fill gaps in the image O ; ; ; ; |
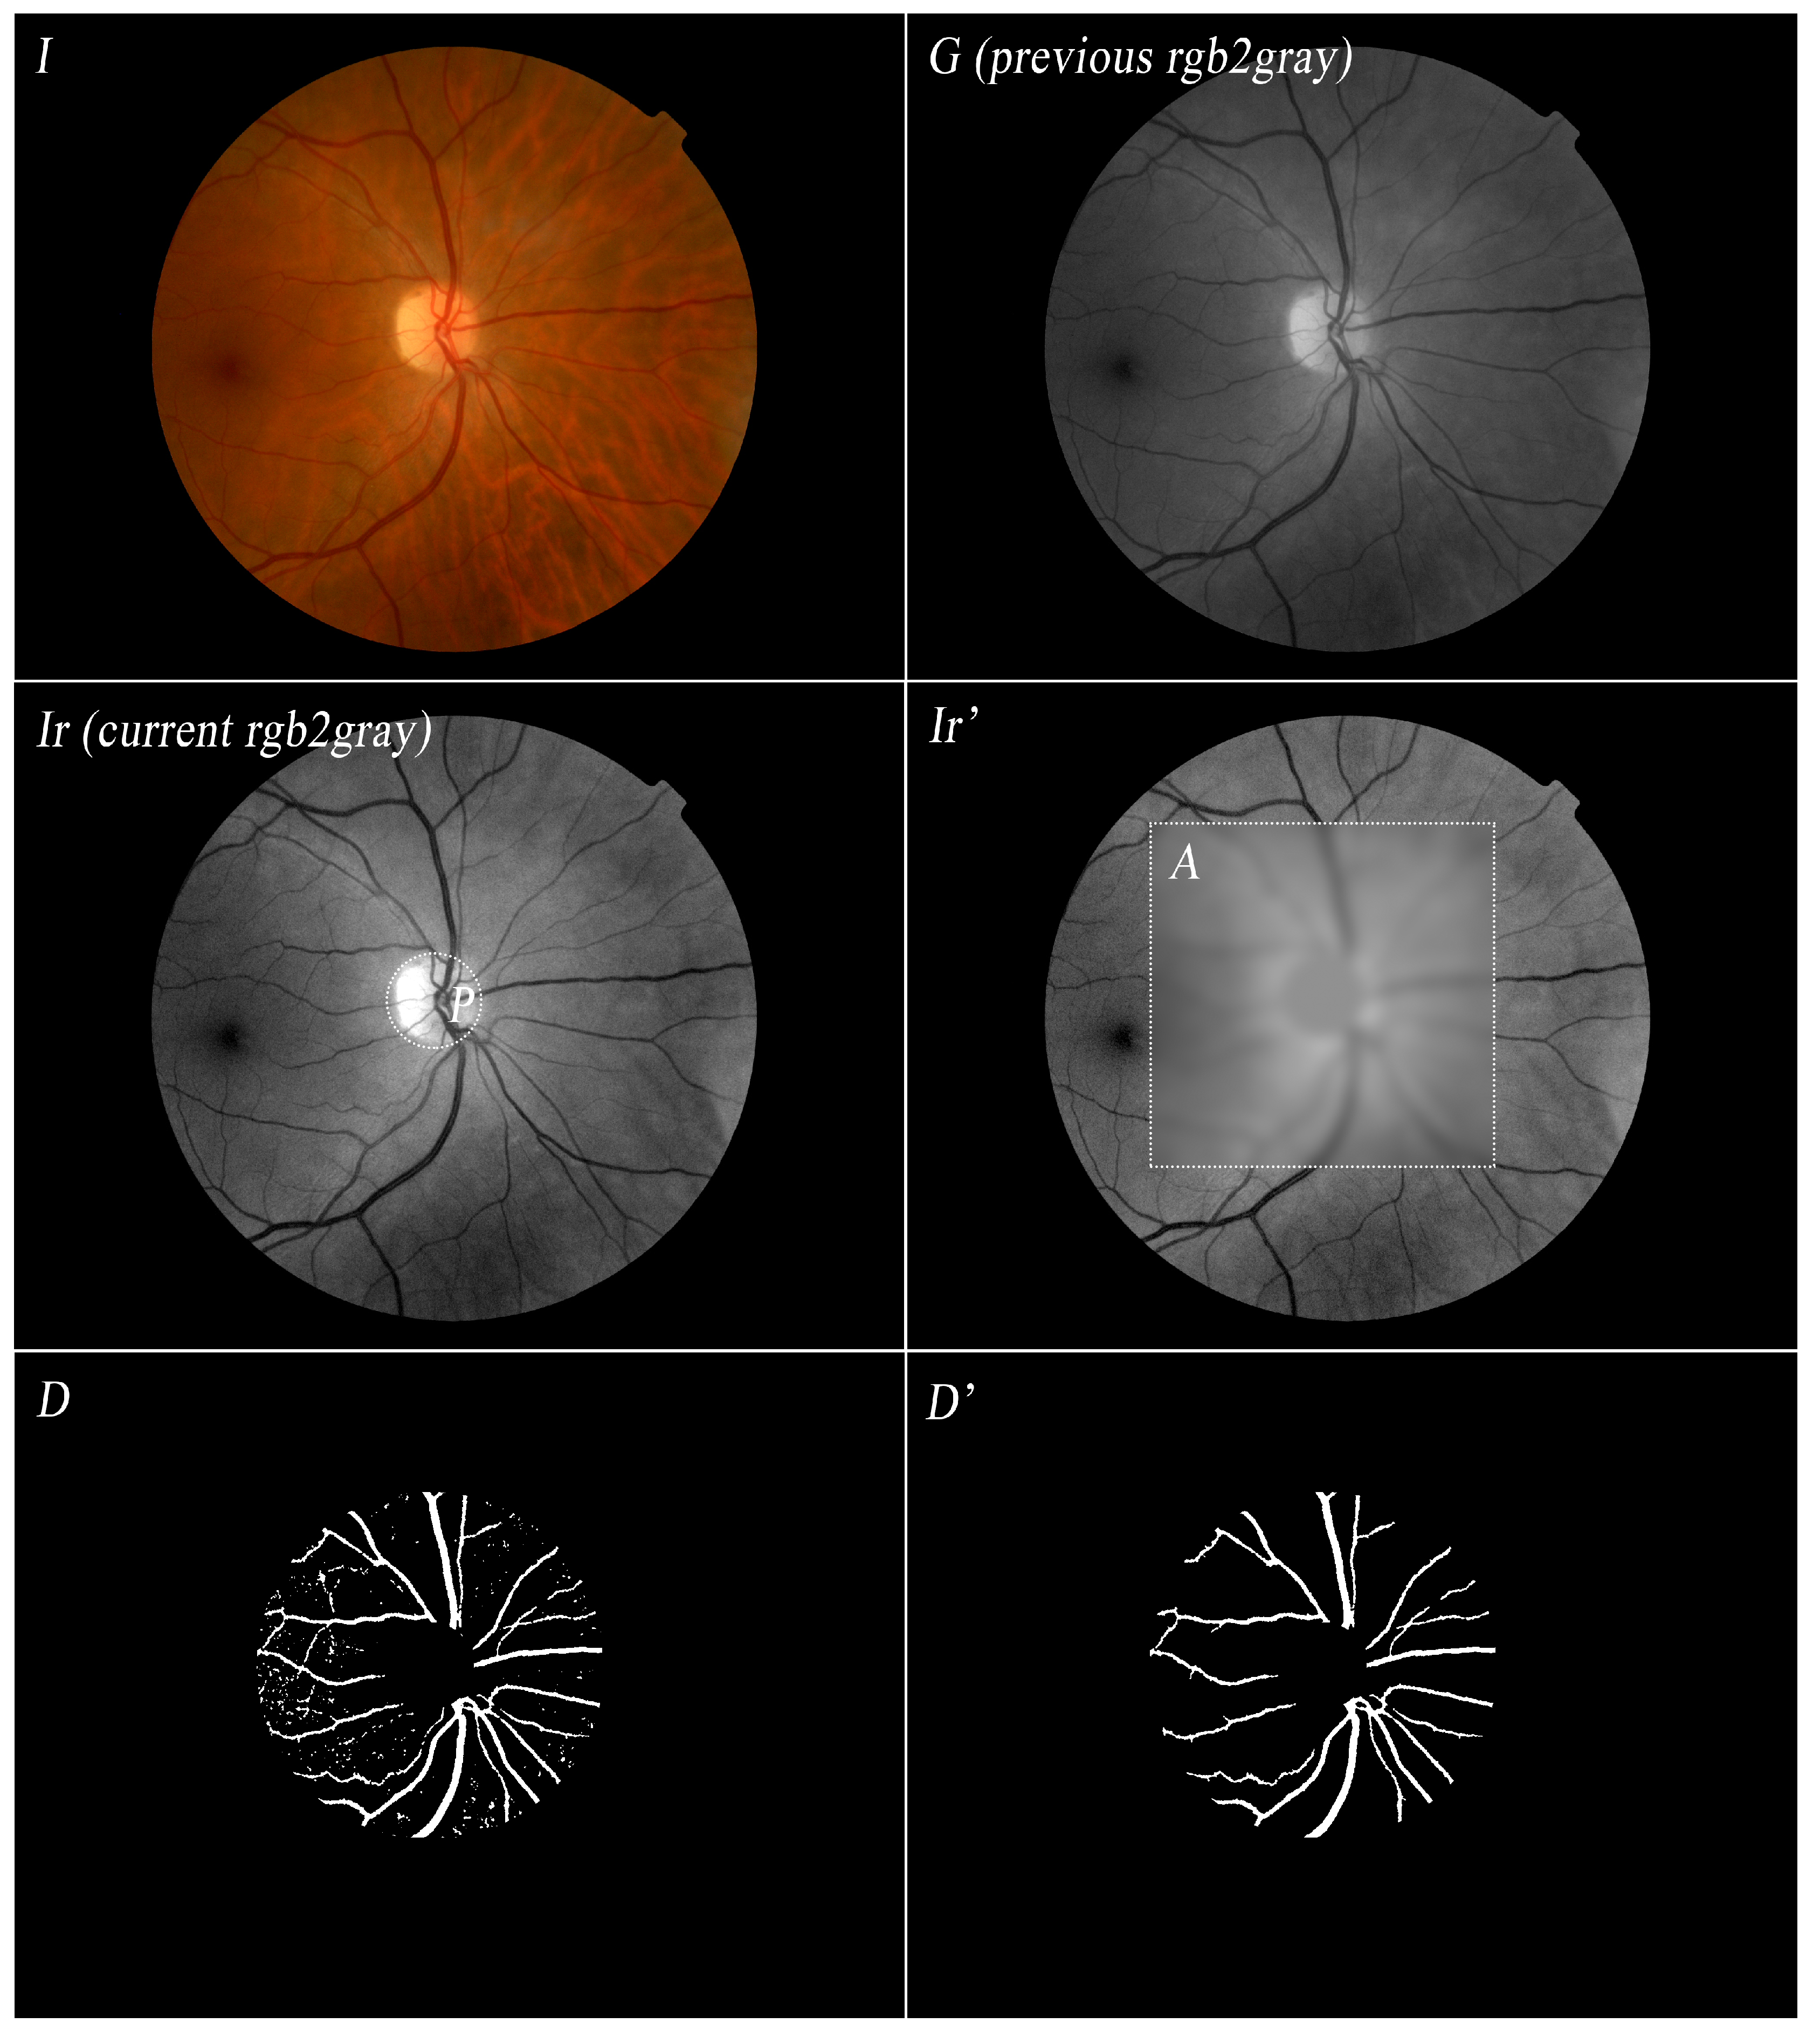
4.2.3. Segmentation
| Algorithm 4: Vessels detection |
| // is the x coord of the papilla center, is the y coord of the papilla center and is the radio of the papilla // is image with the detected vessels in white and the other points in black Input: Output: // ; // P contains all the papilla points ; ; ; // Change papilla color with the closest background mean color to avoid noise when applying gaussian filters ; // Analysis area goes from the papilla limit to 3 times its radio size ; // ; ; ; // ; // Grayscale: 0 black; 255 white ; ; ; ; // Remove noise: blobs whose area is lower than papilla diameter (all vessels must be bigger) ; ; ; ; |
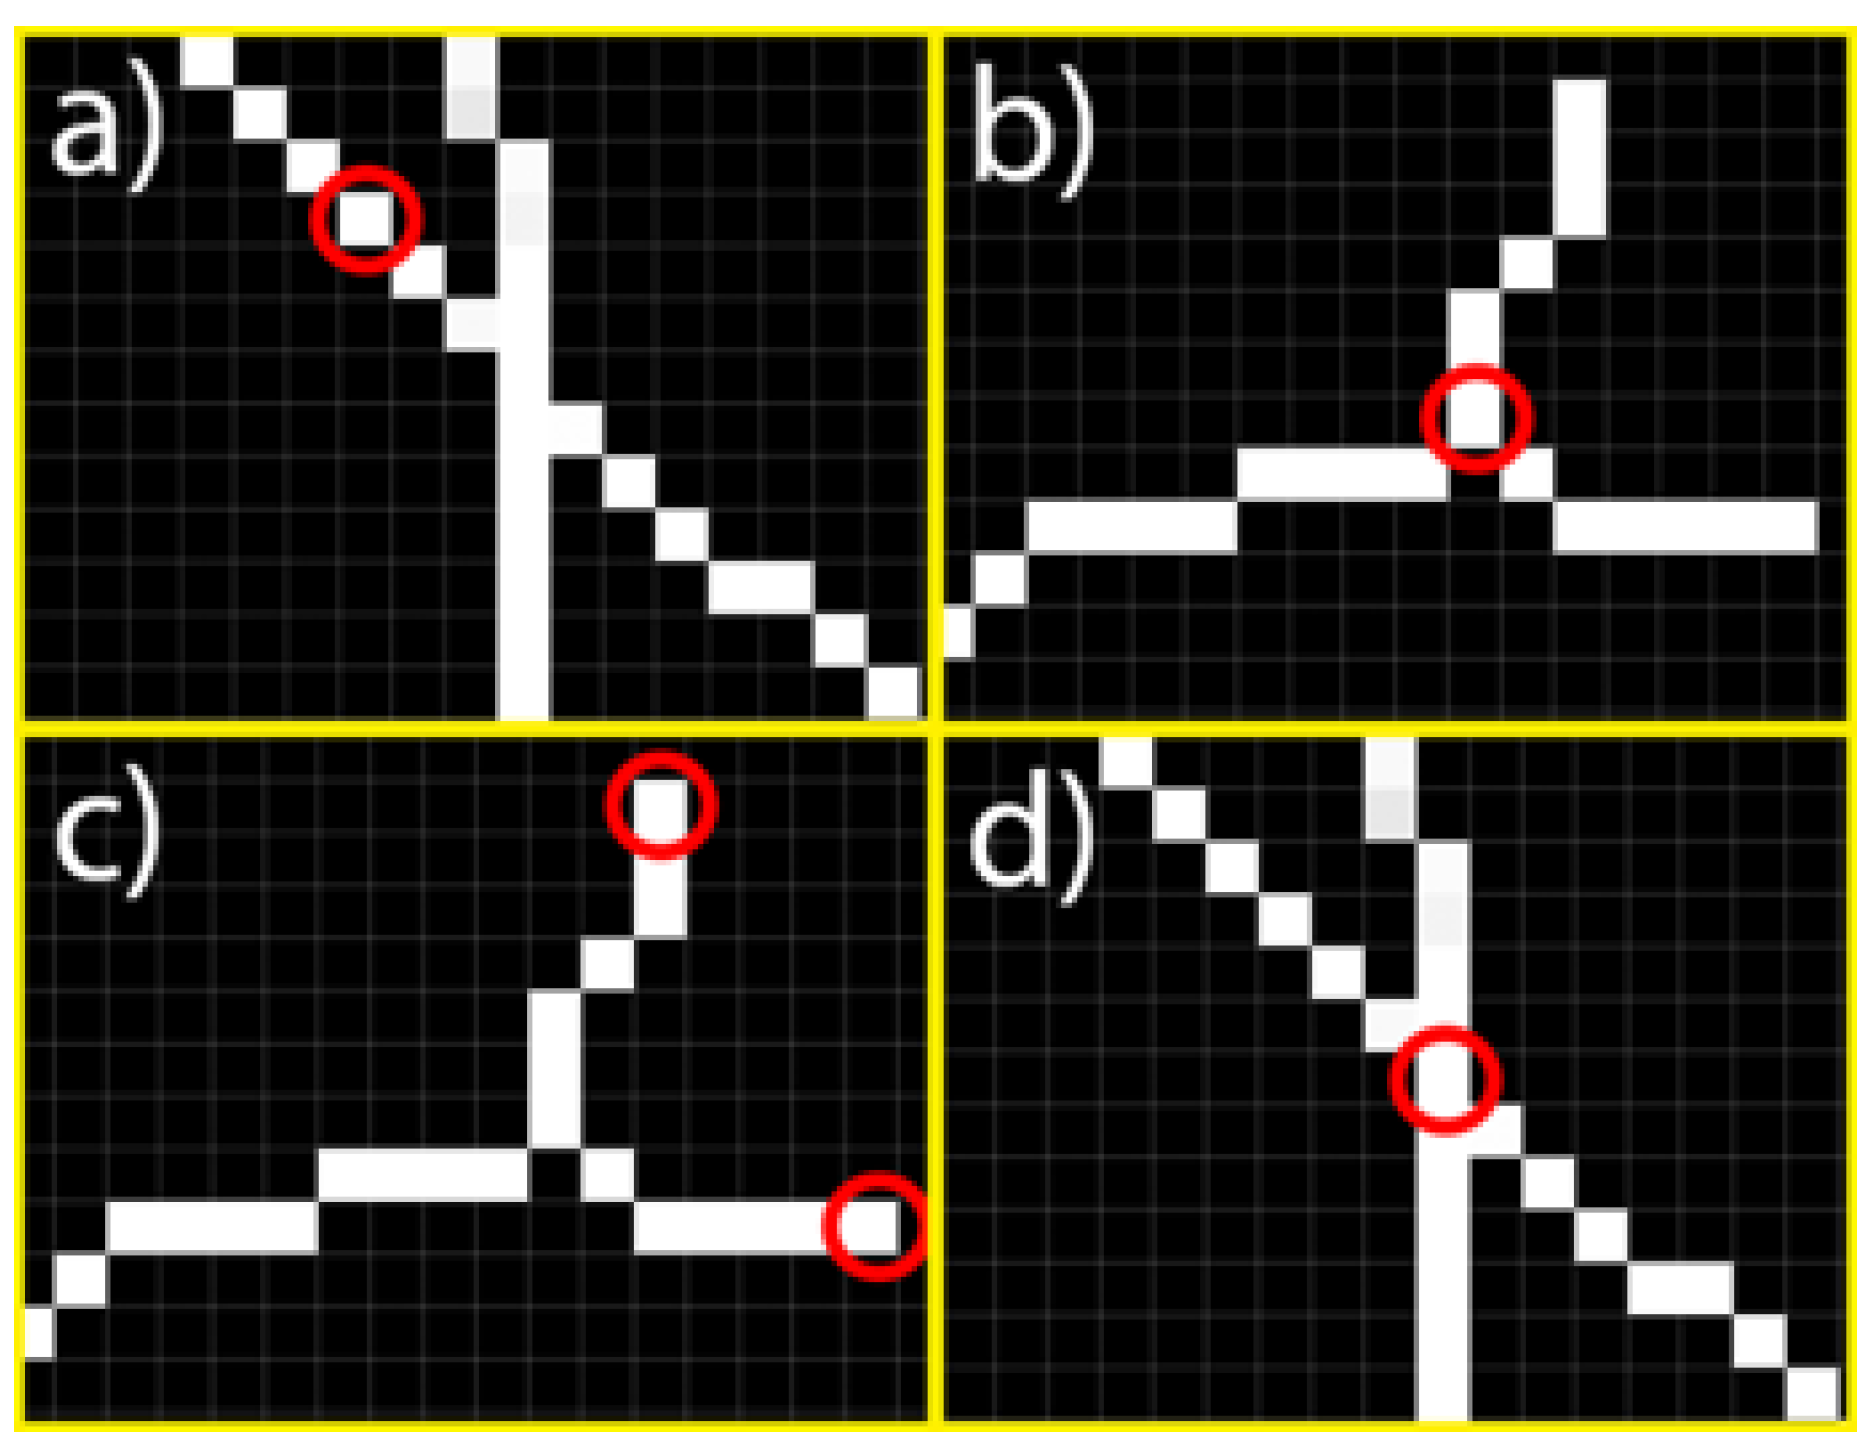
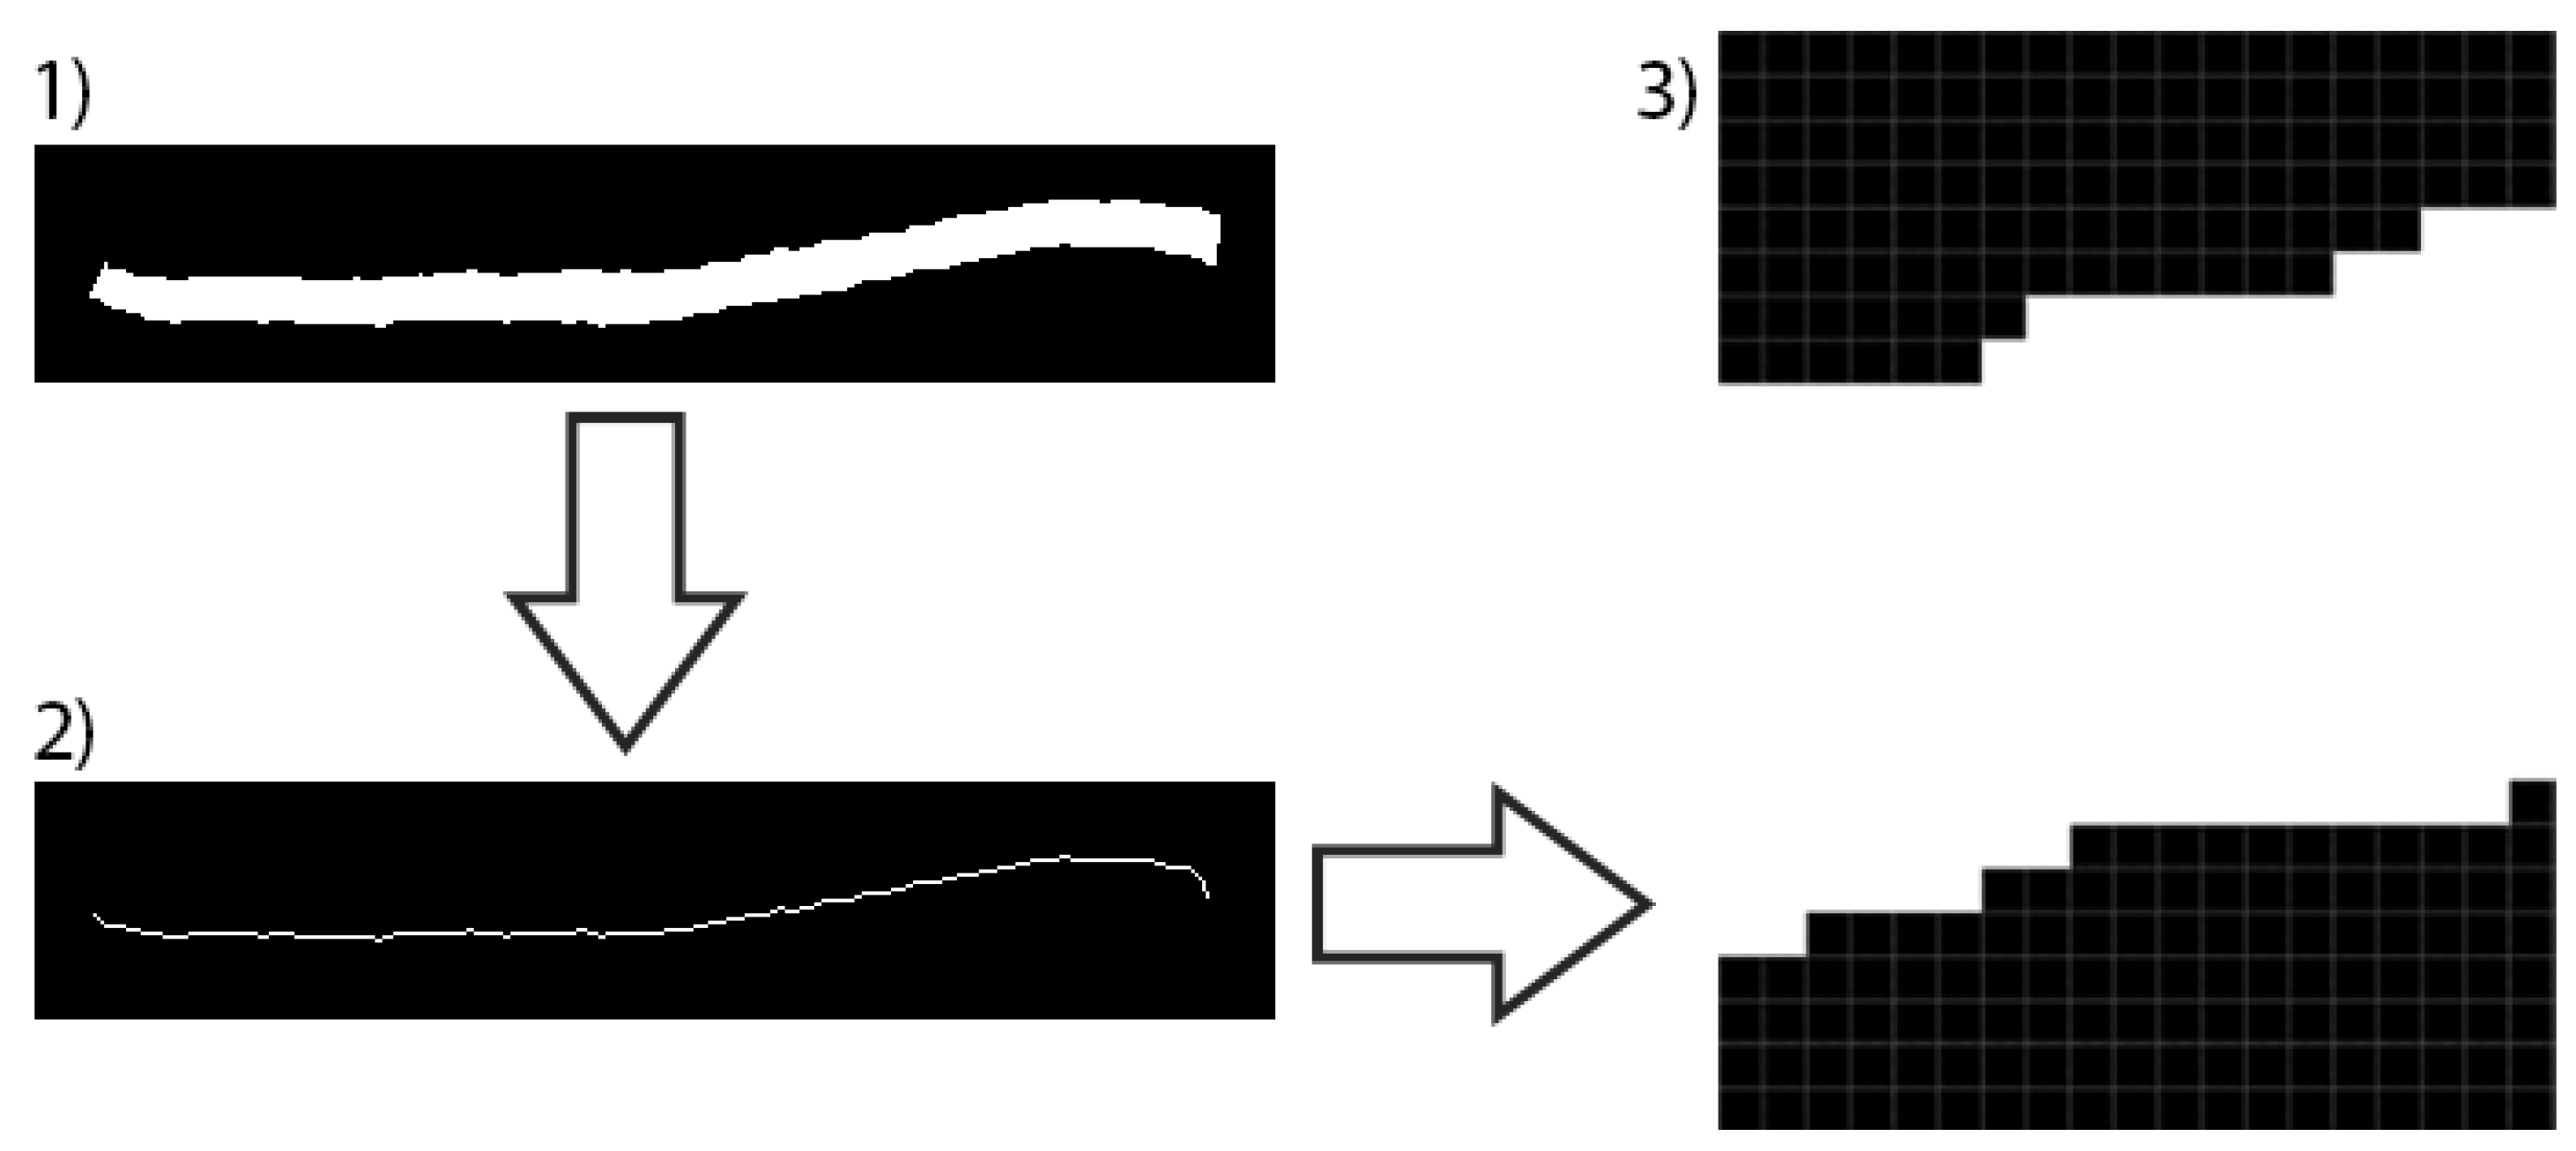
| Algorithm 5: Skeleton and segment extraction |
| // is the x coord of the papilla center, is the y coord of the papilla center and is the radio of the papilla // is the infrared-grayscaled image is a binary image with the detected vessels in white and the other points in black // is a binary image with the vessels skeleton and is the image with the vessels skeleton represented by the image background points // is a subset with the skeleton of all the segments Input: Output: // // A contains all the points of the analyzed area ; // Get skeleton image () and a new one from it () with the closest (distance of ) background mean instead of white // ; // contains the set of background points of the retina at a distance of ; ; ; // Get all white points type from image (based on the number of neighbors) // ; ; // See Figure 5 // Get all segments ; |
4.2.4. Identification
4.3. Diagnosis
| Algorithm 6: Vessels and segments identification |
| // A is the set of segments which have been identified as arteries, V is the set of segments which have been identified as arteries Input: Output: ; while do  end |
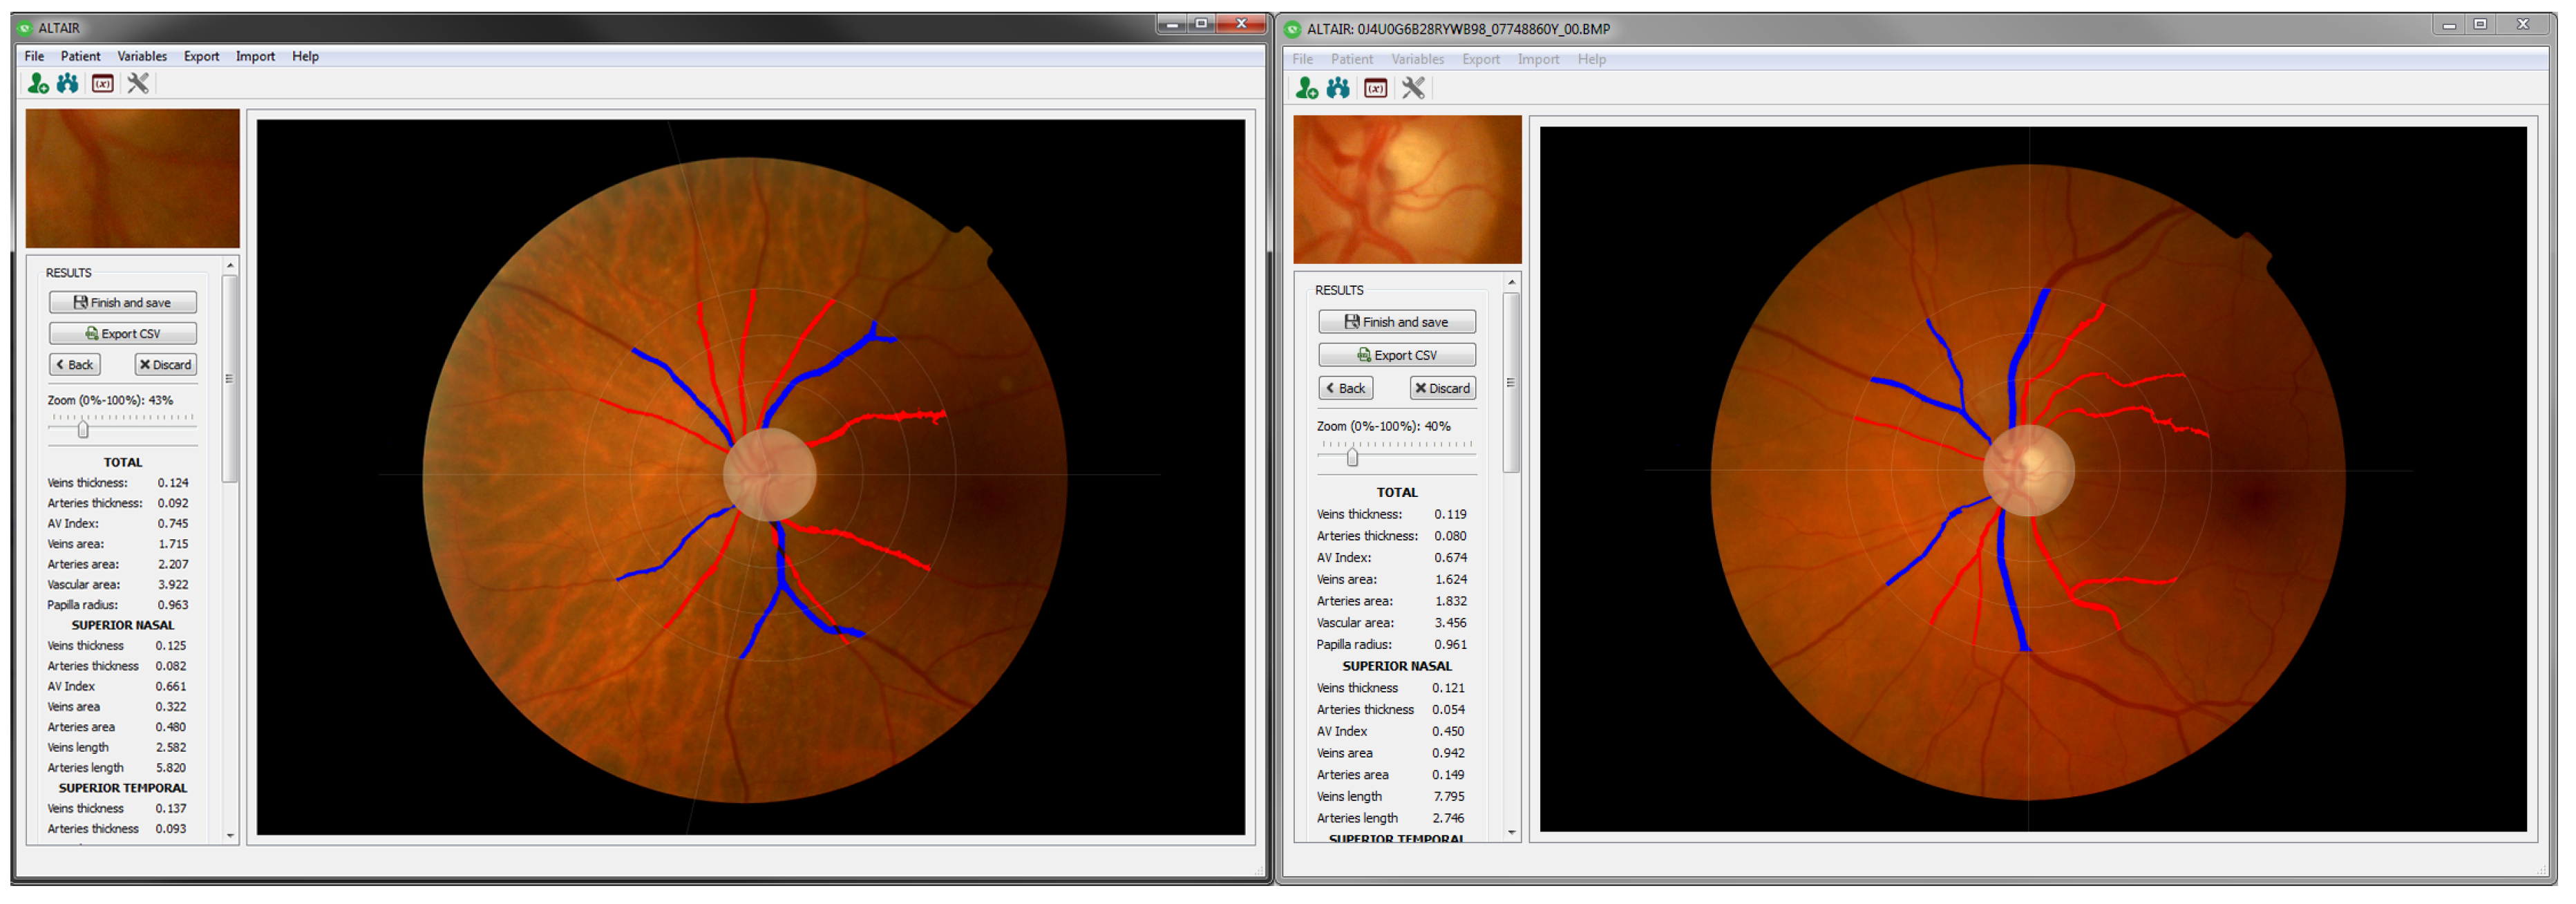
5. Results
6. Conclusions
Author Contributions
Funding
Conflicts of Interest
References
- Sánchez, A.; Villarrubia, G.; Zato, C.; Rodríguez, S.; Chamoso, P. A gateway protocol based on FIPA-ACL for the new agent platform PANGEA. In Trends in Practical Applications of Agents and Multiagent Systems; Springer: Cham, Switzerland, 2013; pp. 41–51. [Google Scholar]
- Macía, I.; Graña, M.; Paloc, C. Knowledge management in image-based analysis of blood vessel structures. Knowl. Inf. Syst. 2012, 30, 457–491. [Google Scholar] [CrossRef]
- Cheung, C.Y.L.; Ikram, M.K.; Sabanayagam, C.; Wong, T.Y. Retinal microvasculature as a model to study the manifestations of hypertension. Hypertension 2012, 60, 1094–1103. [Google Scholar] [CrossRef] [PubMed]
- Nguyen, T.T.; Wang, J.J.; Sharrett, A.R.; Islam, F.A.; Klein, R.; Klein, B.E.; Cotch, M.F.; Wong, T.Y. Relationship of Retinal Vascular Caliber with Diabetes and Retinopathy the Multi-Ethnic Study of Atherosclerosis (MESA). Diabetes Care 2008, 31, 544–549. [Google Scholar] [CrossRef] [PubMed]
- Ortega, M.; Barreira, N.; Novo, J.; Penedo, M.G.; Pose-Reino, A.; Gómez-Ulla, F. Sirius: A web-based system for retinal image analysis. Int. J. Med. Inform. 2010, 79, 722–732. [Google Scholar] [CrossRef] [PubMed]
- Sanchez, C.I.; Hornero, R.; López, M.I.; Aboy, M.; Poza, J.; Abasolo, D. A novel automatic image processing algorithm for detection of hard exudates based on retinal image analysis. Med. Eng. Phys. 2008, 30, 350–357. [Google Scholar] [CrossRef] [PubMed] [Green Version]
- Ege, B.M.; Hejlesen, O.K.; Larsen, O.V.; Møller, K.; Jennings, B.; Kerr, D.; Cavan, D.A. Screening for diabetic retinopathy using computer based image analysis and statistical classification. Comput. Methods Programs Biomed. 2000, 62, 165–175. [Google Scholar] [CrossRef]
- Martinez-Perez, M.E.; Hughes, A.D.; Thom, S.A.; Bharath, A.A.; Parker, K.H. Segmentation of blood vessels from red-free and fluorescein retinal images. Med. Image Anal. 2007, 11, 47–61. [Google Scholar] [CrossRef]
- Podoleanu, A.G.; Rosen, R.B. Combinations of techniques in imaging the retina with high resolution. Prog. Retin. Eye Res. 2008, 27, 464–499. [Google Scholar] [CrossRef]
- García-Ortiz, L.; Recio-Rodríguez, J.I.; Parra-Sanchez, J.; Elena, L.J.G.; Patino-Alonso, M.C.; Agudo-Conde, C.; Rodríguez-Sánchez, E.; Gómez-Marcos, M.A. A new tool to assess retinal vessel caliber. Reliability and validity of measures and their relationship with cardiovascular risk. J. Hypertens. 2012, 30, 770–777. [Google Scholar] [CrossRef]
- Lau, Q.P.; Lee, M.L.; Hsu, W.; Wong, T.Y.; Ng, E.Y.K.; Acharya, U.R.; Campillo, A.; Suri, J.S. The singapore eye vessel assessment system. Image Anal. Model. Ophthalmol. 2014, 143–160. [Google Scholar] [CrossRef]
- Perez-Rovira, A.; MacGillivray, T.; Trucco, E.; Chin, K.S.; Zutis, K.; Lupascu, C.; Tegolo, D.; Giachetti, A.; Wilson, P.; Doney, A.; et al. VAMPIRE: Vessel assessment and measurement platform for images of the REtina. In Proceedings of the 2011 Annual International Conference of the IEEE Engineering in Medicine and Biology Society, Boston, MA, USA, 30 August–3 September 2011; pp. 3391–3394. [Google Scholar]
- GeethaRamani, R.; Balasubramanian, L. Retinal blood vessel segmentation employing image processing and data mining techniques for computerized retinal image analysis. Biocybern. Biomed. Eng. 2016, 36, 102–118. [Google Scholar] [CrossRef]
- Alberola, J.M.; del Val, E.; Costa, A.; Novais, P.; Julian, V. A genetic algorithm for group formation in elderly communities. AI Commun. 2018, 31, 409–425. [Google Scholar] [CrossRef]
- Garcia-Ortiz, L.; Perez-Ramos, H.; Chamoso-Santos, P.; Recio-Rodriguez, J.I.; Garcia-Garcia, A.; Maderuelo-Fernandez, J.A.; Gomez-Sanchez, L.; Martínez-Perez, P.; Rodriguez-Martin, C.; De Cabo-Laso, A.; et al. Automatic Image Analyzer to Assess Retinal Vessel Caliber (altair) Tool Validation for the Analysis of Retinal Vessels. J. Hypertens. 2016, 34, e160. [Google Scholar] [CrossRef]
- Garcia-Ortiz, L.; Gómez-Marcos, M.A.; Recio-Rodríguez, J.I.; Maderuelo-Fernández, J.A.; Chamoso-Santos, P.; Rodríguez-González, S.; de Paz-Santana, J.F.; Merchan-Cifuentes, M.A.; Agudo-Conde, C. Validation of the automatic image analyser to assess retinal vessel calibre (ALTAIR): A prospective study protocol. BMJ Open 2014, 4, e006144. [Google Scholar] [CrossRef] [PubMed]
- Akil, H.; Huang, A.S.; Francis, B.A.; Sadda, S.R.; Chopra, V. Retinal vessel density from optical coherence tomography angiography to differentiate early glaucoma, pre-perimetric glaucoma and normal eyes. PLoS ONE 2017, 12, e0170476. [Google Scholar] [CrossRef] [PubMed]
- Tanabe, Y.; Kawasaki, R.; Wang, J.J.; Wong, T.Y.; Mitchell, P.; Daimon, M.; Oizumi, T.; Kato, T.; Kawata, S.; Kayama, T.; et al. Retinal arteriolar narrowing predicts 5 year risk of hypertension in Japanese people: The Funagata Study. Microcirculation 2010, 17, 94–102. [Google Scholar] [CrossRef] [PubMed]
- Wong, T.Y.; Duncan, B.B.; Golden, S.H.; Klein, R.; Couper, D.J.; Klein, B.E.; Hubbard, L.D.; Sharrett, A.; Schmidt, M.I. Associations between the metabolic syndrome and retinal microvascular signs: The Atherosclerosis Risk in Communities study. Investig. Ophthalmol. Vis. Sci. 2004, 45, 2949–2954. [Google Scholar] [CrossRef]
- Tikellis, G.; Arnett, D.K.; Skelton, T.N.; Taylor, H.W.; Klein, R.; Couper, D.J.; Richey Sharrett, A.; Wong, T.Y. Retinal arteriolar narrowing and left ventricular hypertrophy in African Americans. The Atherosclerosis Risk in Communities (ARIC) study. Am. J. Hypertens. 2008, 21, 352–359. [Google Scholar] [CrossRef]
- Yatsuya, H.; Folsom, A.R.; Wong, T.Y.; Klein, R.; Klein, B.E.; Sharrett, A.R. Retinal microvascular abnormalities and risk of lacunar stroke atherosclerosis risk in communities study. Stroke 2010, 41, 1349–1355. [Google Scholar] [CrossRef]
- Wong, T.Y.; Klein, R.; Sharrett, A.R.; Duncan, B.B.; Couper, D.J.; Tielsch, J.M.; Klein, B.E.; Hubbard, L.D. Retinal arteriolar narrowing and risk of coronary heart disease in men and women: The Atherosclerosis Risk in Communities Study. JAMA 2002, 287, 1153–1159. [Google Scholar] [CrossRef]
- Daxer, A. The fractal geometry of proliferative diabetic retinopathy: Implications for the diagnosis and the process of retinal vasculogenesis. Curr. Eye Res. 1993, 12, 1103–1109. [Google Scholar] [CrossRef] [PubMed]
- Mainster, M.A. The fractal properties of retinal vessels: Embryological and clinical implications. Eye 1990, 4, 235–241. [Google Scholar] [CrossRef] [PubMed] [Green Version]
- Tu, S.; Huang, Y.; Liu, G. CSFL: A novel unsupervised convolution neural network approach for visual pattern classification. AI Commun. 2017, 30, 311–324. [Google Scholar]
- Chapman, N.; Witt, N.; Gao, X.; Bharath, A.A.; Stanton, A.V.; Thom, S.A.; Hughes, A.D. Computer algorithms for the automated measurement of retinal arteriolar diameters. Br. J. Ophthalmol. 2001, 85, 74–79. [Google Scholar] [CrossRef] [PubMed] [Green Version]
- Matsopoulos, G.K.; Mouravliansky, N.A.; Delibasis, K.K.; Nikita, K.S. Automatic retinal image registration scheme using global optimization techniques. IEEE Trans. Inf. Technol. Biomed. 1999, 3, 47–60. [Google Scholar] [CrossRef] [PubMed] [Green Version]
- Zana, F.; Klein, J.C. A multimodal registration algorithm of eye fundus images using vessels detec-tion and Hough transform. IEEE Trans. Med. Imaging 1999, 18, 419–428. [Google Scholar] [CrossRef] [PubMed]
- Zana, F.; Klein, J.C. Robust segmentation of vessels from retinal angiography. In Proceedings of the 13th International Conference on Digital Signal Processing Proceedings, Santorini, Greece, 2–4 July 1997; Volume 2, pp. 1087–1090. [Google Scholar]
- Espona, L.; Carreira, M.J.; Ortega, M.; Penedo, M.G. A snake for retinal vessel segmentation. In Iberian Conference on Pattern Recognition and Image Analysis; Springer: Berlin/Heidelberg, Germany, 2007; pp. 178–185. [Google Scholar]
- Zhu, P.; Huang, F.; Lin, F.; Li, Q.; Yuan, Y.; Gao, Z.; Chen, F. The relationship of retinal vessel diameters and fractal dimensions with blood pressure and cardiovascular risk factors. PLoS ONE 2014, 9, e106551. [Google Scholar] [CrossRef]
- Chamoso, P.; Pérez-Ramos, H.; García-García, A. ALTAIR: Supervised Methodology to Obtain Retinal Vessels Caliber. Adv. Distrib. Comput. Artif. Intell. J. 2014, 3, 48–57. [Google Scholar] [CrossRef]
- Winder, R.J.; Morrow, P.J.; McRitchie, I.N.; Bailie, J.R.; Hart, P.M. Algorithms for digital image processing in diabetic retinopathy. Comput. Med. Imaging Graph. 2009, 33, 608–622. [Google Scholar] [CrossRef]
- Chamoso, P.; De Paz, J.F.; De La Prieta, F.; Bajo Pérez, J. Agreement technologies applied to transmission towers maintenance. AI Commun. 2017, 30, 83–98. [Google Scholar] [CrossRef]
- Mena, J.B. Vectorización automática de una imagen binaria mediante K-means y degeneración de la triangulación de Delaunay. Revista de la Asociación Espanola de Teledetección 2002, 7, 21–29. [Google Scholar]
- Franklin, S.W.; Rajan, S.E. Computerized screening of diabetic retinopathy employing blood vessel segmentation in retinal images. Biocybern. Biomed. Eng. 2014, 34, 117–124. [Google Scholar] [CrossRef]
- Lam, B.S.; Gao, Y.; Liew, A.W.C. General retinal vessel segmentation using regularization-based multiconcavity modeling. IEEE Trans. Med. Imaging 2010, 29, 1369–1381. [Google Scholar] [CrossRef] [PubMed]
- Chaudhuri, S.; Chatterjee, S.; Katz, N.; Nelson, M.; Goldbaum, M. Detection of blood vessels in retinal images using two-dimensional matched filters. IEEE Trans. Med. Imaging 1989, 8, 263–269. [Google Scholar] [CrossRef] [PubMed]


| Success (%) /Stage | Eye Side | Retina | Papilla | Segment. | Ident. |
|---|---|---|---|---|---|
| Proposed System | 100% | 100% | 99% | 95% | 91% |
| GeethaRaman et al. (2016) [13] | - | - | - | 95.36% | - |
| Franklin et al. (2014) [36] | - | - | - | 95.03% | - |
| Lam et al. (2010) [37] | - | - | - | 94.72% | - |
| Chaudhuri et al. (1989) [38] | - | - | - | 87.73% | - |
| vThck | aThck | vArea | aArea | vLength | aLength | AVIndex |
|---|---|---|---|---|---|---|
| 0.119359 | 0.0804724 | 1.62384 | 1.83216 | 13.6046 | 22.7675 | 0.674203 |
© 2018 by the authors. Licensee MDPI, Basel, Switzerland. This article is an open access article distributed under the terms and conditions of the Creative Commons Attribution (CC BY) license (http://creativecommons.org/licenses/by/4.0/).
Share and Cite
Chamoso, P.; Rodríguez, S.; García-Ortiz, L.; Corchado, J.M. Information Extraction from Retinal Images with Agent-Based Technology. Processes 2018, 6, 254. https://doi.org/10.3390/pr6120254
Chamoso P, Rodríguez S, García-Ortiz L, Corchado JM. Information Extraction from Retinal Images with Agent-Based Technology. Processes. 2018; 6(12):254. https://doi.org/10.3390/pr6120254
Chicago/Turabian StyleChamoso, Pablo, Sara Rodríguez, Luis García-Ortiz, and Juan Manuel Corchado. 2018. "Information Extraction from Retinal Images with Agent-Based Technology" Processes 6, no. 12: 254. https://doi.org/10.3390/pr6120254