1. Introduction
Gas and oil are important to many industries as well as the industrialization of civilization in general, and this is a concern for some countries. Oil accounts for a large share of global energy consumption, fluctuating from the lowest at 32% in Europe and Asia to 53% in the Middle East. Other regions that consume a large amount of oil energy are: South and Central America (44%), Africa (41%), and North America (40%). The world consumes 30 billion barrels of oil per year, of which developed countries consume the most. However, the increasing gas and oil output and issues of instability in the world’s oil-producing regions have led to a surge in supply and demand, driving oil prices down [
1].
Thus, under the pressure of the global gas and oil market, the importance of oil and gas supply chain management is evident both at the industrial and scientific levels. Challenges faced in the supply chain only include the minimization of costs and realization of on-time delivery, but also the achievement of sustainable levels of production. One of the best solutions to address these issues is the evaluation and selection of raw material suppliers. For the selection process of sustainable gas and oil suppliers, there are many factors that need to be considered in the assessment process. Consequently, a sustainable supplier selection process can be considered as a Multi-Criteria Decision-Making (MCDM) issue. The general steps of the MCDM model are as follows [
2,
3]:
- -
Step 1: Defining the problems and requirements;
- -
Step 2: Establishing the goal;
- -
Step 3: Developing options;
- -
Step 3: Selecting decision-making tools;
- -
Step 4: Making a decision.
In this research, the authors proposed an MCDM model using hybrid of Supply Chain Operations Reference (SCOR) metrics, the Analytic Hierarchy Process (AHP) model, and the Technique for Order of Preference by Similarity to Ideal Solution (TOPSIS) approach for supplier evaluation and selection in the gas and oil industry. According to literature reviews on SCOR metrics, all criteria that influence the supplier selection are defined in the first stage, the AHP model is applied to determine the weight of each factor in the second stage, and the optimal supplier is presented by the TOPSIS model based on the positive ideal solution (PIS) [
4] and the longest geometric distance from the negative ideal solution (NIS) [
4] in the final stage.
The remainder of the paper introduces a background to build the MCDM model. Then, a hybrid model using SCOR metrics as well as AHP and TOPSIS approaches is proposed to select the best supplier for the gas and oil industry. Results and discussions are presented at the end of this paper.
2. Literature Review
Numerous survey studies have recently focused on supplier selection problems. For example, Luzon and El-Sayegh [
5] used AHP and Delphi to select criteria for oil and gas projects in the United Arab Emirates (UAE). Rentizelas et al. [
6] introduced social sustainability in the oil and gas industry. Sivapornpunlerd and Setamanit [
7] applied AHP for supplier selection for an offshore oil and gas exploration and production company. The best suppliers were selected based on four main criteria, namely: quality, delivery, service, and flexibility, with 18 sub-criteria.
Fera and Macchiaroli [
8] used the AHP process and a fire dynamics simulator to assess the fire protection systems in a tunnel on fire. Martino et al. [
9] used Analytic network process (ANP) for Supply Chain Risk Assessment in the fashion retail industry. Fera [
10] presented a classification and prioritization of the risks during an installation project for a wind energy initiative using ANP. Fera and Macchiaroli [
11] conducted an appraisal of a new risk assessment model for Small and medium-sized enterprises (SME). The method proposed in this paper is a mixed one whose effectiveness is demonstrated through an application study carried out in different industrial systems, such as the steel industry or a logistic services provider.
Barata et al. [
12] studied multi-criteria indicators for sustainability ratings in suppliers of the oil and gas industry in Brazil. Mohammad and Price [
13] reported challenges of purchasing in the gas and oil industry. They also proposed new strategies for evaluating and selecting the best supplier in this field. Sunkari [
14] applied the Triple Bottom Line (TBL) to select sustainable suppliers for a major oil and gas company. They also use the MCDM model to perform their analysis. Zaimes et al. [
15] discussed key research opportunities and challenges in the design of supply chains. Wang et al. [
16] applied the multi-criteria group decision-making (MCGDM) model for supplier selection in a rice supply chain. In this research, all potential suppliers are selected based on financial aspects, delivery, and services, including qualitative and environmental management system factors. Wang and Tsai [
17] presented a fuzzy MCDM model that includes fuzzy AHP and Data envelopment analysis (DEA) for the evaluation and selection of solar panel suppliers in Taiwan.
Gonçalo and Morais [
18] proposed a multi-criteria group decision approach for oil supplier selection for a Brazilian oil company. They used the Preference Ranking Organization Method for Enrichment Evaluation (PROMETHEE II) to obtain decision-makers’ individual evaluations and the voting procedure by quartiles so as to convert the individual positions into a position for the group. Alamsjah and Dewi used a multiple linear regression method to determine supplier performance as critical success factor in the gas and oil industry. Chia and Trinh [
19] proposed a hybrid model using AHP-TOPSIS and Goal Programming for supplier selection. Sasi and Digalwar [
20] proposed a MCDM model using AHP and the TOPSIS method for supplier selection in the textile industry.
3. Material and Methodology
3.1. Research Development
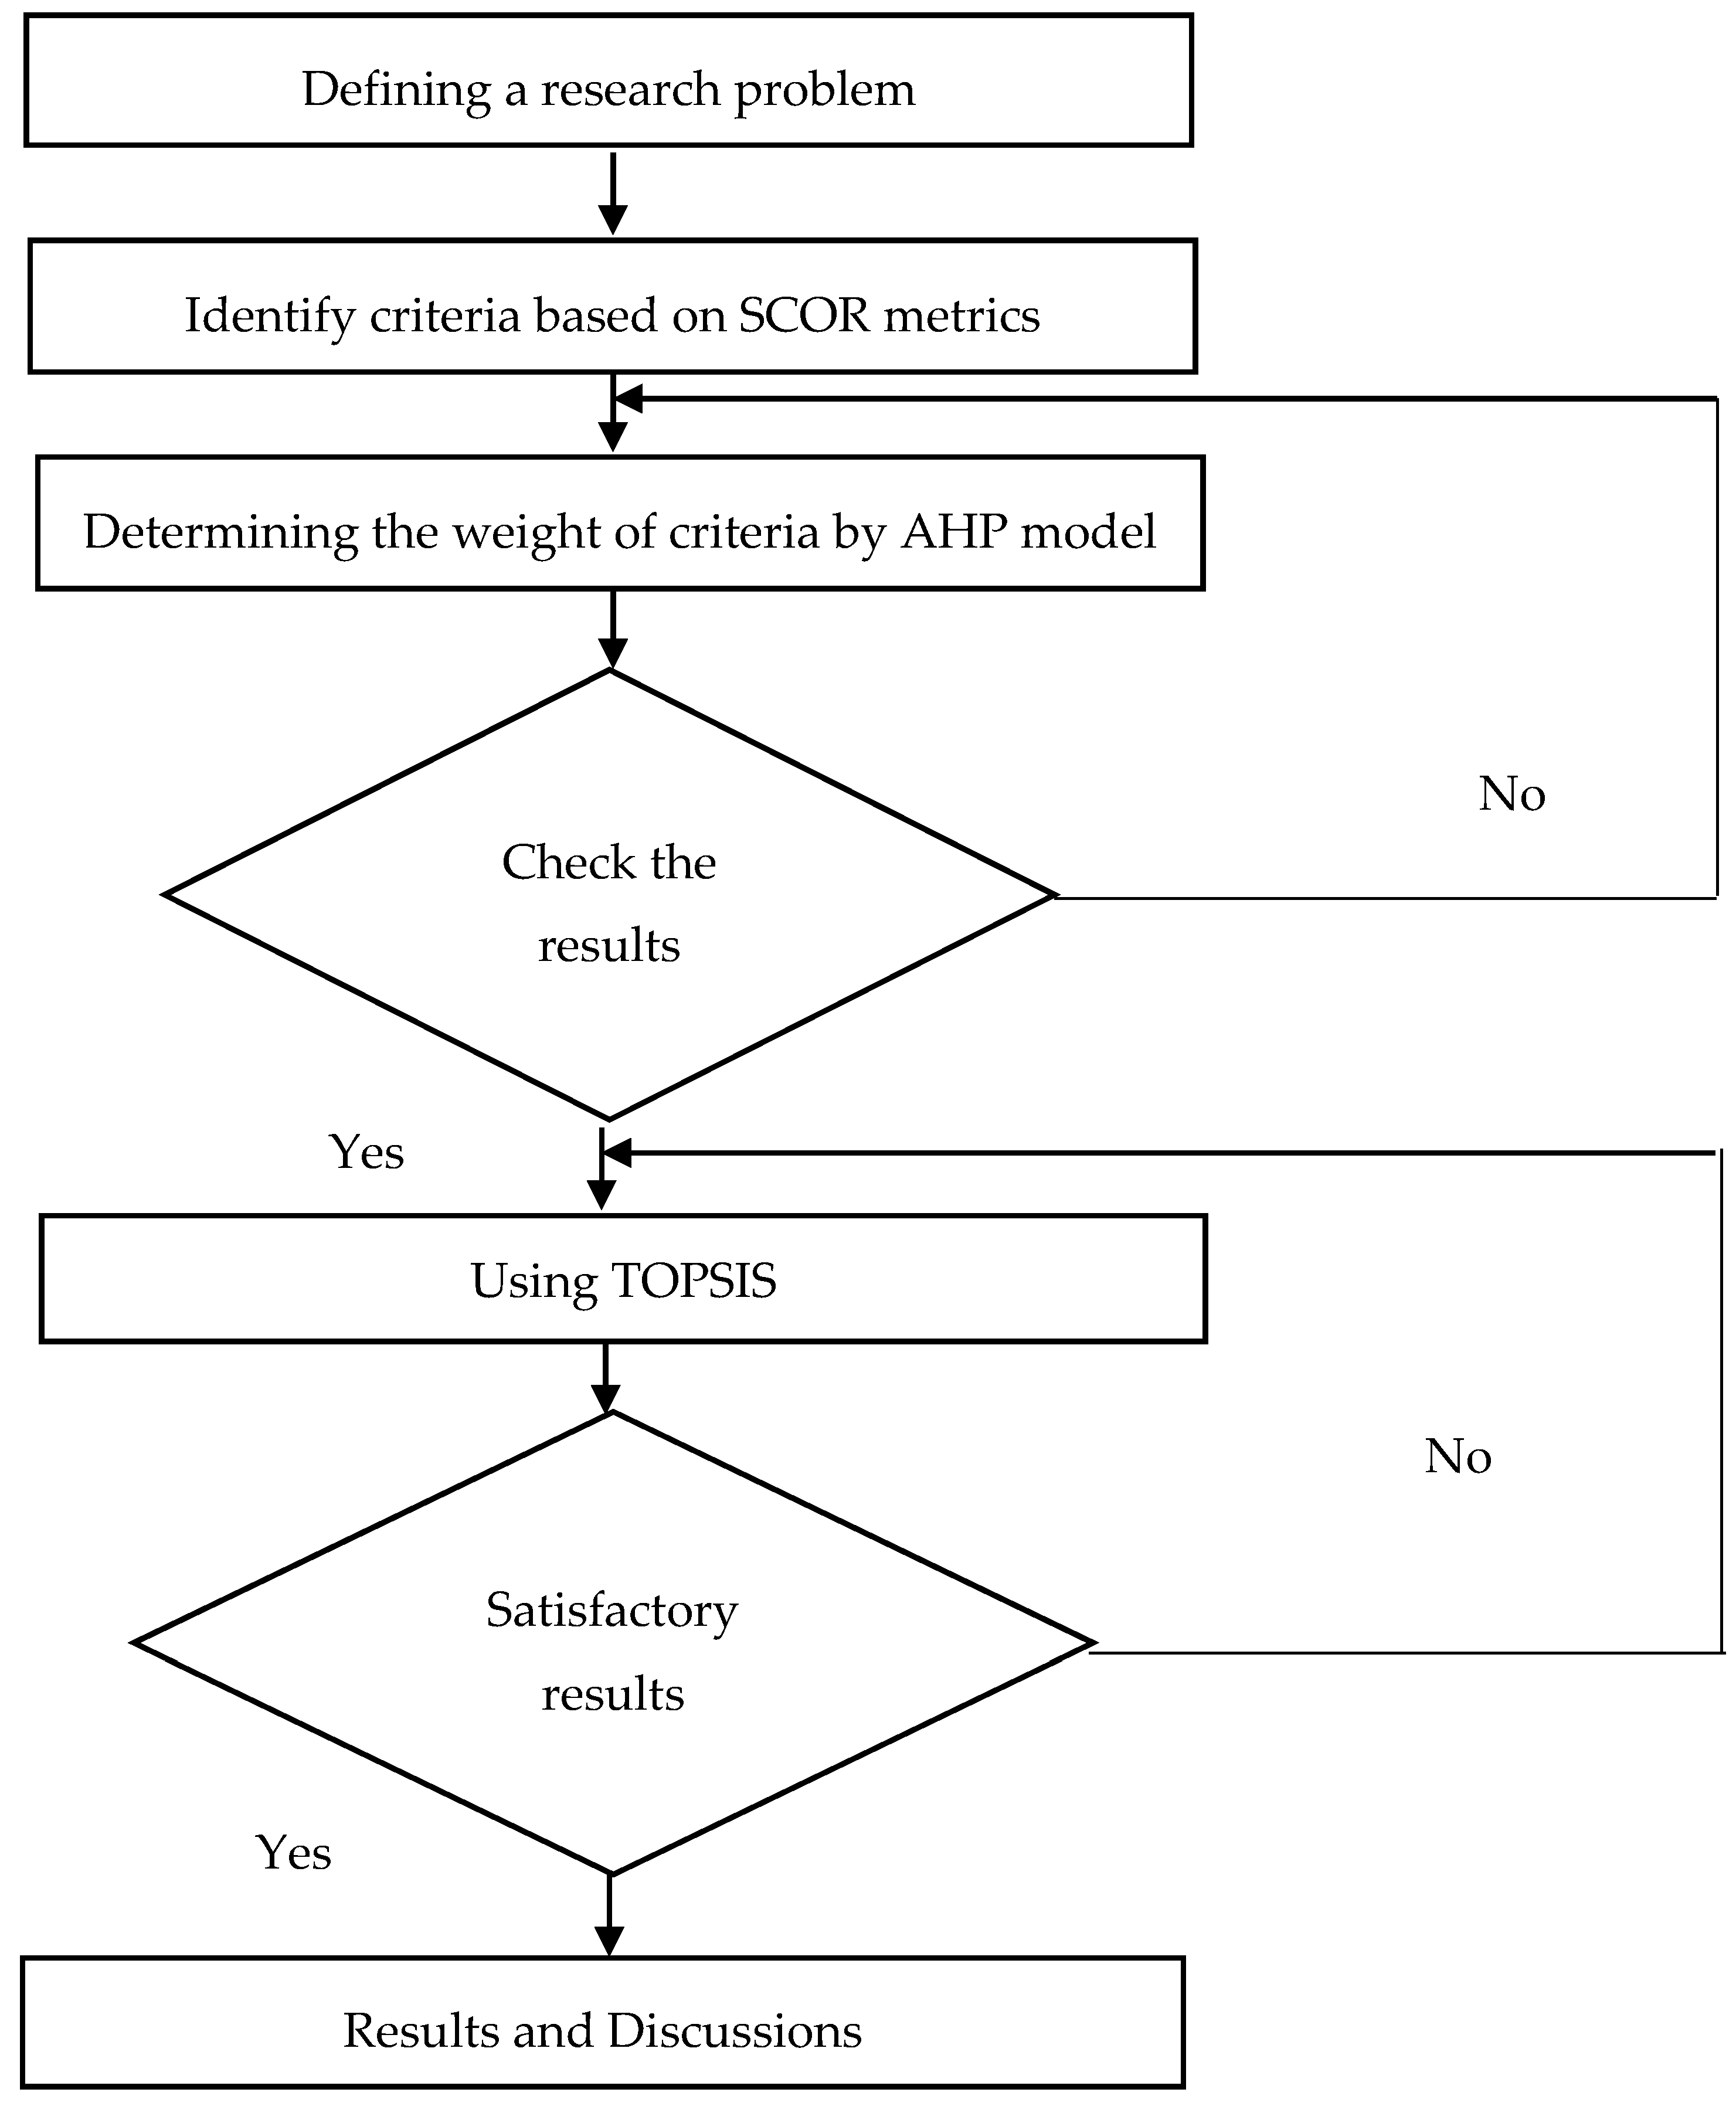
In this research, an MCDM model is proposed, including SCOR metrics, AHP, and a TOPSIS model, for supplier evaluation and selection in the gas and oil industry. There are three main steps in this work, as shown in
Figure 1.
Step 1: Defining objectives and criteria. In this step, the criteria for supplier evaluation and selection are identified. All the criteria were built through SCOR metrics and literature reviews.
Step 2: Using the AHP model. All potential suppliers that may be highly effective at providing raw material are included. In this step, an AHP model is proposed to determine the weight of all criteria and sub-criteria.
Step 3: To rank the potential suppliers list, a TOPSIS model is applied in this stage. The optimal supplier is proposed base on the PIS and NIS.
3.2. Methodology
3.2.1. Supply Chain Operations Reference (SCOR) Metrics
SCOR was proposed in 1996 [
21,
22] by Theodore Pittiglio, Robert Rabin, Robert Todd, and Michael McGrath. This model allows firms to conduct a very thorough fact-based analysis of all aspects of their supply chain by providing a complete set of process details, performance metrics, and industry best practices [
23]. The performance attributes of SCOR metrics are shown in
Table 1.
3.2.2. Analytic Hierarchy Process (AHP) Model
AHP was proposed by Saaty [
24]. It is an MCDM that simplifies complex and ill-structured issues by arranging the criteria and options in a hierarchical structure by using pairwise comparison metrics [
25,
26]. The main advantage of AHP is its ability to rank options in the order of their effectiveness in meeting conflicting goals [
24,
25].
In an AHP model, multiple paired comparison metrics are based on nine levels of a standardized comparison scale.
Let
A =
be the set of number of criteria The pairwise comparison metric of the
m factor will be presented in an
m ×
m evaluation matrix
C, in which every element
dab is the quotient of weights of the factor, as shown in Equation (1):
The relative priorities are given by the eigenvector (
u) corresponding to the largest eigenvector
as:
The consistency is determined by the relation between the entries of
C and the consistency index (
CI) is:
The final consistency ratio (
CR), calculated as the ratio of the
CI and the
RI, is shown in Equation (4):
The upper limit for CR is 0.1. If the CR value exceeds 0.1, the evaluation procedure needs to be repeated to improve consistency. The steps of the AHP process are as follows:
Step 1: Defining a research problem and goals.
Step 2: Building a hierarchy structure of the AHP model.
Step 3: Constructing of the target matrix of the supply network.
Step 4: Building the pairwise comparison matrices.
Step 5: Evaluating the consistency of the judgments and performing a consequence weights analysis as follows:
Step 6: Check consistency. Calculate the vector of the matrix:
where:
CI: consistency index;
RI: random index.
Calculating the consistency ratio (
CR) can be completed as follows:
The randomized index values are shown in
Table 2.
Step 7: Calculating the weights of the objective functions:
where
3.2.3. Technique for Order Preference by Similarity to Ideal Solution (TOPSIS)
Hwang and Yoon proposed TOPSIS approaches [
27]. The optimal solution is based on the NIS and PIS [
4]. As we have
m options and
n factors, the TOPSIS model can be used present the score of alternatives [
28]. The steps of the TOPSIS model are as follows:
Step 1: Identifying a Normalized Decision Matrix (NDM). Normalized values (
yij) can be established from raw values (
xij) by:
Step 2: The weight normalized value (
fij) can be defined by:
where
Pa is the weight of the
criterion and
.
Step 3: Determining the negative ideal solution (NIS) and the positive ideal solution (PIS):
where
A is related to the profit criteria, and
B is related to the cost criteria.
Step 4: The distance of the PIS
can be identified by:
Similarly, the separation from the NIS
can be completed as follows:
where
and
are distances from the target alternative
a to the worst and best conditions, respectively.
Step 5: Determining the
value:
Step 6: The alternative with the maximum value of is the optimal solution.
4. Case Study
With the rising demand for energy, the prospects for oil and gas companies’ growth and expansion are expected to be positive. The policy of expanding oil and gas exploitation and production from the government contributes to the stable growth of the oil and gas market.
In general, competitive raw material suppliers are in the oil and gas sector—where modern and reliable technology is required. Over the next few years, the number of potential projects is likely to increase significantly, especially as companies in this field work with foreign oil companies to find and exploit suppliers.
Company ABC is one of the leading oil and gas companies in Vietnam. The company expanded its investment in overseas projects and improved its supply chain because the demand for energy is increasing. The purchasing of materials can be considered as the first stage of ABC’s supply chain management. The gas and oil evaluation and selection process plays an important role in the production and business. However, it is not easy to select suppliers that are reliable, cost-effective, and competitive. For gas and oil enterprises, this activity affects the progress, quality, and cost of the production processes.
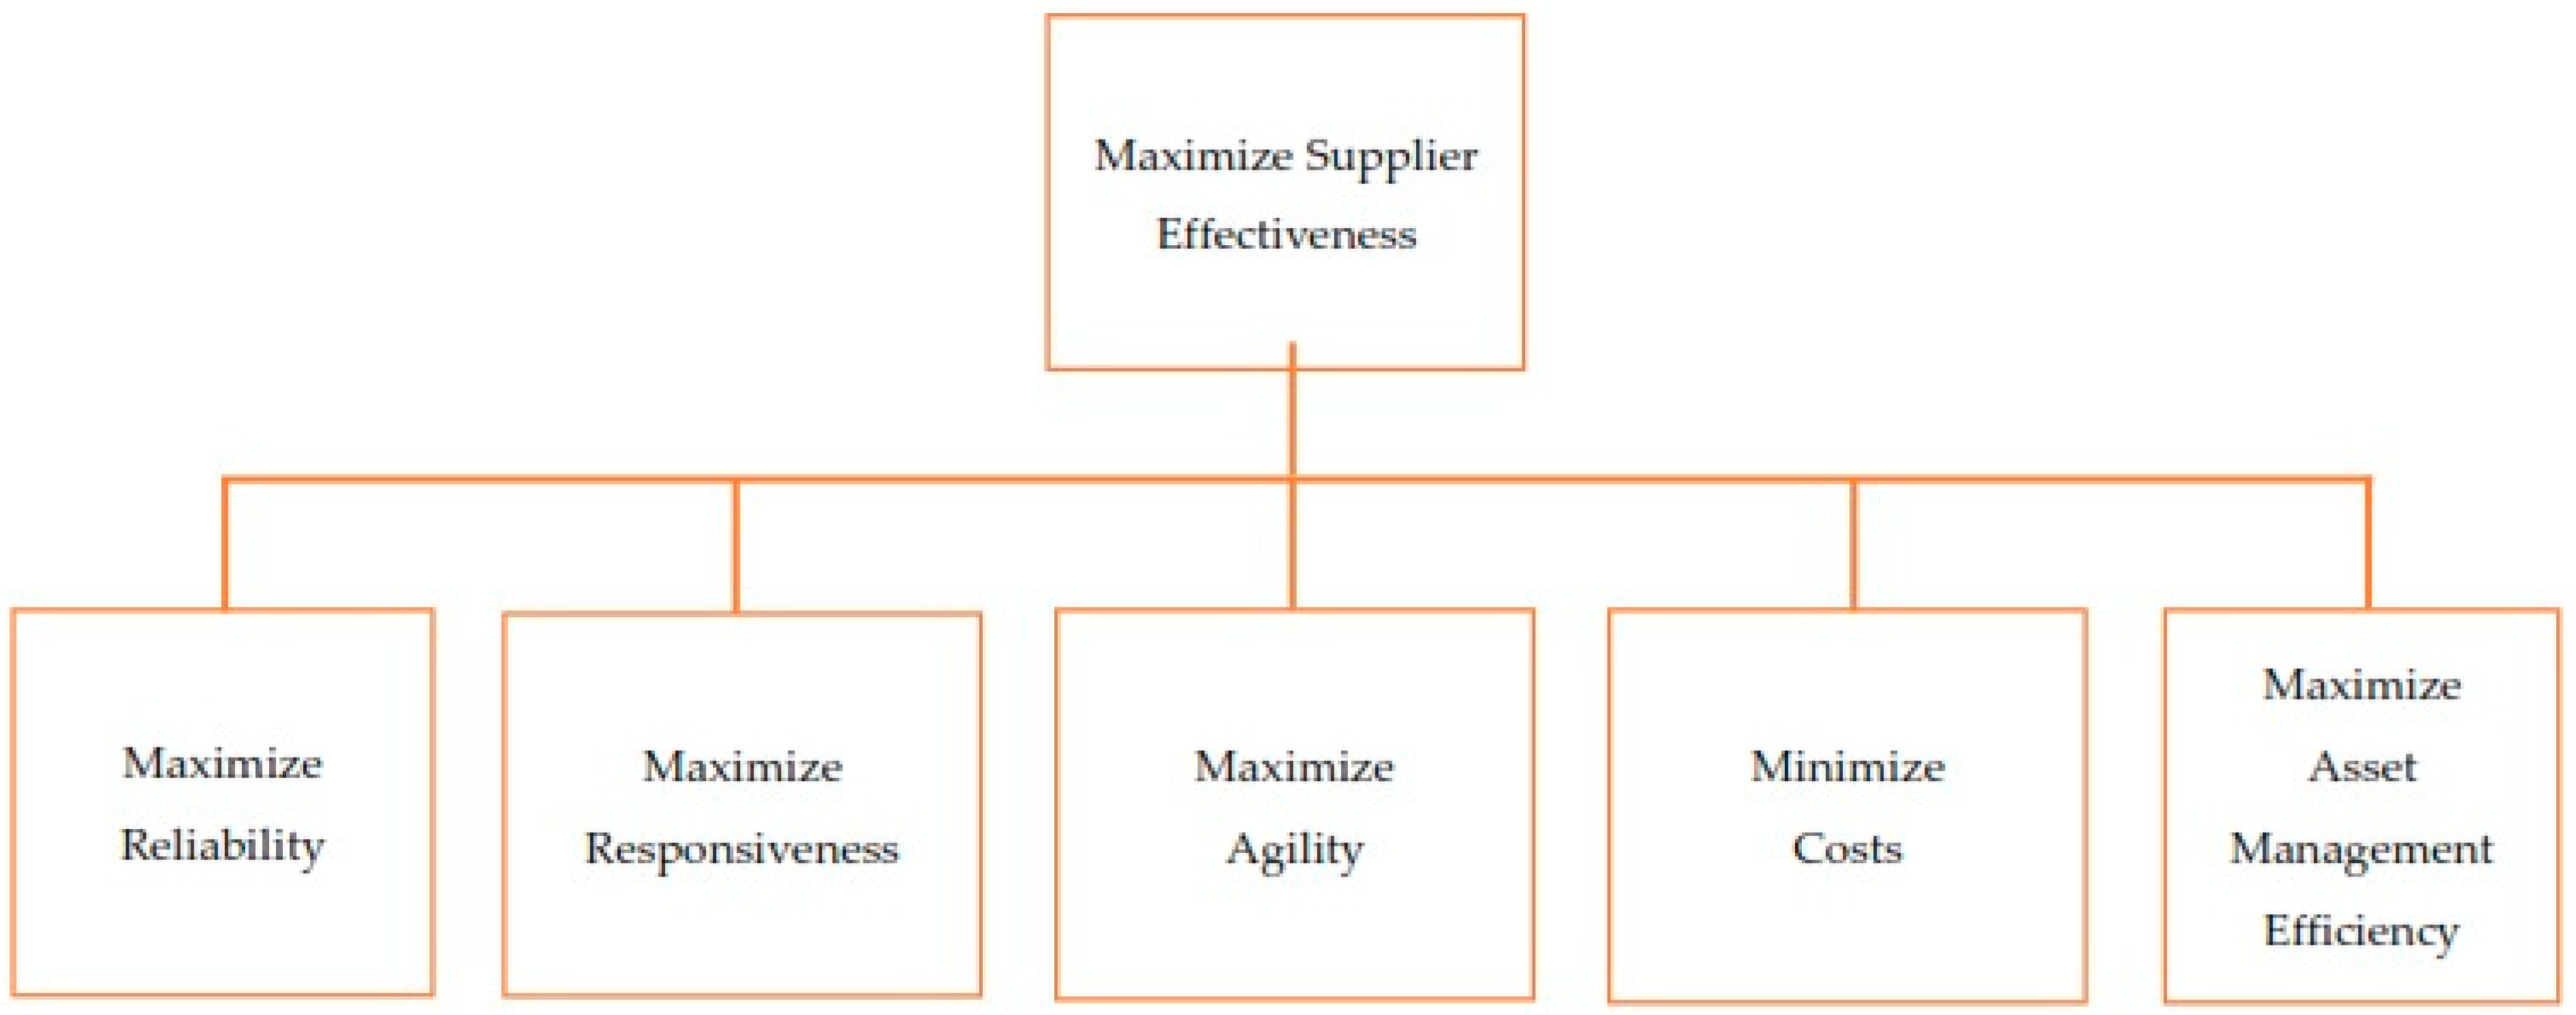
Thus, the aim of this work is to propose a supplier evaluation and selection process using SCOR metrics, AHP, and TOPSIS for the gas and oil industry based on reliability, responsiveness, agility, costs, and Asset Management Efficiency (Assets) factors.
The proposed model is used to rank potential suppliers of a well-known gas and oil industry in Vietnam. After the preliminary evaluation, 10 potential suppliers (DMUs—Decision-Making Units) were selected by interviewing experts and heads of the procurement department based on their product capacity, time of delivery, supplier’s location, unit price, etc. A suppliers list and their corresponding symbols in the proposed model are shown in
Table 3.
Based on the SCOR metrics, the Objectives Hierarchy of this research are shown in
Figure 2.
A list of main criteria and sub-criteria for selecting gas and oil suppliers from the Objectives Hierarchy, experts, articles, and scientific researchers are shown in
Table 4.
The weights of all criteria, defined by the AHP criteria, are shown in
Table 5:
The matrices, identified by the TOPSIS model, are shown in
Table 6 and
Table 7.
5. Results and Discussions
Previously, evaluating and selecting suppliers based mainly on price did not bring high efficiency for enterprises. The price of raw materials is reasonable but sometimes the ability to supply on-time, with good raw material quality and a stable supply, will not be guaranteed. Nowadays, under the pressure of the global gas and oil market, the supplier ensures the supply of materials, raw materials, commodities, etc. in sufficient quantity, quality, stability, and accuracy to meet the requirements of production and business with low costs and on-time deliveries. Thus, good suppliers are one of the factors that affect the production and business of enterprises.
As shown in the literature review, the MCDM model has been applied to various fields of science and engineering, and its use has been increasing for many years. One of the fields in which this model has been applied is the supplier selection process, yet very few works consider this issue in the gas and oil industry. This is the main reason why this research proposes an MCDM for supplier selection in the gas and oil industry.
In order to select good suppliers, enterprises need to understand the criteria for evaluating suppliers. Thus, the authors define the research objectives and criteria for supplier selection and evaluation by SCOR metrics in the first stage. An AHP model is applied to determine the weight of each factor in the second stage, and the optimal supplier is presented in the final stage according to the TOPSIS model. As a result, in
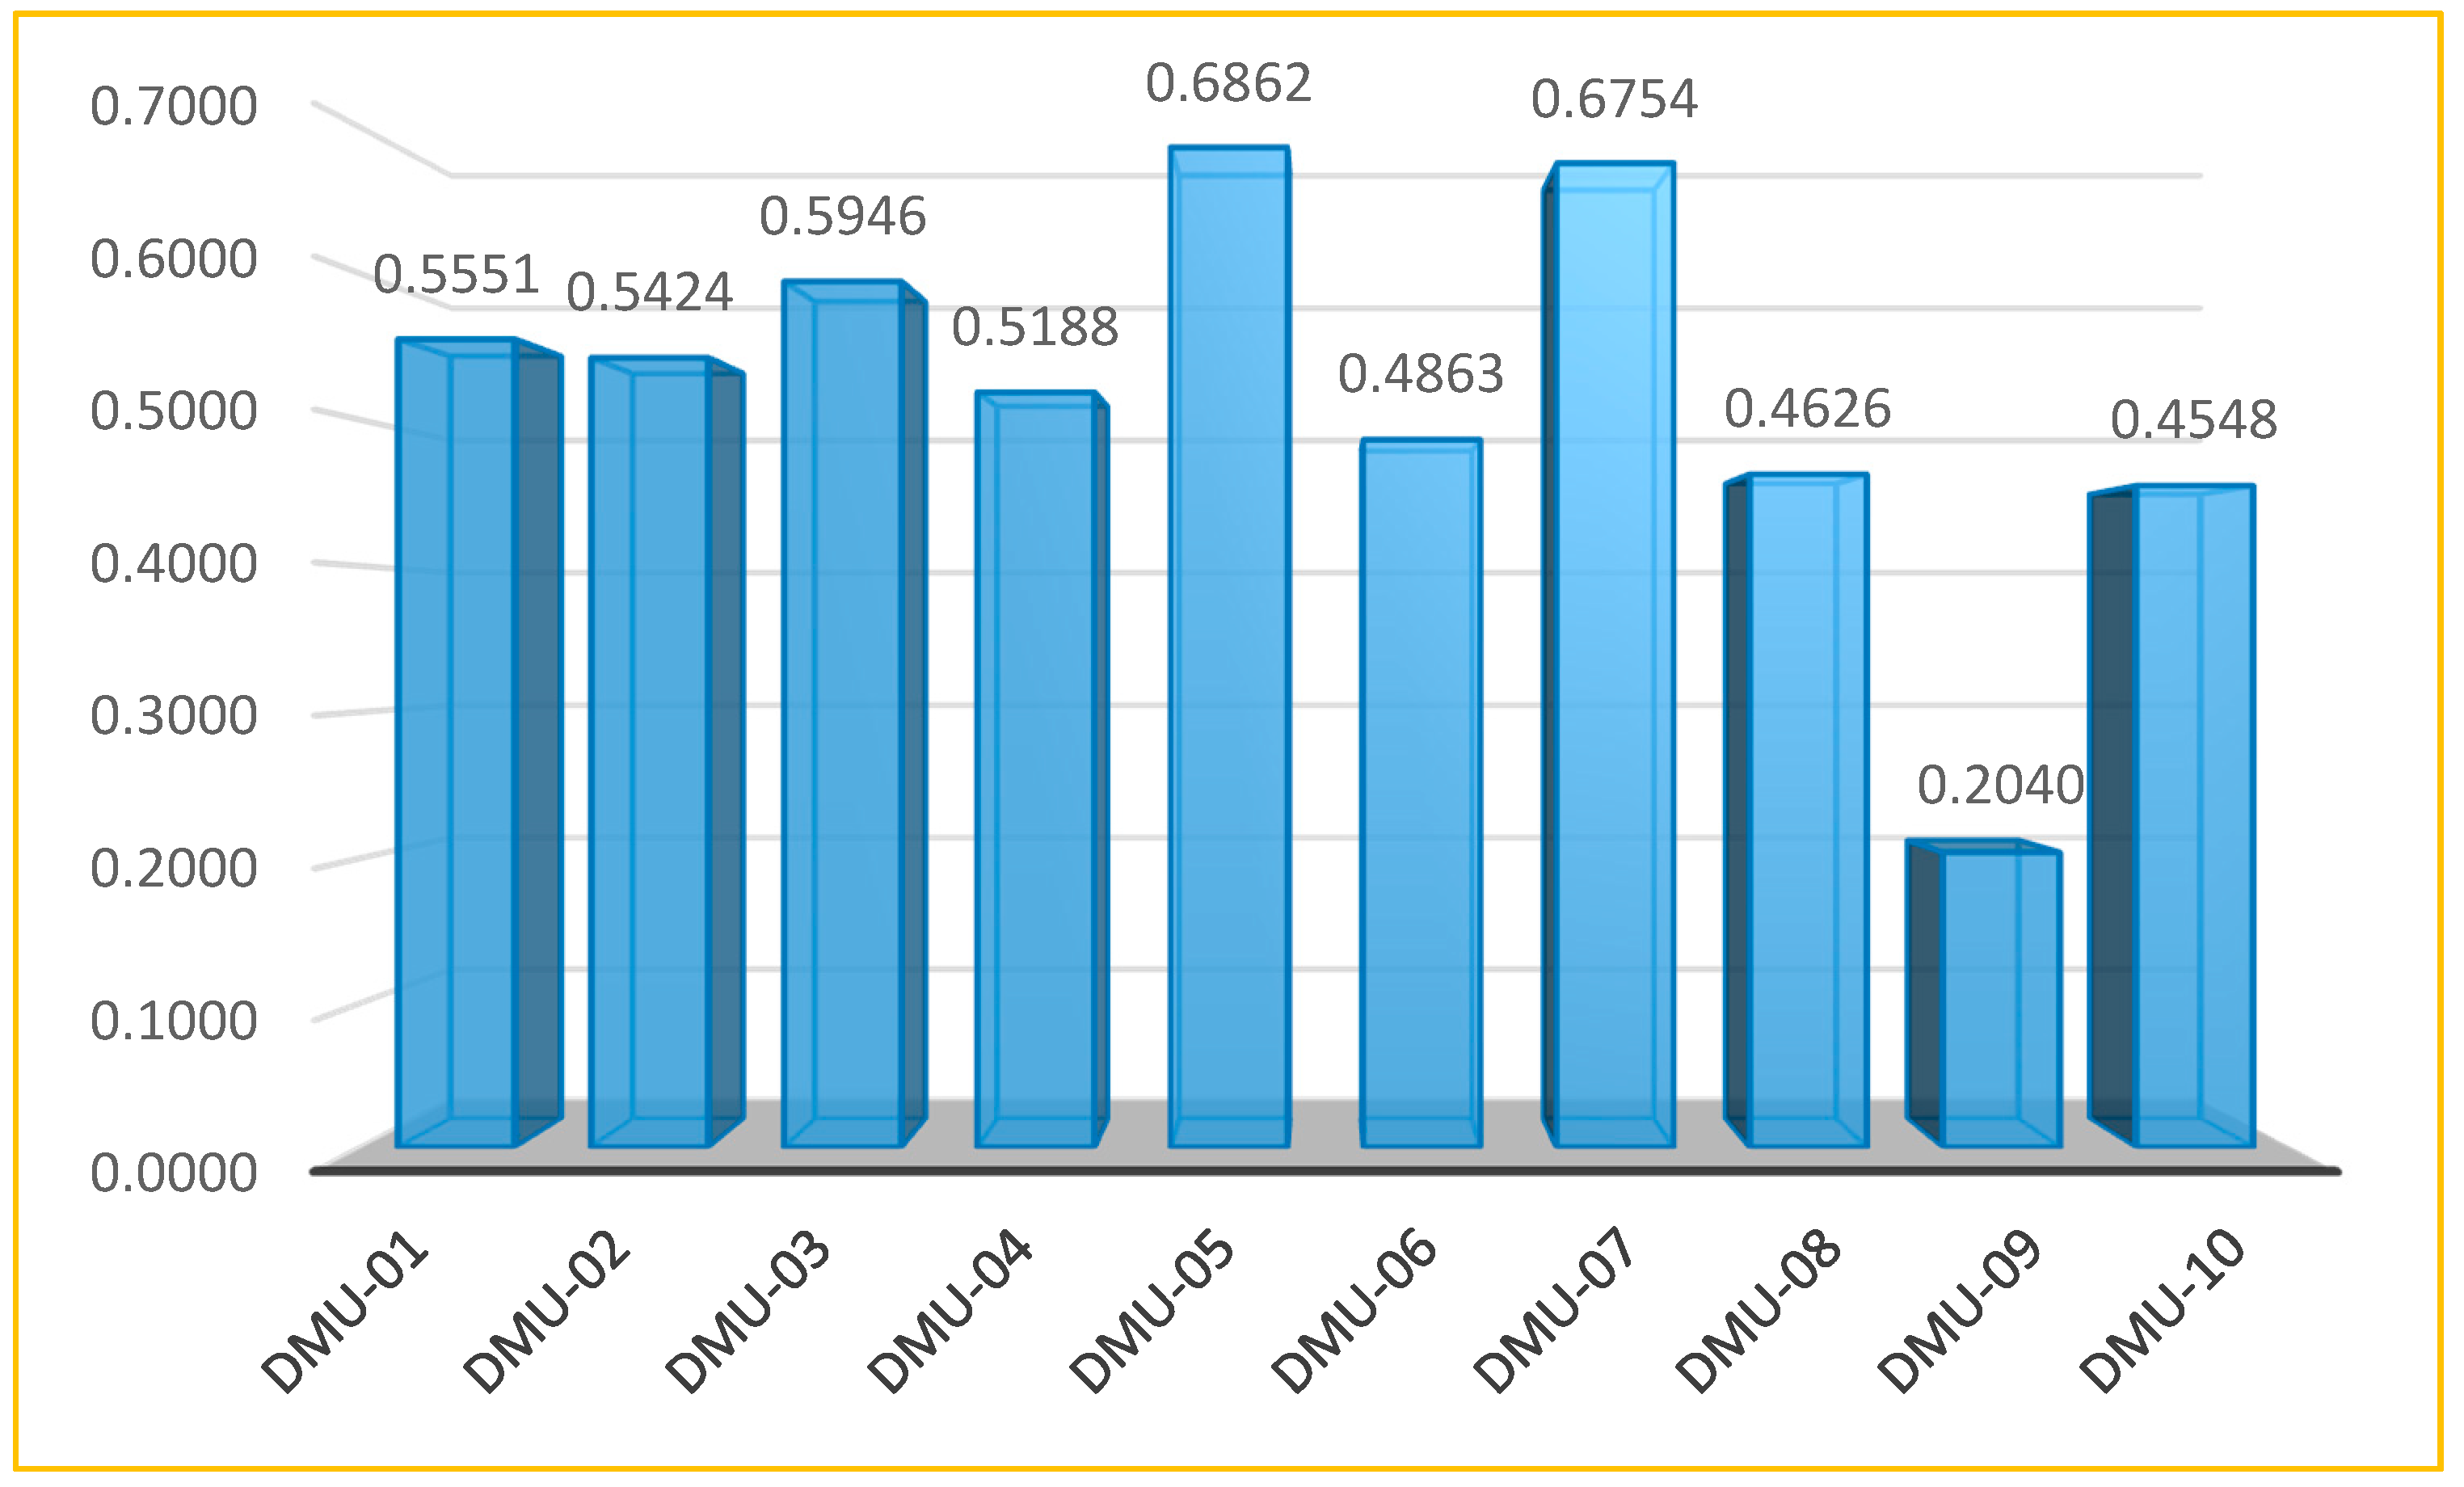
Figure 3 and
Table 8, DMU-5 is shown to be the best supplier for the gas and oil industry, as determined through this research.
6. Conclusions
Today, many businesses are interested in developing strategic suppliers to meet the advanced Just In Time (JIT) production system, which helps businesses reduce input costs and improve quality, products, and services provided to customers. To select the right supplier, there are many criteria that need to be considered in the assessment process. Therefore, the supplier selection process can be considered as a Multi-Criteria Decision-Making (MCDM) issue. However, most selection criteria are evaluated by decision-makers, and evaluations are subjective in terms of language variables, limited by the human factor.
Currently, there has been much research and subsequent application of MCDM models to evaluate suppliers. However, the literature review shows that most of these cases employ only a single model, without exploiting the advantages or disadvantages of the model. For this reason, a hybrid MCDM model using SCOR metrics, AHP, and TOPSIS was implemented to overcome this research problem. As a result, the best supplier for the oil and gas industry was identified from our research sample. Selecting and managing good suppliers is a prerequisite for organizing the production of quality products as desired, according to the schedule, and with reasonable prices and competitiveness in the market. In addition, gaining the support of suppliers in necessary for enterprises that strive to continue to grow and achieve more. Thus, this research has many academic and practical applications.
The contribution of this work is to propose new and feasible MCDM model for supplier evaluation and selection in the gas and oil industry. The combination of SCOR metrics, AHP, and TOPSIS not only provides reasonable results but also allows the decision-maker to visualize the impact of different criteria on the final result. In addition, this research can be broadened, creating a premise for applying supplier selection in other industries and in particular extending the model for the evaluation and selection of suppliers in future research.


