Article

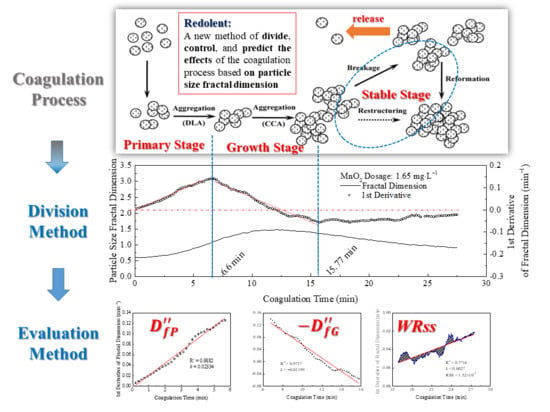
A New Method for the Process Division and Effect Evaluation of Coagulation Based on Particle Size Fractal Dimension

1
School of Energy and Safety Engineering, Tianjin Chengjian University, Tianjin 300384, China
2
School of Science and Technology, Tianjin University, Tianjin 300072, China
*
Author to whom correspondence should be addressed.
Processes 2018, 6(12), 237; https://doi.org/10.3390/pr6120237
Submission received: 22 October 2018 / Revised: 18 November 2018 / Accepted: 20 November 2018 / Published: 23 November 2018
(This article belongs to the Special Issue Wastewater Treatment Processes)

Abstract

:
To divide, control, and predict the effects of the coagulation process in water treatment, a characteristic analysis of the change in particle size distribution (particle number and fractal dimension) during aided coagulation with hydrated MnO2 was performed. The results showed that the process of coagulation could be divided into three characteristic stages based on the first derivative of the particle size fractal dimension. In the primary stage, most of the microflocs aggregated to form small flocs; in the growth stage, most of the small flocs aggregated to form large flocs; and in the stable stage, some large flocs broke apart and reformed. The first derivative of the particle size fractal dimension had a good linear relationship with the coagulation time in the primary stage and growth stage, and its slope had a power function relationship with the particle number in settled water; the first derivative could thus be used to evaluate the coagulation effect. In the stable stage, the rate of change in particle size fractal dimension fluctuated along the fitted line, and the mean residual sum of squares had a linear relation with the particle number in settled water; therefore, this parameter could be used as an indicator of the coagulation effect.

Graphical Abstract

1. Introduction

The main removal targets of water treatment and wastewater treatment are suspended matter and dissolved contaminants. Although significant research efforts have recently been made to develop novel advanced water treatment processes for dissolved contaminant removal [1,2], suspended matter remains as the primary target for normal water treatment facilities. The core units of normal water treatment process are coagulation, sedimentation, and filtration. Coagulation is considered as the major treatment unit used to improve overall treatment efficiency for water treatment. The particle size, effective density, and structure of flocs formed in coagulation have important effects on the following sedimentation and filtration process. The method, including optimizing the hydraulic condition, adjusting the dosage of flocculant, and adding coagulant-aid, is used in order to improve the efficiency of coagulation.
Most microflocs (diameter <5 µm) are difficult to remove via coagulation and sedimentation in water treatment processes, and most of the flocs in filtered water are microflocs; consequently, better removal of microflocs in the coagulation process is necessary to improve the quality of settled and filtered water [3,4]. Liang et al. [5] and Liu et al. [6] found that the addition of a small amount of potassium permanganate (KMnO4) to the coagulation process significantly improved the outcome; the floc growth was accelerated and larger flocs formed, thus more microflocs were removed. In the mechanism of aided coagulation, hydrated manganese dioxide (MnO2), formed from the reduction of KMnO4, can promote the growth of flocs. Li and Nan [7] found that a low dosage of hydrated MnO2 (such as 0.55 mg·L−1) could improve the coagulation efficacy, removing more microflocs after the coagulation and sedimentation process, and decreasing the number of microflocs released later in the coagulation process.
Coagulation is a complex process that has been studied on the relevant parameters and coagulation kinetics. The research on relevant parameters and their interactions has been conducted using a statistical analysis based on design of experiments (DoE), which is a systematic approach for evaluating cause and effect relationships and optimising a process [8,9]. Coagulation kinetics is the basic theory for the design and management of coagulation reactors and separation devices [10]. The coagulation kinetics have been studied based on division of the coagulation process into stages. To achieve fine regulation of the coagulation process, scholars have attempted to divide the coagulation process. Sweeping current detector (SCD) analysis [11], small-angle laser light scattering [12], and average floc size measurements have been used to identify the stage in which flocs start to grow, but the relevant parameters in these methods could not accurately reflect the changes in the flocs at later stages in the coagulation process. He et al. [13] found that the fractal dimension of flocs provided a new way of studying the coagulation process, as the process of floc growth could be described with a fractal dimension model and divided into two distinct phases.
Fractal dimension can be used to describe the changes in morphology and particle distribution in flocs during coagulation. Du et al. [14,15] found that fractal dimension is an important free parameter to describe the coagulation process. Gregory [16], Vahedi et al. [17], and Kilander et al. [18] used fractal dimensions to describe the degree of irregularity in particle size distributions of flocs and to demonstrate the coagulation effect. To optimize coagulants and coagulation conditions, Margaritis et al. [19] and Amjad et al. [20] compared the fractal dimension of flocs and the distribution of fractal dimension, and on this basis, they studied the coagulation mechanism in water treatment. Kuśnierz and Wiercik [11] further used particle size and fractal dimensions to measure the effects of coagulation in wastewater treatment.
In this study, a new method was put forward to divide, control, and predict the effects of the coagulation process based on particle size fractal dimension. The particle size fractal dimension was used to describe the change in particle size distribution during aided coagulation with hydrated MnO2, and the first derivative of the fractal dimension was analyzed as a function of coagulation time and used to divide the coagulation process into three characteristic stages. The characteristic parameters in the different stages were found; these parameters could describe the coagulation process and indicated the efficacy of coagulation.

2. Materials and Methods

2.1. Apparatus and Materials

The apparatus used in this study, shown in Figure 1, consisted of a cubic tank, a BT300-2J peristaltic pump (Longer, Baoding, China), a PCX2200 particle counter (HACH, Loveland, CO, USA), a RW20 N-type multiple-velocity agitator (IKA, Staufen, Germany), and an industrial computer monitor. The cubic tank was made of glass and had a side length of 280 mm and a liquid height of 230 mm when filled with water for testing, and the top of the tank was open. The volume of liquid in the tank was 18 L. The test water was pumped out of the tank at a constant rate of 100 mL·min−1, then flowed through the particle counter to the peristaltic pump, and finally flowed back into the tank. The length of the connection tube between the water outlet of the tank and the particle counter was 589 mm and the inner diameter was 6 mm.
All reagents were of analytical (AR) grade. Kaolin clay, polyaluminum chloride (PAC), manganese sulfate (MnSO4), and potassium permanganate (KMnO4) were obtained from Kemiou, Tianjin, China.
Normally, the turbidity of raw water from surface water is in the range from 70 to 120 nephelometric turbidity unit (NTU) in the north China plain where Tianjin lies, such as in the works of [21,22]. The turbidity of test water in this study was designed accordingly to be around 100 NTU. Kaolin clay was used in the test water. A total of 1.80 g of the kaolin clay was dispersed in 1 L of tap water, which was equilibrated for 24 h before used, and mixed by a magnetic stirrer at 1000 rpm for 60 min. After the period of high-speed stirring, the suspension was allowed to stand overnight in an l L jar to obtain the stock suspension. For the coagulation tests, the stock suspension was diluted with tap water in the cubic tank to obtain a test water sample with a kaolin clay concentration of 100 mg·L−1, corresponding to a turbidity of approximately 100 NTU.
PAC was selected as the coagulant, and a solution of PAC was prepared at a mass concentration of 1%. The solution was kept at 5 °C in a refrigerator and replaced every two weeks.
KMnO4 and MnSO4 were used as raw materials to prepare hydrated MnO2 as the coagulant aid. The reaction equation is as follows:
2KMnO4 + 3MnSO4 + 2H2O = 5MnO2↓ + K2SO4 + 2H2SO4
In the experiment, the KMnO4 and MnSO4 solutions were poured into the reactor under an amount of substance ratio of 2:3. The hydrated MnO2 dosages, which were calculated and described with respect to the elemental content of manganese, were in the range from 1.1 to 4.4 mg·L−1. At the beginning of the coagulation process, pH values of the test water treated with different MnO2 dosages were in the range from 6.3 to 6.5, detected by a PHS-3CW pH meter (Lei-ci, Shanghai, China).

2.2. Procedure and Method

The test water in the cubic tank was mixed at a speed of 800 r·min−1 until the data shown on the particle counter were stable. Then, PAC and hydrated MnO2 were added at the same time; the water was mixed immediately at a speed of 400 r·min−1 for 30 s, and then mixed at a speed of 80 r·min−1 for an additional 27 min (as a coagulation process), after which the mixture was precipitated for 30 min (as a sedimentation process). Finally, the settled water was obtained from the supernatant in the cubic tank. The particle counts were detected in the whole coagulation process by an online particle counter and were recorded every 10 s. The particle counts of settled water were also detected and used to evaluate the coagulation effect [23].
To obtain the particle size distribution during the coagulation process, the output data of the particle counter were divided into seven channels. The division of the output data is shown in Table 1.
Fractal dimension was used to describe the particle size distribution during the coagulation process in this paper. Logan’s results showed that particle size distribution has a fractal structure [24]. According to the fractal theory, there is a positive correlation with ρ(r) and rDf, as shown in Equation (1):
ρ(r) ∝ rDf
ρ(r): total measured number of particles of size < r in t min, mL−1;
r: radius of flocs, µm;
Df: particle size fractal dimension of flocs at t min in the coagulation process.
In this study, the particle size fractal dimension of flocs was calculated using a log–log plot of ρ(r) and r. The slope of the fitted line was the particle size fractal dimension.

3. Results and Discussion

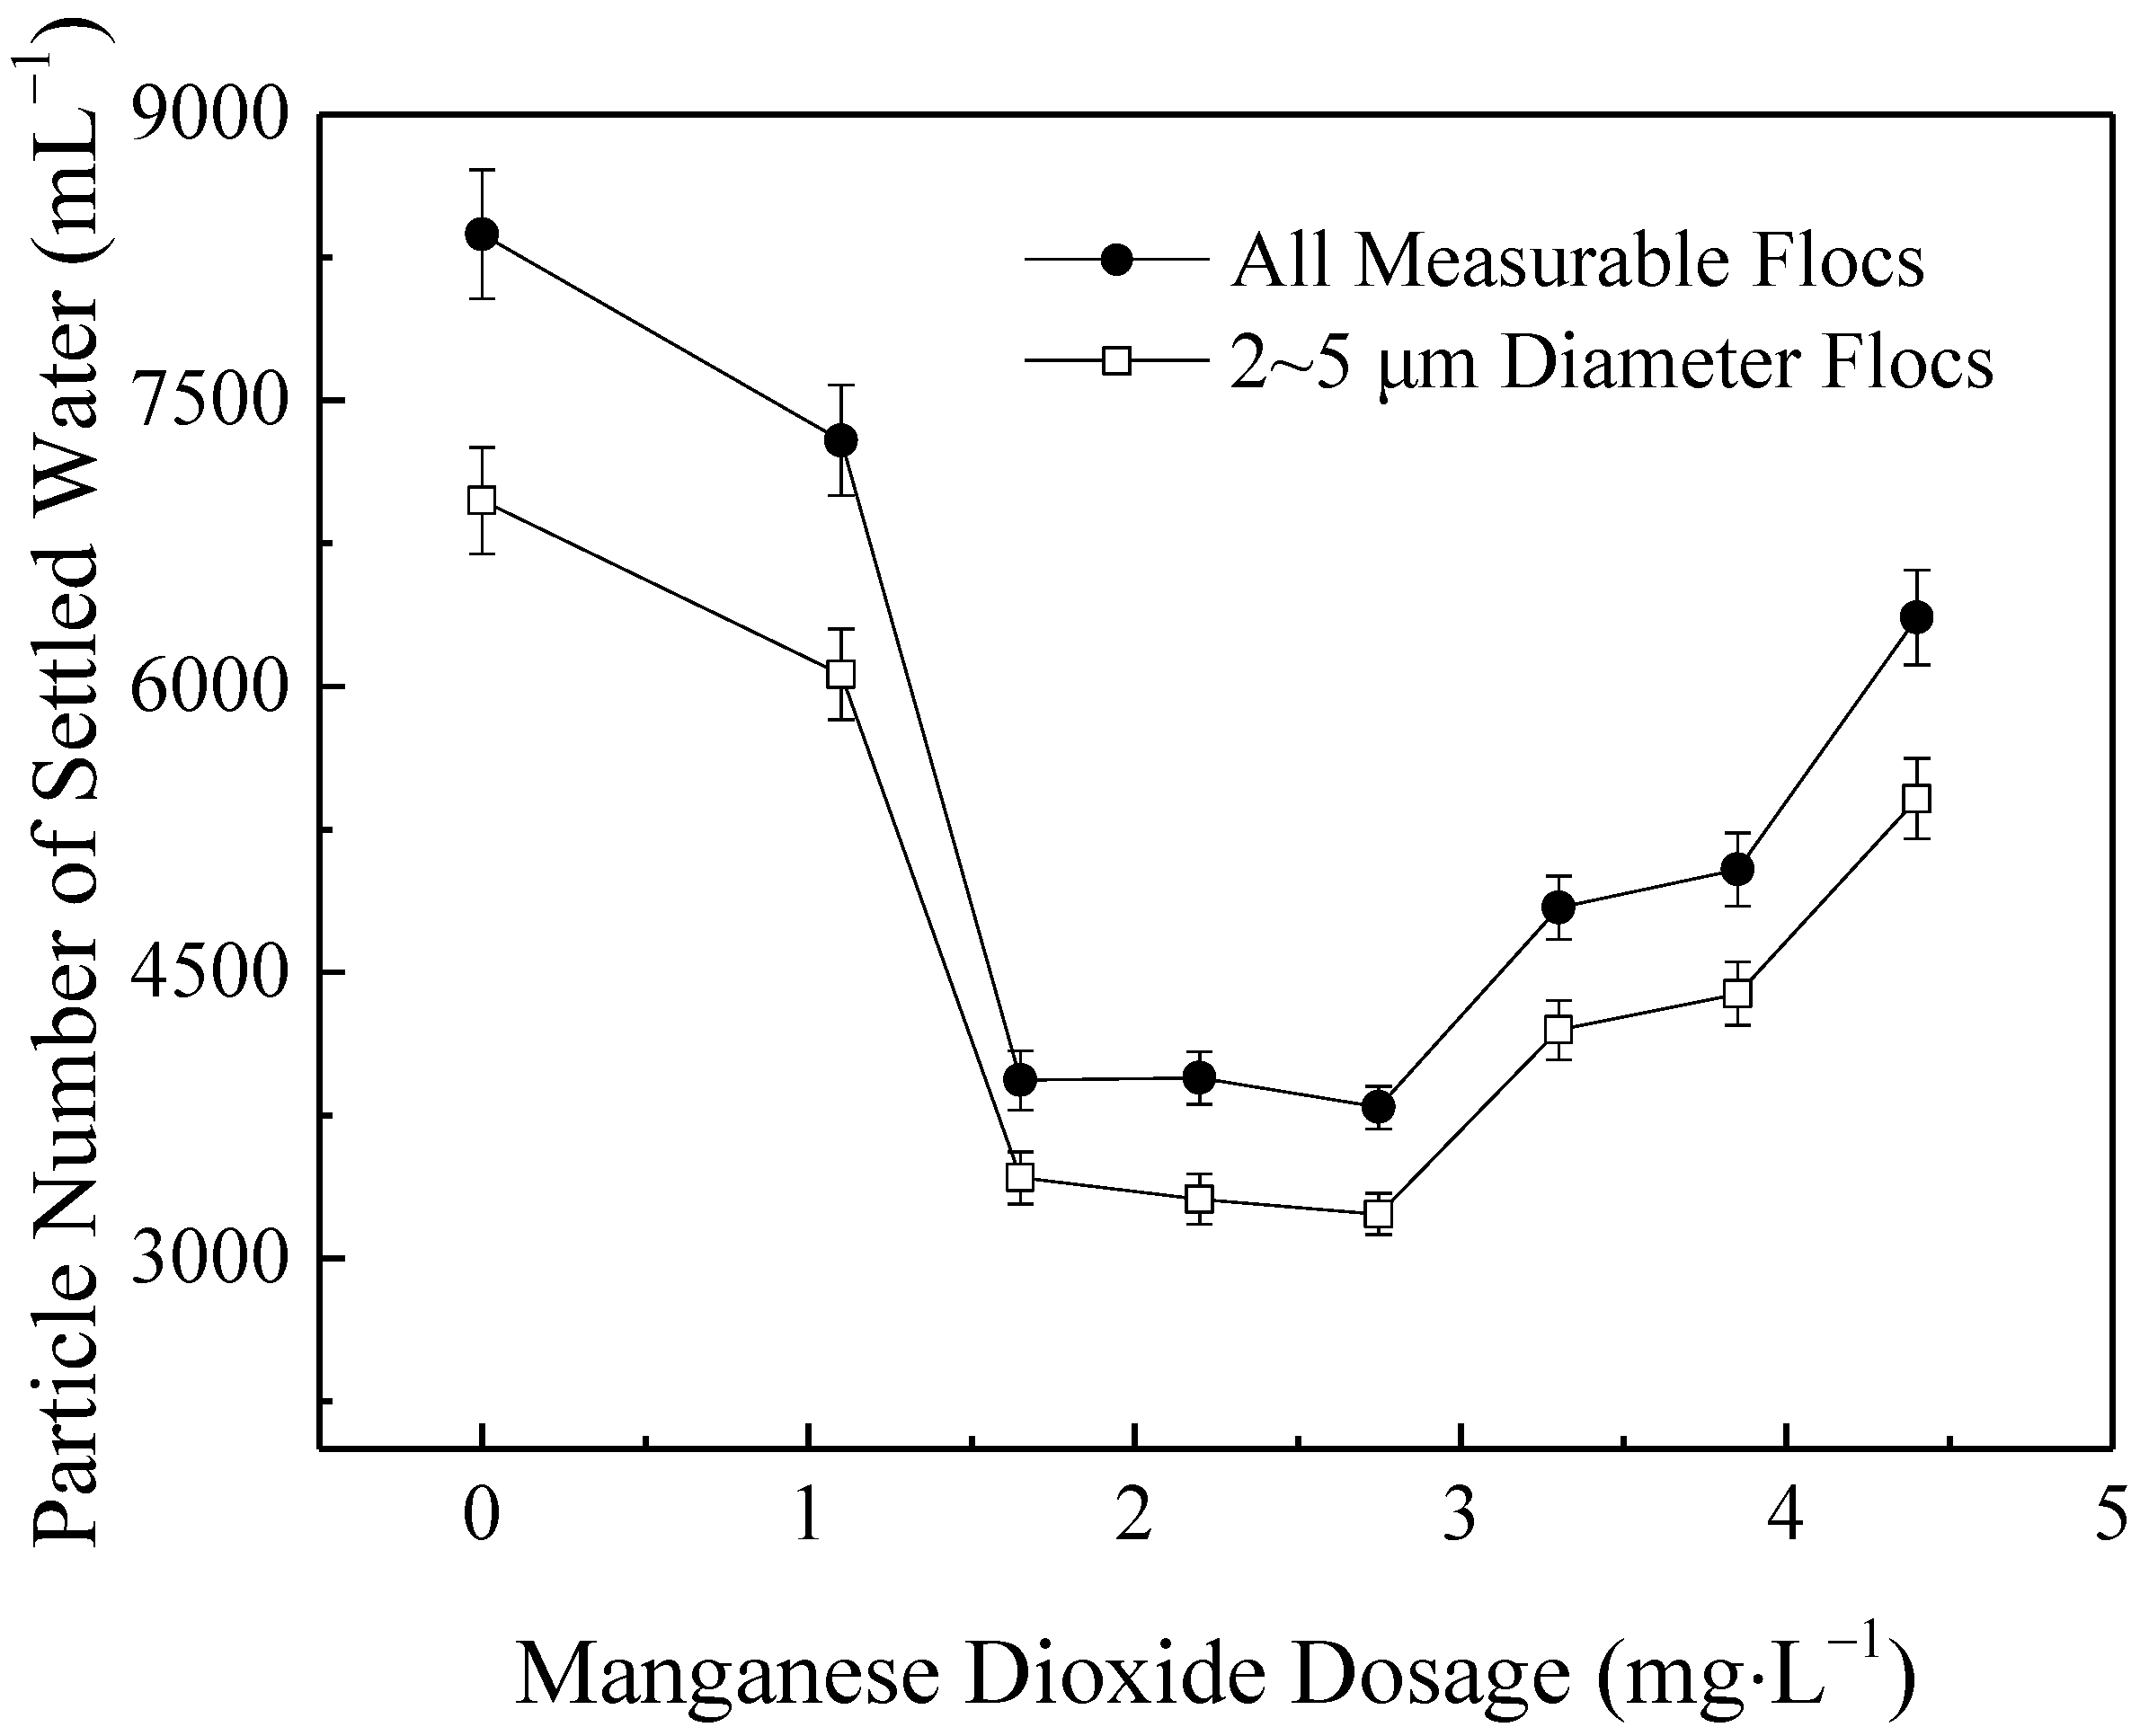
3.1. Coagulation Effect Measured by the Quality of the Settled Water

The coagulation effect was measured by the quality of the settled water. The better the coagulation effect, the lower the particle number in settled water. Three repeated experiments were carried out with each MnO2 dosage, and the particle number in the settled water was obtained by calculating an average value. The particle number of all measurable flocs (diameter 2~600 μm) and microflocs (diameter 2~5 μm) in settled water treated with hydrated MnO2 is shown in Figure 2. The number of all measurable flocs and microflocs initially decreased with increasing MnO2 dosage, reached a minimum level when the MnO2 dosage was 2.75 mg·L−1, and then increased with increasing MnO2 dosage. The results showed that an appropriate MnO2 dosage in the range from 1.65 to 2.75 mg·L−1 could clearly enhance the coagulation effect, especially for the removal of microflocs.

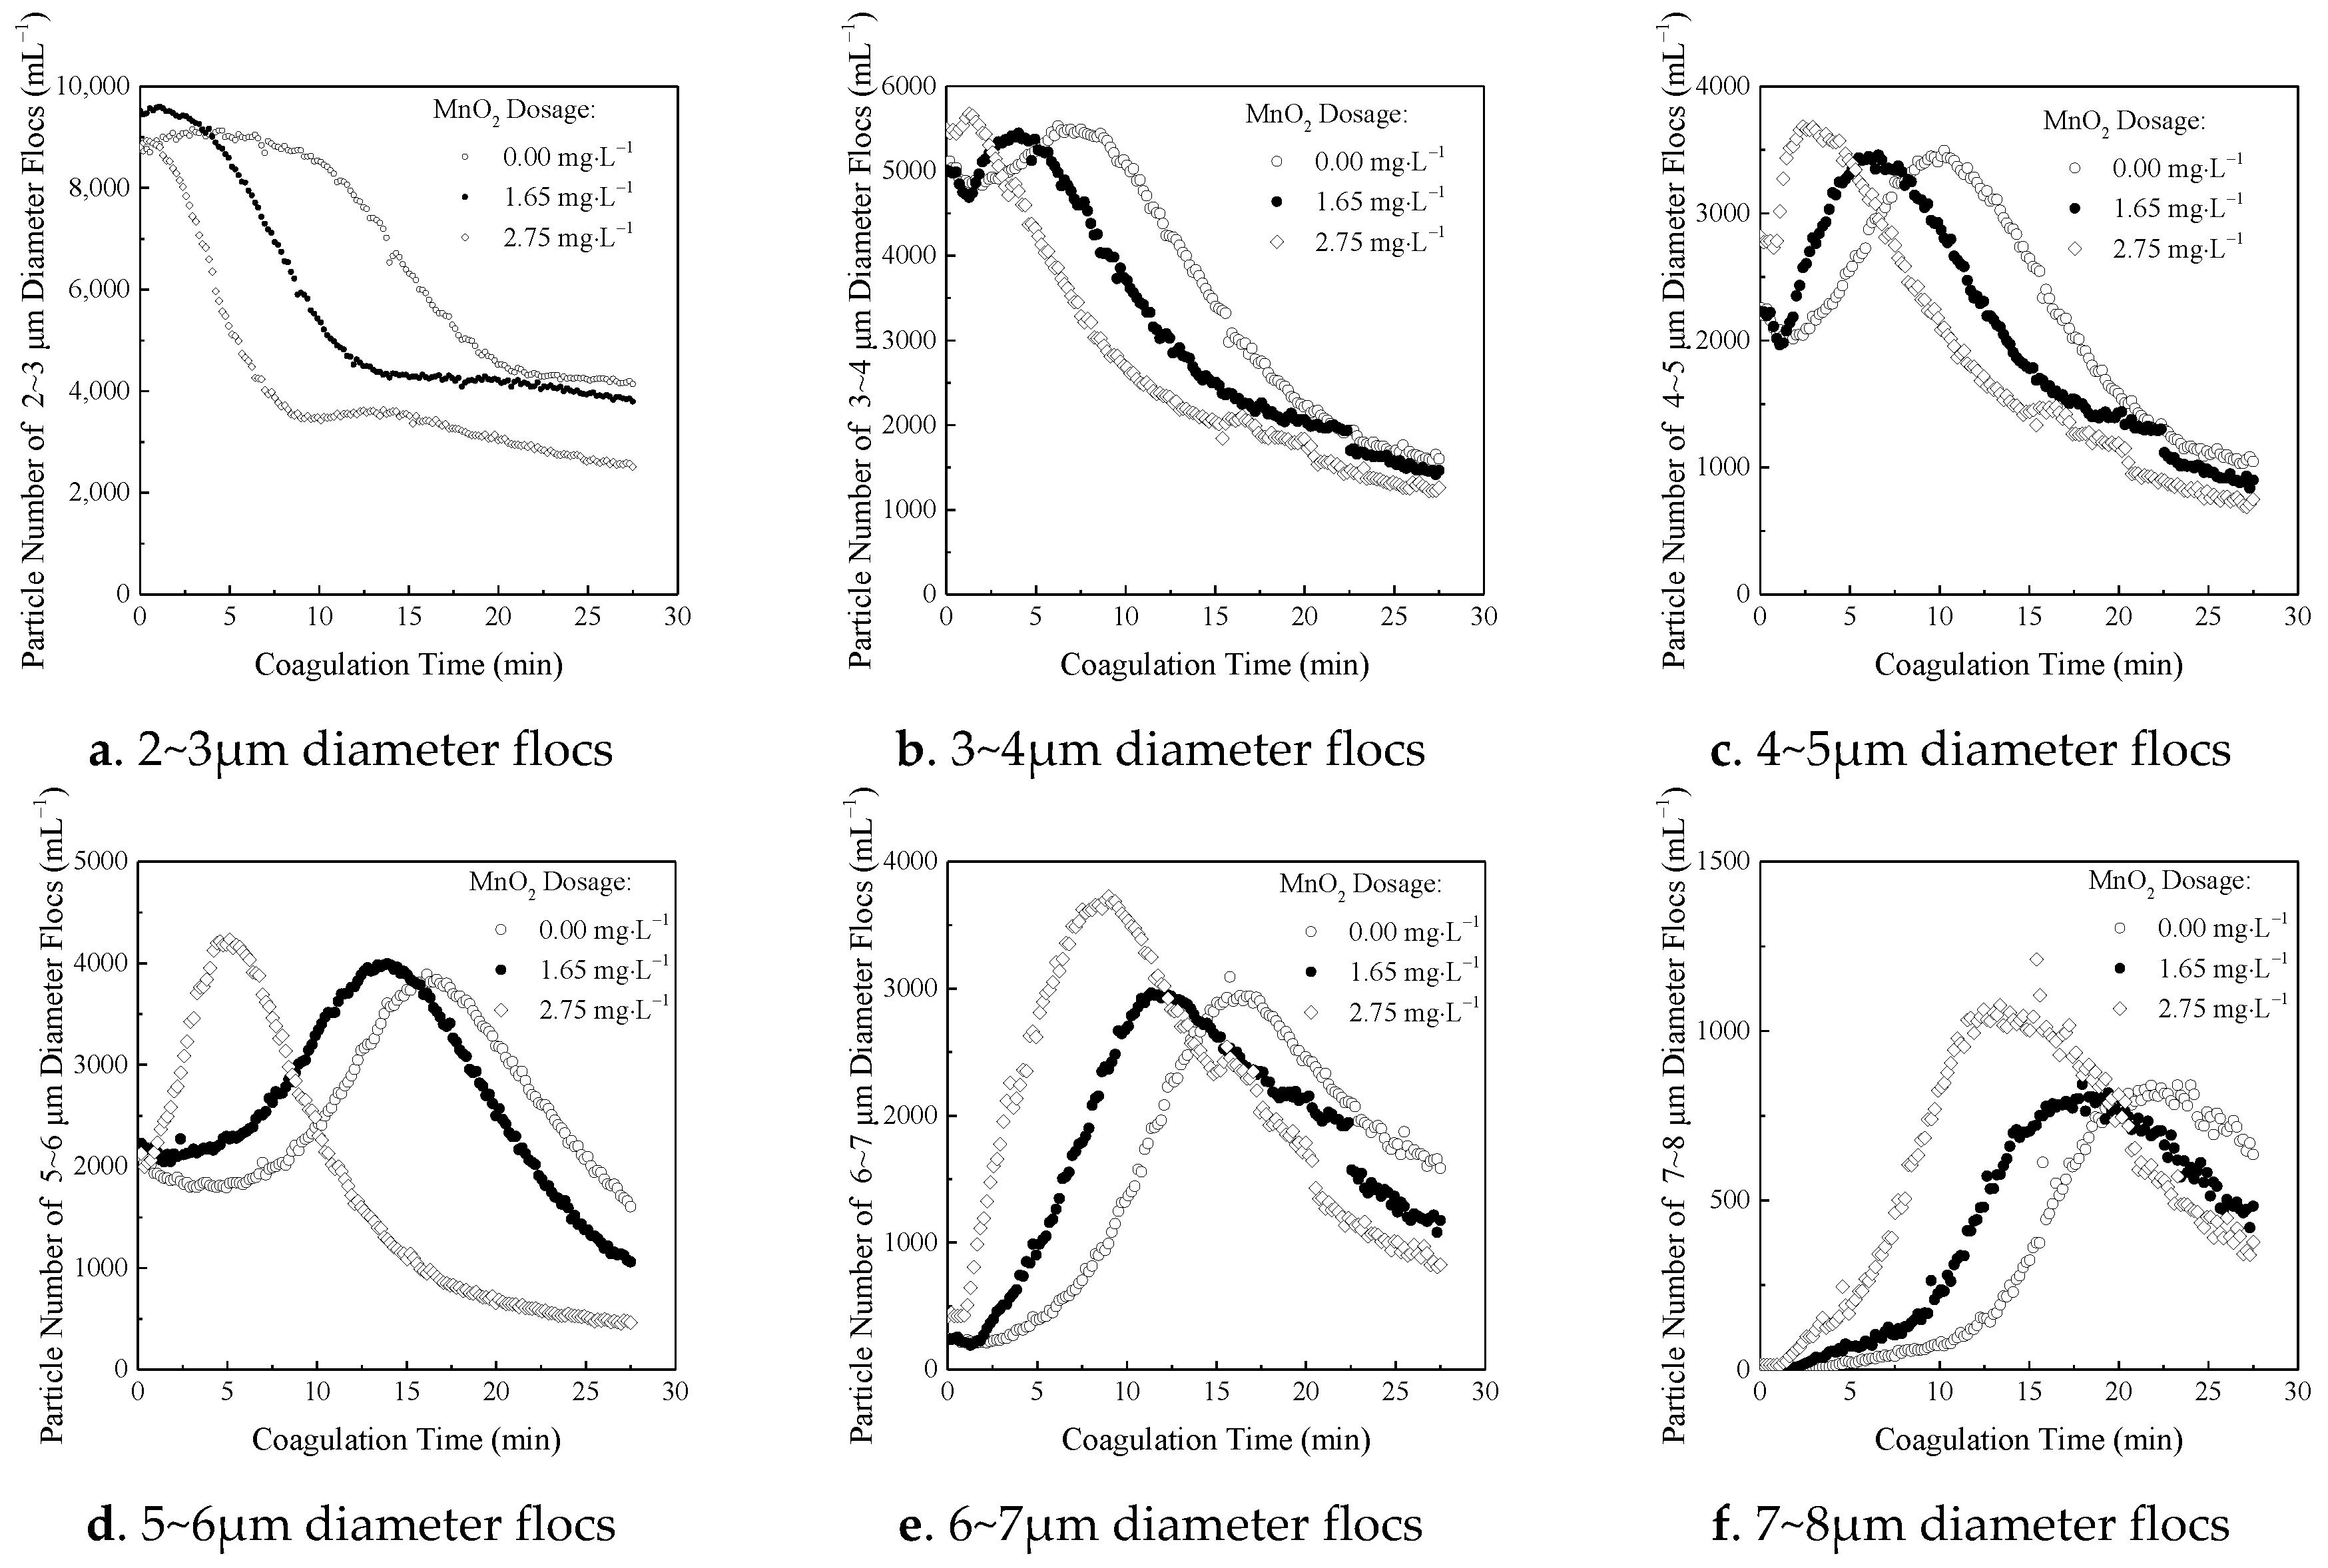
3.2. Change in Particle Size Distribution during Coagulation

3.2.1. Particle Number

The change in the number of flocs with different diameters as a function of coagulation time is shown in Figure 3. As shown in Figure 3a, the number of flocs with a diameter of 2~3 μm decreased with increasing coagulation time, but the trend slowed down gradually. At the beginning of the coagulation process, the number of 2~3 μm diameter flocs was the highest. Under the action of Brownian motion and orthokinetic coagulation [25], these flocs agglomerated to form larger flocs or were captured by larger flocs, which caused the particle number to decrease rapidly. The probability of collision between flocs then decreased with a decreasing number of particles in the container, and the probability of aggregation and capture of the flocs decreased gradually, which caused the rate of decrease to slow down.
As shown in Figure 3b–e, the number of 3~4 μm, 4~5 μm, 5~6 μm, and 6~7 μm diameter flocs increased at the beginning of the coagulation process and then fell after reaching a maximum value. The bigger the particle size, the later the particle number reached the maximum value, which indicated that floc growth was a continuous process from small to large sizes [26]. In addition, the MnO2 dosage had a clear influence on the change in particle number. The number of particles reached a maximum level most rapidly at a MnO2 dosage of 2.75 mg·L−1, followed by that at a dosage of 1.65 mg·L−1, and finally by that in the absence of additives.
The change in the number of 7~8 μm and 8~600 μm diameter flocs with coagulation time is shown in Figure 3f,g. The curves of these two flocs both showed an initial increase and then decrease. The increases in the curves showed that more large flocs were formed, and the decreases in the curves showed that the large flocs settled when their effective density reached the limit of precipitation at the end of the coagulation process. In addition, fluctuations in the curve were obvious during the decreasing stage for 8~600 μm diameter flocs. This phenomenon was an embodiment of the breakage and reformation of the large flocs at the end of the coagulation process [27,28,29].

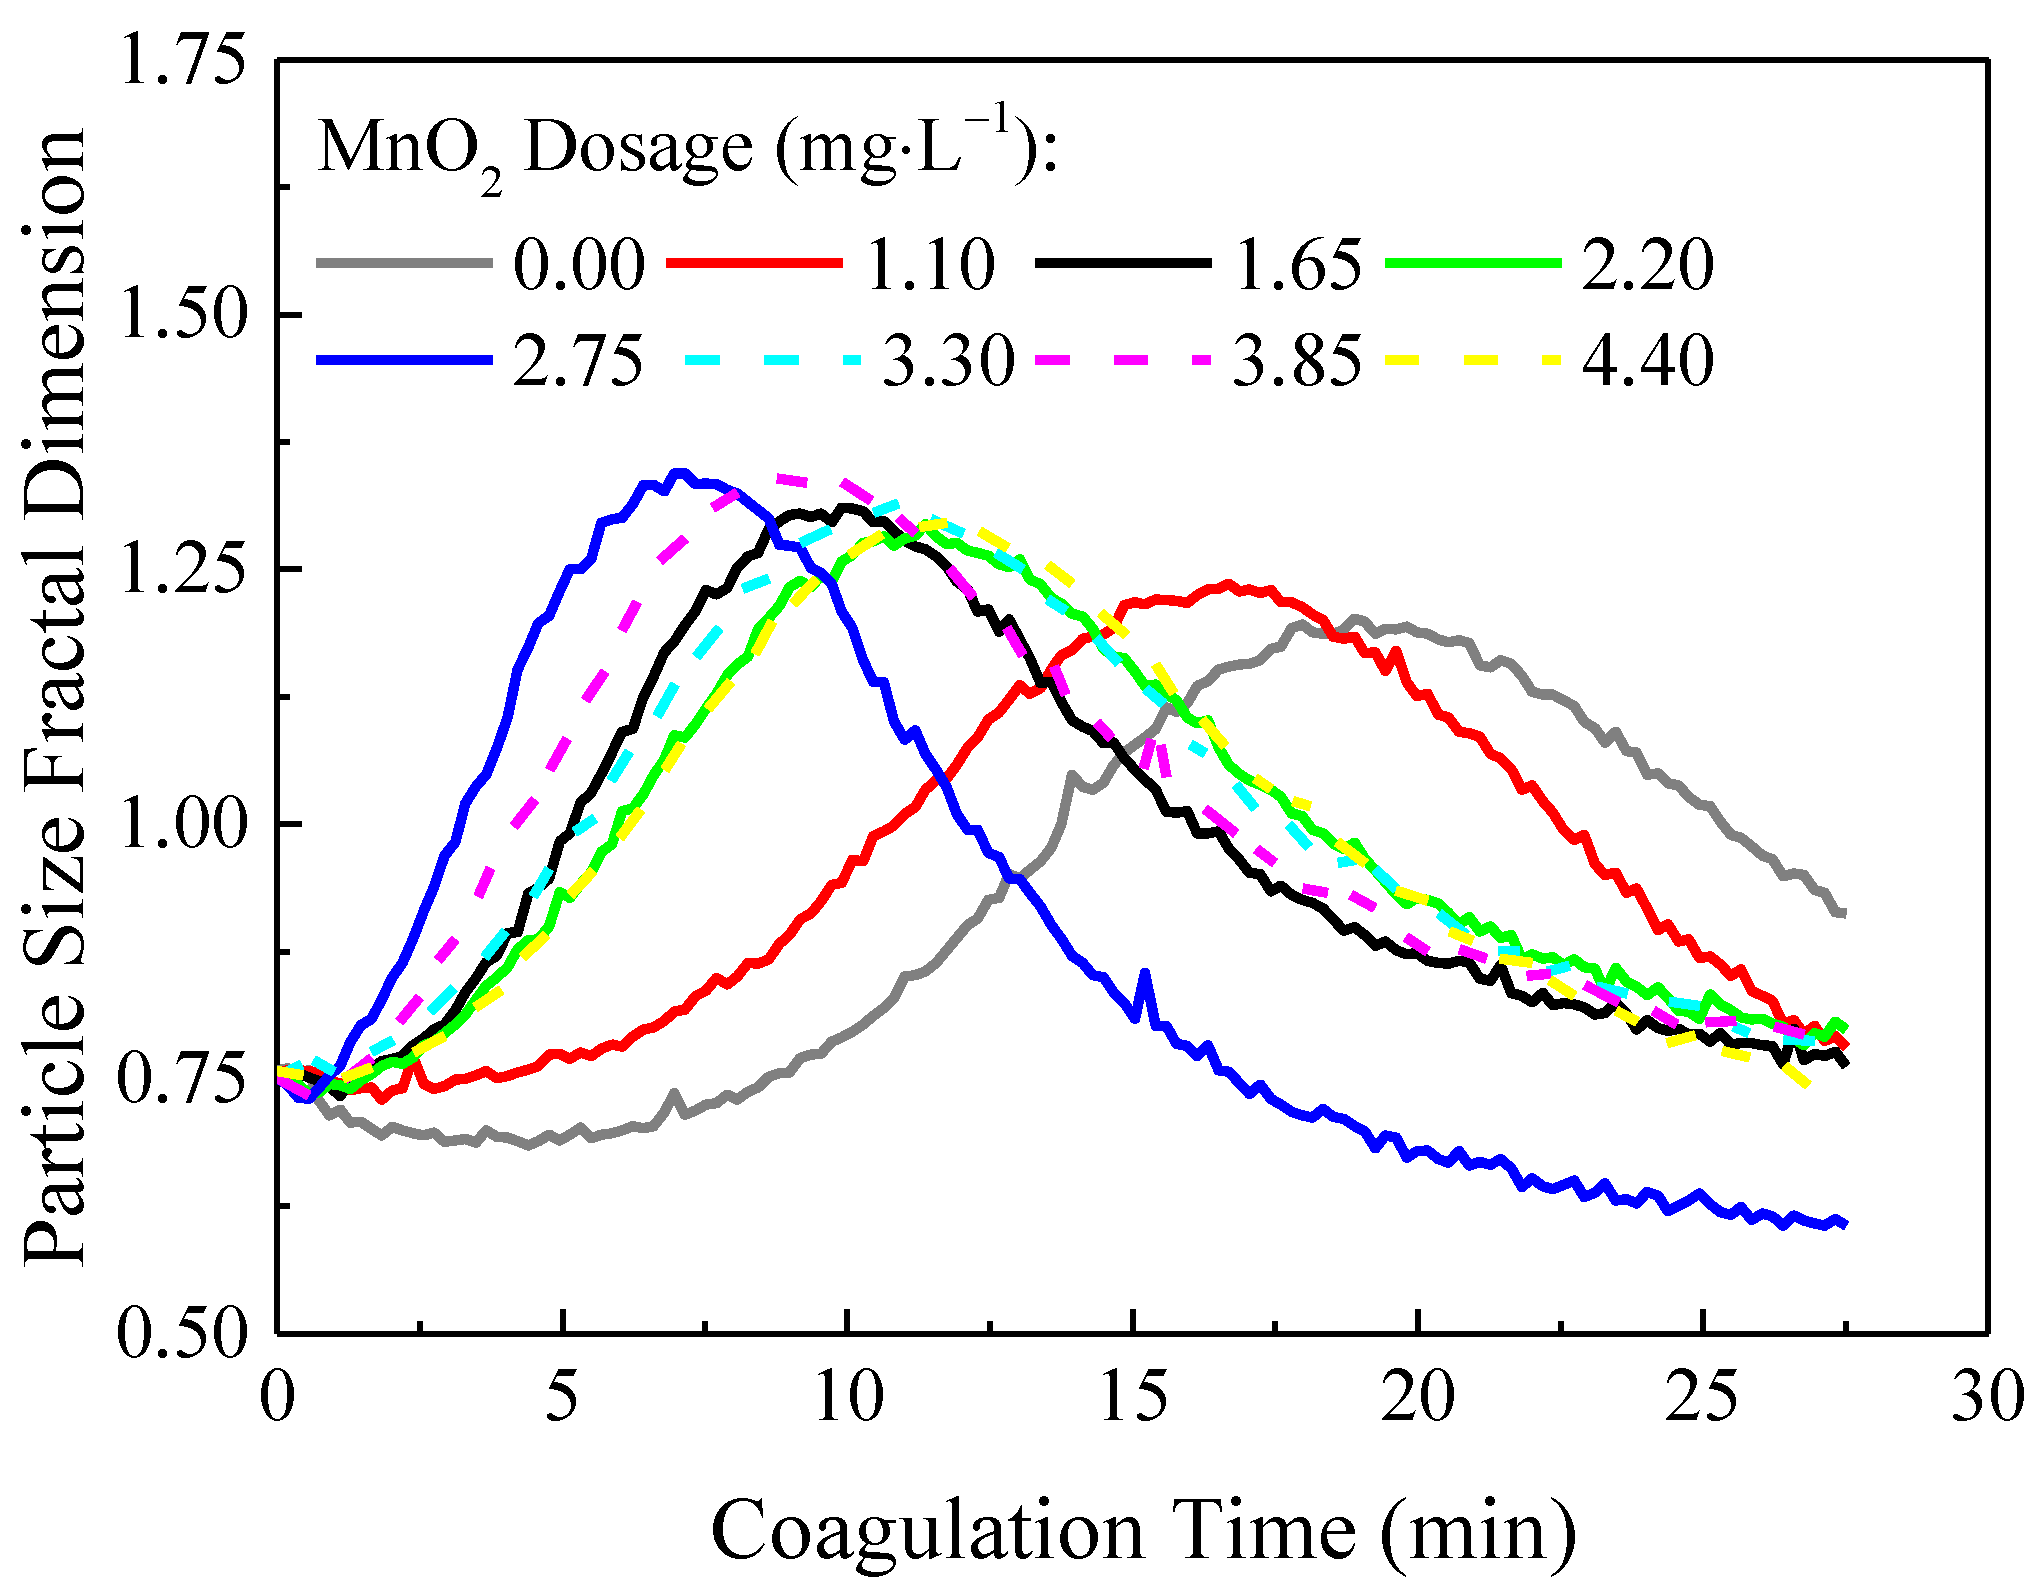
3.2.2. Particle Size Fractal Dimension

The particle size fractal dimension was used to describe the change in the particle size distribution during the coagulation process. The particle size fractal dimension as a function of coagulation time is shown in Figure 4.
The particle size fractal dimension first increased and then decreased with increasing coagulation time. The increases in the curves indicated that the particle size distribution became broader, and the decreases in the curves indicated that the particle size distribution became narrower [30]. At the beginning of the coagulation process, as the number of microflocs decreased quickly and the number of flocs with different diameters increased, the particle size fractal dimension continued to increase until reaching a maximum. Then, the number of flocs with different diameters declined, and sedimentable large flocs tended to form, which caused the particle size fractal dimension to gradually decrease until the end of coagulation.

3.3. Coagulation Process Division Based on the Rate of Change in the Particle Size Fractal Dimension

3.3.1. Division of Coagulation Process

To more accurately analyze the change in the particle size distribution with coagulation time, the rate of change in the particle size fractal dimension, described by its first derivative, was analyzed as a function of coagulation time, as shown in Figure 5. Comparing the four sets of data, the aided coagulation with hydrated MnO2 at dosages of 0.55~3.85 mg·L−1 could be divided into three stages based on the first derivative of the particle size fractal dimension, and all three stages have their own characteristics. Taking the coagulation process at the MnO2 dosage of 1.65 mg·L−1 as an example, as shown in Figure 5b, in the first 6.60 min, the first derivative of the particle size fractal dimension linearly increased from 0 to the maximum value. In the next stage (6.60~15.77 min), the first derivative decreased from the maximum value to a minimum value, and its value also changed from positive to negative. In the last stage (15.77~27.50 min), the first derivative was still negative, but it increased and varied slightly.
Based on the division of the coagulation process, the characteristics of the change in particle number for each test channel were analyzed. For the coagulation process at the MnO2 dosage of 1.65 mg·L−1, as shown in Figure 6, in the first stage (0~6.60 min), the number of 2~3 μm diameter flocs decreased with coagulation time, whereas the number of flocs of other sizes increased. The results showed that the number of 3~4 μm diameter flocs reached a maximum value before the end of the stage, whereas that of the 4~5 μm diameter flocs reached a maximum value at the end of the stage; finally, the number of 8~600 μm diameter flocs exhibited almost no change. These phenomena indicated that floc aggregation at the macro level was a continuous process. The larger the floc size, the harder it was for flocs to form and the slower the change in particle number. In this stage, only the 2~6 μm diameter flocs changed significantly. Therefore, the first stage of the coagulation process could be described as the rapidly changing microfloc stage, referred to as the “primary stage”.
In the second stage (6.60~15.77 min), the number of 2~3 μm diameter flocs continued to decrease, and the number of 3~4 μm and 4~5 μm diameter flocs decreased quickly. The number of 5~6 μm and 6~7 μm diameter flocs first increased and then fell after reaching a maximum value. The number of 7~8 μm diameter flocs continued to increase and reached a maximum value; in contrast, the number of 8~600 μm diameter flocs began to increase slowly. These phenomena indicated that more microflocs aggregated to form small flocs [31] and the number of microflocs reduced quickly. The small flocs were an intermediate in the aggregation of microflocs to form large flocs, so the small flocs could also be called “transitional flocs”. In the second stage, the transitional flocs were continuously generated and participated in aggregation to form large flocs. The aggregation of large flocs increased gradually after the concentration of transitional flocs reached a maximum value. Therefore, the second stage of the coagulation process could be described as the growth stage of transitional flocs and large flocs, referred to as the “growth stage”.
In the third stage (15.77~27.50 min), the number of 2~3 μm diameter flocs showed a trace increase, as the large flocs released some microflocs that were not firmly adsorbed on the periphery. The number of 3~4 μm, 4~5 μm, 5~6 μm, 6~7 μm, and 7~8 μm diameter flocs decreased with increasing coagulation time. The number of 8~600 μm diameter flocs first increased and then decreased slowly after reaching the maximum value. The curves of the 7~8 μm and 8~600 μm diameter flocs had relatively clear variations during the third stage, which corresponded to the breakage and reformation of large flocs. These phenomena indicated that microflocs and transitional flocs still continuously agglomerated to form large flocs in this stage. Meanwhile, some large flocs constantly broke apart and reformed to generate a more compact structure as a result of the water shearing force and mechanical compression. Therefore, the last stage of the coagulation process could be described as a stable growth stage of large flocs, referred to as the “stable stage”.

3.3.2. Rate of Change in Particle Size Fractal Dimension

Taking the coagulation process at the MnO2 dosage of 1.65 mg·L−1 as an example, the linear fits of the first derivative of the particle size fractal dimension with coagulation time in the different stages are shown in Figure 7.
In the primary stage, the first derivative of the fractal dimension linearly increased with increasing coagulation time (R2 = 0.9882). The fitted slope, a constant, indicates the ratio of the particle size fractal dimension to coagulation time. This parameter can be described as the rate of change in the particle size distribution with coagulation time during the primary stage and is referred to as “DfP”. In the growth stage, the first derivative of the fractal dimension linearly decreased with increasing coagulation time (R2 = 0.9717). The fitted slope also indicates the ratio of the particle size fractal dimension to coagulation time. This parameter can be described as the rate of change in the particle size distribution with coagulation time during the growth stage and is referred to as “−DfG”. In the stable stage, there was a certain linear relationship between the first derivative of the fractal dimension and the coagulation time (R2 = 0.7716). However, the curve obviously fluctuated along the fitted line, which means that the flocs were broken and reformed. The residual sum of squares is usually used to describe the relationship between the curve and the fitted line. To evaluate the volatility of the stable stage, the mean residual sum of squares (WRSS) was used to describe the amplitude of variations, as shown in Equation (2):
  W R S S = 0 T S ( y t 2 y t , 0 2 ) T S = R e s i d u a l   S u m   o f   S q u a r e s ( R s s ) T S  
TS: stable stage time, min;
yt: first derivative of the fractal dimension at time t, min−1;
yt,0: linearly fitted value of the first derivative of the fractal dimension at time t, min−1.

3.4. Relationship Between Coagulation and Sedimentation

To control the coagulation process and predict the effects of the coagulation, the relationship between the characteristic parameters of the coagulation and the particle number in settled water was studied based on the division of the coagulation process.

3.4.1. Time Parameters

The duration of each stage of the coagulation process was a direct reflection of the coagulation rate [32]. The relationship between the duration of each stage and the particle number in settled water was studied, as shown in Figure 8.
As shown in Figure 8a, the particle number in settled water increased with increasing time in the primary stage, and the particle number showed a certain linear relation with primary stage time. The linear fitting equations for all measurable flocs and flocs of diameter 2~5 μm are given as (3) and (4), respectively, in Table 2. As shown in Figure 8b, the particle number in settled water linearly increased with increasing growth stage end time. The corresponding linear fitting equations are given as (5) and (6) in Table 2.
The results indicated that the shorter the primary stage, the better the coagulation effect and the lower the particle number in settled water. The earlier the growth stage ended, the better the coagulation effect. Conversely, the particle number in settled water linearly decreased with increasing stable stage time, shown in Figure 8c, which indicated that the longer the stable stage, the better the coagulation effect. The corresponding linear fitting equations are given as (7) and (8), respectively, in Table 2. Comparing the three pairs of linear fitting equations, the R2 value of the linear fitting equation for the number of all measurable flocs was larger than that of microflocs, which means there was a better linear relationship between the number of all measurable flocs and the stage duration.

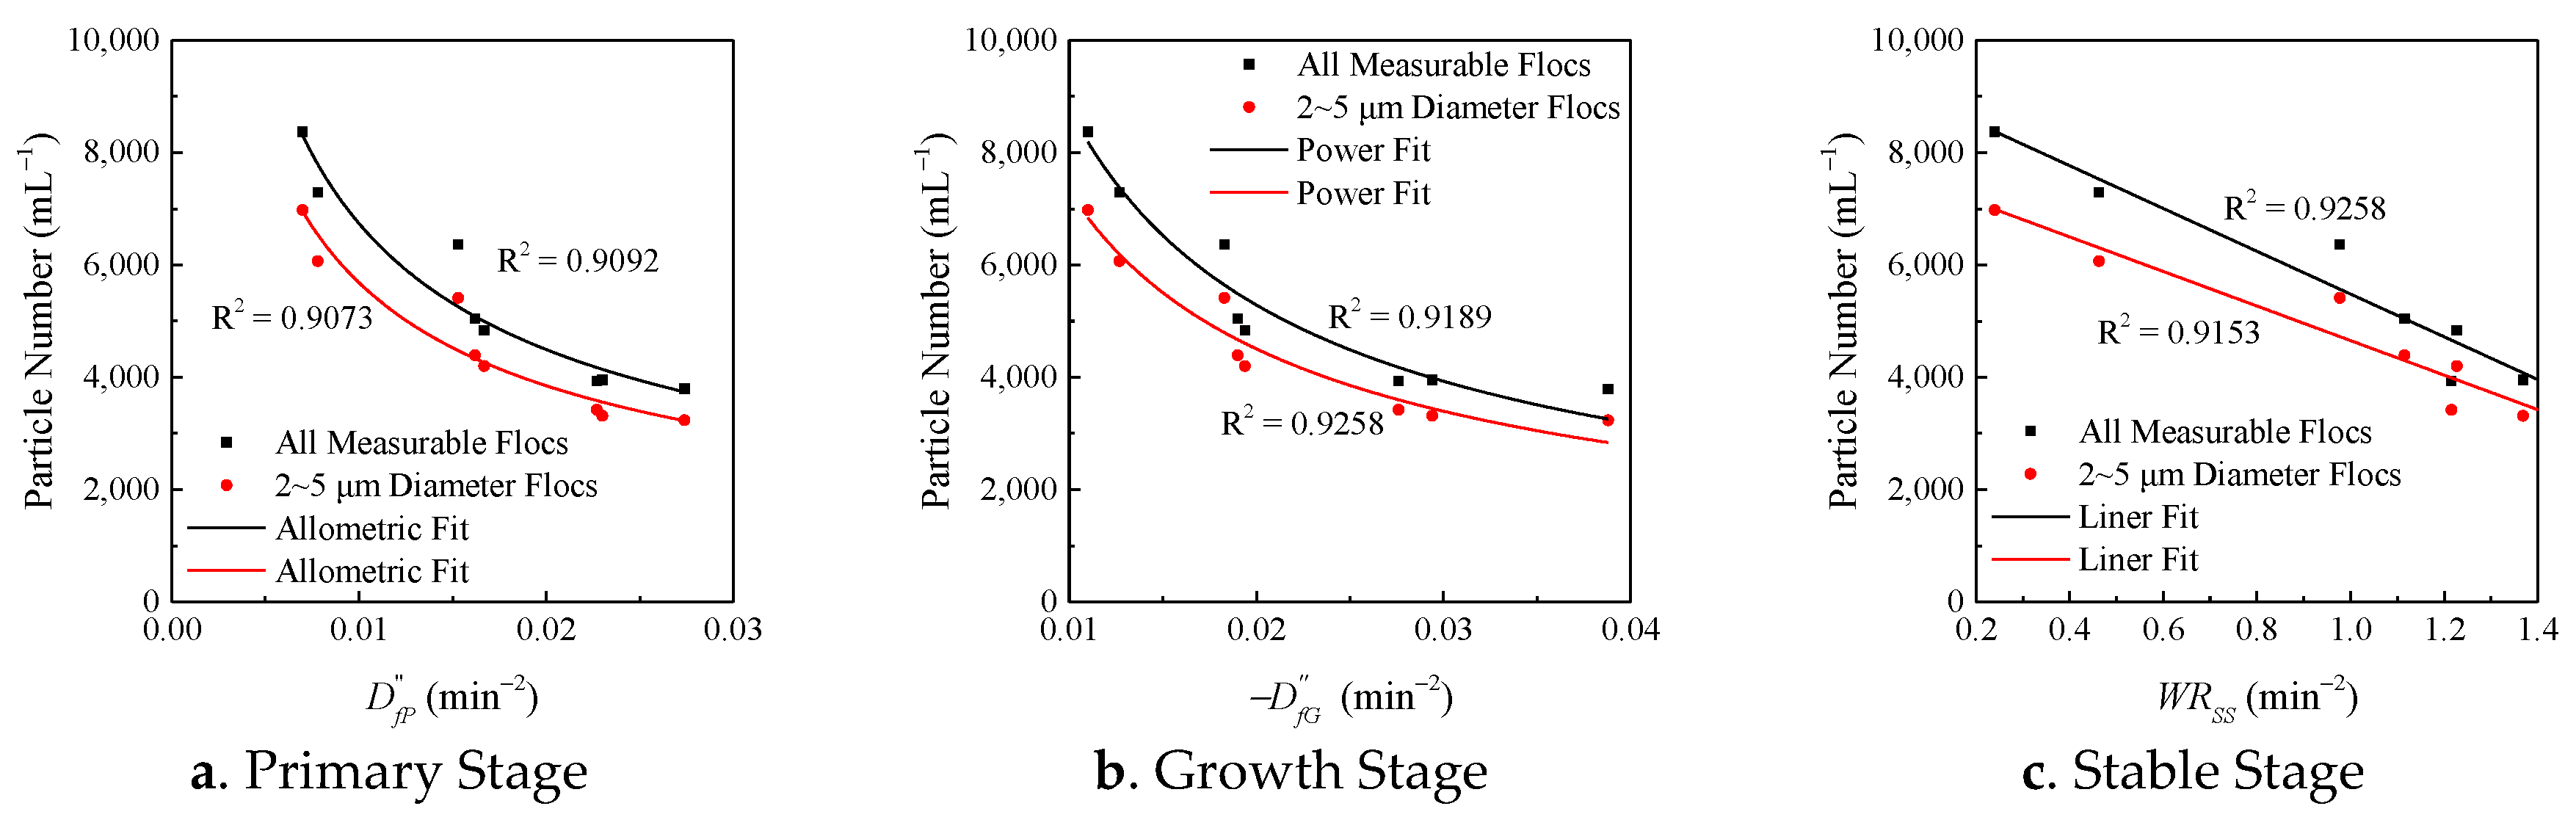
3.4.2. Particle Size Distribution Parameters

The fitting curves of the particle number in settled water as a function of DfP, −DfG, and WRSS are shown in Figure 9. As Figure 9a shows, the particle number in settled water decreased with increasing DfP in the primary stage. There was a power function relationship between the particle number in settled water and DfP, and the corresponding fitting equations for all measurable flocs and flocs of diameter 2~5 μm are given as (9) and (10), respectively, in Table 3. The fitting curve of the particle number in settled water as a function of −DfG in the growth stage is shown in Figure 9b. The particle number in settled water also decreased with increasing −DfG. The corresponding power function equations are given as (11) and (12), respectively, in Table 3. In the stable stage, there was a linear relationship between the particle number in settled water and WRSS, and the corresponding linear fitting equations are given as (13) and (14), respectively, in Table 3.
In the three stages of the coagulation process, the results showed that the R2 values of the fitting equations were all greater than 0.9, which means there was a good relationship between the particle number in settled water and the particle size distribution parameters. Better still, the fitting equations were also appropriate for microflocs. Meanwhile, the R2 values of fitting Equations (9)–(14) were all markedly greater than those of fitting Equations (3)–(8), which indicated that the particle size distribution parameters, DfP, −DfG, and WRSS, were more suitable than the time parameters for evaluating the coagulation effect.

4. Conclusions

A new method for process division based on particle size fractal dimension was put forward. On the basis of the first derivative of the particle size fractal dimension, aided coagulation with hydrated MnO2 at dosages of 0.55~3.85 mg·L−1 could be divided into three stages: a primary stage, growth stage, and stable stage. In the primary stage, most of the microflocs (diameter < 5 µm) aggregated to form small flocs (diameter 5~8 µm). In the growth stage, most of the small flocs aggregated to form large flocs (diameter 8~600 µm). In the stable stage, some large flocs broke apart and reformed to generate a more compact structure.
The characteristic parameters in the three stages were proposed and used to indicate the efficacy of coagulation. In the primary and growth stages, the suitable parameters were the rates of change in the particle size distribution (DfP and −DfG); the particle number in settled water decreased with increasing DfP and −DfG with a power function relationship. Therefore, the efficacy of coagulation can be predicted in advance according to values of DfP and −DfG. In the stable stage, the suitable parameter was WRSS, and the particle number in settled water decreased with increasing WRSS. Therefore, the efficacy of coagulation can be improved through floc breakage and reformation under appropriate conditions.
The method used to evaluate the effect of each stage of the hydrated MnO2-aided coagulation process was simple to perform and provided a new approach for the application of particle-counter devices in water treatment. Further, experiments including more influence factors will be done to improve the method, and a continuous flow experiment will be carried out for actual application.

Author Contributions

Y.Z. and H.L. conceived, designed, and carried out the experiments; Y.Z. wrote the paper; H.L. reviewed the paper.

Funding

This research was funded by Tianjin Enterprise Science and Technology Commissioner Project grant number 18JCTPJC61000.

Conflicts of Interest

The authors declare no conflict of interest.

References

  1. Razali, M.; Kim, J.F.; Attfield, M.P.; Budd, P.M.; Drioli, E.; Lee, Y.M.; Szekely, G. Sustainable wastewater treatment and recycling in membrane manufacturing. Green Chem. 2015, 17, 5196–5205. [Google Scholar] [CrossRef] [Green Version]
  2. Li, W.W.; Yu, H.Q.; He, Z. Towards sustainable wastewater treatment by using microbial fuel cells-centered technologies. Energy Environ. Sci. 2014, 7, 911–924. [Google Scholar] [CrossRef]
  3. Templeton, M.R.; Cantwell, R.E.; Quinn, C.; Hofmann, R.; Andrews, R.C. Pilot-scale assessment of the impacts of transient particulate water quality events on the UV disinfection of indigenous total coliform bacteria in drinking water treatment. J. Water Supply Res. Technol. 2009, 58, 11–20. [Google Scholar] [CrossRef]
  4. Strandman, S.; Vachon, R.; Dini, M.; Giasson, S.; Zhu, X.X. Polyacrylamides revisited: Flocculation of kaolin suspensions and mature fine tailings. Can. J. Chem. Eng. 2017, 96, 20–26. [Google Scholar] [CrossRef]
  5. Liang, H.; Tian, J.Y.; He, W.J.; Han, H.D.; Chen, Z.L.; Li, G.B. Combined preoxidation by permanganate and chlorine in enhancing the treatment of surface water. J. Chem. Technol. Biot. 2009, 84, 1229–1233. [Google Scholar] [CrossRef]
  6. Liu, R.P.; Sun, L.H.; Ju, R.; Wang, H.J.; Liu, H.J.; Gu, J.N.; Li, G.B. Effect of hydrous manganese dioxide on the treatment of low-turbidity source water: Plant-scale experience. J. Environ. Eng. 2011, 137, 481–486. [Google Scholar] [CrossRef]
  7. Li, H.Y.; Nan, J. Micro analysis of efficacy and mechanism of aid-coagulation with hydrated MnO2. In Proceedings of the 2009 International Conference on Energy and Environment Technology, Guilin, China, 16–18 October 2009; pp. 623–628. [Google Scholar] [CrossRef]
  8. Valtcheva, I.B.; Marchetti, P.; Livingston, A.G. Crosslinked polybenzimidazole membranes for organic solvent nanofiltration (OSN): Analysis of crosslinking reaction mechanism and effects of reaction parameters. J. Membr. Sci. 2015, 493, 568–579. [Google Scholar] [CrossRef]
  9. Didaskalou, C.; Kupai, J.; Cseri, L.; Barabas, J.; Vass, E.; Holtzl, T.; Szekely, G. Membrane-grafted asymmetric organocatalyst for an integrated synthesis-separation platform. ACS Catal. 2018, 8, 7430–7438. [Google Scholar] [CrossRef]
  10. Jiang, J.Q. The role of coagulation in water treatment. Curr. Opin. Chem. Eng. 2015, 8, 36–44. [Google Scholar] [CrossRef]
  11. Kuśnierz, M.; Wiercik, P. Analysis of particle size and fractal dimensions of suspensions contained in raw sewage, treated sewage and activated sludge. Arch. Environ. Prot. 2016, 42, 67–76. [Google Scholar] [CrossRef] [Green Version]
  12. Wei, J.C.; Gao, B.Y.; Yue, Q.Y.; Wang, Y.; Li, W.W.; Zhu, X.B. Comparison of coagulation behavior and floc structure characteristic of different polyferric-cationic polymer dual-coagulants in humic acid solution. Water Res. 2009, 43, 724–732. [Google Scholar] [CrossRef] [PubMed]
  13. He, W.P.; Nan, J.; Li, H.Y.; Li, S.N. Characteristic analysis on temporal evolution of floc size and structure in low-shear flow. Water Res. 2012, 46, 509–520. [Google Scholar] [CrossRef] [PubMed]
  14. Du, L.G.; Bonner, J.S.; Garton, L.S.; Ernest, A.N.S.; Autenrieth, R.L. Modeling coagulation kinetics incorporating fractal theories: A fractal rectilinear approach. Water Res. 2000, 34, 1987–2000. [Google Scholar] [CrossRef]
  15. Du, L.G.; Bonner, J.S.; Garton, L.S.; Ernest, A.N.S.; Autenrieth, R.L. Modeling coagulation kinetics incorporating fractal theories: Comparison with observed data. Water Res. 2002, 36, 1056–1066. [Google Scholar] [CrossRef] [PubMed]
  16. Gregory, J. Monitoring particle aggregation processes. Adv. Colloid Interface Sci. 2009, 147–148, 109–123. [Google Scholar] [CrossRef] [PubMed]
  17. Vahedi, A.; Gorczyca, B. Predicting the settling velocity of flocs formed in water treatment using multiple fractal dimensions. Water Res. 2012, 46, 4188–4194. [Google Scholar] [CrossRef] [PubMed]
  18. Kilander, J.; Blomström, S.; Rasmuson, A. Spatial and temporal evolution of floc size distribution in a stirred square tank investigated using PIV and image analysis. Chem. Eng. Sci. 2006, 61, 7651–7667. [Google Scholar] [CrossRef]
  19. Margaritis, K.; Athanasios, G.K. Evolution of aggregate size and fractal dimension during Brownian coagulation. J. Aerosol Sci. 2001, 32, 1399–1420. [Google Scholar] [CrossRef]
  20. Amjad, H.; Khan, Z. A comparison of fractal dimensions of clay and humic acid flocs under optimum coagulation conditions. Int. J. Environ. Sci. Dev. 2016, 7, 240–243. [Google Scholar] [CrossRef]
  21. Li, D.S.; Cheng, G.D. Experimental study on treatment of high turbidity water from Yellow River by the technology of enhanced swirling clarifier. Chin. J. Environ. Eng. 2008, 2, 214–219. [Google Scholar]
  22. Gao, L.Q.; Zhang, Y.F.; Zhang, Z.H.; Yang, L.Y.; Jing, Q.N. Optimizing selection of coagulant for treatment of low temperature raw water of Tianjin Haihe River. J. Tianjin Polytech. Univ 2008, 27, 41–43. [Google Scholar] [CrossRef]
  23. Cong, H.B.; Sun, F.; Chen, W.J.; Xu, Y.J.; Wang, W. Study on the method and mechanism of pre-pressure coagulation and sedimentation for microcystis removal from drinking-water sources. Environ. Technol. 2017, 39, 443–449. [Google Scholar] [CrossRef] [PubMed]
  24. Logan, B.E.; Kilps, J.R. Fractal dimensions of aggregates formed in different fluid mechanical environments. Water Res. 1995, 29, 443–453. [Google Scholar] [CrossRef]
  25. Zhu, Z.F.; Peng, D.Z.; Dou, J. Changes in the two-dimensional and perimeter-based fractal dimensions of kaolinite flocs during flocculation: A simple experimental study. Water Sci. Technol. 2018, 77, 861–870. [Google Scholar] [CrossRef] [PubMed]
  26. Wang, D.S.; Wu, R.B.; Jiang, Y.Z.; Chow, C.W.K. Characterization of floc structure and strength: Role of changing shear rates under various coagulation mechanisms. Colloids Surf. A Physicochem. Eng. Asp. 2011, 379, 36–42. [Google Scholar] [CrossRef] [Green Version]
  27. Yu, W.Z.; Gregory, J.; Yang, Y.L.; Sun, M.; Liu, T.; Li, G.B. Effect of coagulation and applied breakage shear on the regrowth of kaolin flocs. Environ. Eng. Sci. 2010, 27, 483–492. [Google Scholar] [CrossRef]
  28. Boer, D.H.D.; Stone, M.; Lévesque, L.M.J. Fractal dimensions of individual flocs and floc populations in streams. Hydrol. Process. 2000, 14, 653–667. [Google Scholar] [CrossRef]
  29. Lin, Q.T.; Peng, H.L.; Lin, Q.L.; Yin, G.C. Formation, breakage and re-formation of flocs formed by cationic starch. Water Sci. Technol. 2013, 68, 1352–1358. [Google Scholar] [CrossRef] [PubMed]
  30. Zhou, Z.W.; Yang, Y.L.; Li, X.; Wang, W.Q.; Wu, Y.; Wang, C.Y.; Luo, J.L. Coagulation performance and flocs characteristics of recycling pre-sonicated condensate sludge for low-turbidity surface water treatment. Sep. Purif. Technol. 2014, 123, 1–8. [Google Scholar] [CrossRef]
  31. Gonzalez-Torres, A.; Putnam, J.; Jefferson, B.; Stuetz, R.M.; Henderson, R.K. Examination of the physical properties of microcystis aeruginosa, flocs produced on coagulation with metal salts. Water Res. 2014, 60, 197–209. [Google Scholar] [CrossRef] [PubMed]
  32. Wei, L.; Zhao, J.H.; Xu, C.; Liu, M.L. Experimental analysis of magnesium hydroxide-reactive orange floc formation time and rate in coagulation process. J. Taiwan Inst. Chem. Eng. 2014, 45, 2605–2609. [Google Scholar] [CrossRef]
Figure 1. Experimental apparatus (Unit: mm).
Processes 06 00237 g001
Figure 2. Number of all measurable flocs and microflocs in settled water treated with MnO2.
Processes 06 00237 g002
Figure 3. Change in the number of flocs with coagulation time. (ag) The number of flocs with a diameter of 2~3 μm, 3~4 μm, 4~5 μm, 5~6 μm, 6~7 μm, 7~8 μm, and 8~600 μm; (h) the number of all measurable flocs.
Processes 06 00237 g003aProcesses 06 00237 g003b
Figure 4. Change in the particle size fractal dimension with coagulation time.
Processes 06 00237 g004
Figure 5. Change in particle size fractal dimension and its first derivative as a function of coagulation time. (ad) MnO2 dosage of 0.55, 1.65, 2.75, and 3.85 mg·L−1.
Processes 06 00237 g005
Figure 6. Change in the number of each size of floc in the three stages. (a) The number of flocs with a diameter of 2~3 μm, 3~4 μm, 4~5 μm, 5~6 μm, and 6~7 μm; (b) the number of flocs with a diameter of 7~8 μm and 8~600 μm.
Processes 06 00237 g006
Figure 7. Linear fit of the first derivative of particle size fractal dimension with coagulation time. (a) In the primary stage; (b) in the growth stage; and (c) in the stable stage.
Processes 06 00237 g007
Figure 8. Linear fit between the particle number in settled water and the duration of the coagulation stage. (a) In the primary stage; (b) in the growth stage; and (c) in the stable stage.
Processes 06 00237 g008
Figure 9. Fitting curves for the particle number in settled water as a function of DfP, −DfG, and WRss. (a) In the primary stage; (b) in the growth stage; and (c) in the stable stage.
Processes 06 00237 g009
Table 1. Output data channels of the particle counter.
Channel1234567
Particle Size (µm)2~33~44~55~66~77~88~600
Table 2. Linear fitting equations for the particle number in settled water as a function of stage duration.
No.YXEquationR2
(3)All Measurable FlocsPrimary Stage TimeY = 1819.10 + 505.65X0.8137
(4)2~5 μm Diameter FlocsPrimary Stage TimeY = 1712.40 + 406.03X0.7932
(5)All Measurable FlocsGrowth Stage End TimeY = 110.18 + 335.04X0.7874
(6)2~5 μm Diameter FlocsGrowth Stage End TimeY = 357.77 + 267.92X0.7598
(7)All Measurable FlocsStable Stage TimeY = 9382.29 − 340.09X0.8164
(8)2~5 μm Diameter FlocsStable Stage TimeY = 7795.11 − 273.92X0.8017
Table 3. Fitting equations for the particle number in settled water as a function of DfP, −DfG, and WRss.
No.YXEquationR2
(9)All Measurable FlocsDfPY = 457.18X−0.58420.9092
(10)2~5 μm Diameter FlocsDfPY = 427.16X−0.56200.9073
(11)All Measurable FlocsDfGY = 302.20X−0.73150.9189
(12)2~5 μm Diameter FlocsDfGY = 294.17X−0.69760.9258
(13)All Measurable FlocsWRSSY = 9227.65 − 3751.26X0.9258
(14)2~5 μm Diameter FlocsWRSSY = 7678.76 − 3029.53X0.9153

