Article

Kinetic Modelling for Flavonoid Recovery from Red Grape (Vitis vinifera) Pomace with Aqueous Lactic Acid

by
Katerina Tzima
1,
Stamatina Kallithraka
2,
Yorgos Kotseridis
2 and
Dimitris P. Makris
1,*
1
School of Environment, University of the Aegean, Mitr. Ioakim Street, Myrina 81400, Lemnos, Greece
2
Department of Food Science & Human Nutrition, Agricultural University of Athens, Iera Odos Street, Athens 11855, Greece
*
Author to whom correspondence should be addressed.
Processes 2014, 2(4), 901-911; https://doi.org/10.3390/pr2040901
Submission received: 20 September 2014 / Revised: 17 November 2014 / Accepted: 2 December 2014 / Published: 10 December 2014

Abstract

:
This study was undertaken with the aim of establishing a correlation between the extraction yield in total flavonoids from red grape pomace and the extraction temperature, using 0.5% (w/v) aqueous lactic acid as the solvent system. Extraction of flavonoids was found to obey second-order kinetics, and on such a basis, the yield in total flavonoids at saturation could be very effectively determined and correlated with temperature using non-linear regression. The results indicated that the extraction yield at saturation is highly correlated with temperature, following a quadratic function. The extract obtained at 40 °C had an optimal predicted total flavonoid yield of 13.27 mg rutin equivalents per gram of dry weight, and it was further analyzed by liquid chromatography-mass spectrometry to characterize its major constituents. The polyphenols detected were flavanols, flavonols and an anthocyanin. The outcome of this study outlined that temperatures above 40 °C are rather unfavorable for flavonoid extraction from red grape pomace, as suggested by the model established through kinetics.

1. Introduction

Winemaking generates a very large amount of residues, characterized by a high content of biodegradable compounds. The residues consist of the remains of de-stemmed grapes, the sediments obtained during clarification, bagasse from pressing and lees, which are obtained after different decanting steps. These wastes may have phytotoxic effects if applied to crops, and thus, pollution problems associated with winery waste treatment and disposal have raised serious concerns about subsurface flow and the impact on the surrounding ecosystems [1].
This waste material has been extensively investigated over the last few years, given its exceptionally high levels for a spectrum of polyphenolic phytochemicals, which possess bioactivities beneficial to human health; yet, the methodologies for efficient, but also environmentally compatible, recovery of these substances may suffer serious shortcomings, such as the toxicity of the solvents used (methanol, acetone), the need for solvent removal and recycling (ethanol) and cost (supercritical fluids). However, the search for plant food residues as cost-effective sources of multifunctional phytochemicals embraces valorization strategies in the direction of: (i) exploiting materials with a high content and a rich composition; (ii) deploying effective recovery processes; and (iii) ascertaining the production of novel formulations without further generation of waste, such as waste solvents, which pose severe environmental risks [2]. In this line, the use of low-cost, non-toxic solvent systems for the recovery of target compounds becomes imminent [3,4].
Organic acids, such as citric acid, are non-toxic natural food constituents and, owing to their relatively low pKa, they may serve as very effective pH regulators. This has been a significant factor in the use of environmentally-benign solvents, employed for the extraction of bioactive polyphenols from various sources, because it has been observed that pH modification might affect extraction selectivity [5,6,7,8]. In particular, it has been demonstrated that basic pH in low-ethanol media was more favorable for polyphenol extraction from red grape pomace (RGP) [9]. Furthermore, studies on the extraction of polyphenols from grape stems using water/ethanol solutions showed that efficient flavanol extraction required a lower pH, as opposed to total flavonoid, whose extraction was facilitated at a pH higher than 4.5 [10]. The mechanism by which pH may modify polyphenol extraction selectivity is not clear, but earlier reports suggested that in a moderately acidic environment (pH > 5), the most acidic phenolic hydroxyls on the polyphenol skeleton might be weakly dissociated, thus becoming more soluble [6]. This could enable more effective transfer of polyphenols from the solid particles into the liquid phase, hence the increased yields observed.
The present study was undertaken to investigate the potential of aqueous solutions of lactic acid to act as an efficient, non-toxic means of extracting polyphenols from red grape pomace. The experimental setup was based on the optimization of acid concentration and resident time, taking into consideration the total flavonoid yield of the extracts obtained. Kinetics and non-linear regression analysis were employed to define a set of conditions that may be used for further engineering the extraction process. Some principal polyphenols detected in the richest extract obtained were tentatively identified using liquid chromatography-mass spectrometry.

2. Experimental Procedure

2.1. Chemicals

All solvents used for chromatographic purposes were HPLC grade. Rutin (quercetin 3-O-rutinoside) was from Sigma Chemical Co. (St. Louis, MO, USA). Lactic acid (LA) and aluminum chloride (AlCl3) were from Merck (Darmstad, Germany).

2.2. Red Grape Pomace

Grape pomace originating from vinification of the Agiorgitiko variety (Vitis vinifera spp.) was kindly provided by the Department of Food Science and Human Nutrition, Agricultural University of Athens. The pomace was dried in an oven at 65 °C for 48 h and then pulverized into a fine powder (approximate mean particle diameter: 0.3 mm) in a laboratory mill. Following drying, the moisture content of RGP was estimated to be 55% ± 2%. The pulverized material was kept at −20 °C until use.

2.3. Extraction Procedure

An aliquot of 2.4 g of pulverized RGP was added in 120 mL of 0.5% (w/v) LA solution, in a 250-mL glass vial, and extractions were performed under stirring with a Teflon-coated magnetic stirrer, at 80 rpm and various temperatures (30, 40, 60 °C). Sampling was carried out by removing 1 mL of extract at predetermined intervals over a period of 320 min, according to the experimental design. The concentration of LA solution used, as well as the range of the extraction period, was based on preliminary experimentation.

2.4. Total Flavonoid Yield (YTFn)

A previously reported protocol was used [10], with modifications. An aliquot of 0.05 mL AlCl3 (2% in 5% acetic acid in methanol) was mixed with 0.5 mL sample and 0.5 mL 5% acetic acid in methanol. The mixture was left for 30 min at room temperature, and the absorbance was measured at 415 nm. Determination of the total flavonoid concentration (CTFn) in the extracts obtained, expressed in mg·L−1, was carried out using rutin (quercetin 3-O-rutinoside) as the calibrating standard. The total flavonoid yield, YTFn, was determined as mg rutin equivalents (RtE) per g dry pomace weight (dpw), as follows:
Y T F n   ( m g   R t E   g 1 d p w ) =   C T F n × V m
where V is the volume of the extract (in mL) and m the dry pomace weight (in g).

2.5. Kinetics and Statistical Analyses

All determinations were carried out at least in triplicate, and values were averaged and given along with the standard deviation (±SD). Kinetics was performed by carrying out non-linear regression between YTFn and t values. Kinetics and linear and non-linear correlations were established at least at a 95% significance level (p < 0.05). For all statistics, SigmaPlot™ (London, UK) 12.0 and Microsoft Excel™ (Redmond, WA, USA) 2010 were used.

3. Results and Discussion

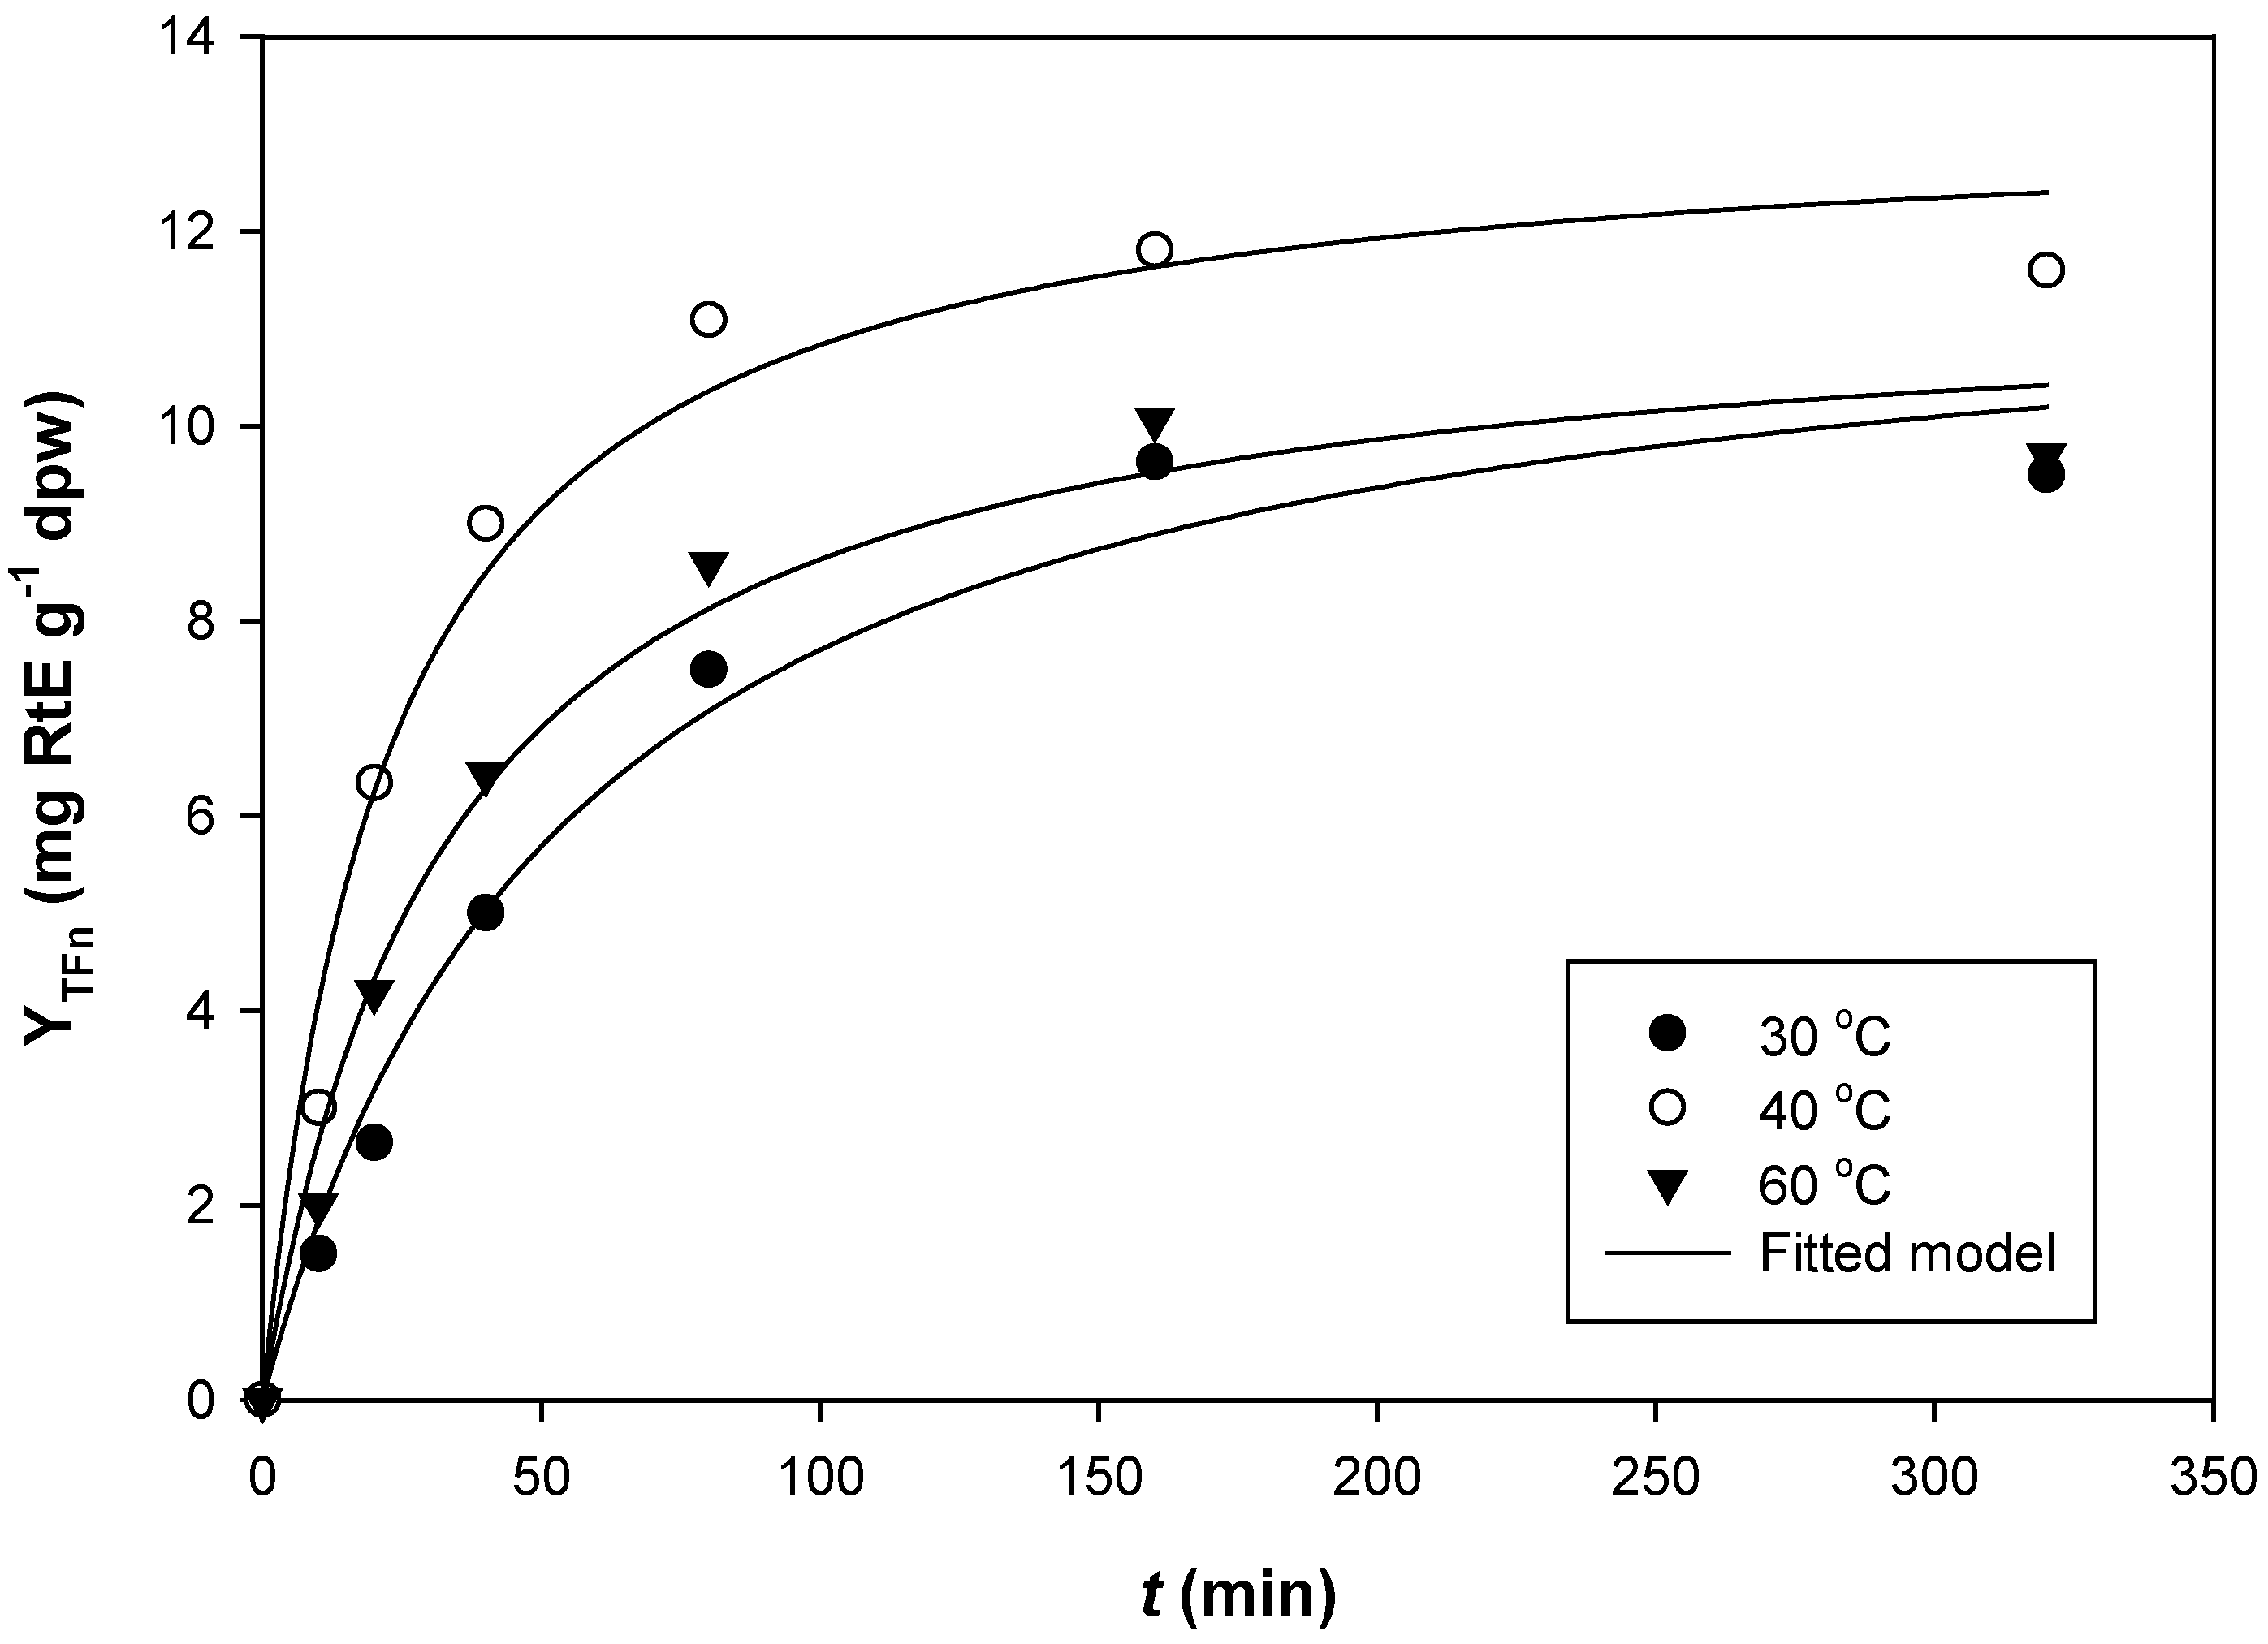
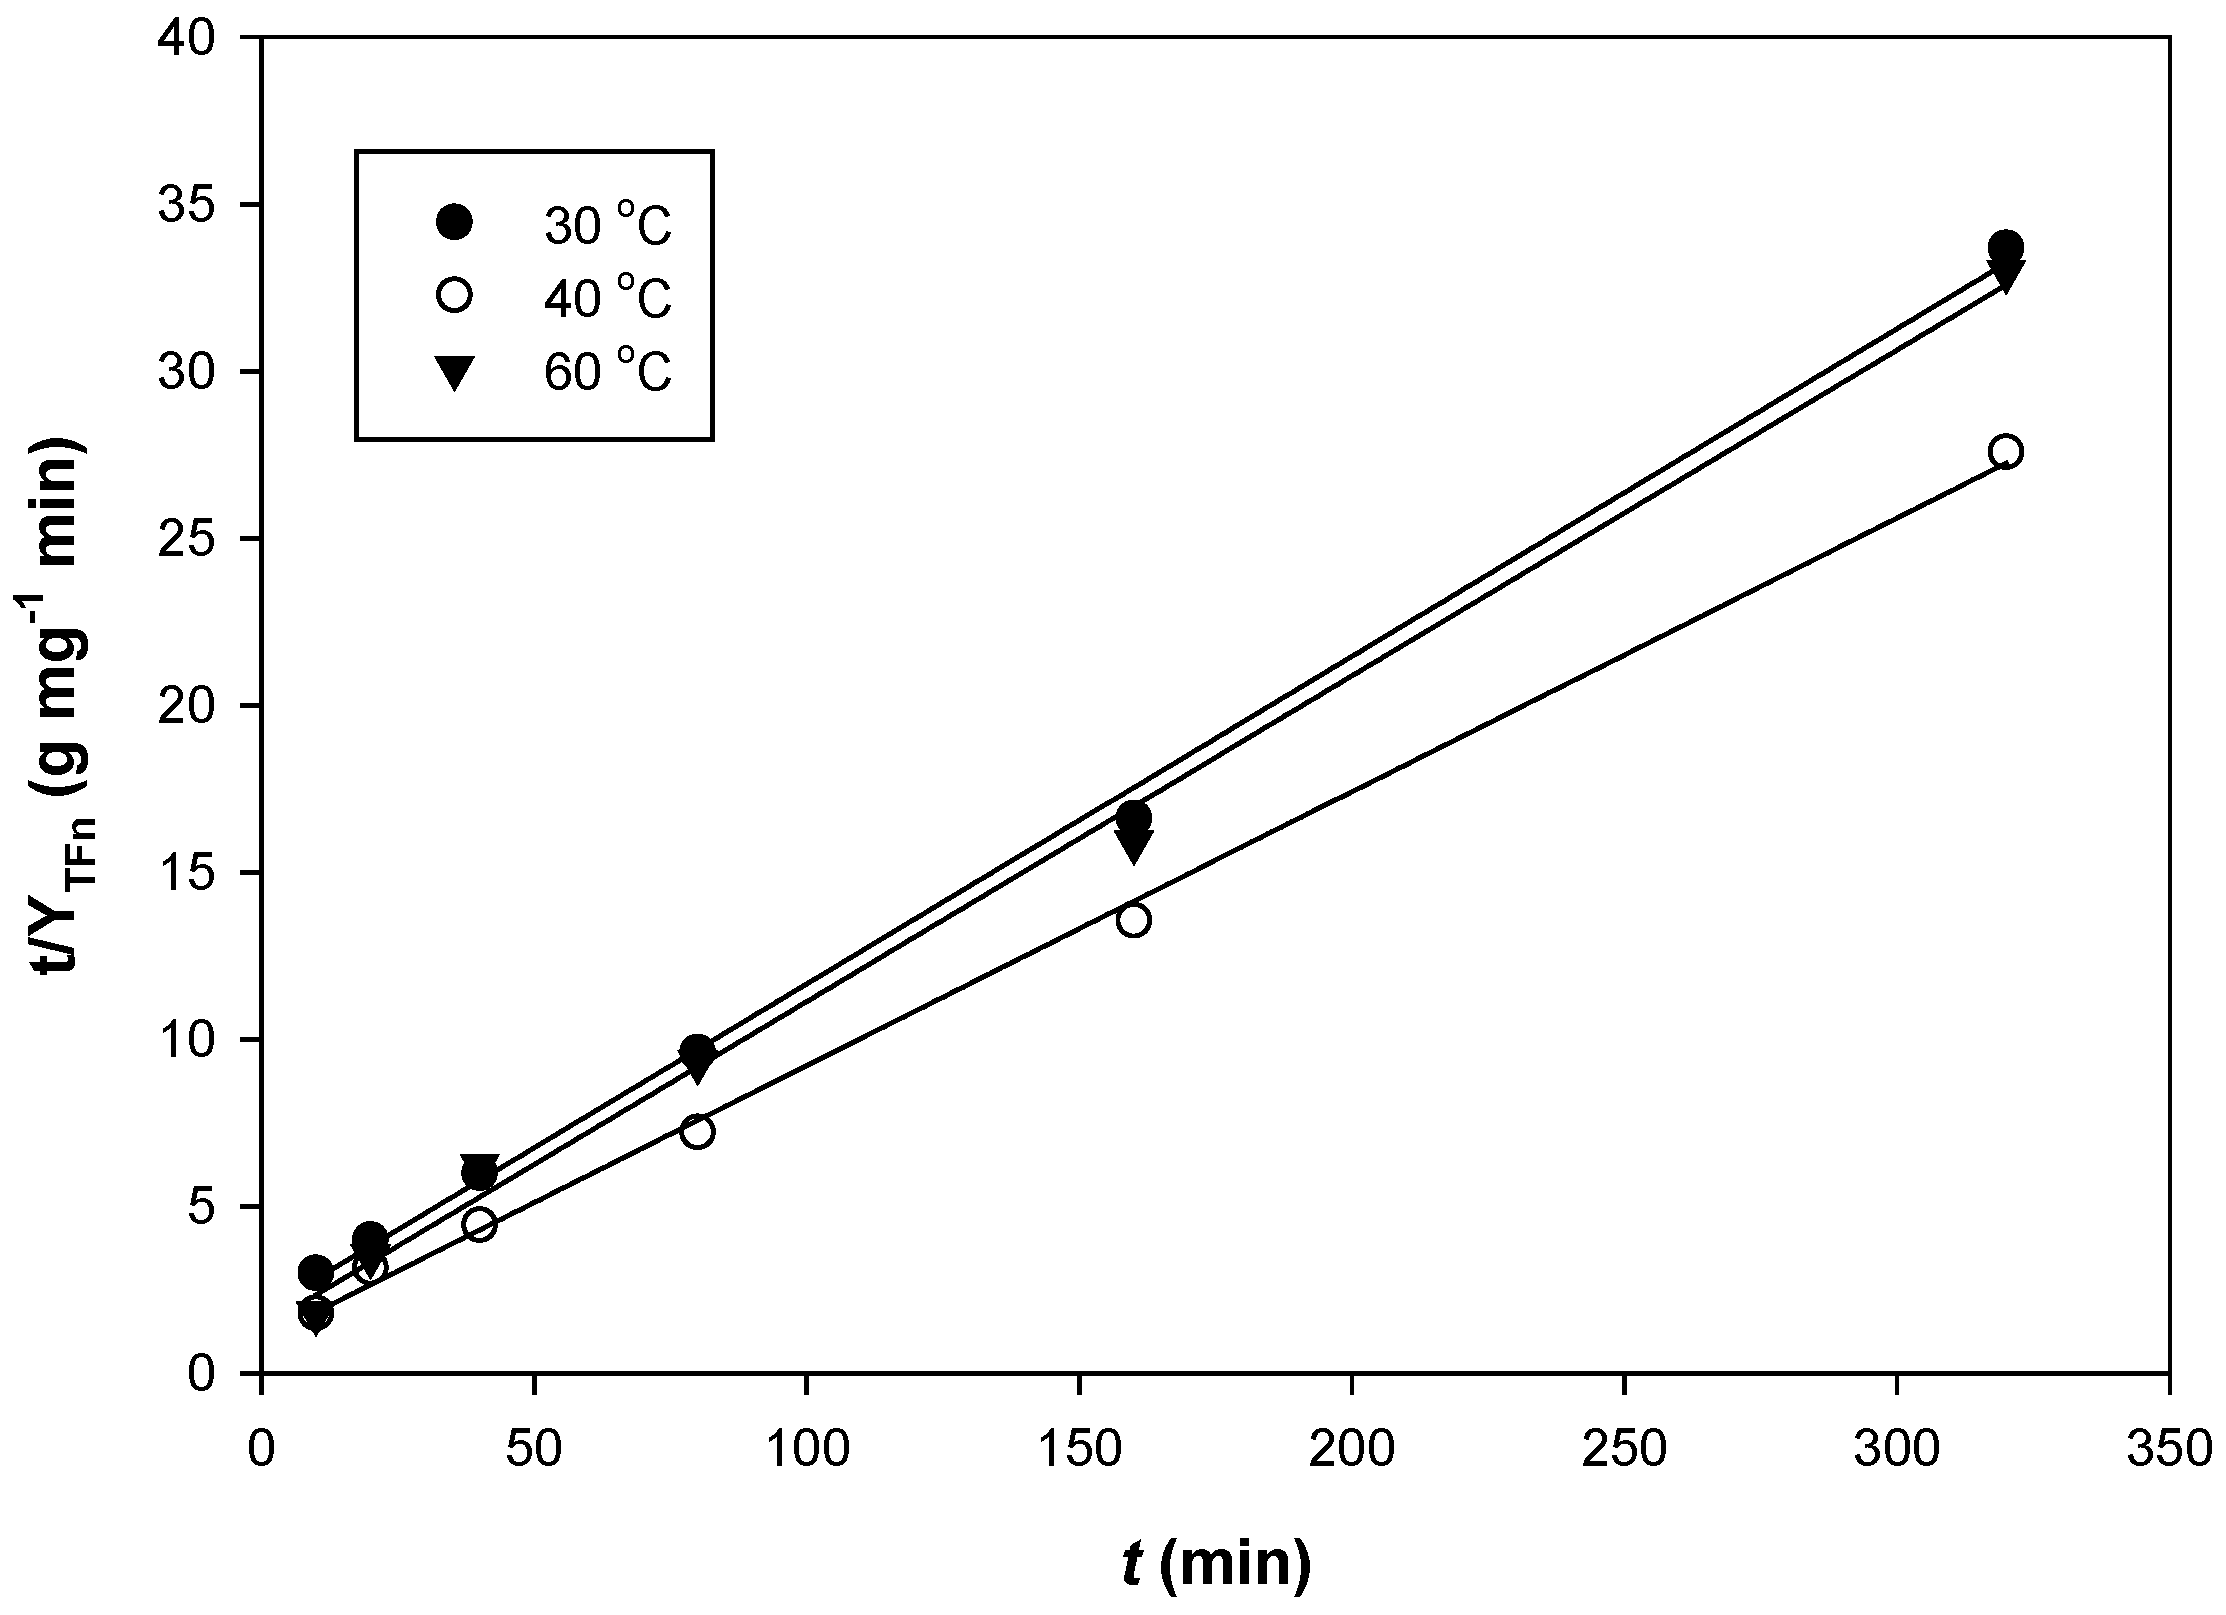
3.1. Kinetics of TFn Extraction

The curve fitted to the experimental data (Figure 1) described the second-order extraction kinetics, considering the boundary conditions t = 0 to t and YTFn(t) = 0 to YTFn(t) [3]:
Y T F n ( t ) =   Y T F n ( s ) 2 k t 1 +   Y T F n ( s ) k t
where YTFn(s) and k represent the TFn yield at saturation and the extraction rate constant, respectively. Fitting for every temperature tested was statistically significant (R2 > 0.97, p < 0.0001), suggesting that Equation (2) can adequately predict YTFn as a function of t.
Figure 1. Time course of total flavonoid yield (YTFn) during the extraction of red grape pomace (RGP) using 0.5% (w/v) aqueous lactic acid (LA) at various temperatures. Extractions were carried out at 80 rpm and a liquid-to-solid ratio of 50 mL·g−1.
Processes 02 00901 g001
By admitting the assumptions that (i) polyphenols leached from the solid particles into the solution through diffusion and (ii) at saturation conditions, YTFn remained constant, the second-order extraction kinetics is rather indicative of two extractions phases: first, diffusion was fast, most probably due to the fast solubilization of polar phenolics and the high concentration gradient, as stated by Fick’s law; second, diffusion was slowed down, because of the lower concentration gradient and the longer time required for the extraction of the less polar or the less easily-extracted compounds.
Transformation of Equation (2) provides a linearized form:
t Y T F n ( t ) =   1 k Y T F n ( s ) 2 +   t Y T F n ( s )
When t approaches 0, the initial extraction rate, h, given as YTFn(t)/t, is defined as:
h = k Y T F n ( s ) 2
Plotting t/YTFn(t) versus t would give a straight line in the form of y = ax + b (Figure 2), where a = 1/YTFn(s) and b = 1/h. Thus for each case examined, YTFn(s), k and h could be determined graphically. For all temperatures tested, the correlations between t/YTFn(t) and t were very high and statistically significant (R2 > 0.99, p < 0.0001), which permitted the reliable determination of the kinetic parameters (Table 1).
Figure 2. Second-order kinetics of TFn extraction from RGP using 0.5% (w/v) aqueous LA. Extractions were carried out at 80 rpm and a liquid-to-solid ratio of 50 mL·g−1.
Processes 02 00901 g002
Table 1. Parameters of second-order kinetics, determined for the YTFn using 0.5% (w/v) aqueous lactic acid, at the temperatures tested. dpw, dry pomace weight; RtE, rutin equivalents.
T (°C)Kinetic Parameters
k (g·mg−1·min−1) × 10−3h (mg·g−1·min−1)YTFn(s) (mg·RtE·g−1·dpw)
301.510.2211.98
403.350.5913.27
602.620.3511.50
The overall extraction constant k showed an increasing tendency from 30 to 40 °C, but declined by shifting the extraction temperature from 40 to 60 °C. This phenomenon was consistent for h and YTFn(s), indicating that temperatures above 40 °C did not favor flavonoid extraction, resulting in poorer YTFn due to a reduced extraction rate. Previous studies reported similar results regarding anthocyanin extraction, where temperatures above 35 °C gave reduced extraction yields [11]. Likewise, total polyphenol extraction from onion solid wastes was negatively affected by temperatures higher than 40 °C [12]. However, contradictory results have also been reported [13].
In order to better illustrate the effect of both t and T on YTFn, the building of a kinetic model was attempted. Non-linear regression between YTFn(s) and T values was shown to obey a quadratic function. This function was described by the following equation:
YTFn(s) = −0.59 + 0.64T − 0.0072T2 (R2 = 1.000, p < 0.0001)
Thus, using Equation (5), YTFn(s) can be very reliably predicted as a function of T, within the range 30–60 °C. In the same fashion, non-linear regression between h and T values was shown to obey a quadratic correlation, described by the following equation:
h = −0.76 + 0.064T − 0.0008T2
After rearrangement of Equation (3), YTFn at any time, t, can be calculated:
Y T F n ( t ) =   t 1 h +   t Y T F n ( s )
Combining Equations (5)–(7), the following mathematical model is obtained:
Y T F n ( t , T ) =   t 1 0.0008 T 2 + 0.064 T 0.76 +   t 0.0072 T 2 + 0.64 T 0.59
The empirical Equation (8) represents the evolution model of YTFn during extraction of flavonoids from RGP with aqueous LA (0.5% w/v) and provides the values for YTFn at any time t and any temperature T, ranging between 10 and 320 min, and 30 and 60 °C, respectively.

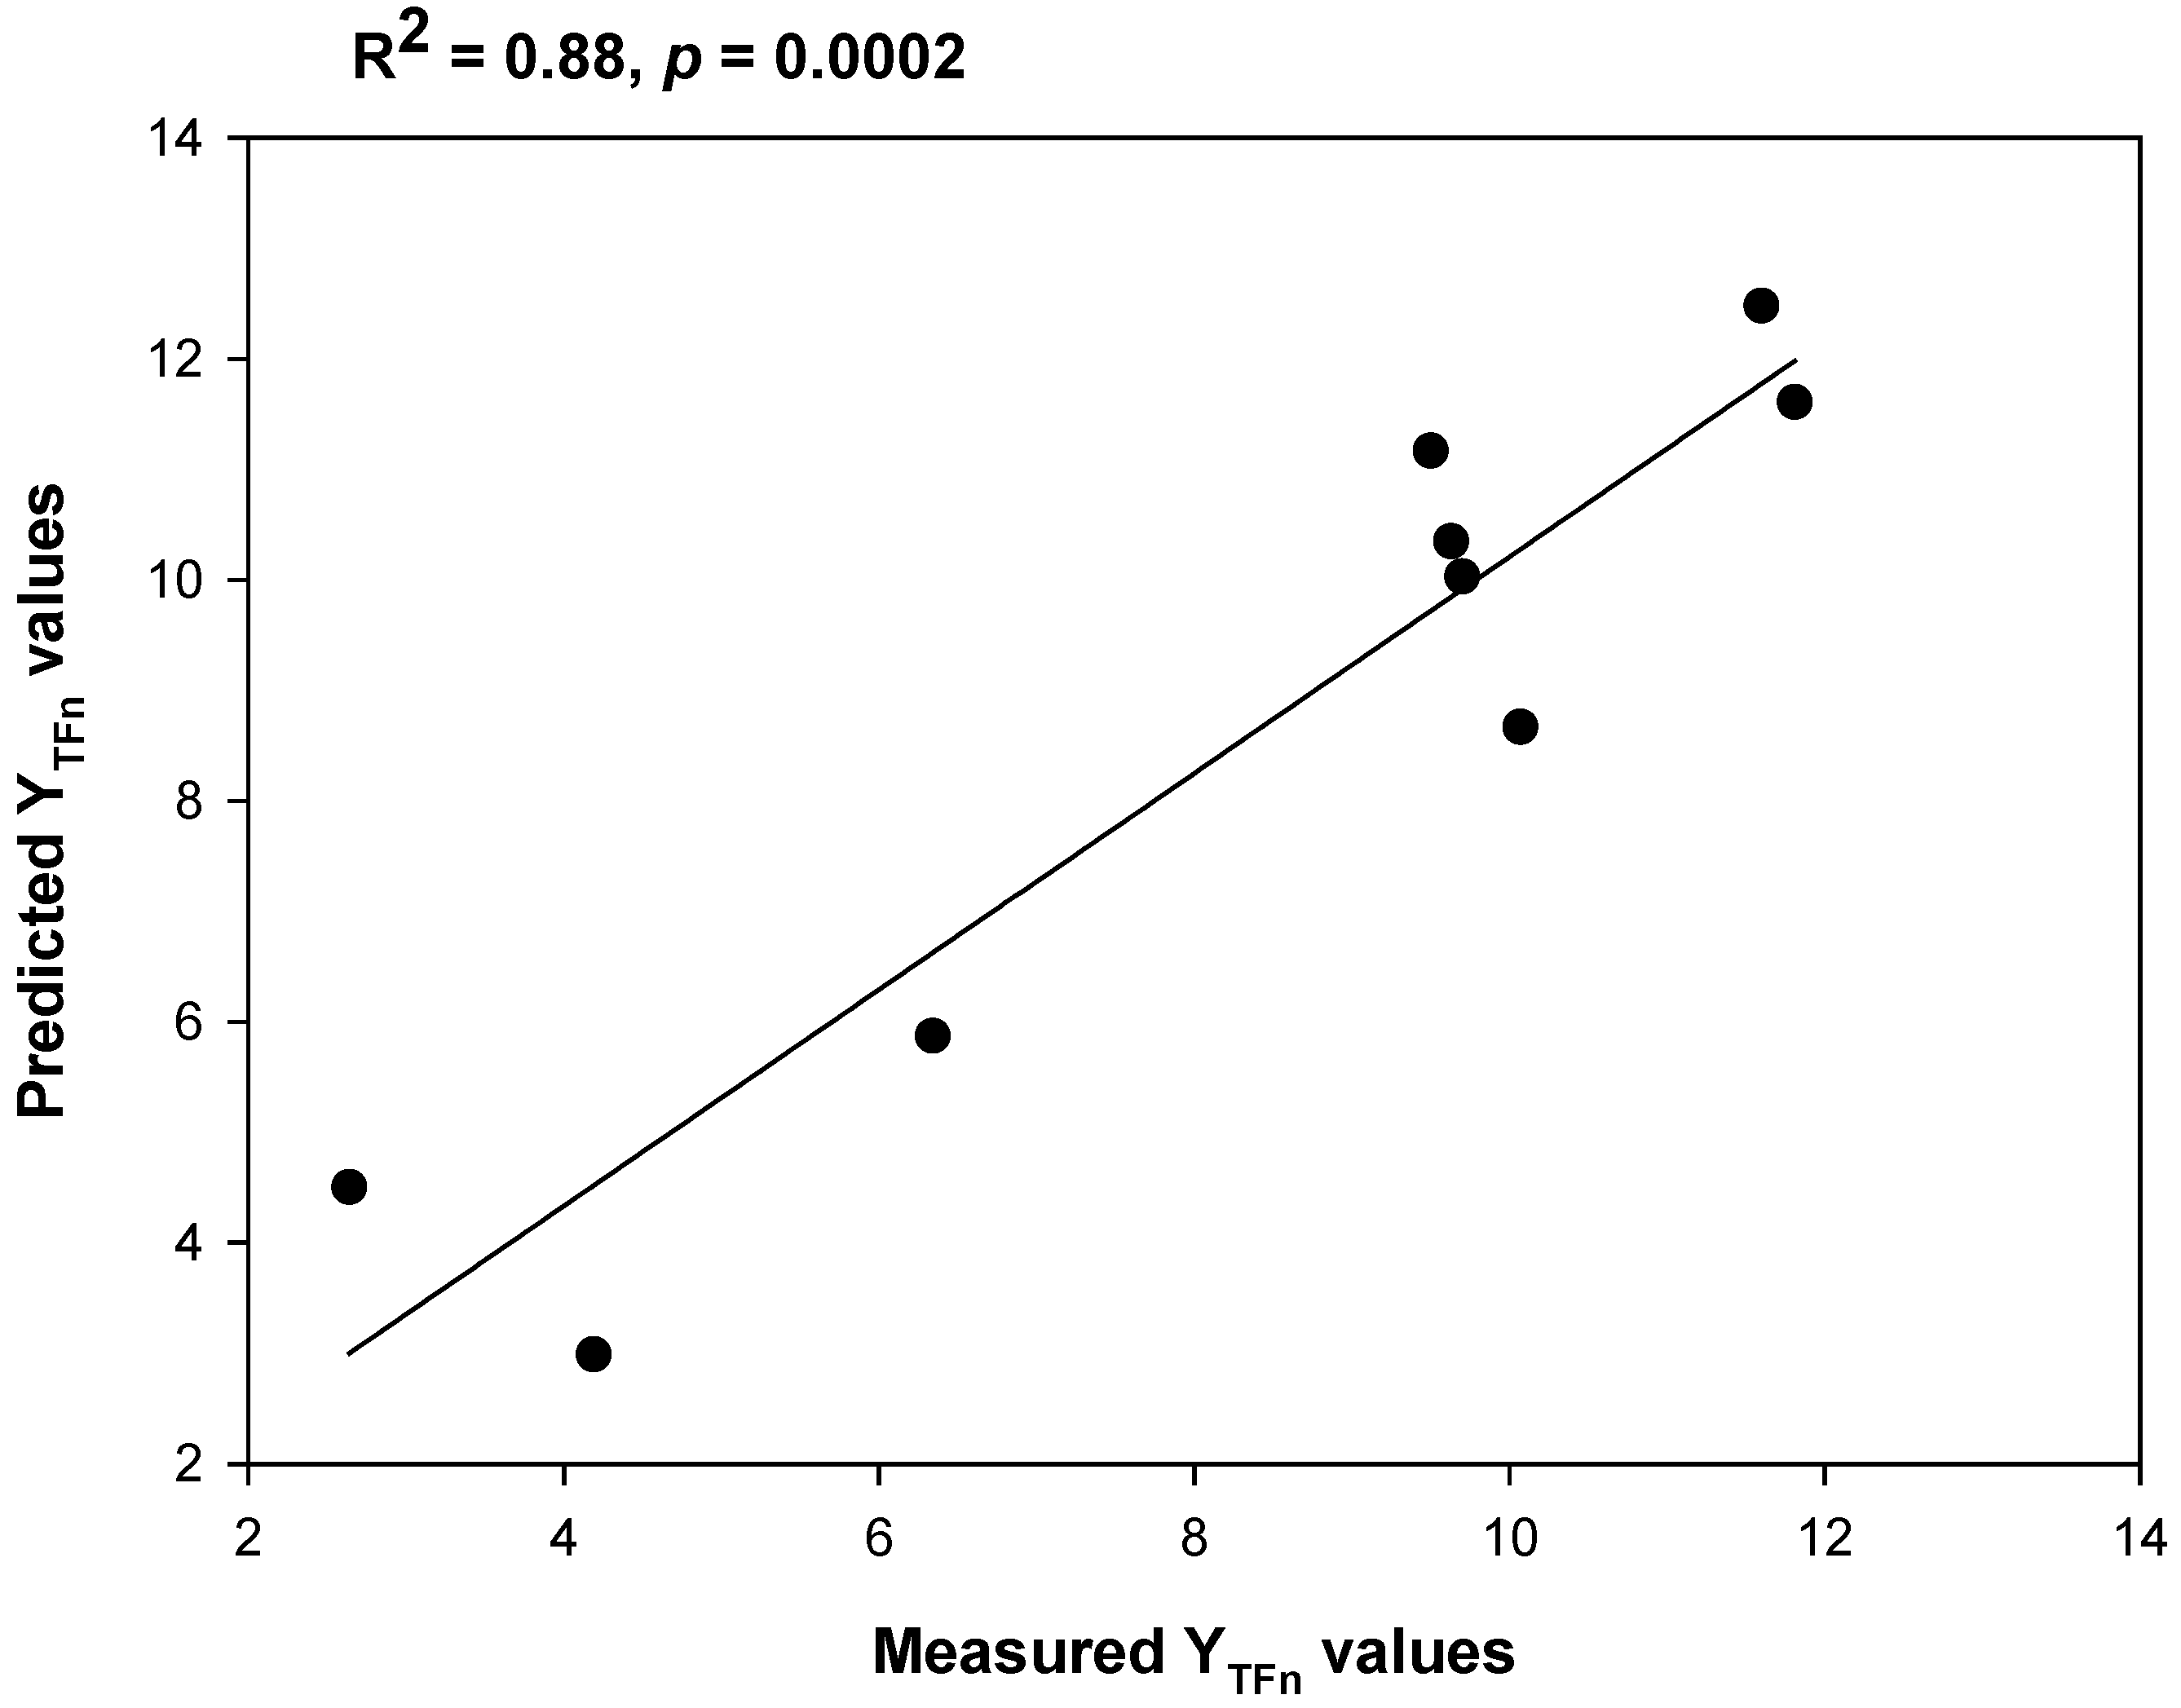
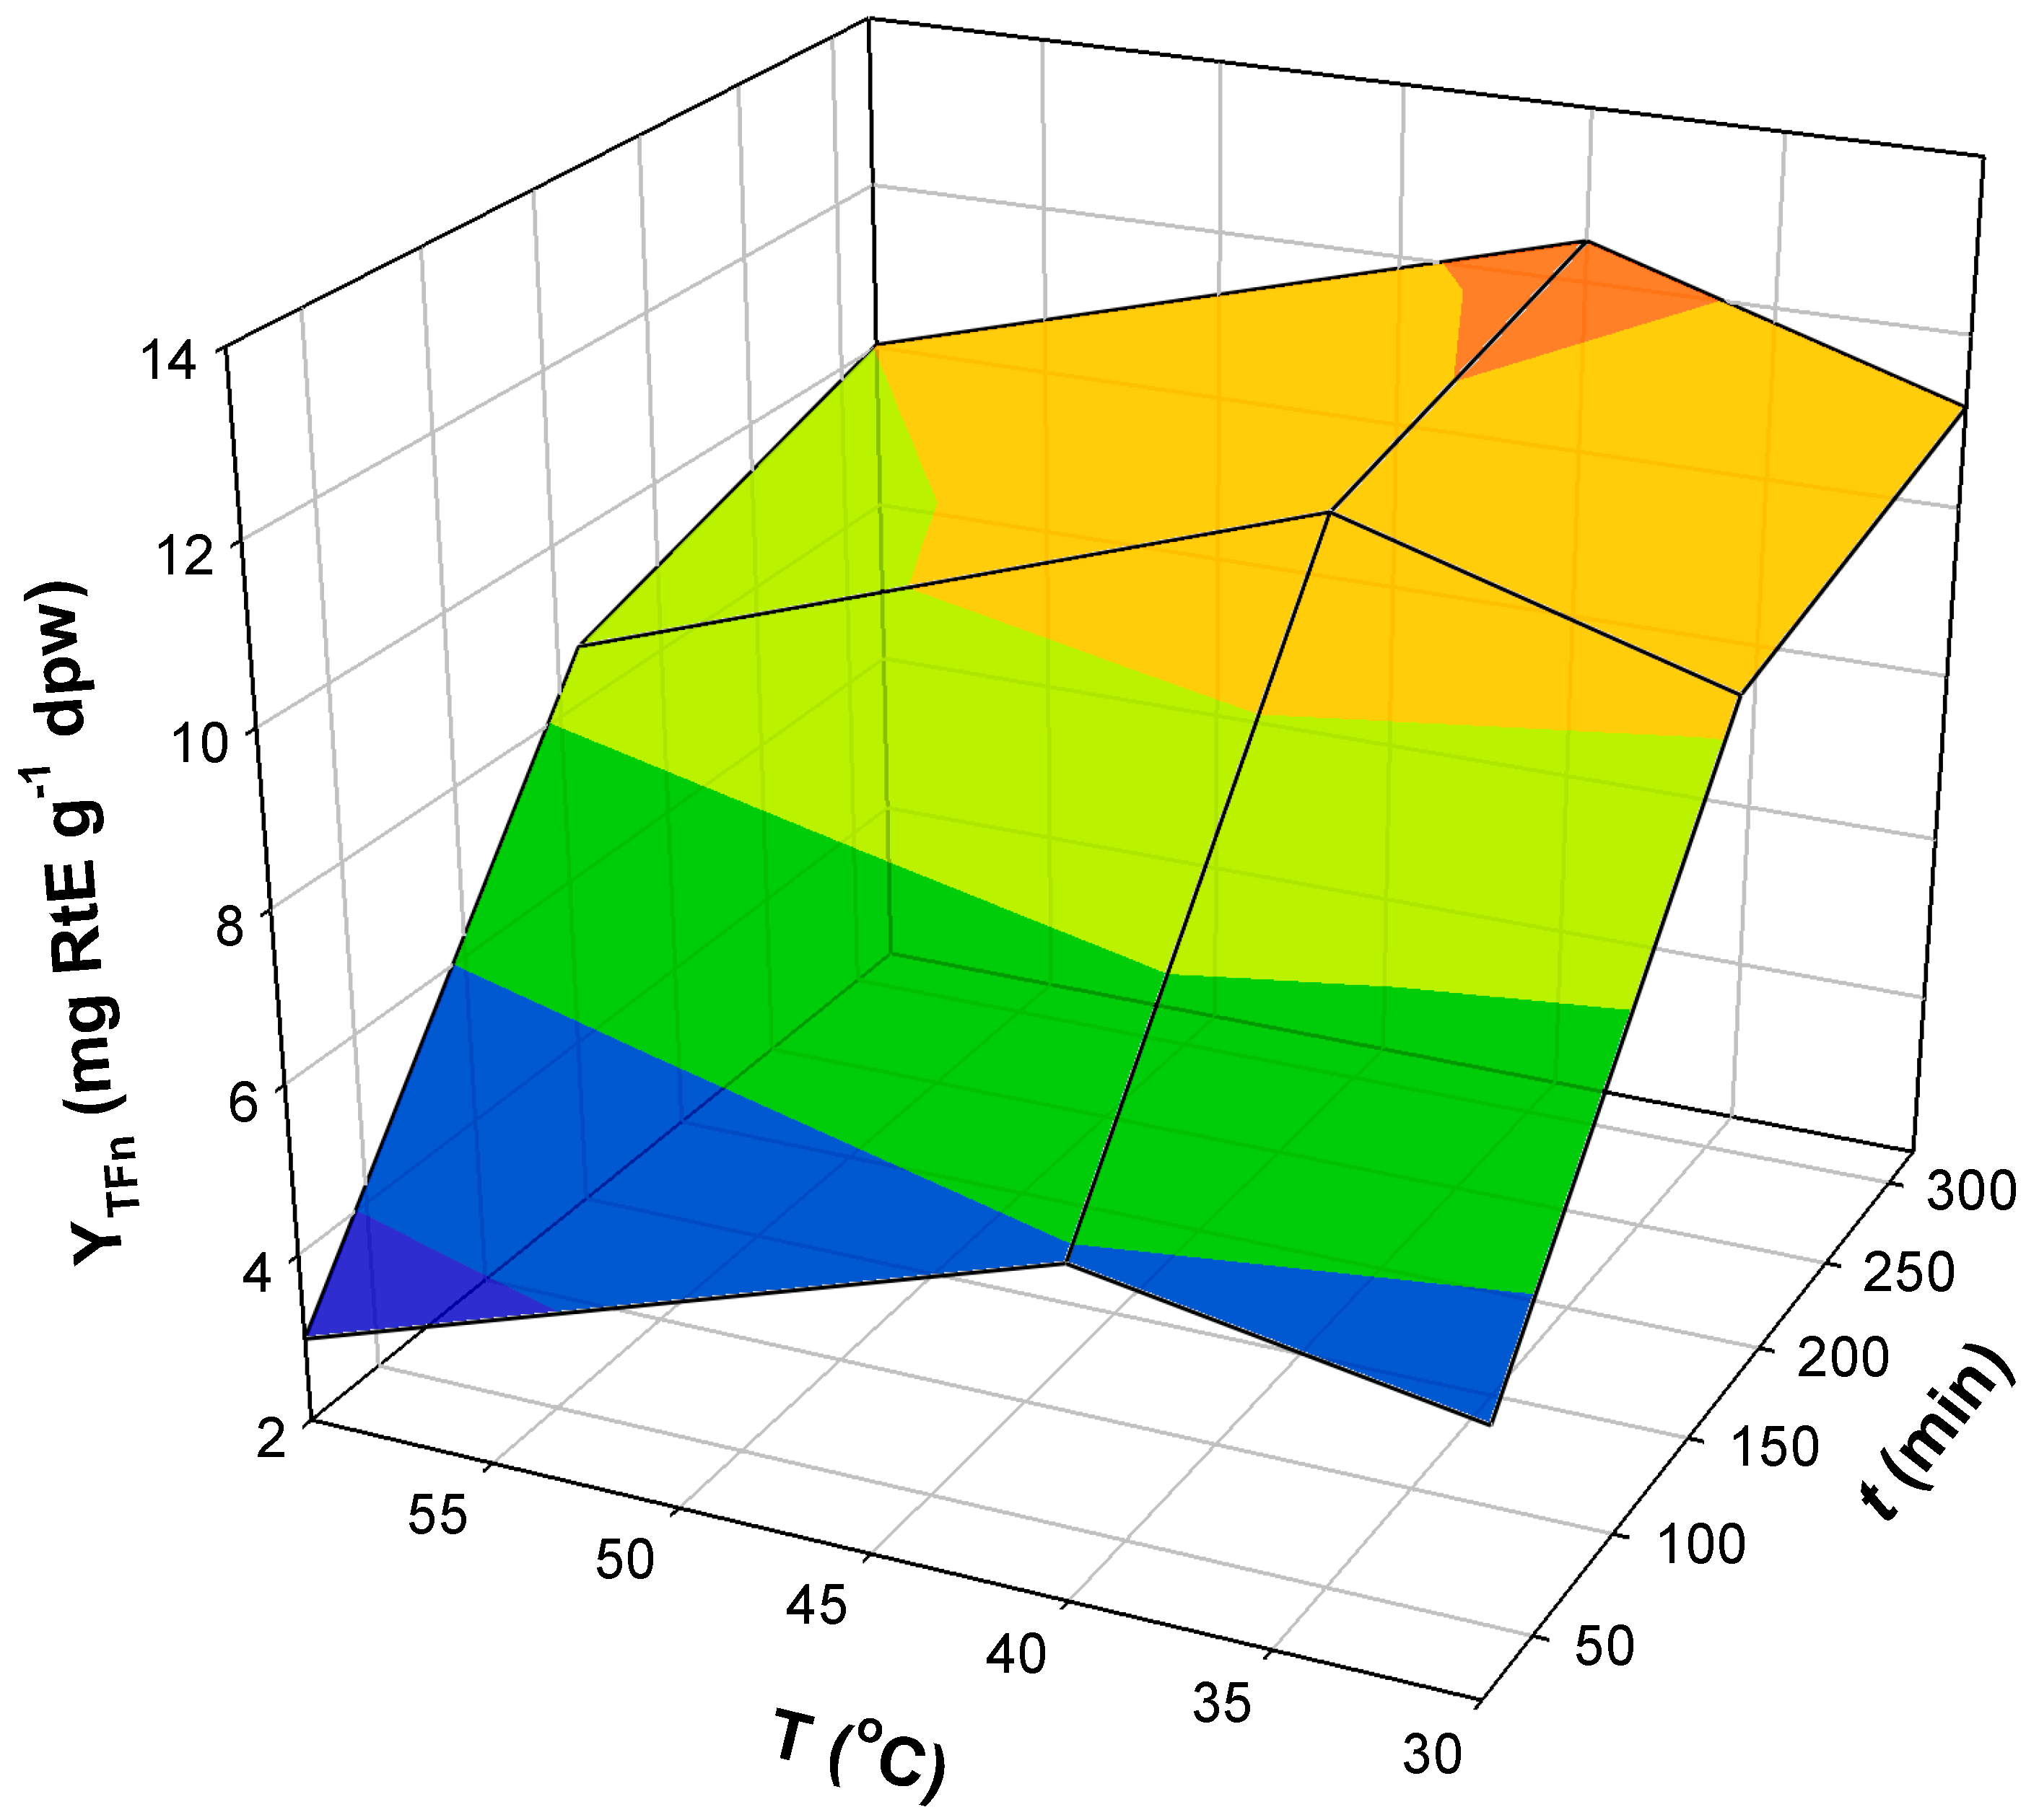
3.2. Experimental Fitting (Model Validation)

A series of nine combinations of T and t were used to test the validity of the model in predicting YTFn values (Table 2). The observed and the predicted values were then analyzed by linear regression to ascertain the degree of correlation (Figure 3). It was found that the observed and the predicted values were highly correlated (R2 = 0.88, p = 0.0002), suggesting that under the given experimental conditions, YTFn can be calculated with high reliability as a function of T and t, using Equation (8). The highest YTFn predicted was 13.27 mg·RtE·g−1 dpw, achieved at 40 °C, after 320 of extraction. The tendency in YTFn recorded was given in the form of a three-dimensional plot (Figure 4).
Table 2. Observed and predicted values of YTFn for a number of runs performed to assess the validity of the established extraction model.
Runt (min)T (°C)YTFn (mg·RtE·g−1·dpw)
ObservedPredicted
120302.645.10
2160309.6310.35
3320309.5011.17
420406.345.87
51604011.8111.61
63204011.6012.48
720604.192.99
81606010.078.67
9320609.7010.03
Figure 3. Correlation between the observed YTFn values and those predicted by the established kinetic model.
Processes 02 00901 g003
Figure 4. Three-dimensional plot illustrating the YTFn tendency of RGP extraction with 0.5% (w/v) aqueous LA, as a function of t and T.
Processes 02 00901 g004

3.3. Polyphenolic Composition

In order gain insight into the polyphenolic profile, the richest extract obtained (40 °C, 320 min) was analyzed by liquid chromatography-diode array-mass spectrometry (Table 3). Based on previously published data, Peaks 1 and 2 were tentatively identified as flavanol monomers and Peaks 6 and 7 as flavanol dimers [14]. In the same fashion, Peaks 3 and 5 were tentatively assigned to quercetin derivatives [14], while Peak 4 to an acylated cyanidin derivative [15].
Table 3. Spectral characteristics of the polyphenol tentatively identified in the RGP extract obtained with 0.5% (w/v) LA, after 320 min at 40 °C.
Peak #Rt (min)UV-Vis[M + H]+Other IonsTentative Identity
19.69280291-(Epi)catechin
213.80280291-(Epi)catechin
321.64256, 362479303Quercetin 3-O-glucuronide
421.97330, 506595-Cyanidin 3-O-p-coumaroylglucoside
525.22254, 360464303Quercetin 3-O-glucoside or galactoside
640.99240, 272579301(Epi)catechin-(epi)catechin dimer
742.31240, 272579301(Epi)catechin-(epi)catechin dimer
Cyanidin-based pigments are not frequently encountered in RGP extracts, as several studies demonstrated the most abundant pigments to be peonidin 3-O-glucoside, malvidin 3-O-glucoside and malvidin 3-O-glucoside p-coumarate [15,16,17,18]. On the other hand, flavanols, such as catechin, epicatechin and dimers thereof [19,20,21], as well as flavonols, including myricetin, quercetin, kaempferol, quercetin 3-O-glucoside, quercetin 3-O-glucuronide and isorhamnetin 3-O-glucoside [22,23], are rather common RGP constituents. However, the identification of the major constituents of the extract (Table 3) revealed a different profile, evidencing a possible selectivity by the LA solution used for the extraction. It can be hypothesized that major substances, such as malvidin 3-O-glucoside, could not be extracted, because of the increased polarity of the LA solution. On the other hand, the most polar cyaniding 3-O-glucoside was the major pigment of the extract generated. This finding could be particularly important, as the addition of LA could modify a medium’s polarity towards the extraction of specific metabolites.
The production of extracts containing a cocktail of the compounds reported above may have a significant prospect in industrial applications, such as the manufacturing of nutraceuticals and cosmetics, since almost all of these polyphenols have been claimed to possess beneficial biological activities [24]. In such a framework, the utilization of LA as a co-solvent in extracting functional polyphenols merits further investigation, mainly for the aspects pertaining to yield and selectivity. In this regard, it is proposed that future studies should embrace examinations in the direction of testing LA solutions as efficient extracting media using various plant materials and acid concentration/extraction time/temperature combinations.

4. Conclusions

Flavonoid recovery from grape pomace using aqueous LA was shown to be affected by both T and t. The course of the extraction was approached by the determination of basic kinetic parameters, which permitted the building of a predictive model. Using this model, the yield of flavonoid extraction, as a function of both T and t, could be very reliably estimated, under the experimental conditions deployed. This study showed that the extraction of bioactive substances from RGP is not favored at temperatures over 40 °C. This is particularly important in developing an efficient process, where maximum recovery is always sought. Further, the LC-MS analyses demonstrated that the major phytochemicals recovered were flavonoids belonging to the flavanol, flavonol and anthocyanin classes. It is anticipated that similar studies might be of significant value in engineering extraction processes using environmentally-benign and food-compatible solvent systems, involving LA in combination with a solvent less polar than water (e.g., ethanol). Currently, work is in progress to investigate the effect of other critical parameters affecting the extraction process, such as non-toxic co-solvents, to further improve recovery yield.

Author Contributions

Katerina Tzima, laboratory experiments and data handling; Stamatina Kallithraka, preparation of the RGP, laboratory analyses; Yiorgos Kotseridis, preparation of the RGP, laboratory analyses; Dimitris P. Makris, experimental design, data handling, liquid chromatograph-mass spectrometry analyses, statistics.

Nomenclature

CTFn
total flavonoid concentration (mg·RtE·L−1)
dpw
dry pomace weight (g)
h
initial extraction rate (mg·g−1·min−1)
k
extraction rate constant (g·mg−1·min−1)
T
temperature (°C)
t
time (min)
YTFn
extraction yield in total flavonoids (mg·RtE·g−1·dpw)
YTFn(s)
extraction yield in total flavonoids at saturation (mg·RtE·g−1·dpw)

Abbreviations

LA
lactic acid
RGP
red grape pomace
RtE
rutin equivalents

Conflicts of Interest

The authors declare no conflict of interest.

References

  1. Devesa-Rey, R.; Vecino, X.; Varela-Alende, J.; Barral, M.; Cruz, J.; Moldes, A. Valorization of winery waste vs. the costs of not recycling. Waste Manag. 2011, 31, 2327–2335. [Google Scholar] [CrossRef]
  2. Benko, T.; Szanyi, A.; Mizsey, P.; Fonyo, Z. Environmental and economic comparison of waste solvent treatment options. Centr. Eur. J. Chem. 2006, 4, 92–110. [Google Scholar] [CrossRef]
  3. Apostolakis, A.; Grigorakis, S.; Makris, D.P. Optimisation and comparative kinetics study of polyphenol extraction from olive leaves (Olea europaea) using heated water/glycerol mixtures. Separ. Purif. Technol. 2014, 128, 89–95. [Google Scholar] [CrossRef]
  4. Galanakis, C. Recovery of high added-value components from food wastes: Conventional, emerging technologies and commercialized applications. Trends Food Sci. Technol. 2012, 26, 68–87. [Google Scholar] [CrossRef]
  5. Kiassos, E.; Mylonaki, S.; Makris, D.P.; Kefalas, P. Implementation of response surface methodology to optimise extraction of onion (Allium cepa) solid waste phenolics. Innov. Food Sci. Emerg. Technol. 2009, 10, 246–252. [Google Scholar] [CrossRef]
  6. Mylonaki, S.; Kiassos, E.; Makris, D.P.; Kefalas, P. Optimisation of the extraction of olive (Olea europaea) leaf phenolics using water/ethanol-based solvent systems and response surface methodology. Anal. Bioanal. Chem. 2008, 392, 977–985. [Google Scholar] [CrossRef] [PubMed]
  7. Amyrgialaki, E.; Makris, D.P.; Mauromoustakos, A.; Kefalas, P. Optimisation of the extraction of pomegranate (Punica granatum) husk phenolics using water/ethanol solvent systems and response surface methodology. Ind. Crops Prod. 2014, 59, 216–222. [Google Scholar] [CrossRef]
  8. Cavdarova, M.; Makris, D.P. Extraction kinetics of phenolics from carob (Ceratonia siliqua L.) kibbles using environmentally benign solvents. Waste Biomass Valor. 2014, 5, 773–779. [Google Scholar] [CrossRef]
  9. Librán, C.M.; Mayor, L.; Garcia-Castello, E.M.; Vidal-Brotons, D. Polyphenol extraction from grape wastes: Solvent and pH effect. Agric. Sci. 2013, 4, 56–62. [Google Scholar]
  10. Karvela, E.; Makris, D.P.; Kalogeropoulos, N.; Karathanos, V.T. Deployment of response surface methodology to optimise recovery of grape (Vitis vinifera) stem polyphenols. Talanta 2009, 79, 1311–1321. [Google Scholar] [CrossRef] [PubMed]
  11. Cacace, J.E.; Mazza, G. Optimization of extraction of anthocyanins from black currants with aqueous ethanol. J. Food Sci. 2003, 68, 240–248. [Google Scholar] [CrossRef]
  12. Khiari, Z.; Makris, D.P. An investigation on the recovery of antioxidant phenolics from onion solid wastes employing water/ethanol-based solvent systems. Food Bioproc. Technol. 2009, 4, 337–343. [Google Scholar] [CrossRef]
  13. Angelov, G.; Boyadzhieva, S.S.; Georgieva, S.S. Rosehip extraction: Process optimization and antioxidant capacity of extracts. Centr. Eur J. Chem. 2014, 12, 502–508. [Google Scholar] [CrossRef]
  14. Kefalas, P.; Makris, D.P. Antioxidant Plant Phenols: Sources, Structure-Activity Relationship, Current Trends in Analysis and Characterization; Boskou, D., Gerothanasis, I., Kefalas, P., Eds.; Research Signpost Publ.: Kerala, India, 2006; pp. 69–123. [Google Scholar]
  15. Monrad, J.K.; Howard, L.R.; King, J.W.; Srinivas, K.; Mauromoustakos, A. Subcritical solvent extraction of anthocyanins from dried red grape pomace. J. Agric. Food Chem. 2010, 58, 2862–2868. [Google Scholar] [CrossRef] [PubMed]
  16. Liazid, A.; Guerrero, R.; Cantos, E.; Palma, M.; Barroso, C. Microwave assisted extraction of anthocyanins from grape skins. Food Chem. 2011, 124, 1238–1243. [Google Scholar]
  17. Sidani, B.; Makris, D.P. Interactions of natural antioxidants with red grape pomace anthocyanins in a liquid model matrix: Stability and copigmentation effects. Chem. Ind. Chem. Eng. Q. 2011, 17, 59–66. [Google Scholar] [CrossRef]
  18. Sri Harsha, P.; Gardana, C.; Simonetti, P.; Spigno, G.; Lavelli, V. Characterization of phenolics, in vitro reducing capacity and anti-glycation activity of red grape skins recovered from winemaking by-products. Bioresour. Technol. 2013, 140, 263–268. [Google Scholar] [CrossRef] [PubMed]
  19. Monrad, J.K.; Srinivas, K.; Howard, L.R.; King, J.W. Design and optimization of a semicontinuous hot–cold extraction of polyphenols from grape pomace. J. Agric. Food Chem. 2012, 60, 5571–5582. [Google Scholar] [CrossRef] [PubMed]
  20. Thimothe, J.; Bonsi, I.A.; Padilla-Zakour, O.I.; Koo, H. Chemical characterization of red wine grape (Vitis vinifera and Vitis interspecific hybrids) and pomace phenolic extracts and their biological activity against Streptococcus mutans. J. Agric. Food Chem. 2007, 55, 10200–10207. [Google Scholar] [CrossRef] [PubMed]
  21. Wang, X.; Tong, H.; Chen, F.; Gangemi, J.D. Chemical characterization and antioxidant evaluation of muscadine grape pomace extract. Food Chem. 2010, 123, 1156–1162. [Google Scholar] [CrossRef]
  22. Makris, D.P.; Kefalas, P. Characterization of polyphenolic phytochemicals in red grape pomace. Int. J. Waste Resour. 2013, 126. [Google Scholar]
  23. Luque-Rodríguez, J.M.; Luque de Castro, M.D.; Pérez-Juan, P. Dynamic superheated liquid extraction of anthocyanins and other phenolics from red grape skins of winemaking residues. Bioresour. Technol. 2007, 98, 2705–2713. [Google Scholar] [CrossRef]
  24. Yu, J.; Ahmedna, M. Functional components of grape pomace: Their composition, biological properties and potential applications. Int. J. Food Sci. Technol. 2013, 48, 221–237. [Google Scholar] [CrossRef]

