Article

Numerical Study of Three-Dimensional Models of Single- and Two-Phase Nanofluid Flow through Corrugated Channels

by
Elhadi Kh Abugnah
1,2,*,
Wan Saiful-Islam Wan Salim
1,
Abdulhafid M. A. Elfaghi
1,3,
Sami Al-Alimi
1,
Yazid Saif
1 and
Wenbin Zhou
4,5,*
1
Faculty of Mechanical and Manufacturing Engineering, Universiti Tun Hussein Onn Malaysia, Batu Pahat 86400, Johor, Malaysia
2
Department of Mechanical Engineering, College of Engineering Technology Janzour, Tripoli P.O. Box 76110, Libya
3
Libyan Centre for Engineering Research and Information Technology, Bani Waleed 411, Libya
4
School of Science and Engineering, University of Dundee, Dundee DD1 4HN, UK
5
Department of Mechanical Engineering, Imperial College London, London SW7 2AZ, UK
*
Authors to whom correspondence should be addressed.
Processes 2024, 12(5), 870; https://doi.org/10.3390/pr12050870
Submission received: 10 March 2024 / Revised: 23 April 2024 / Accepted: 24 April 2024 / Published: 26 April 2024
(This article belongs to the Special Issue Dynamics Analysis and Intelligent Control in Industrial Engineering)

Abstract

:
This study delves into computational fluid dynamics (CFDs) predictions for SiO2–water nanofluids, meticulously examining both single-phase and two-phase models. Employing the finite volume approach, we tackled the three-dimensional partial differential equations governing the turbulent mixed convection flow in a horizontally corrugated channel with uniform heat flux. The study encompasses two nanoparticle volume concentrations and five Reynolds numbers (10,000, 15,000, 20,000, 25,000, and 30,000) to unravel these intricate dynamics. Despite previous research on the mixed convection of nanofluids using both single-phase and two-phase models, our work stands out as the inaugural systematic comparison of their predictions for turbulent mixed convection flow through this corrugated channel, considering the influences of temperature-dependent properties and hydrodynamic characteristics. The results reveal distinct variations in thermal fields between the two-phase and single-phase models, with negligible differences in hydrodynamic fields. Notably, the forecasts generated by three two-phase models—Volume of Fluid (VOF), Eulerian Mixture Model (EMM), and Eulerian Eulerian Model (EEM)—demonstrate remarkable similarity in the average Nusselt number, which are 24% higher than the single-phase model (SPM). For low nanoparticle volume fractions, the average Nusselt number predicted by the two-phase models closely aligns with that of the single-phase model. However, as the volume fraction increases, differences emerge, especially at higher Reynolds numbers. In other words, as the volume fraction of the nanoparticles increases, the nanofluid flow becomes a multi-phase problem, as depicted by the findings of this study.

1. Introduction

Many engineering applications, both micro- and macro-scale, require excellent heat transfer performance. Extending the exchange surface or using a better fluid are two common methods to increase the heat transfer rate. Nanofluids, serving as a novel heat transfer medium, have unlocked fresh and promising avenues. A nanofluid is a fluid composed of extremely tiny particles, usually metals, oxides, or carbides, with diameters less than 100 nanometres. These particles are suspended within a base fluid, like water, ethylene glycol, or oil. Maxwell [1,2] was the first to propose utilizing a solid–liquid combination to improve heat conductivity on a micro or millimetre scale. Unfortunately, this method introduced several challenges, including fouling, erosion, and a notable rise in pressure drop [3,4]. Compared to metals and metal oxides, common industrial working fluids such as ethylene glycol, water, and oil have minimal thermal conductivity. Several experiments and computational simulations have recently been organized to assess the effect of nanofluids on improving heat transfer rates in various heat exchangers. The nature, size, and shape of nanoparticles, as well as the type of base fluid, all have a role in the increase in the heat transfer using the nanofluid. Additionally, the intensity of nanoparticles inside the base fluid is being investigated [5,6,7,8].
Numerous studies deal with such a type of flowing fluid (base fluid+ nanoparticles) as single-phase fluid due to the high mixing fluid being flowed, but this sort of fluid must be classified as a multi-phase fluid. Bianco et al [9], studied a developing turbulent forced convection flow of a single-phase water-Al2O3 nanofluid in a square tube numerically. This investigation was carried out under conditions of continuous and consistent wall heat flux. The combination approach was used to estimate the hydrodynamic and thermodynamic characteristics of the nanofluid flow, and research was carried out for elements with a diameter of 38 nm. The inclusion of nanoparticles resulted in a substantial expansion in the heat transfer that contrasted with the established liquid, according to the findings. The heat transfer increased with the enhancement of the particle volume concentration. However, it was additionally accompanied by a higher shear stress on the wall values. Akdag et al. [10] investigated the numerical heat transfer and pressure drop characteristics of nanofluid flow CuO water, which addressed an isothermally heated triangular wavy channel with pulsating inlet situations. Additionally, Yang et al. [11] explored the influence of Reynolds numbers, with particle volume percentage, and the amplitude of wavy channels that enhance the heat transfer in single-phase nanofluids through numerical simulations. Compared to pure fluid, they achieved a 24 percent thermal improvement in the wavy channel flow at a particle volume fraction of = 5% of Cu–water nanofluids. Heidary and Kermani [12] investigated the flow of a copper–water nanofluid in a sinusoidal corrugated channel with heat transfer numerically. It was found that up to a 50% better heat transfer might be achieved by using a corrugated channel and nanofluid. They employed the finite volume approach and the SIMPLE algorithm to discretize the flow equations and solve the pressure-velocity coupling system, treating nanofluids flow as a single phase. Akbari et al. [13] examined the effects of utilizing a semi-attached rib on the heat transfer and liquid turbulent flow in a 3D rectangular microchannel containing nanofluid water and copper oxide. Moreover, the numerical simulation results of this research were compared with those of a smooth channel. The Navier–Stokes equations for turbulent flow have been determined by employing the control volume approach. Pressure and velocity are integrated using the SIMPLE technique, while all equation terms are discretized using the second-order upwind approach.
As an alternative, several researchers have explored nanofluid flow, in which the base fluid is considered the primary phase, and the nanoparticles represent the second phase. Various methods are employed to simulate this type of flow. The flow of zinc oxide nanoparticles in a flat tube with acetone acting as a base fluid was simulated by Hayder I. Mohammed [14] using a computational fluid dynamics (CFD) model. The zinc oxide nanoparticles are shown in a two-phase model as a separate fluid phase. Both the laminar and turbulent flow are studied. Numerous concentrations of acetone and nanoparticles were numerically simulated. They discovered that the heat transfer increases as Re and the acetone and nanoparticle concentrations rise. The two-phase approach shows how significantly nanoparticles affect heat transmission. Ansys Fluent software simulates this flow scenario using the Eulerian–Eulerian approach (mixing model). Hence, to obtain accurate findings and a minimum number of cells, four mesh sizes were used. Wu et al. [15] investigated the transmission of heat in a single phase and two phases of a water-based Al2O3 nanofluid in trapezoidal silicon microchannels with a hydraulic diameter of 194.5 m. The Al2O3 nanoparticle deposition or adhesion to the channel walls was not seen during the single-phase experiment. However, rising wall temperatures, even at low concentrations (0.15 vol percent), led to nanoparticle deposition, especially at channel corners where wall temperature was high and fluid velocity was low. The extensive utility of nanofluid boiling heat transfer in microchannels is being questioned because of the exacerbation of sedimentation and the adherence to the channel walls once boiling begins. Akbari et al. [16] conducted CFD predictions of the laminar mixed convection of Al2O3–water nanofluids; these used to compare the single-phase and three unique two-phase models (fluid volume, mixture, and Eulerian). It has been demonstrated that the thermal fields differ considerably from the nearly identical hydrodynamic fields predicted by the single-phase and two-phase models. The two-phase models’ predictions are almost identical. Meanwhile, two-phase models produce more accurate estimates of the convective heat transfer coefficient for a given scenario than single-phase models. Rashidi et al. [17] examined the numerical comparison of the flow field of a copper–water nanofluid and heat transfer in a wavy channel under both two-phase and single-phase conditions. Therefore, there are definitely three distinct phases of models such as the Eulerian Multi-phase Model (EMM), Volume of Fluid (VOF), and Eulerian–Eulerian Model (EEM), along with computational fluid dynamics (CFD), which are employed to predict the estimation of the heat transfer and flow of Suspended Particulate Matter (SPM).
The findings indicate that the temperature distributions of the single-phase and dual-phase models differ more than those seen in the hydrodynamic environment. Moreover, it has been found that increasing the volume proportion of nanoparticles boosts the heat transfer amount forecast by the SPM, regardless of the Reynolds values. When the Reynolds number is low in the two-phase models, increasing the volume percentage of the nanoparticles enhances the heat transfer amount of the wavy channel front and centre. However, it gradually falls throughout the entire wavy channel. Hejazian [18] evaluated the turbulent forced convection flow in a circular horizontal tube where convection occurs with saturated steam in the wall. The tube contains a diluted water–TiO2 nanofluid with particles that have a diameter of 30 nm. There are two ways to consider this: univariate models with a single-phase and two-phase mixtures. Higher Reynolds numbers (Re) and increased nanoparticle concentrations resulted in an enhancement of the heat transfer. In contrast, the single-phase method did not agree with the experimental results as well as the mixed model did. Moraveji [19] investigated the CFD modelling of Laminar Forced Convection on Al2O3 nanofluids. The mini-channel heat sink employs four separate models (SPM, VOF, EMM, and EEM).
The finite class method discretized the three-dimensional (3D) steady-state governing partial differential equations. Some essential factors, such as nanoparticle concentration and Reynolds numbers, were investigated to enhance the nanofluid heat transfer. The results of the two-segment model exhibited little variation and demonstrated greater accuracy in comparison to the experimental reference data, in contrast to the single-phase model. Aside from being the most precise and requiring the least amount of CPU time and run time, the mixture model was used to approximate the Nusselt number and factor of friction using dimensionless quantities. Ajeel and Salim [20] examined two types of corrugated canals, specifically a semi-circular corrugated channel (SCC) and a unique trapezoidal corrugated channel (TCC), using a nanofluid consisting of silicon dioxide (SiO2) and water as the working fluid. The study examined nanofluids containing SiO2 particles at volume fractions of 0.0%, 1.0%, and 2.0%, and Reynolds numbers, ranging from 10,000 to 30,000. The experimental findings demonstrate that when the volume fraction of SiO2 in the nanofluid grows, the nanofluid surpasses the base fluid in terms of both heat transmission and pressure drop. As the tested channels are used with the SiO2–water nanofluid at a 2.0 percent volume fraction, the heat transfer ratio improves by 9.6–10.15 percent when compared to smooth channels. In contrast to a straight channel, employing a corrugated channel (TCC) enhances heat transfer rates by as much as 63.59 percent, increases the pressure drop by 1.37 times, and boosts thermal performance by up to 2.22 times. Most of the previous studies deal with the nanofluid flow as a single-phase flow, and this assumption is not always correct, so there is a need for more studies to investigate the nature of this type of flow, particularly when corrugated surfaces are used.
The novelty of this study is to further examine the effect of crucial factors, including nanoparticle concentration and Reynolds numbers, on the improvement of heat transfer in the nanofluid. Furthermore, this study aims to systematically compare computational fluid dynamics (CFD) predictions concerning the driven convection of a SiO2–water nanofluid within a semi-circle corrugated channel. This is accomplished by using three distinct models: single-phase and two-phase (mixture, Volume of fluid (VOF), and Eulerian).

2. Materials and Methods

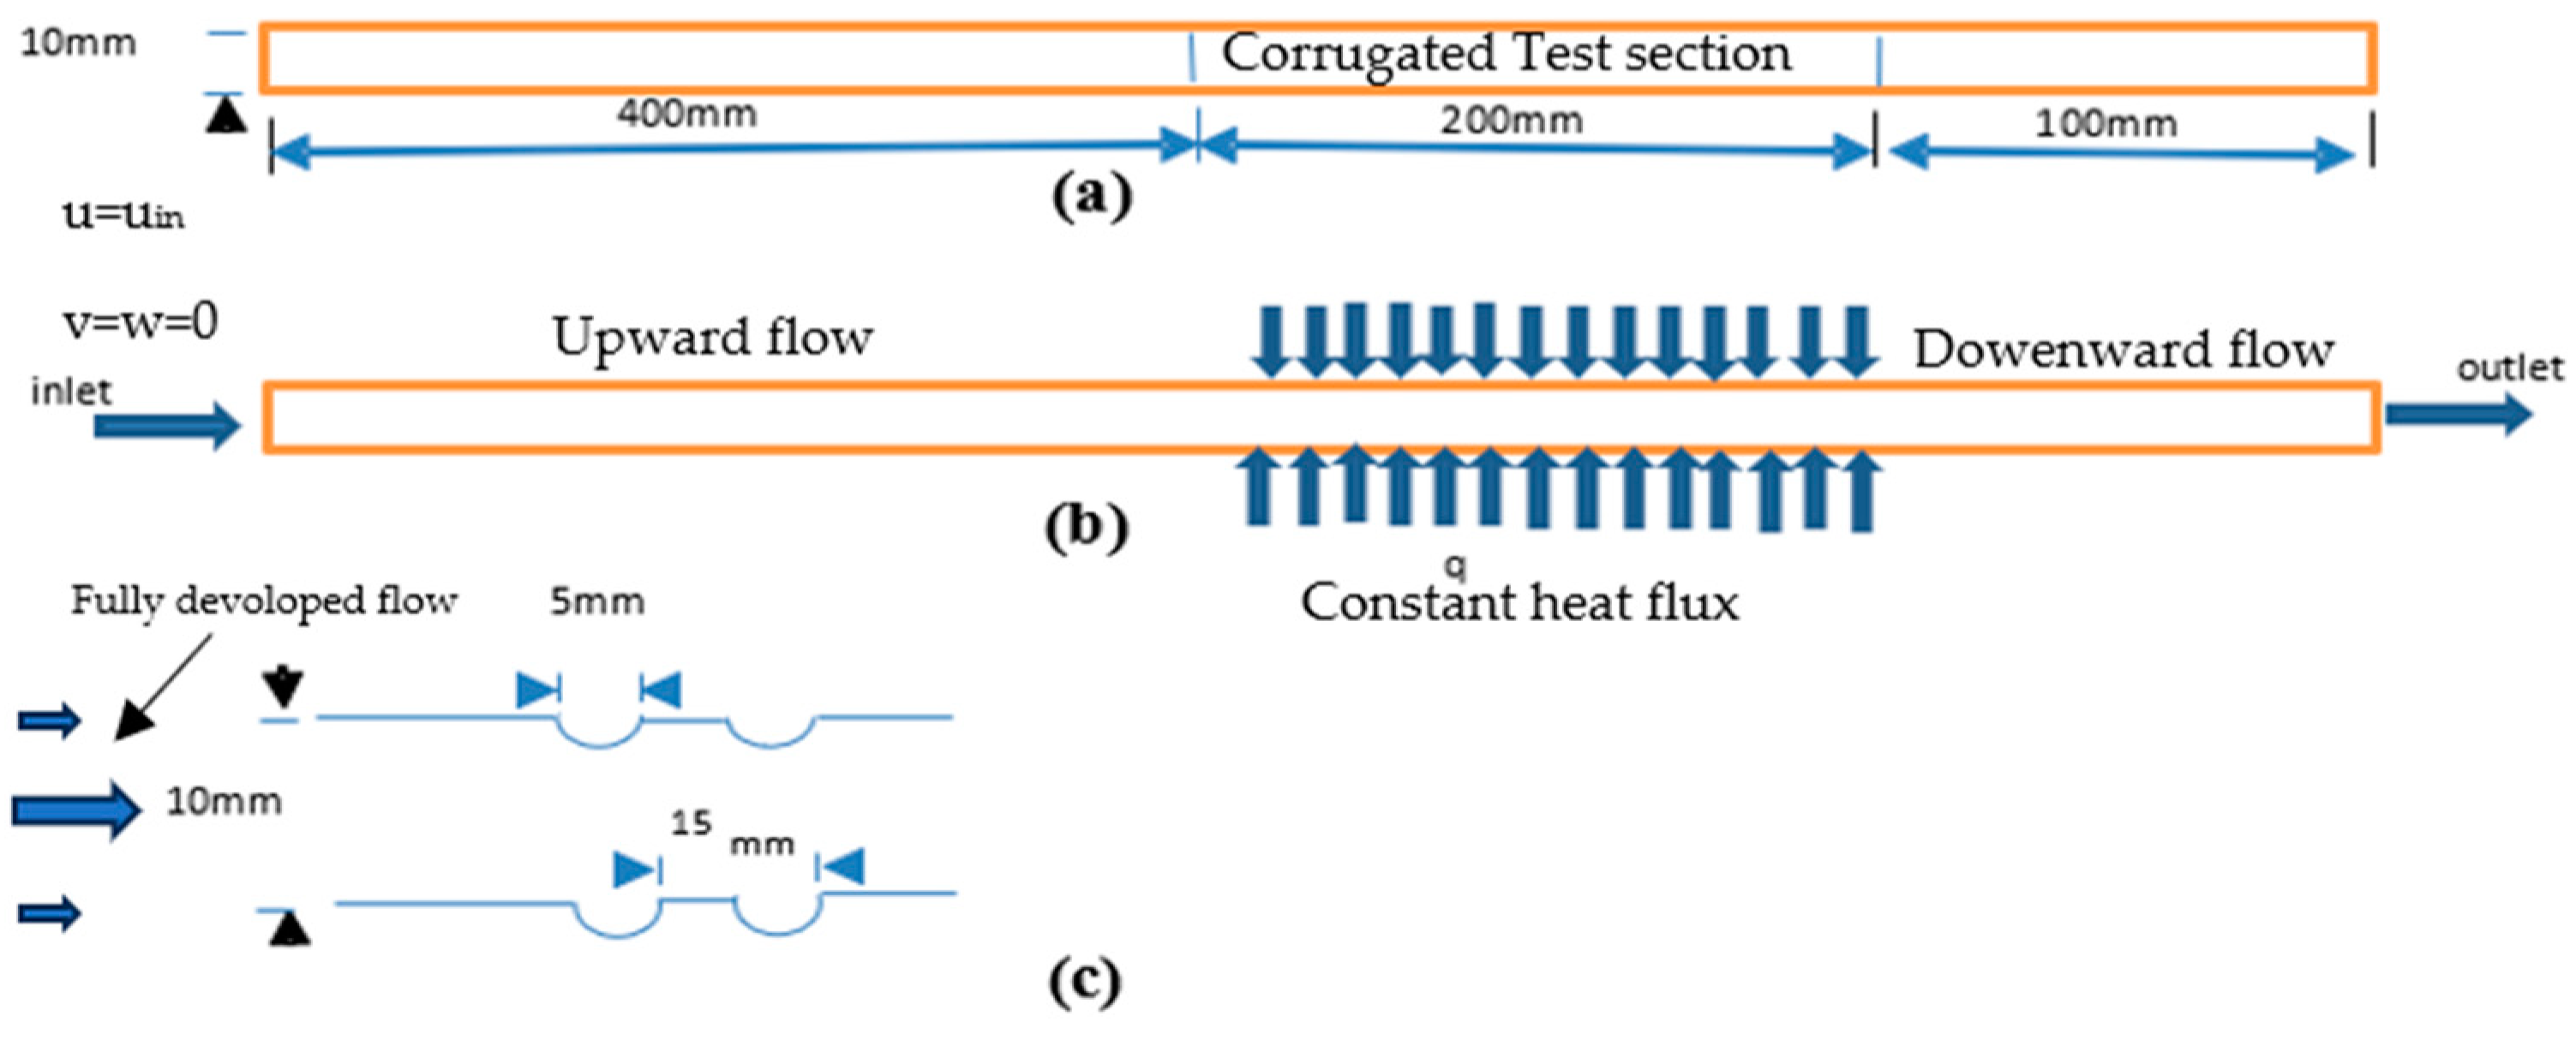
2.1. Geometric Formation

In this research, we applied 3D computational fluid dynamics (CFD) to simulate our findings. The simulation incorporated a single-phase (homogeneous) approach and three distinct models, namely the Volume of Fluid (VOF), Eulerian, and mixture models. A unique code was created for each strategy. The semi-circle corrugated channel measures 700 mm in length and has an area with a cross-section of 50 mm in width by 10 mm in height. The corrugated channel is divided into three parts: the first part has a length of 400 mm to maintain a fully developed flow; the second part, which is the test section, has a length of 200 mm; and the third part is downstream, which has a length of 100 mm. The geometric characteristics of corrugation are expressed by width (Wc) = 5 mm, radius (r) = 2.5 mm, and pitch (Pch) = 15 mm as shown in Figure 1.

2.2. Equations of Governing

2.2.1. Single-Phase Model

The nanofluid was regarded as a single-phase fluid, with the fluid phase being treated as continuous. The governing equations for continuity, momentum, and energy are delineated as follows [21]:
Continuity equation:
ρ n f v m i x = 0
Momentum equation:
ρ n f v m i x   v m i x = p + μ n f   v m
Energy equation:
ρ c p v m T = ( k n f T )
Appropriate definitions of thermophysical property relations for nanofluids are essential in this model. The thermal and physical parameters of the nanofluid are calculated using the following equation expressions.
The specific heat and density of the nanofluid is given as follows [22,23,24,25,26]:
ρ m = 1 ρ b f + ρ p
C p m = 1 C p b f + C p p
μ m i x = μ b f 1 1 + 0.25
The effective conductivity of thermal energy is computed using a correlation based on empirical data that took Brownian motion into consideration, as illustrated below [27,28]:
k e f f = k s t a t i c + k B r o w n i a n
where
k s t a t i c = k b f ( k p + k b f ) 2 ( k b f k p ) k p + 2 k b f + k p k b f
k B r o w n i a n = 5 × 10 4 β ρ b f C p b f K T ρ p d p f T ,  
The Boltzmann constant, K, is defined as K = 1.3807 × 10⁻²³ J/k. β is as shown in Table 1.
f T , = 2.8217 × 10 2 + 3.917 × 10 3 T T 0 + 3.0669 × 10 2 3.391123 × 10 3

2.2.2. Two-Phase Model

There are two basic ways to develop mixes with both solid and liquid ingredients. For scenarios with minimal volume of solid fractions, the Lagrangian–Eulerian method is the clear frontrunner. This method examines the base fluid through an Eulerian lens and uses the Lagrangian assumption to assess the particle phase. However, the Eulerian–Eulerian approach comes into play when dealing with increasing solid volume fractions. According to the tiny particle sizes in nanofluids, the computational problem is especially significant. Even with a conservative particle volume percentage, the sheer number of particles in the computational domain is remarkable. There are numerous Eulerian–Eulerian models in the field of simulation techniques; however, the most often used and applicable models are the VOF (Volume of Fluid), mixed, and Eulerian [29] models.
A.
Volume of Fluid (VOF)
The volume of the fluid part focusses on a unified set of momentum equations across all phases, methodically tracking volume fractions throughout the investigation region. This is accomplished through resolving a continuousness equation for secondary phases and guaranteeing that the substance of volume fractions for all phases equals one. As a result, the magnitude of the volume fraction of the primary phase is determined. This approach computes all physical properties using a weighted average of individual phases based on their volume percentages within each control volume. A single set of momentum equations is carefully solved to determine the velocity elements revealed by all phases. Similarly, a single energy equation determines a unified temperature. The term “mass conservation” is defined as follows:
q ρ q v m i x q = 0
where q = 1 n q = 1 and the calculation of all properties is like N = q = 1 n n N q .
The momentum and energy conservation are the same as Equations (2) and (3).
B.
Eulerian Mixture Model (EMM)
The mixture approach deals with the volume fraction equation pertaining to secondary phases as well as the continuum, momentum, and energy equations governing the mixture. Afterward, the correlation is utilized to calculate the relative speed between the stages. The important equations are as follows [29].
The conservation of mass is represented in Equation (12):
ρ m i x v m i x = 0
The conservation of momentum is represented in Equation (13):
ρ m i x v m i x v M m i x = p + μ m i x v m i x + k = 1 n k ρ k v k v k + ρ m i x g + ( k = 1 n k ρ k V d r . k V d r . k )
where the mixture velocity, density, and viscosity are as follows.
v m i x = k = 1 n k ρ k V k ρ m i x
ρ m i x = k = 1 n k ρ k
μ m i x = k = 1 n k μ k  
where the conservation of energy is represented in Equation (17):
ρ k C p p k V k T k = ( k n f T )
Volume of fraction equation:
p ρ p V m = ( p ρ p V d r . p )
Vmix is mass average velocity:
V m i x = k = 1 n ρ k k V k ρ m i x  
The flow velocity for the secondary phase k is Vdr,k, i.e., the nanoparticles in the secondary phase in the current research. This has to do with relative velocity, as shown below.
V d r . k = V p f i = 1 n k ρ k ρ m i x V f k
Slip velocity, also known as relative velocity, delineates the velocity of a secondary phase (such as nanoparticles denoted as “p”) in comparison to the velocity of the critical phase (in this instance, water symbolized as “f”).
V p f = V p V f
Manninen et al. [30] proposed Equation (22) for the relative velocity, while Equation (23), which was proposed by Schiller and Naumann [31], is manipulated to calculate the drag function.
V p f = ρ p . d p 2 18 μ f . f d r a g ρ p ρ m i x ρ p a
f d r a g = f ( x ) = { 0.0183                                                 R e > 1000 1 + 0.15 R e p 0.689                     R e 1000
where a = g ( V · ) V m and Rep = v m i x . d p ν e f f .
C.
Eulerian Eulerian Model (EEM)
The Eulerian model [17,18,19] stands out as one of the greatest intricate two-phase models due to the intricate interconnections linking the phases. This approach applies distinct momentum, continuity, and energy equations to individual phases, with the pressure being a collective entity. The determination of each phase’s volume involves integrating its volume fraction across the entire domain.
The mass conservation is represented in Equation (24):
q ρ q V q = 0
where
V q = v q . d V   a n d   q n q = 1
where q here indicates the phase.
The momentum conservation for the qth phase is as follows:
ϕ q ρ q   V V = ϕ q p + ϕ q μ q V + q ρ q g + p = 1 n R p q + F l i f t , q
In this equation, p = 1 n R p q = q = 1 n S p q ( V p V q ), the interaction forces between phases are measured, and S p q = ( q p ρ q f d r a g ) / τ p , and τ p = ( ρ p d p 2 / ( 18 μ q ) , where fdrag is the drag friction, is calculated using Schiller and Naumann’s [31] Formula (23). Drew and Lahey’s [32] equation is used to compute the lift force.
f l i f t = 0.5 ρ p q ( V p V q ) × ( × V q )
The energy conservation is represented in Equation (28):
q ρ q V q H q = K p T P τ q V + p = 1 n Q p q
where the heat exchange coefficient is Qpq = h(Vp -Vq), and h = (6KqϕpϕqNup)/(dp2), and Nup is calculated using the formula of the Ranz–Marshall model [33]
N u p = 2 + 0.6 R e 0.5 P r q 0.333
Within the domain of interest, it is implicit that the flow is constant, incompressible, and fully developed. The fluid behaves homogeneously in one phase, as a Newtonian fluid. The wall’s surface constantly conducts heat and has the roughness of stainless steel. Boundary circumstances are imposed at the test, exit, and inlet portions. These include a fluid temperature of 300 °C, an intake velocity condition, and an outlet pressure condition. Where the no-slip policy is in effect on the walls, the corrugated surfaces undergo a homogeneous heat flux (Q = 10,000 W/m2). In contrast, the remaining walls exhibit adiabatic behaviour. The following are the conditions for the flow and the boundary.
The inlet flow:
u = u i n       ,   v = w = 0 ,   T i n   = 300   K ,         k = k i n ,   ε = ε i n
The parameters at the outlet boundary are assumed to be spatially uniform for the purposes of this investigation.
T f x = 0 , u x = v x = w x = 0 ,   a n d   k x = ε x = 0
The wall boundary:
u = v = w = 0 ,   q = q w a l l
Using the turbulent intensity I, the following formulas are used to compute the turbulent kinetic energy (kin) and turbulent dissipation (εin) at the inlet flow, which are addressed by Mohammed et al. [34]:
k i n = 3 2 ( u i n I ) 2
ε i n = C μ 3 4 k 3 2 L
The turbulent intensity (I) is defined as follows [34].
I = u u = 0.16 R e 1 / 8 %
The Reynolds number (Re) is stated as follows:
R e = ρ u D h μ
The fluid density (ρ), fluid velocity (u), dynamic viscosity (μ), and hydraulic diameter (Dh) of the channel are all represented in this equation. The average Nusselt number (Nuav), which is used to assess the channels’ transfer of heat performance, can be described as follows:
N u a v = h a v D h k f
where kf is the fluid thermal conductivity and hav is the mean heat transfer coefficient.
By utilizing the wetted perimeter (P) and the cross-sectional area (across), the hydraulic diameter in the corrugated segment is determined following Mohammed et al. [34]:
D h = 4 A c r o s s P
Thermophysical characteristics of the nanofluid (water plus SiO2) are computed using empirical Equations (4)–(7), as shown in Table 2.
Following my methodology, the governing equations and their accompanying boundary conditions are solved using the finite-volume discretization method in the commercial CFD software ANSYS FLUENT 2023R1. Convective terms are addressed via a second-order upwind technique, while the pressure–velocity system is integrated using the SIMPLE algorithm for single-phase models. In the realm of multi-phase models, the pressure is managed utilizing the PRESTO method, with a second-order methodology employed for momentum calculations. The Quadratic Upstream Interpolation for Convective Kinematics (QUICK) approach governs the volume fraction and turbulent kinetic energy considerations, alongside a mixing technique, and the SIMPLE scheme is used for pressure–velocity coupling. The model under scrutiny adopts the realizable k-standard wall function turbulence model. On the contrary, the continuity, momentum, and turbulence equations consider residues of 10−5 to be converged, whereas the energy equation considers residues of 10−8 to be converged.
In ensuring the accuracy of numerical outcomes, the execution of an effective grid examination holds paramount importance. Within this investigation, five different grid configurations are scrutinised within a non-corrugated channel, employing a mixture of water and SiO2 nanoparticles as the operating fluid, as depicted in Figure 2.
The friction factor of the non-corrugated channel and the average Nusselt number are compared with the empirical correlations suggested for validation according to Pethukov et al. [35] and Dittus-Boelter [36], as described below. Figure 3a,b demonstrate that there is excellent agreement between numerical forecasting and empirical correlations.
Pethukov [35];
f = ( 0.79 l n ( R e ) 1.64 ) 2
Dittus-Boelter [36];
N u a v = 0.023 R e 0.8 P r 0.4
The comparison between the average Nusselt number results obtained from the present corrugated channels study and the experimental results of Ajeel [37] revealed a maximum deviation of less than 4%. This close agreement, as depicted in Figure 4, validates the accuracy of the simulation in predicting the heat transfer and fluid flow characteristics across varying Reynolds numbers within corrugated geometries.

3. Results and Discussion

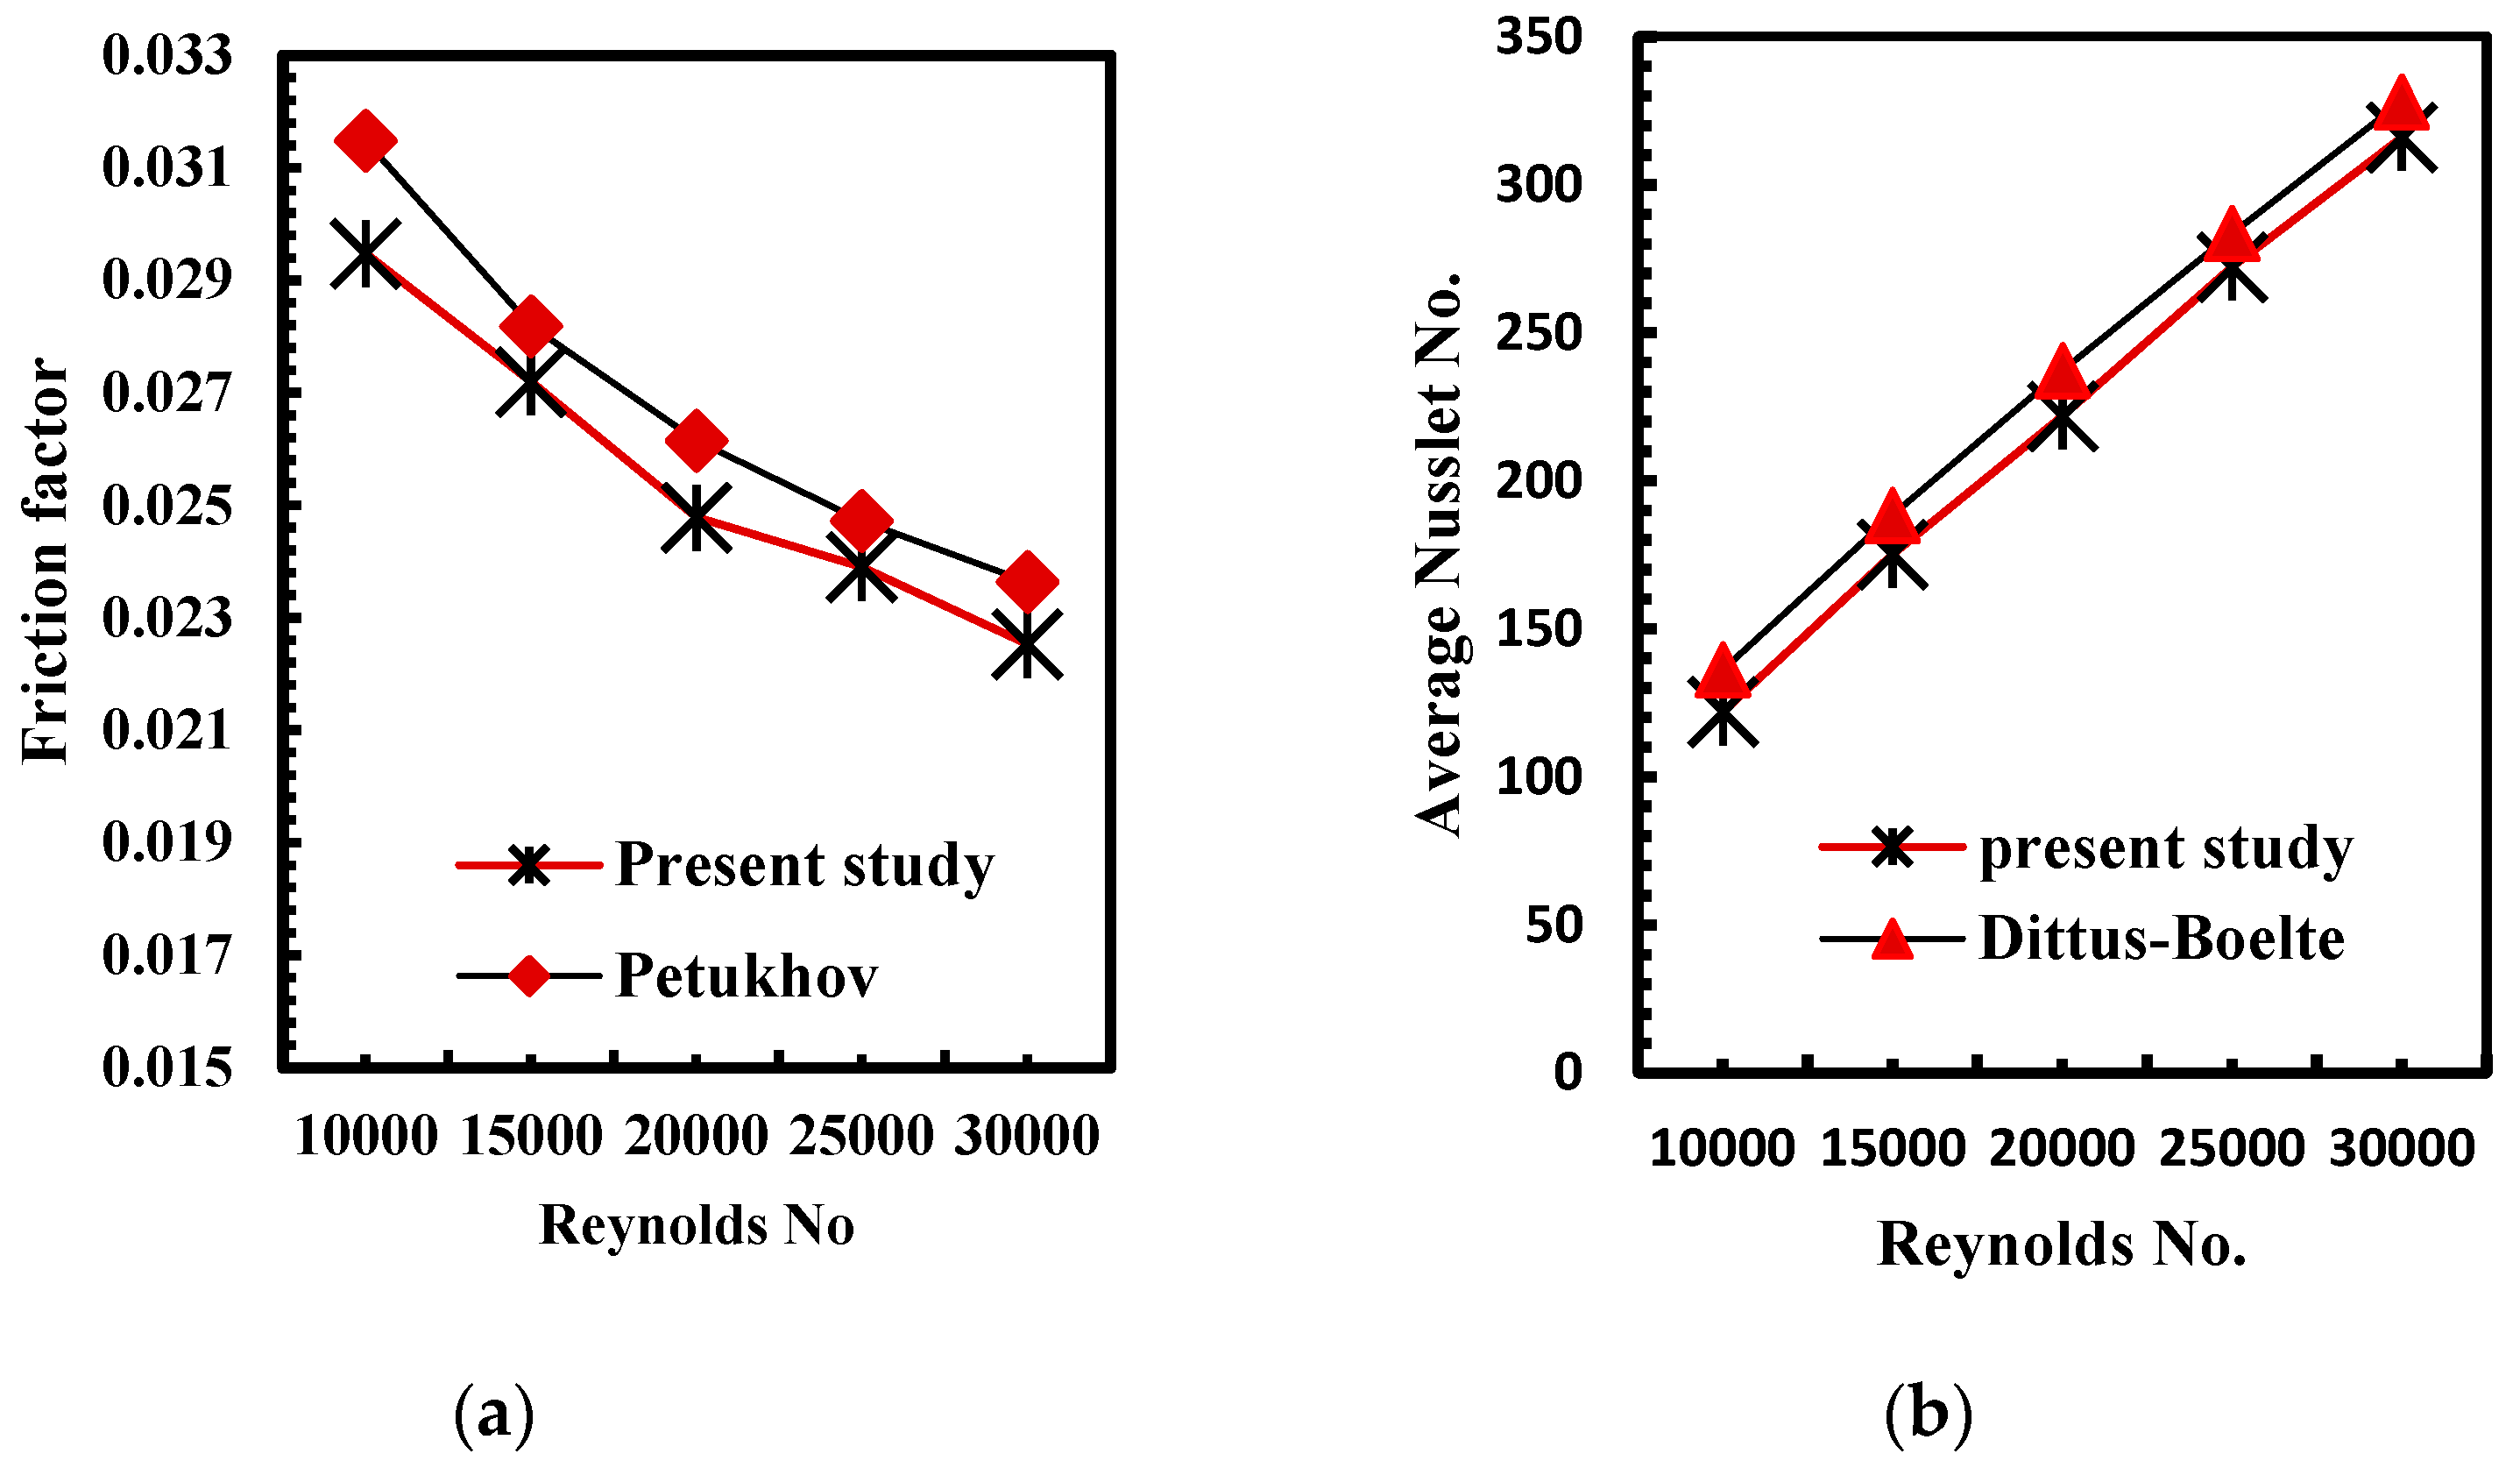
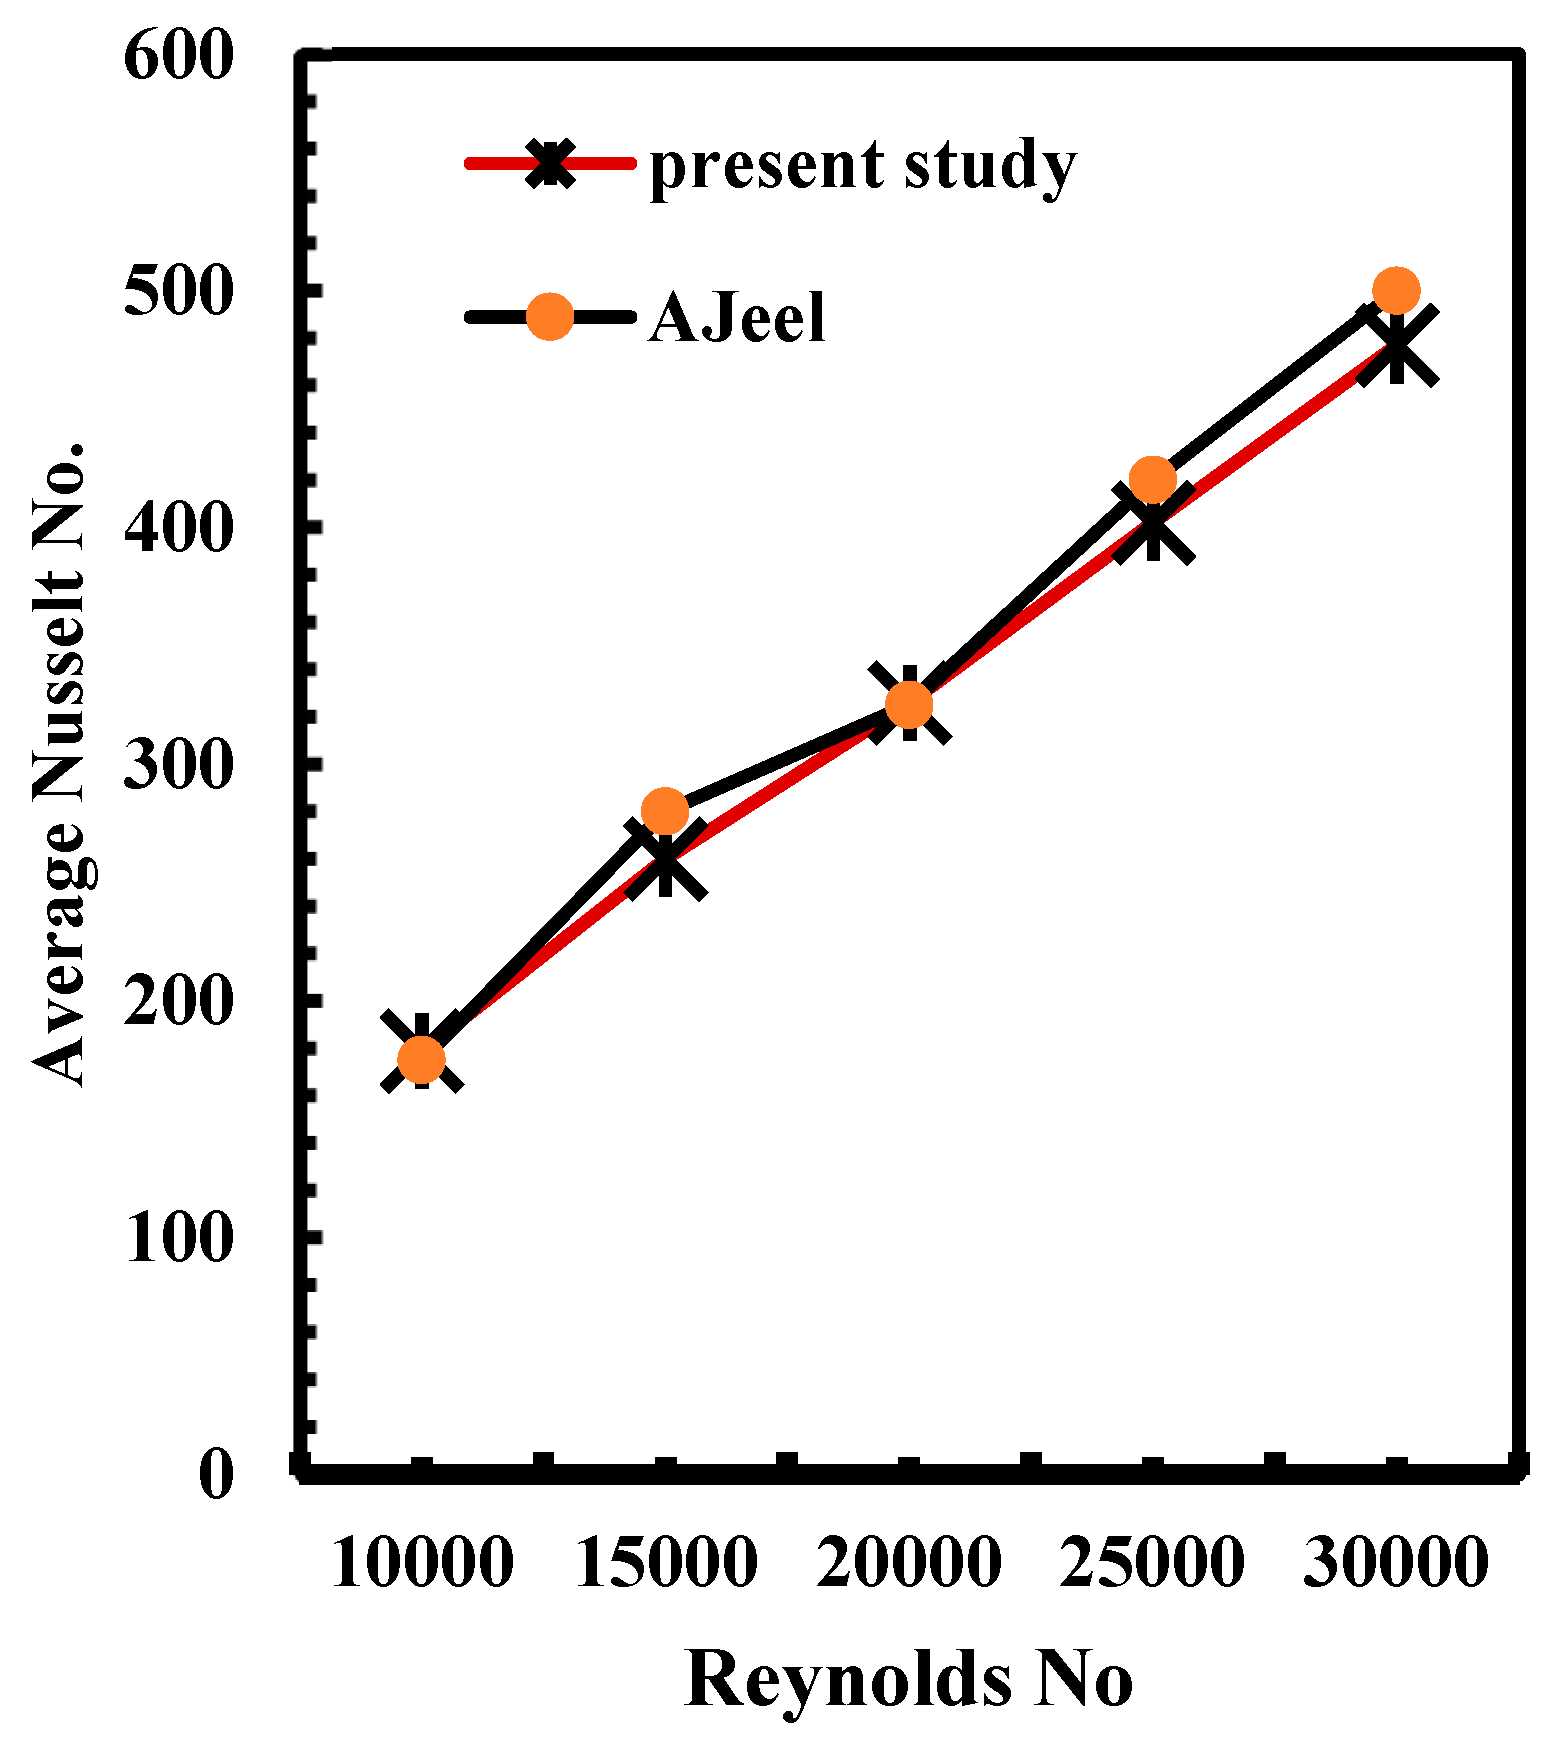
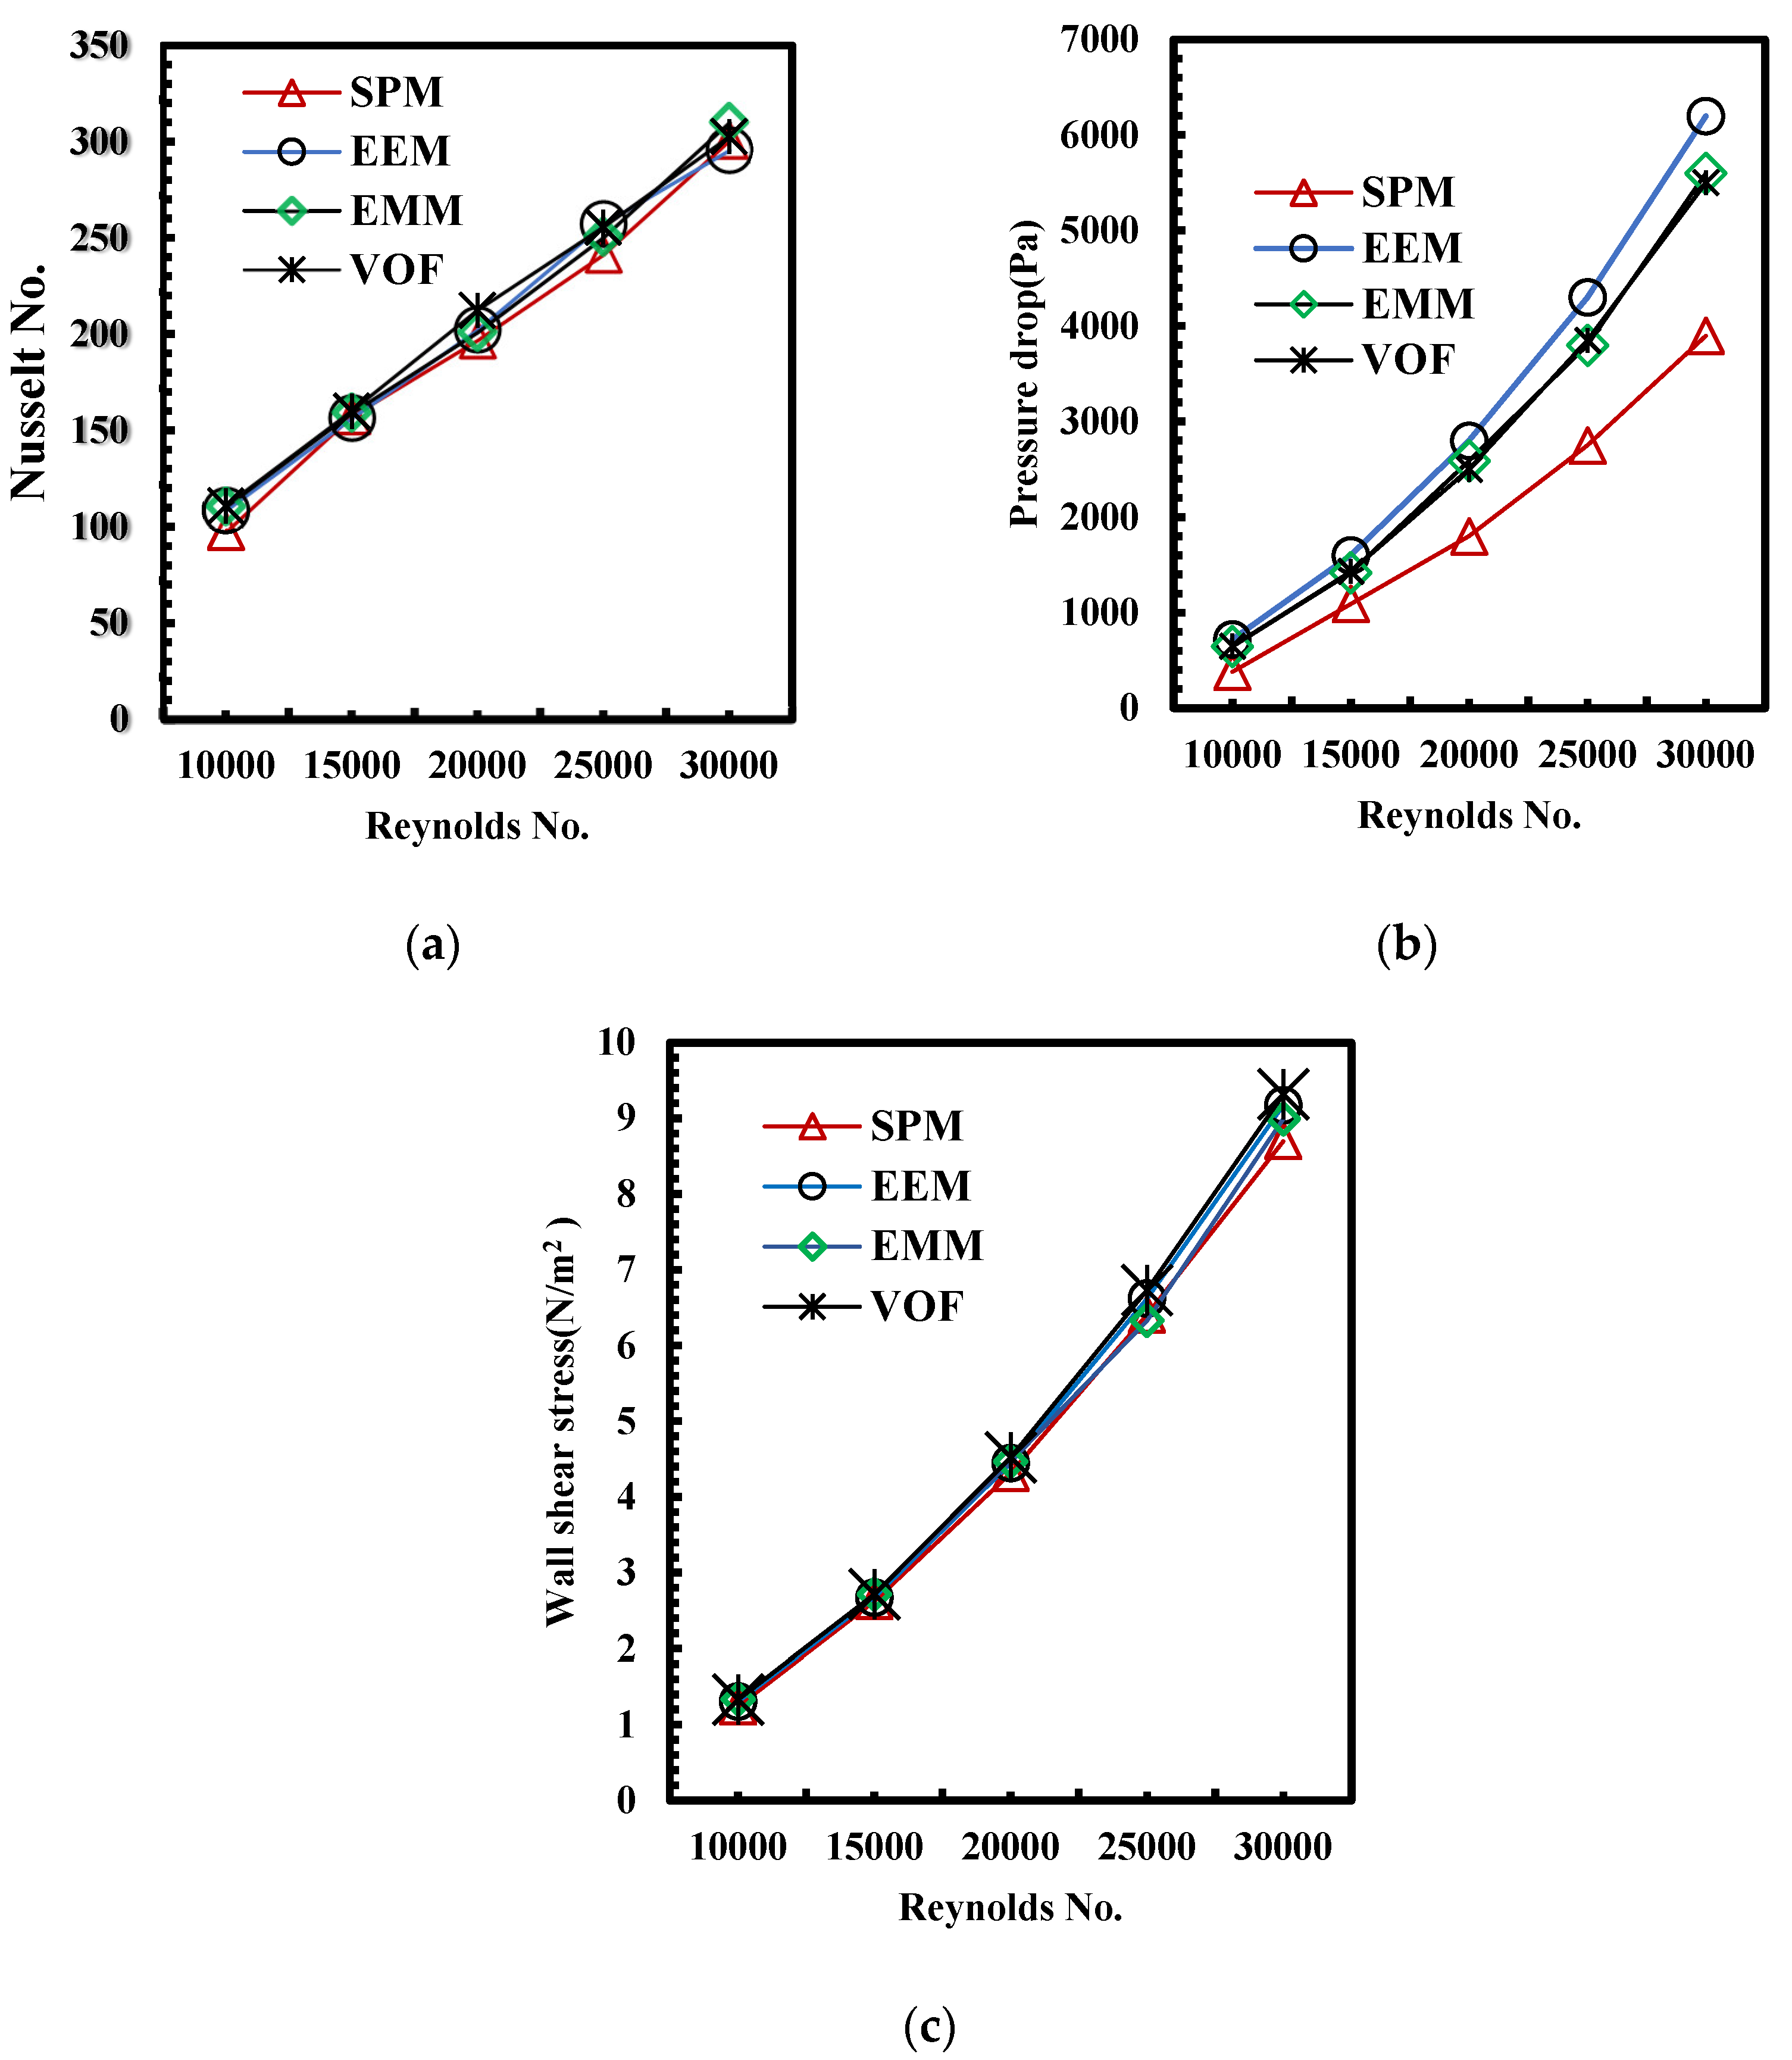
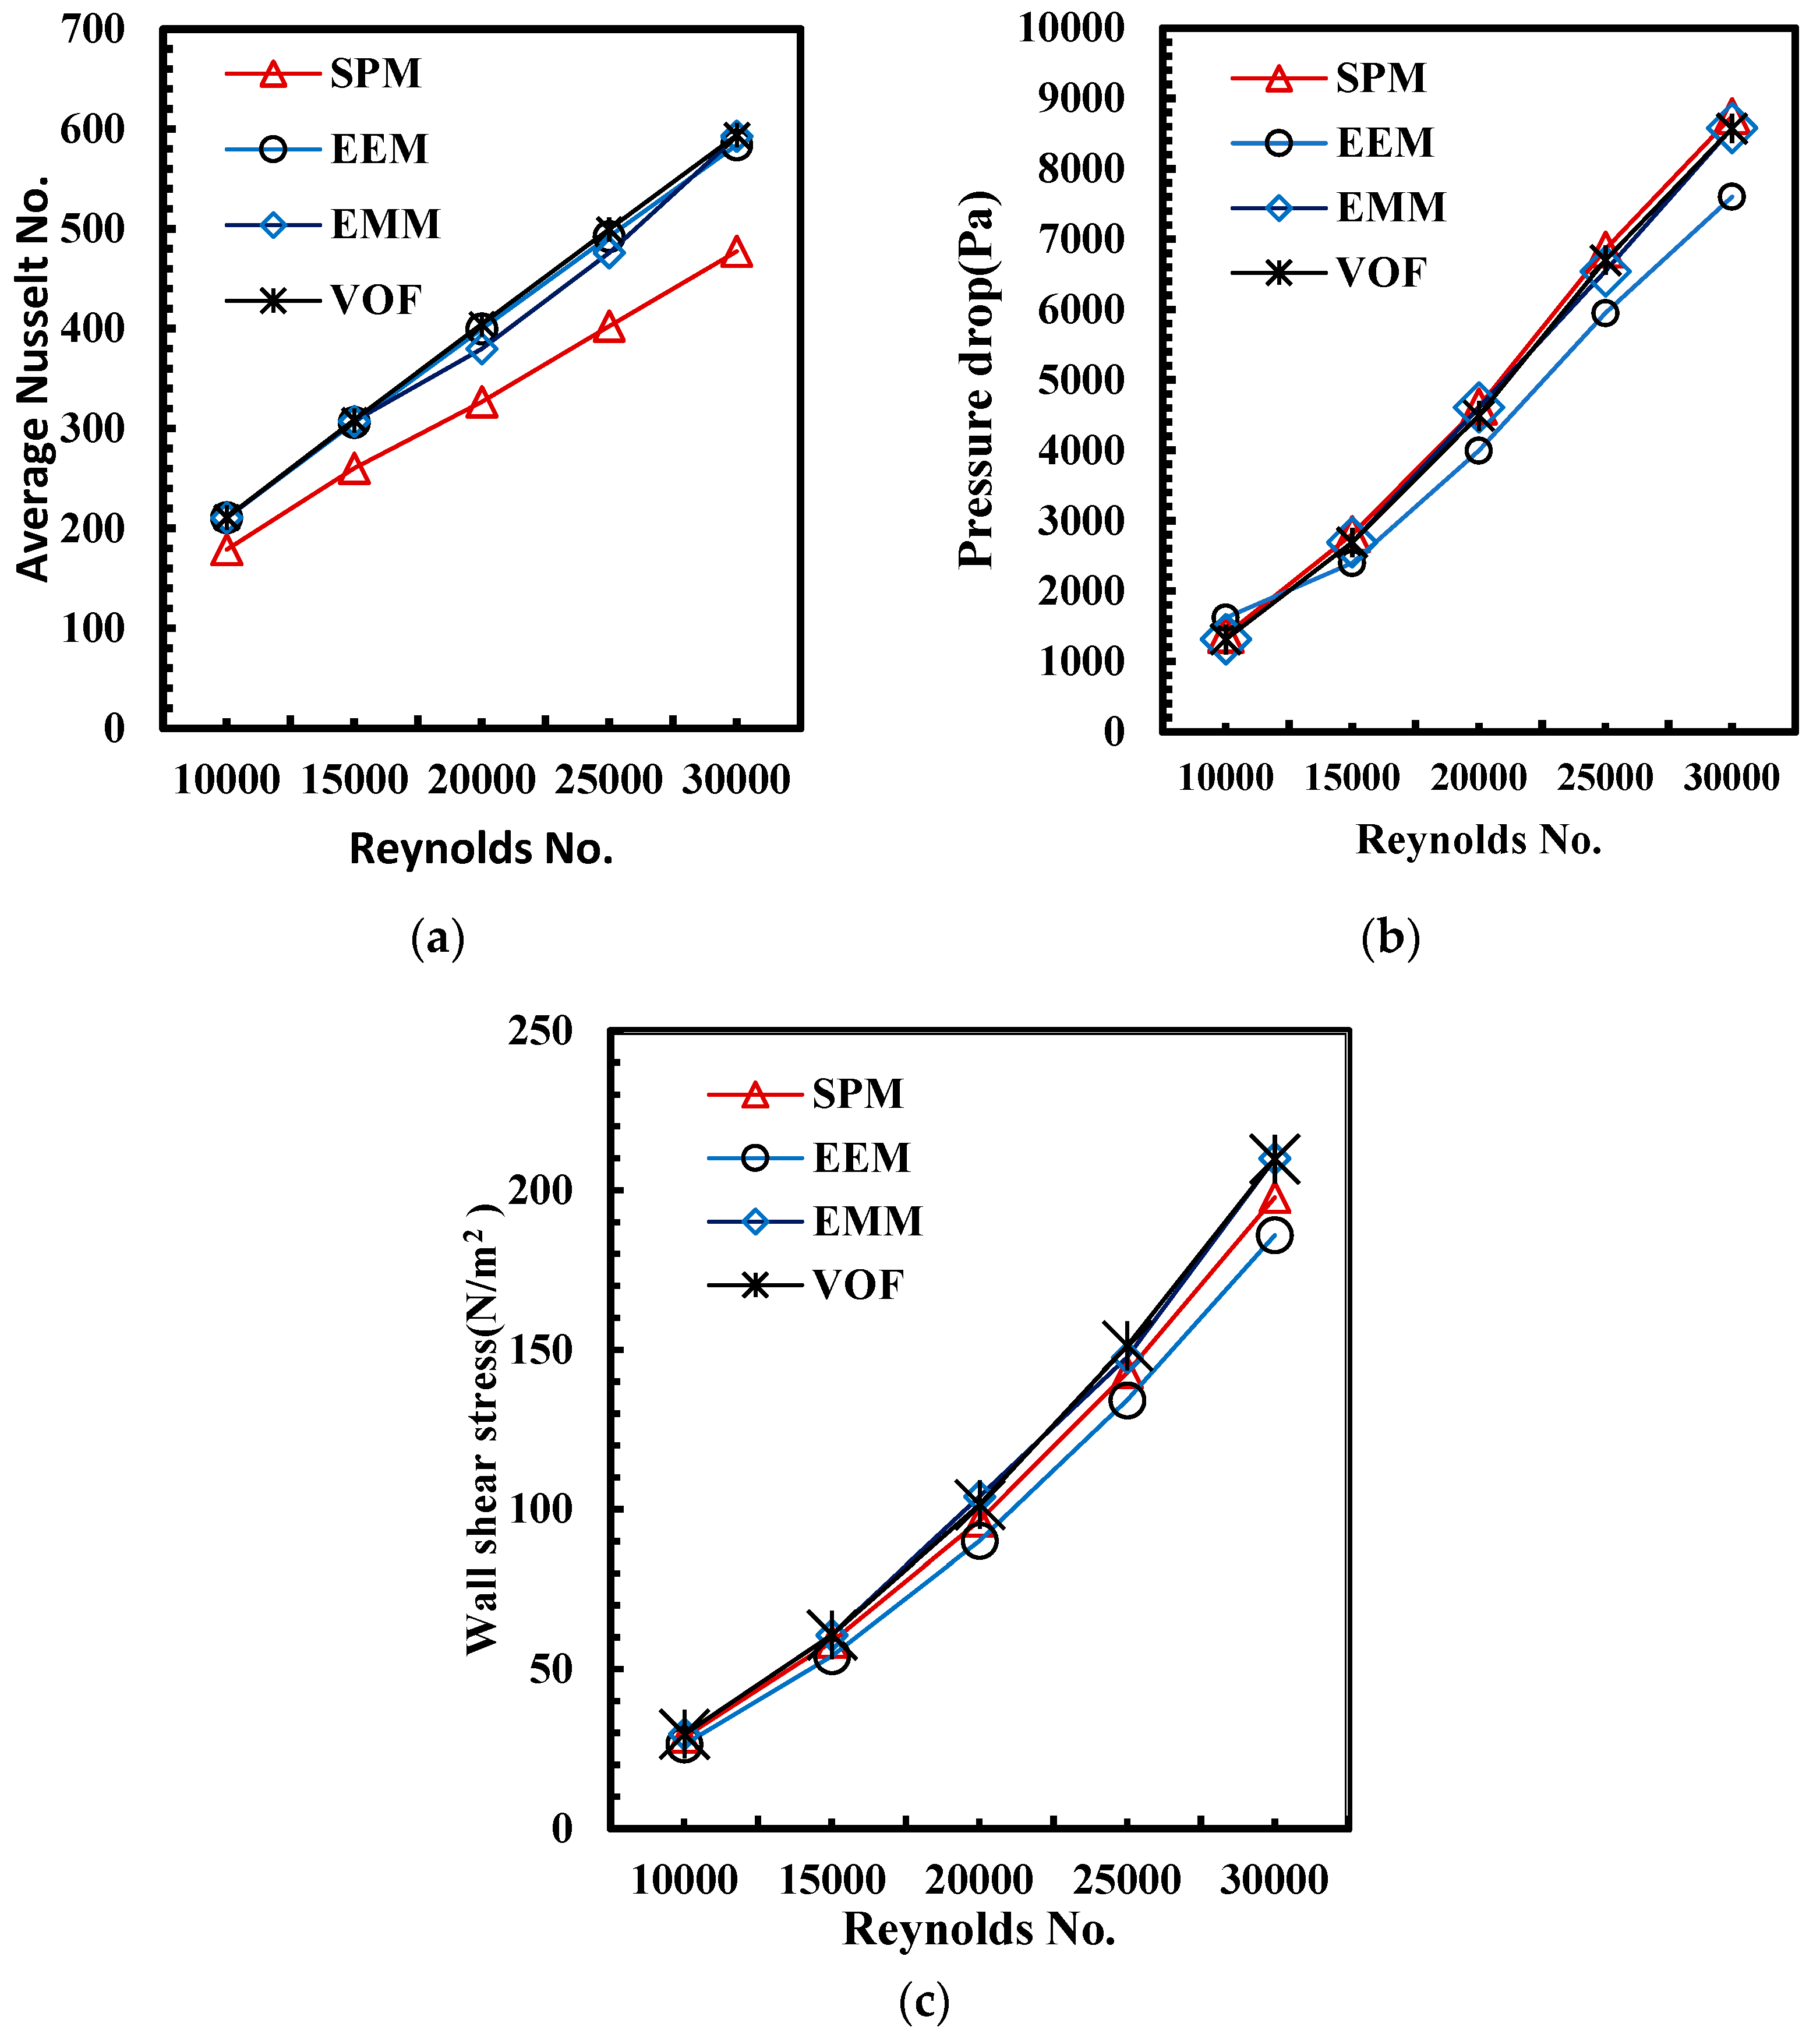
3.1. Comparison between Single and Multi-Phase at Nanofluid Volume Fraction 0.02

Figure 5a shows that the variant of the Nusselt number with the Reynolds number ranges from 10,000 to 30,000 for water as the base fluid, and the nanoparticle concentration 2%. It is clearly seen that the Nusselt number expands with the increase in the Reynolds number for all models and the increments are almost the same; this indicates the effect of the nanoparticle concentration. When comparing these results with those of a volume fraction of 0.08, which will be discussed later (Figure 6a), the low density of SiO2 in a volume fraction of 0.02 contributes significantly to the low acceleration of velocity at the same Reynolds number, while the high density of SiO2 in a volume fraction of 0.08 contributes significantly to the high acceleration of velocity at the same Reynolds number. Moreover, the effect of Brownian motion is observed, which increases with the increase in the concertation of nanoparticles in the base fluid.
It can be determined that for a low nanoparticle concentration, there is no clear difference between single-phase and multi-phase modelling when considering Nusselt number variation. In contrast, for the pressure drop, Figure 5b, which illustrates the variation in the pressure drop with the Reynolds number, the difference between SPM and the three multi-phases are detected. The difference increases with the increase in the Reynolds number, but when compared with the simulation of 0.08 concentration, the difference is less. For the wall shear stress variation with Reynolds numbers, as shown in Figure 5c, the finding illustrates a slight difference detected at high Reynolds numbers.

3.2. Comparison between Thermal and Hydrodynamic Performance of Single and Multi-Phase Flow at Nanofluid Volume Fraction 0.08

In this section, we delve into the repercussions of employing a semi-circle corrugated channel with a symmetrical configuration, alongside variations in the particle volume fraction and Reynolds number, on both thermal and hydraulic features. Additionally, the ensuing flow fields, as depicted by the Nuav, ∆p, and wall shear stress, are thoroughly examined and deliberated upon. Figure 6 shows the variation in the Nusselt numbers, pressure drop, and wall shear stress with Reynolds number ranges from 10,000 to 30,000 for water as the base fluid and a nanoparticle concentration of 8%. Four methodologies were implemented: the single-phase model (SPM) and three multi-phase models including Volume of Fluid (VOF), Eulerian Mixture Model (EMM), and Eulerian–Eulerian Model (EEM). It is noteworthy that the Nusselt number (depicted in Figure 6a) escalates concomitantly with the rise in the Reynolds number for all the approaches, but the three multi-phase models show almost the same increment, about 66%. The SPM gives a smaller increment of about 44%, and the difference grows with the increase in the Reynolds number. The same behaviour can be seen for the pressure drop variation with respect to the Reynolds No. (Figure 6b); the increment becomes higher as the velocity increases but there is a slight difference between the EEM and the other two multi-phase models, which show the same trend. For the wall shear stress variation (Figure 6c) with the Reynolds No., there is a slight difference between single-phase and multi-phase approaches, and this difference increases with the increase in the Reynolds number. On the one hand, the three multi-phase approaches have almost the same values for the three parameters under study. On the other hand, the SPM shows smaller values than the multi-phase approaches and the difference becomes higher as the Reynolds No. increases. This trend is expected due to the fact that for nanofluid modelling, two-phase models are more realistic than single-phase models. Two-phase models consider phase interaction, whereas single-phase models do not, and only have a virtual fluid with various physical qualities.
Figure 6. Variation of (a) Nusselt No., (b) pressure drop and (c) wall shear stress vs. Reynolds No. for nanofluid volume fraction 8%.
Processes 12 00870 g006
To explain the difference between SPM and the three multi-phase models at high Reynolds numbers, Figure 7 shows the velocity magnitude contours at a Reynolds No. of 25,000; observing the velocity profiles, it becomes apparent that recirculation regions form along the walls of the corrugated section upon the entry of the working fluid into these channels. Furthermore, the velocity streamlines indicate that the stronger circulation regions, which are detected by the three multi-phase models, are more than those of the single model at the same region. Figure 8 shows that, as a result of the multi-phase models’ maximum resolution and phase interaction, the thermal boundary of the layer thickness in the single-phase scenario is smaller than that of the other multi-phase scenarios.
As the nanoparticle volume fraction rises, the presence of nanoparticles becomes more significant in the flow, leading to enhanced heat transfer effects. Unlike the SPM, which treats nanofluids as a single homogeneous fluid, the VOF, EMM, and EEM models consider the separate phases of the fluid and nanoparticles, resulting in a more accurate representation of the thermal and hydrodynamic interactions within the flow. Specifically, the VOF model tracks the fluid–nanoparticle interface, enabling the precise determination of heat transfer phenomena, while the EMM and EEM models incorporate phase interactions and momentum exchange between the fluid and nanoparticle phases, adding further sophistication to their predictions.

3.3. The Effect of Turbulence Kinetic Energy

Figure 9 shows the turbulence kinetic energy profiles at a Reynolds No. of 25,000 for SPM in addition to the three multi-phase models. It can be clearly noted that all approaches show strong vortices close to the upper channel wall and this is due to the curvature shape of the upper wall. In the lower wall, there are circulations near the sharp edge, and both the upper and lower vortices become stronger as the flow moves away from the corrugated section entrance. Another more important point to notice is that the three multi-phase models show more vortices details than the single-phase model accomplishes.

4. Conclusions

A majority of applications related to engineering, both micro and macro, necessitate outstanding heat transfer performance. Two popular strategies for enhancing the transfer of heat rate are to extend the exchange surface or use a better fluid. The study presents a numerical comparison of the differences between single-phase and multi-phase models for the turbulent forced convection flow of nanofluids via a semi-circular corrugation channel. Employing Ansys Fluent 2021R1 software, the investigation scrutinized the impact of introducing SiO2 nanoparticles with volume fractions of 0.02 and 0.08 into water, the base fluid. The objective was to discern discrepancies in the behaviours of the two models in portraying thermohydraulic characteristics within the convective heat transfer flow through the channels. With consistent geometry, meshing configurations, and boundary conditions, three multi-phase models and one single-phase model were evaluated across Reynolds numbers ranging from 10,000 to 30,000. The agreement between the corrugated channel’s predictions and experimental data, with a deviation of less than 4%, confirms its accuracy in forecasting heat transfer and fluid flow in corrugated geometries across varying Reynolds numbers. The findings indicate that for simulations at nanoparticle concentrations of 0.08, the Nusselt number increases with the Reynolds number for all approaches, but the three multi-phase models show almost the same increment (approximately 24%), whereas the single-phase model gives a clearly smaller increment, with the difference growing as the Reynolds number increases. Similarly, the pressure drop variation with the Reynolds number at a nanoparticle volume fraction of 0.08 shows that for low Reynolds numbers, there is a slight difference between the single-phase and multi-phase approaches, but the increment becomes higher as the velocity increases, with a slight difference observed between one of the multi-phase models and the others. Additionally, for simulations at a nanoparticle volume fraction of 0.02, the Nusselt number increases with the Reynolds number for all models, and the increments are almost the same; however, the pressure drop variations show a slight difference between the single-phase and multi-phase approaches at low Reynolds numbers, which increases at higher Reynolds numbers, but remains less than that of the 0.08 volume fraction simulation. These outcomes highlight the significant role of increasing nanoparticle concentration in nanofluids for heat transfer enhancement, which is particularly evident when comparing the Nusselt number variation with Reynolds number for both 0.08 and 0.02 volume fractions studied in this research. In other words, for higher nanoparticle volume fractions, the predictions from the two-phase models—Volume of Fluid (VOF), Eulerian Mixture Model (EMM), and Eulerian–Eulerian Model (EEM)—demonstrate remarkable similarity in the average Nusselt number, which are higher than those from the single-phase model (SPM), due to the increased influence and interaction of nanoparticles within the flow. So, it can be said that as the volume fraction of the nanoparticles increases, the nanofluid flow becomes a multi-phase problem, as depicted by the findings of this study.
Furthermore, future trends can include exploring multi-phase modelling techniques, integrating advanced computational methods, investigating nanoparticle types and concentrations, incorporating experimental validation, optimizing multi-phase simulations, and collaborating with industry partners to apply research findings in thermal management and energy systems, addressing real-world challenges.

Author Contributions

Conceptualization, E.K.A. and W.Z.; methodology, E.K.A. and W.Z.; software, E.K.A., W.S.-I.W.S. and A.M.A.E.; validation, S.A.-A. and Y.S.; formal analysis, E.K.A., W.S.-I.W.S., A.M.A.E. and W.Z.; investigation, E.K.A., S.A.-A., Y.S. and W.Z.; resources, E.K.A., S.A.-A. and Y.S.; data curation, E.K.A.; writing—original draft preparation, E.K.A.; writing—review and editing, S.A.-A., Y.S. and W.Z.; visualization, E.K.A.; supervision, S.A.-A. and W.Z.; project administration, E.K.A.; funding acquisition, E.K.A. All authors have read and agreed to the published version of the manuscript.

Funding

This research received no external funding.

Data Availability Statement

Data are contained within the article.

Conflicts of Interest

The authors declare that there are no conflicts of interest regarding the publication of this paper.

Nomenclature

ACross sectional area of rectangular channel, (m2)
CpnfSpecific heat of the nanofluid at constant pressure, (J/Kg K)
CpbfSpecific heat of the base fluid at constant pressure, (J/Kg K)
CppSpecific heat of the particles at constant pressure, (J/Kg K)
DhHydraulic diameter, (m)
dpDiameter of nanofluid particles, (nm)
HChannel height, (m)
hConvective heat transfer coefficient, (W/m2 K)
H2OWater
knfNanofluid thermal conductivity, (W/m·K)
kbfBase fluid thermal conductivity, (W/m·K)
kpNano particle thermal conductivity, (W/m·K)
LLength of channel, (m)
NuNusselt number
SiO2Silicon dioxide
qHeat flux, (W/m2)
ReReynolds number
PchPitch, (m)
pPressure, (Pa)
TTemperature, (K)
ZnOZink oxide
µbfBase fluid dynamic viscosity, (Pa s)
µpParticles dynamic viscosity, (Pa s)
νFluid kinematic viscosity, (m2/s)
τWall shear stress, (N/m2)
ρnfFluid density, (kg/m2)
ρbfBase fluid density, (kg/m2)
ρpParticle density, (kg/m2)
φVolume fraction, (%)
ηThermal enhancement factor
ux-direction velocity component, (m/s)
vy-direction velocity component, (m/s)
wz-direction Velocity component, (m/s)

References

  1. Maxwell, C. Electricity and Magnetism; Clarendon Press: Oxford, UK, 1873. [Google Scholar]
  2. Maxwell, C. A Treatise on Electricity and Magnetism; Oxford University Press: Cambridge, UK, 1881. [Google Scholar]
  3. Bianco, V.; Manca, O.; Nardini, S. Numerical Investigation on Nanofluids Turbulent Convection Heat Transfer Inside a Circular Tube. Int. J. Therm. Sci. 2011, 50, 341–349. [Google Scholar] [CrossRef]
  4. Murshed, S.; Leong, K.; Yang, C. A Combined Model for the Effective Thermal Conductivity of Nanofluids. Appl. Therm. Eng. 2009, 29, 2477–2483. [Google Scholar] [CrossRef]
  5. Ghazanfari, V.; Taheri, A.; Amini, Y.; Mansourzade, F. Enhancing heat transfer in a heat exchanger: CFD study of twisted tube and nanofluid (Al2O3, Cu, CuO, and TiO2) effects. Case Stud. Therm. Eng. 2024, 53, 103864. [Google Scholar] [CrossRef]
  6. Bouzennada, T.; Fteiti, M.; Alshammari, B.M.; Hadrich, B.; Kriaa, K.; Maatki, C.; Kolsi, L. Numerical study on nanofluid heat transfer and fluid flow within a micro-channel equipped with an elastic baffle. Case Stud. Therm. Eng. 2024, 56, 104247. [Google Scholar] [CrossRef]
  7. Kristiawan, B.; Hibatullah, M.A.; Santoso, B.; Musabbikhah; Enoki, K.; Wijayanta, A.T. Thermal performance of Al2O3-TiO2/water hybrid nanofluids for cooling system using a helically coiled tube in a brushless direct current motor. Numer. Heat Transfer Part A Appl. 2024, 1–22. [Google Scholar] [CrossRef]
  8. Alqarni, M.M.; Memon, A.A.; Memon, M.A.; Mahmoud, E.E.; Fenta, A. Numerical investigation of heat transfer and fluid flow characteristics of ternary nanofluids through convergent and divergent channels. Nanoscale Adv. 2023, 5, 6897–6912. [Google Scholar] [CrossRef]
  9. Bianco, V.; Nardini, S.; Manca, O. Enhancement of heat transfer and entropy generation analysis of nanofluids turbulent convection flow in square section tubes. Nanoscale Res. Lett. 2011, 6, 252. [Google Scholar] [CrossRef]
  10. Akdag, U.; Akcay, S.; Demiral, D. Heat Transfer In A Triangular Wavy Channel with Cuo-Water Nanofluids under Pulsating Flow. Therm. Sci. 2019, 23, 191–205. [Google Scholar] [CrossRef]
  11. Yang, Y.-T.; Wang, Y.-H.; Tseng, P.-K. Numerical Optimization of Heat Transfer Enhancement in a Wavy Channel Using Nanofluids. Int. Commun. Heat Mass Transf. 2014, 51, 9–17. [Google Scholar] [CrossRef]
  12. Heidary, H.; Kermani, M. Effect of Nano-Particles on Forced Convection in Sinusoidal-Wall Channel. Int. Commun. Heat Mass Transf. 2010, 37, 1520–1527. [Google Scholar] [CrossRef]
  13. Akbari, O.A.; Toghraie, D.; Karimipour, A. Numerical simulation of heat transfer and turbulent flow of water nanofluids copper oxide in rectangular microchannel with semi-attached rib. Adv. Mech. Eng. 2016, 8, 1–25. [Google Scholar] [CrossRef]
  14. Mohammed, H.I.; Giddings, D.; Walker, G.S.; Power, H. CFD assessment of the effect of nanoparticles on the heat transfer properties of acetone/ZnBr2 solution. Appl. Therm. Eng. 2018, 128, 264–273. [Google Scholar] [CrossRef]
  15. Wu, X.; Wu, H.; Cheng, P. Pressure drop and heat transfer of Al2O3-H2O nanofluids through silicon microchannels. J. Micromech. Microeng. 2009, 19, 105020. [Google Scholar] [CrossRef]
  16. Akbari, M.; Galanis, N.; Behzadmehr, A. Comparative analysis of single and two-phase models for CFD studies of nanofluid heat transfer. Int. J. Therm. Sci. 2011, 50, 1343–1354. [Google Scholar] [CrossRef]
  17. Rashidi, M.M.; Hosseini, A.; Pop, I.; Kumar, S.; Freidoonimehr, N. Comparative numerical study of single and two-phase models of nanofluid heat transfer in wavy channel. Appl. Math. Mech. 2014, 35, 831–848. [Google Scholar] [CrossRef]
  18. Hejazian, M.; Moraveji, M.K. A Comparative Analysis of Single and Two-Phase Models of Turbulent Convective Heat Transfer in a Tube for TiO2Nanofluid with CFD. Numer. Heat Transf. Part A Appl. 2013, 63, 795–806. [Google Scholar] [CrossRef]
  19. Moraveji, M.K.; Ardehali, R.M. CFD modeling (comparing single and two-phase approaches) on thermal performance of Al2o3/water nanofluid in mini-channel heat sink. Int. Commun. Heat Mass Transf. 2013, 44, 157–164. [Google Scholar] [CrossRef]
  20. Ajeel, R.K.; Salim, W.S.-I.W. Experimental assessment of heat transfer and pressure drop of nanofluid as a coolant in corrugated channels. J. Therm. Anal. Calorim. 2020, 144, 1161–1173. [Google Scholar] [CrossRef]
  21. Moraveji, M.K.; Darabi, M.; Haddad, S.M.H.; Davarnejad, R. Modeling of convective heat transfer of a nanofluid in the developing region of tube flow with computational fluid dynamics. Int. Commun. Heat Mass Transf. 2011, 38, 1291–1295. [Google Scholar] [CrossRef]
  22. Salameh, T.; Alkasrawi, M.; Olabi, A.G.; Al Makky, A.; Abdelkareem, M.A. Experimental and numerical analysis of heat transfer enhancement inside concentric counter flow tube heat exchanger using different nanofluids. Int. J. Thermofluids 2023, 20, 100432. [Google Scholar] [CrossRef]
  23. Ahmad, F.; Mahmud, S.; Ehsan, M.M.; Salehin, M. Numerical Assessment of Nanofluids in Corrugated Minichannels: Flow Phenomenon and Advanced Thermo-hydrodynamic Analysis. Int. J. Thermofluids 2023, 20, 100449. [Google Scholar] [CrossRef]
  24. Abugnah, E.K.; Salim, W.S.-I.W.; Elfaghi, A.M.; Ngali, Z. Comparison of 2D and 3D Modelling Applied to Single Phase Flow of Nanofluid through Corrugated Channels. CFD Lett. 2022, 14, 128–139. [Google Scholar] [CrossRef]
  25. Kumar, A.; Kunwer, R.; Donga, R.K.; Priyanka; Kumar, S.; Alam, T.; Siddiqui, I.H.; Dobrotă, D. Effect of oval rib parameters on heat transfer enhancement of TiO2/water nanofluid flow through parabolic trough collector. Case Stud. Therm. Eng. 2024, 55, 104080. [Google Scholar] [CrossRef]
  26. Abugnah, E.K.; Salim, W.S.-I.W.; Elfaghi, A.M. Impact of Geometrical Parameters on Heat Transfer Characteristics of SiO2-Water Nanofluid Flow through Rectangular Corrugated Channels. J. Adv. Res. Fluid Mech. Therm. Sci. 2023, 104, 86–102. [Google Scholar] [CrossRef]
  27. Koo, J.; Kleinstreuer, C. Impact analysis of nanoparticle motion mechanisms on the thermal conductivity of nanofluids. Int. Commun. Heat Mass Transf. 2005, 32, 1111–1118. [Google Scholar] [CrossRef]
  28. Ajeel, R.K.; Salim, W.S.W.; Hasnan, K. Numerical investigations of flow and heat transfer enhancement in a semicircle zigzag corrugated channel using nanofluids. Int. J. Heat Technol. 2018, 36, 1292–1303. [Google Scholar] [CrossRef]
  29. Akbari, M.; Galanis, N.; Behzadmehr, A. Comparative assessment of single and two-phase models for numerical studies of nanofluid turbulent forced convection. Int. J. Heat Fluid Flow 2012, 37, 136–146. [Google Scholar] [CrossRef]
  30. Manninen, M.; Taivassalo, V.; Kallio, S. On the Mixture Model for Multi-Phase Flow; VTT Publications 288; Technical Research Centre of Finland: Espoo, Finland, 1996. [Google Scholar]
  31. Schiller, L.; Naumann, A. A Drag Coefficient Correlation. Z. Ver. Dtsch. Ing. 1935, 77, 318–320. [Google Scholar]
  32. Drew, D.A.; Lahey, R.T. Particulate Two-Phase Flow; Butterworth-Heinemann: Boston, MA, USA, 1993. [Google Scholar]
  33. Ranz, W.E.; Marshall, W.R. Evaporation from drops. Chem. Eng. Prog. 1952, 48, 141146. [Google Scholar]
  34. Mohammed, H.; Abed, A.M.; Wahid, M. The effects of geometrical parameters of a corrugated channel with in out-of-phase arrangement. Int. Commun. Heat Mass Transf. 2013, 40, 47–57. [Google Scholar] [CrossRef]
  35. Petukhov, B.S. Advances in Heat Transfer; Academic Press: New York, NY, USA, 1970; Volume 6, pp. 503–564. [Google Scholar]
  36. Dittus, F.; Boelter, L. Heat transfer in automobile radiators of the tubular type. Int. Commun. Heat Mass Transf. 1985, 12, 3–22. [Google Scholar] [CrossRef]
  37. Ajeel, R.K.; Salim, W.-I.; Hasnan, K. An experimental investigation of thermal-hydraulic performance of silica nanofluid in corrugated channels. Adv. Powder Technol. 2019, 30, 2262–2275. [Google Scholar] [CrossRef]
Figure 1. Diagrammatic representation of (a) domain of computation; (b) test section; (c) semi-circle corrugated channel geometry.
Processes 12 00870 g001
Figure 2. Grid independent test.
Processes 12 00870 g002
Figure 3. (a) Friction factor, (b) average Nusselt No., comparison with the empirical correlations for non-corrugated channel.
Processes 12 00870 g003
Figure 4. Average Nusselt number comparing with experimental data of Ajeel [37].
Processes 12 00870 g004
Figure 5. Variation of (a) Nusselt No., (b) pressure drop, and (c) wall shear stress vs. Reynolds No. at volume fraction 2%.
Processes 12 00870 g005
Figure 7. Velocity magnitude contours of (a) SPM (b) EEM (c) EMM (d) VOF at Reynolds No. 25,000.
Processes 12 00870 g007
Figure 8. Temperature contours of (a) SPM, (b) EEM, (c) EMM, and (d) VOF at Reynolds No. 25,000.
Processes 12 00870 g008
Figure 9. Turbulence kinetic energy contours at Reynolds No. 25,000.
Processes 12 00870 g009
Table 1. Value of β for SiO2.
βConcentration%Temperature (K)
9526 (100ϕ)−1.45941% ≤ ϕ ≤ 10%298 K ≤ T ≤ 363 K
Table 2. Nanofluid thermophysical properties.
ρ (kg/m3)µ (kg/ms)k (W/m K)cp (J/kg K)
Water + SiO2 (8%)10940.0047950.6343022
Water + SiO2 (2%)10220.000980.62894182
Disclaimer/Publisher’s Note: The statements, opinions and data contained in all publications are solely those of the individual author(s) and contributor(s) and not of MDPI and/or the editor(s). MDPI and/or the editor(s) disclaim responsibility for any injury to people or property resulting from any ideas, methods, instructions or products referred to in the content.

