Article

Evaluation of the Bioenergy Potential of Blends (Green Coconut Shells and Fish Scales) as a Feedstock in Thermochemical Processes for Clean Energy Production

by
Ayrton Pablo Raiol Monroe
1,
Arthur Vinicius Sousa Silva
2,
Mariana Silva Melo
3,
Julie Brenda Santos da Silva
4,
Ramón Raudel Peña Garcia
5,
Maria Alexsandra de Sousa Rios
6,
Waldir Antônio Bizzo
2 and
Glauber Cruz
1,*
1
Processes and Thermochemical Systems Laboratory (LPSisTer), Department of Mechanical Engineering, Federal University of Maranhão, Av. dos Portugueses 1966, São Luís 65080-505, Maranhão, Brazil
2
Programa de Pós-Graduação em Engenharia Mecânica (CPG-EM), Faculdade de Engenharia Mecânica, Universidade Estadual de Campinas, Cidade Universitária Zeferino Vaz, Campinas 13083-970, São Paulo, Brazil
3
Department of Chemical Engineering, Federal University of Maranhão, Av. dos Portugueses 1966, São Luís 65080-505, Maranhão, Brazil
4
Postgraduate Program in Mechanical Engineering (PPGMEC), Department of Mechanical and Materials, Federal Institute of Education, Science, and Technology of Maranhão, Av. Getúlio Vargas 04, São Luís 65030-005, Maranhão, Brazil
5
Rua Cento e Sessenta e Três 300—Cohab, Academic Unit of Cabo de Santo Agostinho, Federal Rural University of Pernambuco, Cabo de Santo Agostinho 64049-550, Pernambuco, Brazil
6
Postgraduate Program in Chemical Engineering (PPGEQ), Department of Chemical Engineering, Campus Universitário do Pici, Federal University of Ceará, Fortaleza 60455-760, Ceará, Brazil
*
Author to whom correspondence should be addressed.
Processes 2024, 12(4), 710; https://doi.org/10.3390/pr12040710
Submission received: 30 October 2023 / Revised: 1 February 2024 / Accepted: 28 March 2024 / Published: 30 March 2024

Abstract

:
Brazil is among the world’s largest producers of green coconut, which contributes to inappropriate disposal and socioenvironmental impacts. Concomitantly, some of its coastal cities produce a great diversity of fish and large amounts of solid waste. This paper reports on the use of samples of fish scales (100FS) and green coconut shells (100GCS) and their mixtures in 75%FS:25%GCS (B25), 50%FS:50%GCS (B50), and 25%FS:75%GCS (B75) proportions and quantification of their Higher Heating Values (HHV) and Lower Heating Values (LHV), and Ultimate (UA) and Proximate Analyses (PA). Their thermal behavior was investigated by thermogravimetry (TG/DTG) and differential scanning calorimetry (DSC), whereas scanning electron microscopy (SEM), energy dispersive spectroscopy (EDS), X-ray diffraction (XRD), and Fourier transformed infrared (FTIR) were employed for analyses of their physicochemical and morphostructural properties. When compared to in natura samples, SEM images of the blends detected a structural disorder and a highly fibrous structure with an elongated chain and surface roughness. HHV were superior in samples with 100GCS (16.64 MJ kg−1), B75 (15.80 MJ kg−1), and B50 (14.98 MJ kg−1), and lower in B25 (14.16 MJ kg−1) and 100FS (13.03 MJ kg−1), with acceptable values for different biomasses. TG/DTG and DSC curves showed similarities among the samples, with the detection of their main thermoconversion stages. According to the data, the samples can be applied as renewable energy sources to mitigate socioecological illnesses and social vulnerabilities resulting from the archaic and inadequate management of solid waste.

1. Introduction

According to the National Solid Waste Policy Law (PNRS) (No. 12305/2010), solid waste (SW) is defined as any discarded material, substance, object, or good resulting from human activities in society, and whose final destination takes place in solid or semi-solid states [1]. The inappropriate disposal of that waste has become a global concern in terms of socioenvironmental impacts, causing flooding, increased pollution, waste of public resources, devaluation of properties, obstruction of public roads, damage to tourism, and public health disorders [2]. Towards an adequate destination, solid waste can be reused through a series of physical, chemical, and/or biological processes for new bioenergy and/or industrial applications [3].
As a tropical fruit whose content offers several benefits to human health and due to the modern consumer’s gradual adherence to healthy habits, green coconut water (Cocus nucifera L.) has become more popular and more frequently obtained [4]. On the other hand, unrestrained consumption, associated with the capitalist model, has led to harmful results for the terrestrial ecosystem and the disposal of waste in landfills with no adoption of criteria or public policies for the protection of the natural environment [5].
The consumption of green coconut favors inadequate disposal of waste in unsuitable places; it is mixed with domestic waste and, therefore, responsible for a large accumulation of municipal solid waste (MSW) since its shell is predominant in the composition, corresponding to 80.0% of the total mass of the fruit [6].
The bioenergetic properties of coconut shells have been investigated for biofuel production and their correct destination. Ahmad et al. [7] assessed the coconut shells conversion into biochar on a global scale, providing a high-density sample (412 kg m−3), profitable calorific value (19.4 MJ kg−1), and large availability of the crop (10 million hectares and 92 countries). The aim was to produce a briquette via physical mechanism and combustion, including proximate and ultimate analyses, as well as calorific heating values. The compression process for such a production increased the high heating value of those shells to 32.16 MJ kg−1 [8]. Inayat et al. [9] studied coconut shells for heat and power generation by thermochemical characterization.
However, information on ash content, properties of green coconut shells for thermochemical conversion (pyrolysis and/or combustion), and a better understanding of their performance in different proportions like feedstock in thermal processes are still incipient. The novelty of this study is it has filled such a lack of data and analyzed the behavior of green coconut shells and fish scales.
Similar to the trade of green coconuts, fish on the Brazilian coast (more precisely in the Northeast of the country) has stood out as an important source of income and supply of high-quality proteins to a large contingent of the population, with growing demands met by aquaculture [10]. In 2022, the Brazilian production of farmed fish reached 860,355 tons, according to a survey conducted by the Brazilian Fish Farming Association (ABP). Such data showed a 2.3% over the 2021 production, i.e., 841,005 tons produced [11].
Therefore, the consumption of fish on the Brazilian coast is one of the main profitable and economic activities, reinforcing the need for appropriate disposal or reuse of the aforementioned solid waste [12]. In this sense, the Brazilian Northeast region stands out for its high potential for fishing production, given the large number of freshwater reservoirs with characteristics suitable for the cultivation of aquatic organisms and abundant labor. Although fishing activity is evident as a cultural, hereditary, and popular characteristic in the national territory, its production exposes a disorderly generation of fish waste in inappropriate locations, which is another socioenvironmental problem faced by Brazilian coastal cities [13].
The bioenergy production sector has gained more space in energy generation processes in recent years since it is a clean, sustainable, and renewable source, and plant biomass has become a better-known source for biofuel and heat production [14].
The lignocellulosic material contains mainly three groups of natural polymers on a dry basis, namely, cellulose (≈50.0%), hemicellulose (10.0% to 30.0% in wood and 20.0 to 40.0% in herbaceous species), and residual lignin (10.0% to 40.0%) [13].
Direct combustion and oxy-fuel combustion, and pyrolysis are the most widely researched processes for biomass thermoconversion [15]. In combustion, the biomass is burnt in a synthetic air environment for heat production, whereas the oxy-fuel combustion ambient is constituted of pure oxygen and recycled flue gas (RFG) or carbon dioxide (CO2) [16], which is a helpful technology for reduction in CO2, SOX, and NOX emissions [17]. The pyrolysis process consists of biomass heating in oxygen absence (inert atmosphere) for the production of biochar, bio-oil, and syngas. Such technology has been extensively studied for biofuel production; however, unlike oxy-fuel combustion, pyrolysis requires more labor due to its biomass components and many degradation stages [17].
Thermal processes (pyrolysis and/or direct combustion) differ from each other regarding operating conditions (temperature ranges, heating rates, absence or presence of oxygen), which justifies the use of different waste in these processes to reduce gaseous emissions in landfills, reduce costs arising from final disposal, and support the management of solid waste in general [18].
Prior to the destination of biomasses in a thermal system, investigations on their properties must be conducted to predict the biofuel yield in energy generation [19]. Each type of biomass displays specific energetic, thermal, compositional, morphological, and vibrational characteristics. Furthermore, blending biomasses can result in improved or inhibited characteristics, and for this reason, several studies have provided quantitative tools for biomass quality assessment [20,21,22]. However, the results are incipient and exhaustive experimental analyses are still required.
This study investigated an innovative, promising, and technological proposition for the reuse of different proportions of mixtures of green coconut shells and fish scales towards the generation of thermal energy through thermochemical conversion processes, contributing to the scientific community in the search for cleaner and more sustainable energy solutions.
Thermogravimetry (TG/DTG) and differential scanning calorimetry (DSC) under inert atmosphere (argon 5.0) were used for the thermal characterization of pure samples of fish scales (100FS) and green coconut shells (100GCS) and their mixtures in three proportions, namely, 75%FS:25%GCS (B25), 50%FS:50%GCS (B50), and 25%FS:75%GCS (B75). Scanning electron microscopy (SEM images), energy dispersive spectroscopy (EDS), X-ray diffraction (XRD), and Fourier-transform infrared spectroscopy (FTIR) evaluated their physicochemical, morphological, and structural properties.

2. Materials and Methods

2.1. Samples Preparation

Samples of green coconut shells (100GCS) and fish scales (100FS) were collected in coastal and central regions of São Luís city (Maranhão State, Northeast region, Brazil), located at 2°31′51″ South (latitude) and 44°18′24″ West (longitude) [13]. Fish scales of several species of local fish (e.g., tambaqui (Colossoma macropomum), pirarucu (Arapaima gigas), and tilapia (Oreochromis niloticus) were used for generalized analyses.
In the preparation stage (Figure 1), the samples were washed in running water for the removal of impurities, dried in an oven with controlled residence time and temperature (60 °C for 48 h) for the elimination of excess moisture, ground with a knife and hammer mill to reduce their particle sizes, and sieved for separation into average ≈ 328 μm sizes. Their blends were prepared in proportions of 25% fish scales + 75% green coconut shells (B75), 50% fish scales + 50% green coconut shells (B50), and 75% fish scales + 25% green coconut shells (B25).

2.2. Ultimate Analysis

The relative contents of carbon (C), hydrogen (H), nitrogen (N), and sulfur (S) present in the samples were quantified in an EA1110 CHNS-O Elemental Analyzer (CE Instruments, England, UK), according to EN ISO 16948:2015 [23]. The oxygen content was quantified by difference at 100% [13].

2.3. Stoichiometry of the Main Gaseous Emissions (CO2, NO, and SO2)

Equation (1) shows a global combustion reaction for biomass and solid waste based on the ultimate analysis and formation of the main atmospheric pollutants (CO2, NO, and SO2) generated during those thermal processes according to Silva et al. [24,25]:
C a + H b + N c + O d + S e + x O 2 + 3.76 N 2 A C O 2 + B H 2 O + C N O + E S O 2 + y N 2
where a, b, c, d, and e are, respectively, percentages of carbon, hydrogen, nitrogen, oxygen, and sulfur divided by their respective atomic masses (12, 1, 14, 16, and 32, respectively). Stoichiometric coefficients x and y were calculated for balancing Equation (1) according to the linear equation system provided in Equation (2):
x = 1 2 2 a + b 2 + c + 2 e d y = 3.76   x
The x-value determined and the use of part of the first member of Equation (2), x (O2 + 3.76 N2), enabled the calculation of the air mass required for the stoichiometric combustion of the material studied, i.e., the amount of oxidant mass necessary and sufficient for the complete burning of all biofuel in an ideal process [26,27]. The second member of Equation (1), i.e., products of the global combustion reaction, was used for obtaining the theoretical values of CO2, NO, and SO2 emissions—A, B, C, and E refer to the gaseous concentrations of the products generated and are equivalent to:
A = a B = b 2 C = c E = e
Dividing parameters A, C, and E by the sum of the total coefficients and disregarding the moisture (B) (dry base) led to the estimate of the air pollutants (CO2, NO, and SO2) values under stoichiometric and complete combustion conditions by Equations (3)–(5):
[ C O 2 ] % = A A + C + E + y
[ N O ] % = C A + C + E + y
[ S O 2 ] % = E A + C + E + y

2.4. Proximate Analysis

The contents of moisture (M), volatile materials (VM), ash (A), and fixed carbon (FC) of the samples were obtained in a vacuum muffle furnace MLVC 1300/7 (INTI brand, Rio de Janeiro, Brazil), following the methodology developed by Torquato et al. [28]. All experiments were performed in triplicate to verify the repeatability of the results.
The volatile material and fixed carbon contents were associated using the combustibility index (CI) (Equation (6)), according to Gonzales et al. [29]:
C I = V M F C
CI enabled a comparison of the reactivity of different materials or substances—the higher the CI, the more reactive the sample in combustion processes and the better its burning [29].

2.5. Calorimetry Analysis or Energy Potential

The higher heating value (HHV) of the samples, established by ASTM E711 [30] and NBR 8633 [31], was determined in an IKA C200 calorimetric pump (Cole-Parmer, England, UK). The lower heating value (LHV) was obtained by Equation (7), based on the experimental HHV and ultimate and proximate analyses [13]:
L H V = [ ( H H V λ · ( r + 0.9 H ) ) · ( 100 W ) / 100 ]
where λ is the latent heat of water vaporization (2.31 MJ kg−1) at 25 °C, W is the moisture contained in the sample, H is the hydrogen content obtained from the ultimate analysis, and r is the moisture ratio, given by r = W/(100 − W). All experiments were performed in triplicate to verify the repeatability of the results [32].

2.6. Scanning Electron Microscopy (SEM Images) and Energy Dispersive Spectroscopy (EDS)

SEM images of the samples were obtained under a LEO440 scanning electronic microscope (Leo Electron brand, Zeiss, Jena, Germany) for different times of magnification (60, 200, 220, 500, and 1000×), according to ASTM E2809-22 [33], and enabled studies of their morphological properties, e.g., external surface structure and formation and distribution of pores on the surface of the lignocellulosic material. A microscope was also used in the energy dispersive spectroscopy analysis to determine and semi-quantify the composition of inorganic elements, according to ASTM E1508-12a [34]. The samples were placed in a hydraulic press and secured to aluminum support by a double-sided adhesive tape produced from carbonaceous material for better fixation during the analysis.

2.7. X-ray Diffraction (DRX)

X-ray diffraction enables the verification of crystalline and amorphous regions related to the structural organization of the samples and the calculation of the crystallinity index (%CIDRX) by the Segal method and Equation (8) [35], which strongly influences the thermoconversion process since amorphous products show a higher reactivity when compared to crystalline ones [30].
% C I D R X = ( I 002 I a m ) / I 002 × 100
where I002 and Iam represent the intensity of crystalline and amorphous regions, respectively. A Rigaku Multiflex brand diffractometer (Rigaku, Tokyo, Japan) with CuKα radiation (λ = 1.541 Å, 40 kV–40 mA), 4 to 70° scan rate (2θ), and 0.05° s−1 step size was used, following ASTM E3294-22 [36].

2.8. Fourier Transformed Infrared Spectroscopy (FTIR)

The FTIR spectra were recorded between 4000 and 400 cm−1 in a Shimadzu Fourier transform spectrophotometer (IR-Prestige-21 model, Shimadzu, Kyoto, Japan) programmed in transmittance mode, according to ASTM E1252 [37]. Analyses were conducted in KBr pellets for 328 μm granulometries for the identification of the main functional groups of the samples based on the vibrational frequencies of the biomass molecules.

2.9. Thermal Analysis (TG/DTG, and DSC)

A STA 449C simultaneous analyzer (Netzsch brand, Netzsch, Selb, Germany) obtained TG/DTG and DSC curves under an inert (argon 5.0) atmosphere with 100 mL min−1 dynamic flow rate applied, 8.0 ± 0.5 mg sample size, 10 °C min−1 heating hate, and room to 800 °C temperature. The technique allowed evaluation of the thermal degradation stages of the main constituents of the samples, namely, hemicellulose, cellulose, lignin, and extractives and endothermic and exothermic events.

3. Results and Discussion

3.1. Proximate, Ultimate, and Heating Value Analyses

Table 1 shows the properties of proximate, ultimate, and calorific value analyses (energy potential) obtained for green coconut shells (100GCS), fish scales (100FS), and their blends (B75, B50, and B25). The lowest moisture content was found for the 100FS sample (3.80%), which increased with the addition of green coconut shells to the mixture. Therefore, the highest moisture values were observed for B75 (8.03%) and 100GCS (9.44%). This parameter is directly related to the assessment of the bioenergetic potential of the feedstock during the thermal decomposition in thermoconversion processes [38,39]. Despite the increase, the moisture resulting from the blends remained below 10.0%, and such a percentage is acceptable for application in burning processes [40,41].
The biomasses with the highest percentages of green coconut shells (100GCS and B75) showed the highest concentrations of volatile materials—VM (92.40% and 86.64%, respectively), values close to those reported by Da Silva et al. [42], with 88.7%, 75.3%, and 83.7% VM contents of sugarcane bagasse, rice husks, and coffee husks, respectively. The VM content decreased with an increase in the amount of fish scales in the sample (86.64% to 73.09%). High levels of volatile materials favor bio-oil production due to high thermal reactivity and volatility in combustion and/or pyrolysis processes and contribute to the gasification process [42].
Fixed carbon (FC) is a combustible material (biochar) that remains after the removal of moisture and volatile materials [43]. FC contents of around 6.0% were found for the five samples studied, which is directly related to the calorific value since an increase in that percentage improves the quality of combustion, leading to longer burning of the biomass [44]. Furthermore, carbonization and/or torrefaction processes can increase/densify the fixed carbon values of different biomasses [45]. Some authors reported FC contents close to 7.0% for different biomasses such as woods, grasses, coffee, and rice husks, tucumã seed, and fish scales [13,40,44].
The combustibility index (CI) was higher for the 100GCS sample and decreased with an increase in the proportion of fish scales in the mixture, indicating greater reactivity and better performance in combustion processes for the samples with a larger quantity of green coconut shells (100CGS and B75), with approximately 14.0 CI due to the higher content of volatile material.
The value is higher than that of many traditional biomasses, e.g., sugarcane bagasse and straw, and eucalyptus wood and bark, with IC values of 12.5, 8.5, 6.7, and 5.3, respectively, calculated by Bizzo et al. [46] and Pena-Vergara et al. [47]. CI expresses the mass ratio of the portion of volatile materials to the fixed carbon of the solid fuel [29], and its usefulness and relationship with the reactivity of the fuel lie in the higher rates of the combustion process of volatiles in relation to fixed carbon. The combustion of volatile materials occurs in the gaseous phase, in which the mixing conditions of reactants and chemical kinetics are more favorable to a higher reaction velocity in comparison to combustion in the heterogeneous phase, which occurs in the consumption of fixed carbon [46,47].
A 100GCS sample showed a lower ash content (1.0%) compared to fish scales (26.0%). Such a higher content in fish scales can significantly influence the combustion process and is most often deposited at the bottom of thermochemical reactors, causing clogging [48]. The contents are lower in relation to that of municipal solid waste (MSW) (e.g., sewage sludge, with approximately 43.2%) [49] due to a larger proportional fraction of mineral elements (not consumed) in the distribution of fish scales [48]. Moreover, the ash content was higher in blends with greater amounts of scales in the mixture.
The elemental composition of biomass directly influences its energy potential since a variation of around 1.0% in the contents of carbon and/or ash can significantly change the calorific value of the sample of the order of 0.4 MJ kg−1 and 0.2 MJ kg−1, respectively [50]. Table 1 shows the percentage values of carbon, hydrogen, nitrogen, sulfur, and oxygen provided by ultimate analysis for pure samples and blends and the minimum formula (CaHbNcOdSe) obtained by dividing the quantified percentage of chemical elements by their respective atomic weights [51].
The elemental composition of green coconut shells (100GCS) was similar to that reported by Cruz et al. [52] for sugarcane bagasse, i.e., 41.8% carbon, 5.4% hydrogen, 51.8% oxygen, and approximately 1.0% nitrogen. The samples analyzed in this study showed below 1.0% sulfur content. According to Nóbrega et al. [53], low nitrogen and sulfur contents indicate less polluting biomass since they are neither prone to the formation of NOX and SOX nor can reduce the slag formation when applied in conventional combustion processes.
The carbon, hydrogen, and nitrogen contents of 100FS were slightly higher than those reported by Santos et al. [54] and Silva et al. [13], who obtained around 20.0% carbon, 3.0% hydrogen, and 6.0% nitrogen. The oxygen content was lower than that informed by Silva et al. [13], who identified values in the 70.0% range. High oxygen content, together with the carbon content found, represents a low energy density for fish scales since higher oxygen values in relation to carbon reduce the bioenergetic potential by decreasing the energy contained in C-O and C-H bonds [13].
Regarding the ultimate analysis of the blends, the addition of fish scales resulted in an increase in the amount of oxygen (52.38 to 53.47%) and nitrogen (3.80 to 8.90%) and a reduction in the content of carbon (38.61 to 32.61%). The amounts of hydrogen (≈4.0%) did not change significantly because of the similar compositions among the samples and the lower than 0.35% sulfur values. Such compositions highlight coconut shells as a material with fewer environmental impacts compared to fish scales since, during the burning process, higher levels of S and N present produce more polluting gases (e.g., SO2, SO3, and NOX) [40].
The minimum molecular formula of the materials enabled the yield of the complex chemical reaction of thermal decomposition to be assumed and the estimation of their potential gaseous emissions when subjected to an ideal burning process. In this case, it is considered that all S and N are oxidized to SO2 and NO, respectively. Table 2 shows the concentrations of the potential gaseous emissions of CO2, SO2, and NO under stoichiometric conditions, air mass, and air–fuel ratio for green coconut shells, fish scales, and blends, and Figure 2 displays the levels of air pollutants in absolute values.
The stoichiometric air mass required for the combustion process of the solid fuel decreased for the blends with a higher composition of fish scales (401.43 kg for B75 to 349.98 kg for B25). Such a reduction is mainly related to the carbon content in the sample, since this is directly proportional, i.e., the higher the carbon and minerals content of the material, the greater the stoichiometric air–fuel ratio necessary for the total burning of the material [54]. 100GCS (448.92 kg) and 100FS (296.55 kg) showed the highest and lowest compositions, respectively.
According to Figure 2, the increase in the amount of scales in the mixture reduced the CO2 concentration and increased SO2 and NO. The CO2 concentration decreased by around 10.0% when comparing samples B75 and B25, whereas SO2 emissions increased approximately 4 times (194.14 to 772.26 ppm) and around 2.5 times for NO (18,736.59 to 49,093.57 ppm), mainly due to the larger amounts of nitrogen in fish scales. Despite the increase, the composition of sulfur dioxide (SO2) in the samples was 4 times lower than that produced by coal, for example [54].
This study has shown the presence of sulfur (S) at levels below 1.0% in all samples, indicating its low production [55]. Reducing the concentration of this typically polluting element is one of the main strategies for combating some environmental problems, possibly minimizing the formation of monoxides (SO) and sulfur dioxides (SO2), which also deteriorate metal parts of laboratory or industrial thermal equipment [43], thus impairing heat and mass transfer. In real thermochemical conversion systems, those gases are associated with problems of corrosion in furnaces and ducts [55].
Interestingly, gaseous emissions from a combustion process depend directly on the characteristics of the fuel, operating conditions, and combustion equipment. Therefore, the calculated values represent a gaseous emission potential. Other pollutants, such as CO, NO2, and other gases, can also be formed; however, other pollutant formation routes may be present due to the type of thermal process adopted [46,47].
Table 1 also shows the heating values (HHV and LHV) of samples of green coconut shells, fish scales, and blends. 100GCS and 100FS showed the highest and the lowest HHVs, respectively (16.64 and 13.03 MJ kg−1), whereas the HHV of the blends decreased from 15.80 to 14.16 MJ kg−1 with an increase in the amount of fish scales in the mixture. As addressed elsewhere, the amounts of carbon and oxygen, for example, directly influence the higher heating value of the lignocellulosic material [56,57].

3.2. Scanning Electron Microscopy (SEM Images)

Figure 3a–j display the SEM images. The morphological characteristics of green coconut shells, fish scales, and blends were analyzed at different magnifications (60, 250, and 500 times).
The SEM images of all samples showed a slightly irregular surface, with an apparent dispersion of the fibrous structure of the pure material and a higher exposure of porous structures, possibly due to the grinding process. Both fragmentation (Figure 3a) and the rough appearance of the samples may be a consequence of the grinding process during the preparation stage.
Figure 3b–d,g–i show the SEM images for the blends of green coconut shells and fish scales, with a brittle appearance and a cylindrical shape. The homogeneity of the materials provided by substances such as collagen and hydroxyapatite present in fish scales can be identified [13].
The SEM images of in natura fish scales (Figure 3e,j) reveal a structural arrangement characteristic of the presence of hydroxyapatite, a material also found by Silva et al. [13,52]. The samples in Figure 3g,h show pores in the structure, which makes them an important ceramic with high relevance for use as a biomaterial, mainly due to their biocompatibility, among other characteristics [58].

3.3. X-ray Diffraction (DRX)

The X-ray diffractograms for green coconut shells, fish scales, and blends are displayed in Figure 4. The 100GCS, B75, B50, B25, and 100FS samples showed 20.13%, 18.07%, 15.32%, 13.04%, and 11.03% crystallinity indices, respectively. The crystallinity values obtained for the five samples were lower in comparison to other biomasses studied (e.g., tucumã seed (57.4%) and sugarcane bagasse (64.8%) [59], and cassava stem (60.2%) [60]). The CIDRX obtained for 100FS (≈11.0%) was close to that reported by Silva et al. [13], i.e., 10.9%.
The low crystallinity values observed for the samples indicate their mostly amorphous structures, which, in most polymers, is favorable for thermochemical conversion processes since they help maintain the thermal reactivity of the flame, promoting the burning of polymeric materials [13].

3.4. Fourier Transformed Infrared Spectroscopy (FTIR)

Figure 5 displays the FTIR spectra, and Table 3 shows the main functional groups present in the samples. The infrared spectra of the samples showed similar absorptions, however, with some variations in intensities.
The absorption peaks in the region between 3300 and 3480 cm−1 correspond to the N-H stretching frequency. Although such vibrations are normally observed in bands between 3400 and 3440 cm−1, a shift to lower band values, such as 3300 cm−1, may have occurred due to the hydrogen bond with a peptide [61]. The absorption bands located around 3327 cm−1 are attributed to OH bonds [53]. A band between 2920 and 2950 cm−1 was detected with higher intensity in the 100FS and B25 samples and corresponds to the presence of an aliphatic branch of C-H hydrocarbon [62]. The peaks at 1737, 1658, and 1612 cm−1 represent the C=O double bonds of aldehydes (100GCS), C=C (100FS), and C=O (100GCS), respectively [63]; such compounds were identified for all mixture proportions.
The region covering the peaks at 1247, 1160, and 1037 cm−1 corresponds to the C-O bond of the carbonate groups of carboxylic acid, esters, and ethers found in 100GCS. However, the peak around 1236 cm−1 was detected only in 100FS and may correspond to the C-N bond of aliphatic compounds [13].
The hydrocarbons and main organic compounds detected in the samples were confirmed through ultimate analysis, which showed the amounts of carbon, hydrogen, and oxygen, guaranteeing a high bioenergetic potential of the studied biomasses for application as a pulverized solid biofuel obtained in thermochemical conversion processes.

3.5. Energy Dispersive Spectroscopy (EDS)

Table 4 shows the data of the samples analyzed by Energy Dispersive Spectroscopy (EDS), and the average percentage values in quantification for the different compounds. The values showed a predominance of carbon and oxygen elements for the five sample proportions, confirming the results from the ultimate analysis.
The EDS analysis identified the presence of some metals from the alkaline and alkaline earth groups (e.g., sodium (Na), magnesium (Mg), potassium (K), and calcium (Ca)), which are harmful elements to the combustion process when they participate in the formation of oxides, hydroxides, and carbonates in thermal processes. However, such compounds show lower levels compared to the other elements highlighted (Table 4).
The sulfur (S) levels were more evident when using the technique than with the ultimate analysis. On the other hand, the percentage of S was similar to those values reported in other studies, e.g., 0.12% in Da Silva et al. [64], in a lignocellulosic material (i.e., urban pruning—composed of leaves, stem, and a mixture of 50% leaves + 50% stem). The values of the trace elements or oligoelements detected in this study were close to 1.0% and increased as the percentage of fish scales was incorporated into samples.
Figure 6 displays the possible oxides formed by samples of green coconut shells, fish scales, and their blends, according to the data in Table 4. The main oxides quantified were CaO, MgO, Na2O, K2O, SO3, and P2O5. Components such as Al2O3 were measured only for the 100FS, whereas SiO2 showed values greater than 1.0% for 100GCS (32.0%), B75 (7.0%), and B50 (2.0%). 100GCS displayed the highest amounts of MgO (6.0%), Na2O (6.0%), and K2O (48.0%), whereas 100FS showed the highest P2O5 content (39.0%). Regarding the blends, the addition of fish scales to the mixtures resulted in an increase in the compositions of CaO (23.0 to 52.0%) and P2O5 (19.0 to 35.0%) and a reduction in the contents of MgO and Na2O (5.0 to 1.0% in both cases). The samples showed an average similar composition (around 4.0%) for SO3.

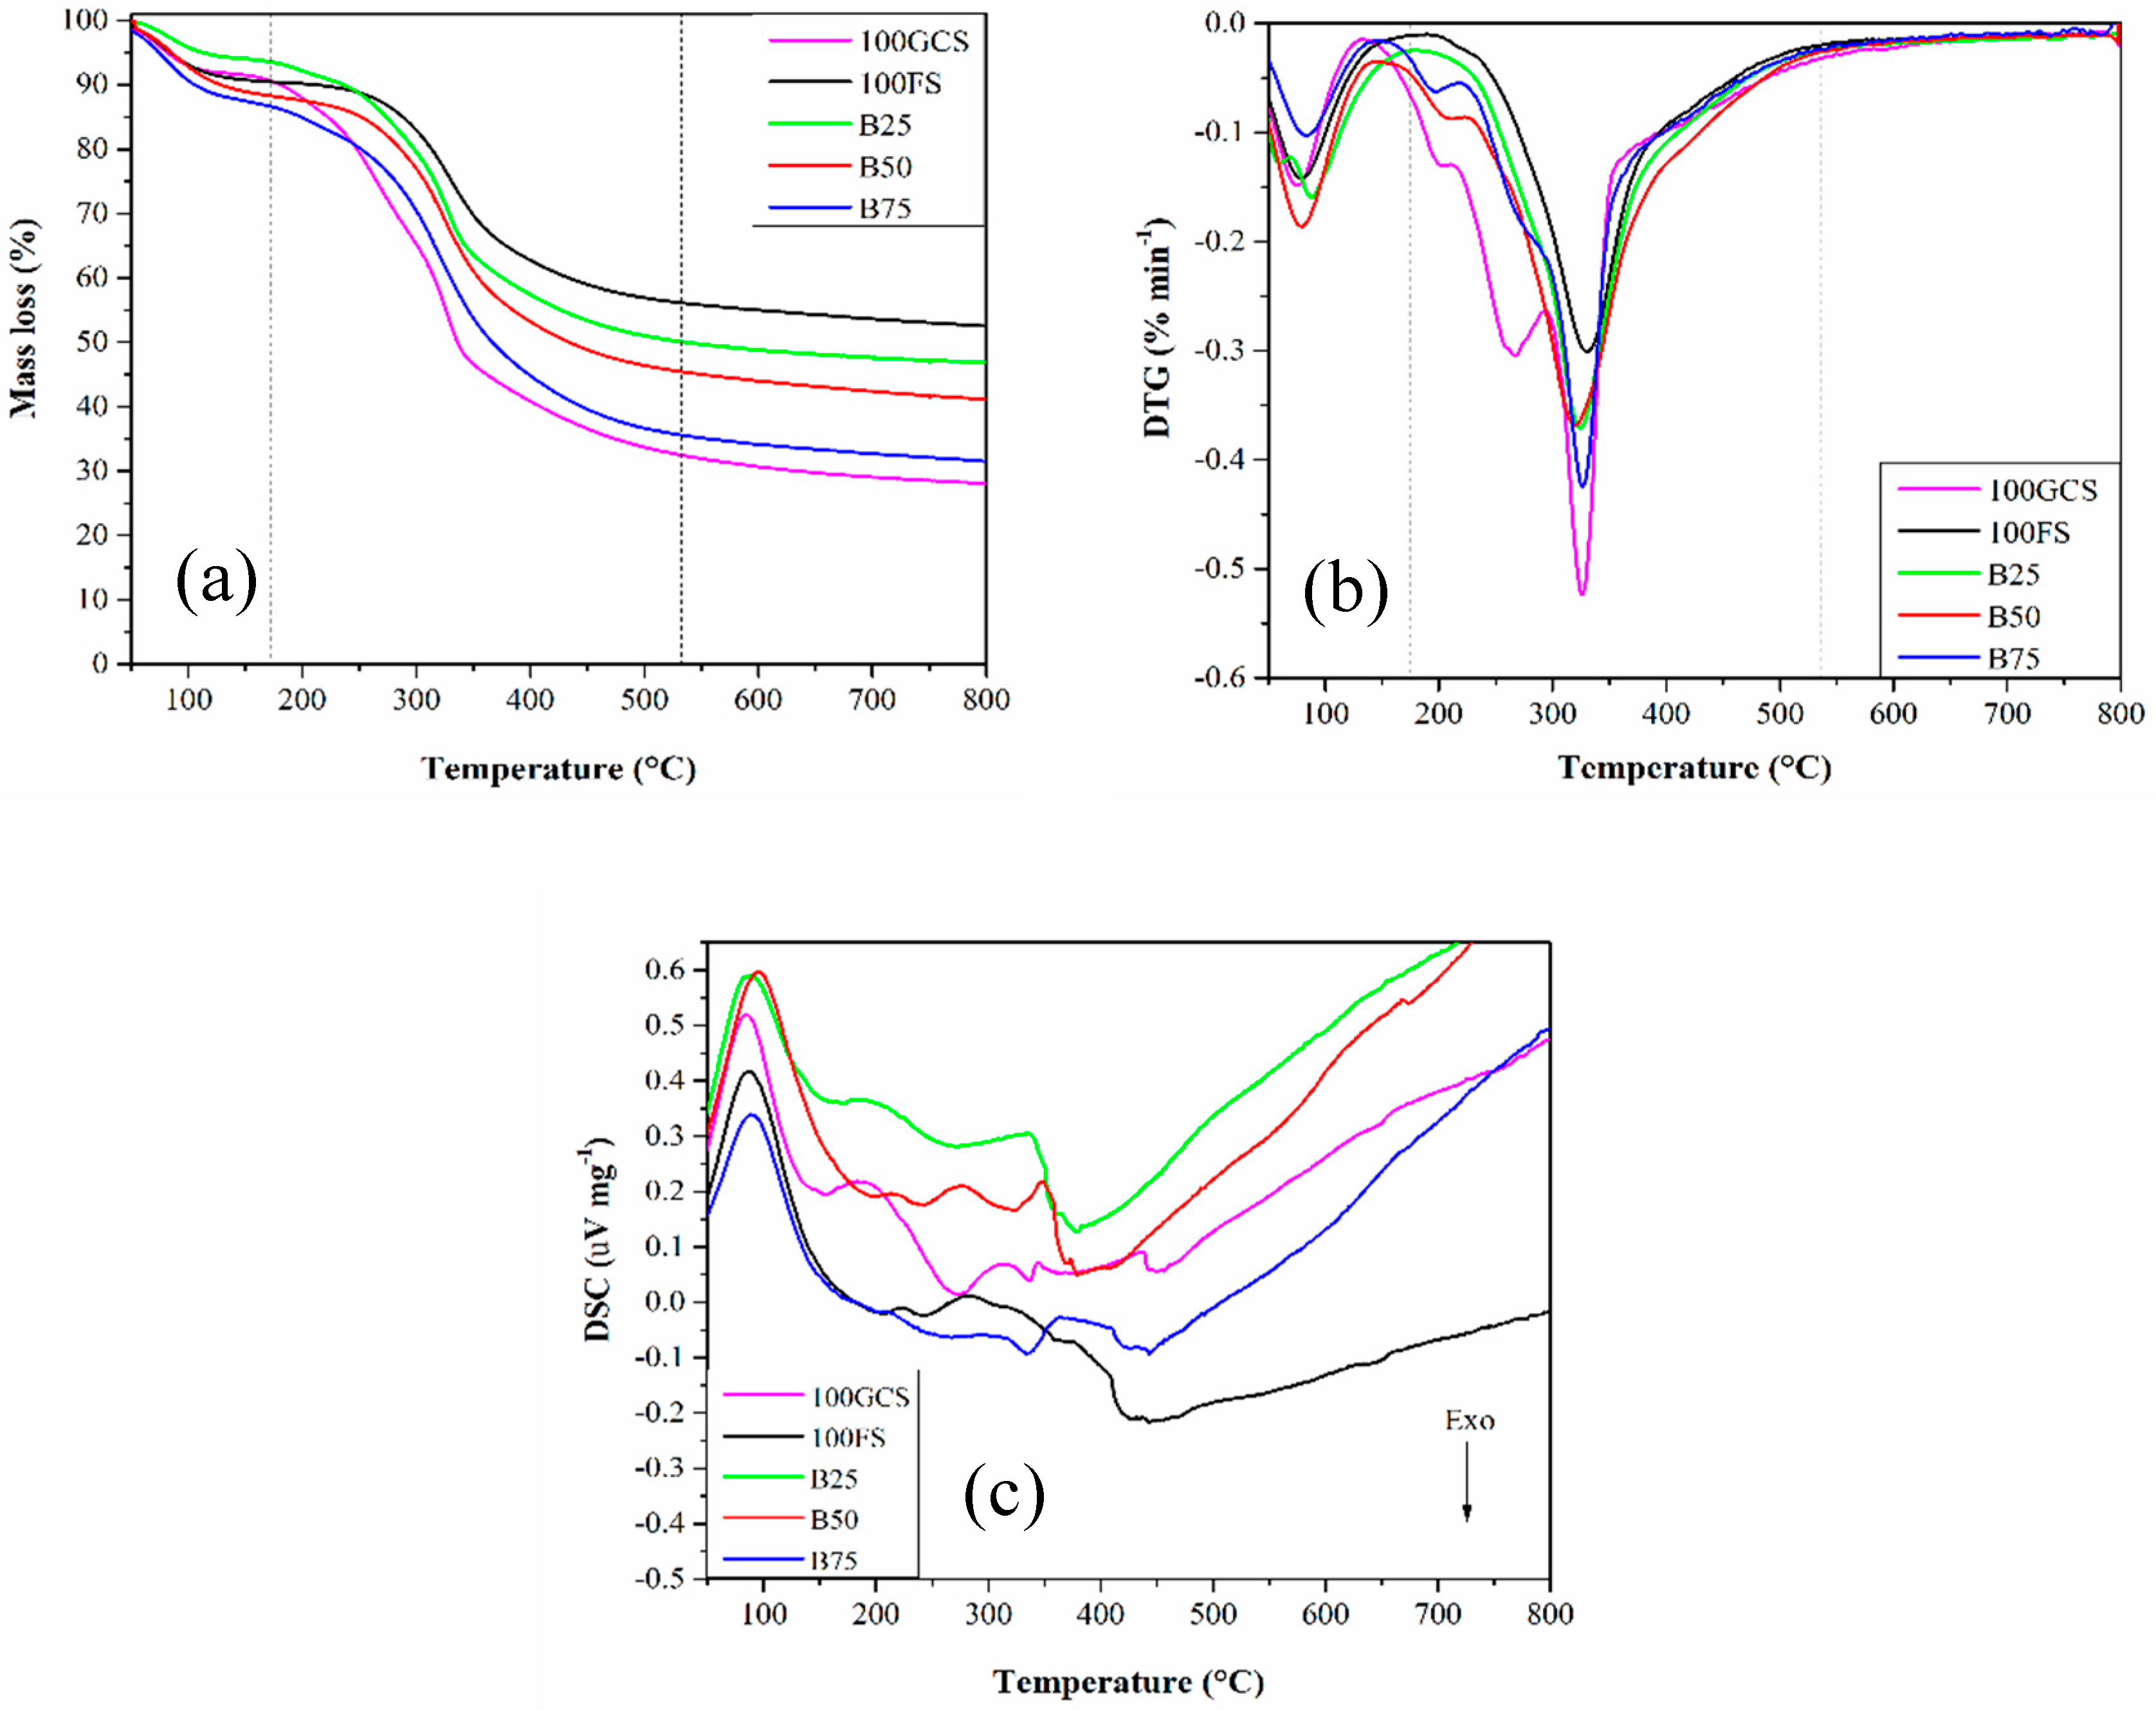
3.6. Thermal Analysis (TG/DTG and DSC)

Figure 7a–c and Table 5 and Table 6 show TG/DTG and DSC curves, loss mass, and thermal degradation rate for green coconut shells, fish scales, and blends under an inert atmosphere (argon 5.0). Initially, according to Figure 7a, three main stages of mass loss were observed in the following temperature ranges: (I) room temperature (≈25.0 °C) to 170.0 °C, (II) 170.0 to 530.0 °C, and (III) 530.0 to 800.0 °C.
The first stage (room temperature to 170.0 °C) was attributed to a release of moisture from the biomasses, with mass loss ranging from 5.78% (B25) to 12.91% (B75). Moisture has no energy content for the conversion of biomass, which is the energy required for removing the moisture dissipated in the thermoconversion process, i.e., an endothermic event [13,64,65]. According to Table 1, the pure samples and blends showed, on average, around 10.0% moisture content. The addition of fish scales to the mixture led to a reduction in its content.
The second stage (170.0 to 530.0 °C) corresponded to the thermal degradation of light-based volatile materials and elements such as hydrogen (H), oxygen (O), carbon monoxide (CO), carbohydrates, lipids, and proteins [66]. Mass loss ranged from 34.34% (100FS) to 59.02% (100GCS) and was reduced from 51.52% (B75) to 42.87% (B50) due to the addition of fish scales to the mixtures and the lower composition of volatile materials in relation to the green coconut shell sample (Table 1).
The third stage (530.0 to 800.0 °C) was related to the carbonization phase of the samples and the thermal decomposition of the residual lignin, which is important for the formation of components with high energy content [67]. The mass loss ranged between 3.26% (B25) and 4.47% (100CGS), and the highest values were achieved for samples with higher compositions of green coconut shells in the mixture. The residual mass after the evaporation and devolatilization steps refers to the content of fixed carbon/biochar and ash from the pyrolysis process since complete combustion of the samples does not occur [64]. The carbon present in the biomass was released in the form of volatile materials (condensable and non-condensable gases) during the formation of the main carbon-based compounds in the combustion process (e.g., monoxide (CO) and carbon dioxide (CO2)) [68].
The residual mass ranged from 28.06% (100GCS) to 52.55% (100FS), and the blends with the highest fish scale content showed the highest values, which may be related to the increase in the ash composition (Table 1). Figure 7b and Table 6 display the DTG curves and thermal degradation rates for green coconut shells, fish scales, and blends under an inert atmosphere. The first step shows a similar degradation rate for all samples, i.e., around 1.0% min−1, and peak temperature between 75.0 and 87.0 °C.
In the second stage, green coconut shells showed three main degradation peaks, namely, 200.0 °C and 1.29% min−1 degradation rate, 268.5 °C and 2.04% min−1, and 325.0 °C and 5.22% min−1—the highest degradation rate. According to Yang et al. [69], compounds based on hemicellulose, cellulose, and lignin present in most lignocellulosic biomasses are decomposed at 220.0–315.0 °C, 315.0–400.0 °C, and 160.0–900.0 °C, respectively. However, factors such as heating rate, sample mass, and heat transfer cause temperatures to change, justifying the occurrence of some biomass oxidation stages in the TG/DTG curves and confirming the results of this study [54].
Unlike 100GCS, B75 showed only two main degradation steps, with decomposition rates at 0.63 and 4.25% min−1, respectively. A “shoulder” was observed at around 280.0 °C, which might be the beginning of hemicellulose degradation, as reported by Jagtap and Kalbande [70]. B50 showed a main thermal degradation event at 320.5 °C and a 3.68% min−1 thermal degradation rate, which is lower than the one observed in the same temperature range for 100GCS and B75, in addition to a “shoulder” at approximately 212.0 °C. The lower number of decomposition peaks can be associated with the reduction in the amounts of hemicellulose, cellulose, and lignin in the samples due to a decrease in the composition of green coconut shells and an increase in the fish scales content.
B25 and F100 showed a main thermal degradation stage, with 324.5 and 331.5 °C peak temperatures and 3.71 and 3.01% min−1 degradation rate, respectively. An absence of shoulders was observed for 100GCS, B75, and B50 samples, confirming the reduction of lignocellulosic compounds, i.e., holocellulose decomposition. Fish scales showed the lowest degradation rate, indicating smaller quantities of organic compounds (mainly collagen fibers) compared to other samples [13,44]. No apparent decomposition peaks were observed in the DTG curves at temperatures above 450.0 °C.
The DSC curves (Figure 7c) for green coconut shells, fish scales, and blends under an inert atmosphere revealed the main thermal events associated with the degradation stages of the samples. Initially, an endothermic peak was observed in all samples between 83.0 and 94.0 °C, related to the evaporation process or moisture removal stage.
The main exothermic events occurred for 100GCS at 273 and 337.0 °C, B75 at 339.0 °C, and B50 at 241.0 and 321.0 °C, which can be associated with the energy released by the thermal degradation of hemicellulose, cellulose, and residual lignin, as observed in the DTG curves (Figure 7b) at similar temperatures.
B25, B50, and 100FS showed endothermic events with temperature peaks at 275.0, 291.0, 331.0, and 334.0 °C, respectively. Such energy absorption events may be related to the degradation of collagen and other more volatile proteins due to a greater quantity of fish scales in the mixtures. No peaks above 450.0 °C were identified (Figure 7b).
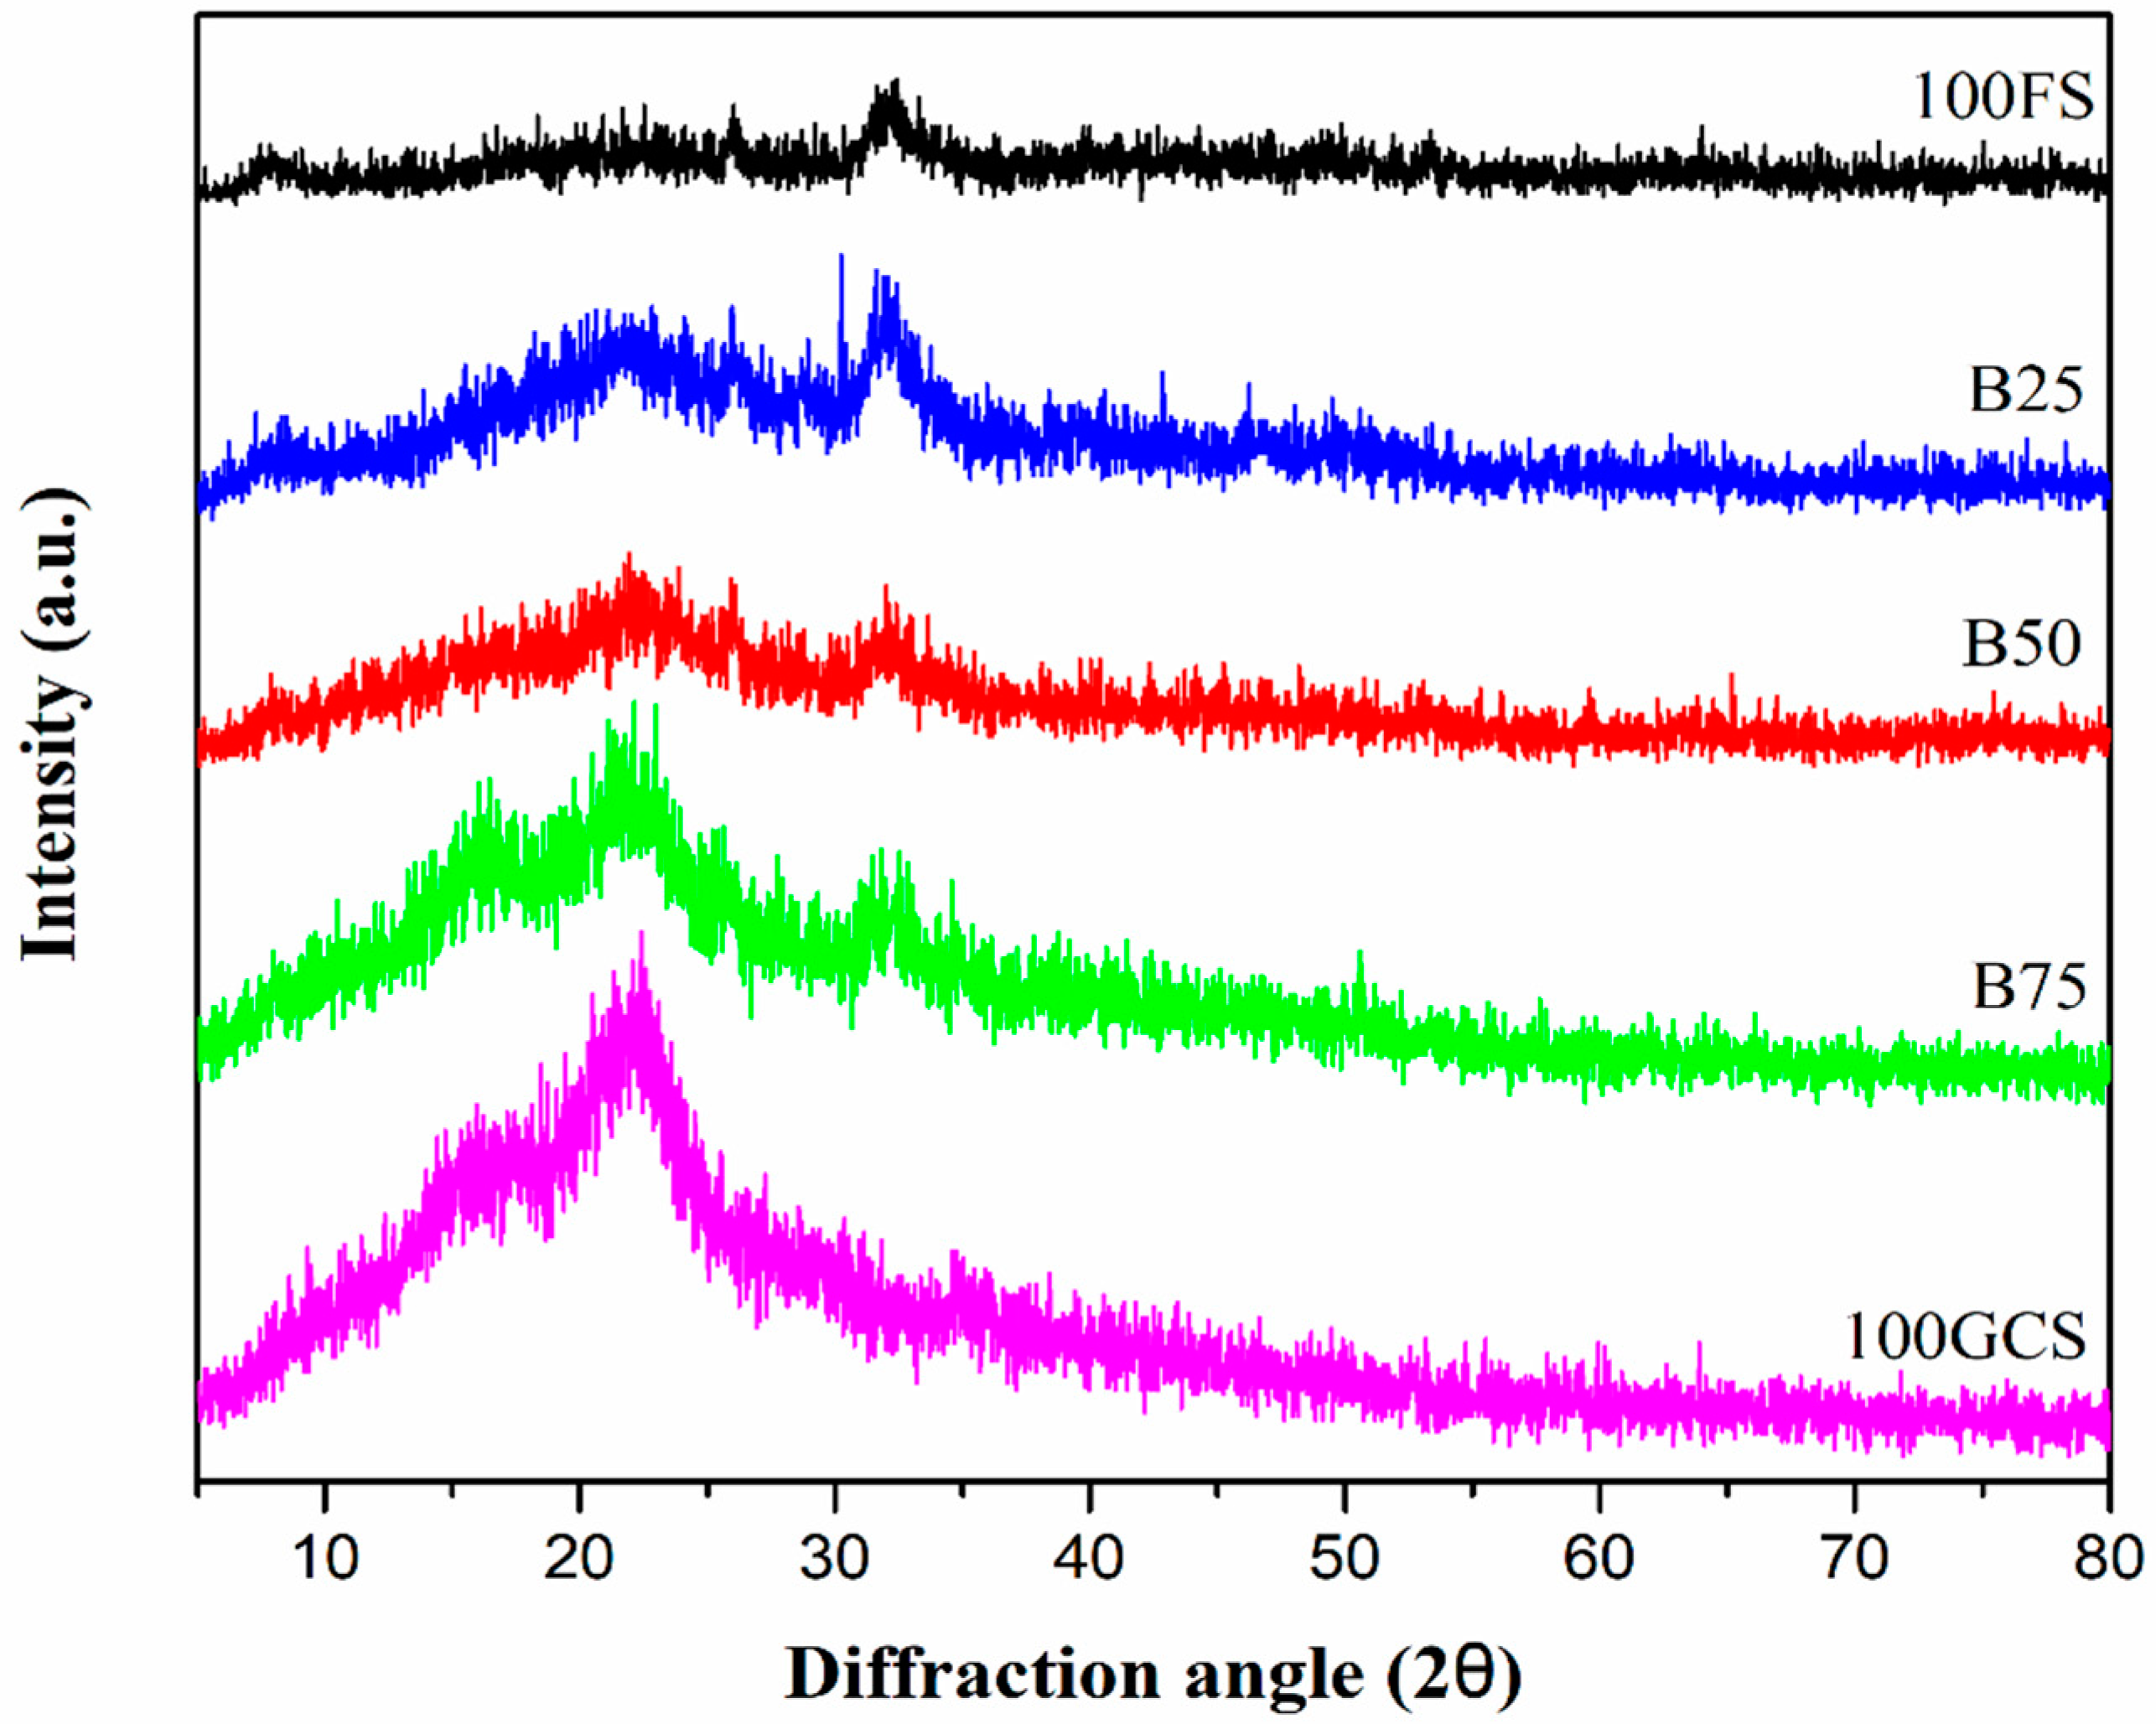
Finally, 100FS and 100GCS exhibited profitable energetic properties for direct combustion due to their amorphous structure, which provides high reactivity, suitable high heating values, and thermal performance [71].
Green coconut shells are often projected for the pyrolysis process [72,73,74]; however, fish scales showed higher thermal stability, and consequently, both residues presented similar functional groups. Their mixture can improve green coconut shells for biofuel production via pyrolysis.
However, in thermochemical systems, several factors must be considered for biomass application [75]. The 100GCS and 100FS samples displayed suitable properties, thus being able to balance the compositional aspects of fish scales, such as high amounts of nitrogen (12.11%) and moderate sulfur (0.35%) concentrations.

4. Conclusions

The bioenergy potential of the blend of green coconut shells and fish scales collected in São Luís-Maranhão State in Brazil was evaluated for the first time through heating values, ultimate and proximate analyses, thermal analysis, and estimation of gaseous emissions, considering the biomasses and their blends were subjected to an ideal burning process. The combustibility index was calculated by the relation between volatile matter and fixed carbon. According to the results, an increase in the proportion of fish scales in the blend impacts the index negatively, indicating better performance in the combustion processes of samples with a higher quantity of green coconut shells (75.0% and 100.0%). However, the parameters evaluated followed other residual biomasses already used as solid biofuels, indicating the properties of the blend in different proportions are suitable for its application as a bioenergy source. Their morphological and chemical characteristics were also studied and revealed irregular surfaces and apparent dispersion of the fibrous structures, lower crystallinity values when compared to other biomasses, which is favorable for thermochemical conversions since they help maintain the thermal reactivity of the flame, specific absorptions at infrared spectra, confirming the bioenergetic potential of the biomasses for application as a pulverized solid biofuel, and percentage of the main inorganic compounds, which are harmful elements to the combustion process regarding formation of oxides, hydroxides, and carbonates in thermal processes. According to the results, blends of green coconut shells and fish scales are appropriate as feedstocks for bioenergy production. The authors expect this research will effectively contribute to advances in the knowledge frontier in the biofuel field.

Author Contributions

A.P.R.M.: conceptualization, methodology, validation, formal analysis, investigation, and writing (original draft). A.V.S.S.: methodology, formal analysis, investigation, and textual analysis. M.S.M.: methodology, formal analysis, investigation, and writing (review and editing). J.B.S.d.S.: methodology, investigation, writing (review and editing), and textual analysis. R.R.P.G.: methodology, resources, writing (review and editing), and textual analysis. M.A.d.S.R.: resources, writing (review and editing), and textual analysis. W.A.B.: resources, writing (review and editing), and textual analysis. G.C.: conceptualization, methodology, investigation, resources, supervision, validation, writing (original draft/review and editing), and textual analysis. All authors have read and agreed to the published version of the manuscript.

Funding

This research was funded by Brazilian research funding agencies FAPEMA (Maranhão Foundation for Scientific Research and Development—Processes No. 01657/20, 04081/21, 04085/21, 02659/21, 01661/21, and 06776/22) and CAPES (Coordination for Support and Improvement of Higher Education—Process No. 88887.510222/2020-00).

Data Availability Statement

Data are contained within the article.

Acknowledgments

Authors are indebted to the professional and technical support from the Federal University of Maranhão, Federal Institute of Maranhão, State University of Campinas, Federal University Rural of Pernambuco, and Federal University of Ceará.

Conflicts of Interest

The authors declare no conflicts of interest.

References

  1. Andrade, H.J. Reverse logistics and solid waste: Challenges for the national waste policy (PNRS) in Brazil. In Handbook of Research on Supply Chain Management for Sustainable Development; IGI Global: Hershey, PA, USA, 2018; pp. 282–304. [Google Scholar]
  2. Nema, A.; Zacharia, K.M.B.; Kumar, A.; Singh, E.; Varma, V.S.; Sharma, D. Challenges and opportunities associated with municipal solid waste management. Curr. Dev. Biotechnol. Bioeng. 2021, 231–258. [Google Scholar] [CrossRef]
  3. Camargo, F.P.; Rabelo, C.A.; Duarte, I.C.; Silva, E.L.; Varesche, M.B.A. Biogas from lignocellulosic feedstock: A review on the main pretreatments, inocula and operational variables involved in anaerobic reactor efficiency. Int. J. Hydrogen Energy 2023, 48, 20613–20632. [Google Scholar] [CrossRef]
  4. Nunes, L.A.; Silva, M.L.; Gerber, J.Z.; Kalid, R.D.A. Waste green coconut shells: Diagnosis of the disposal and applications for use in other products. J. Clean. Prod. 2020, 255, 120169. [Google Scholar] [CrossRef]
  5. Ahmann, C. Waste to energy: Garbage prospects and subjunctive politics in late-industrial Baltimore. Am. Ethnol. 2019, 46, 328–342. [Google Scholar] [CrossRef]
  6. Guimarães, M.G.; Evaristo, R.B.W.; Mendonça-Brasil, A.C.; Ghesti, G.F. Green energy technology from buriti (Mauritia flexuosa L.) for Brazilian agroextractive communities. SN Appl. Sci. 2021, 3, 283. [Google Scholar] [CrossRef]
  7. Ahmad, R.K.; Sulaiman, S.A.; Yusup, S.; Dol, S.S.; Inayat, M.; Umar, H.A. Exploring the potential of coconut shell biomass for charcoal production. Ain Shams Eng. J. 2022, 13, 101499. [Google Scholar] [CrossRef]
  8. Bot, B.V.; Sosso, O.T.; Tamba, J.G.; Lekane, E.; Bikai, J.; Ndame, M.K. Preparation and characterization of biomass briquettes made from banana peels, sugarcane bagasse, coconut shells and rattan waste. Biomass Convers. Biorefinery 2023, 13, 7937–7946. [Google Scholar] [CrossRef]
  9. Inayat, M.; Sulaiman, S.A.; Naz, M.Y. Thermochemical characterization of oil palm fronds, coconut shells, and wood as a fuel for heat and power generation. MATEC Web Conf. 2018, 225, 01008. [Google Scholar] [CrossRef]
  10. Valenti, W.C.; Barros, H.P.; Moraes-Valenti, P.; Bueno, G.W.; Cavalli, O.R. Aquaculture in Brazil: Past, present and future. Aquac. Rep. 2021, 19, 100611. [Google Scholar] [CrossRef]
  11. Ribeiro, V.S.; Pedroza-Filho, M.X. Regional analysis of aquaculture value chain: Study of tilapia production zones in Brazil. Aquaculture 2022, 551, 737948. [Google Scholar] [CrossRef]
  12. Pinheiro, L.; Rodrigues Ximenes Neto, A.; Aquino Bezerra Filho, F.A.; Rosane Silveira Pinto, C.; de Souza Pinheiro, L.; Pessoa, P.; Lima Filho, R.; Balbino da Silva, R.; Morais, J.; Gorayeb, A.; et al. Seascape ethnomapping on the inner Continental shelf of the Brazilian semiarid coast. Water 2023, 15, 798. [Google Scholar] [CrossRef]
  13. Silva, A.V.S.; Torquato, L.D.M.; Cruz, G. Potential application of fish scales as feedstock in thermochemical processes for the clean energy generation. Waste Manag. 2019, 100, 91–100. [Google Scholar] [CrossRef]
  14. Rodionova, M.V. Biofuel production: Challenges and opportunities. Int. J. Hydrogen Energy 2017, 42, 8450–8461. [Google Scholar] [CrossRef]
  15. Molino, A.; Larocca, V.; Chianese, S.; Musmarra, D. Biofuels production by biomass gasification: A review. Energies 2018, 11, 811. [Google Scholar] [CrossRef]
  16. Karim, M.R.; Bhuiyan, A.A.; Naser, J. Effect of recycled flue gas ratios for pellet type biomass combustion in a packed bed furnace. Int. J. Heat Mass Transf. 2018, 120, 1031–1043. [Google Scholar] [CrossRef]
  17. Karim, M.R.; Bhuiyan, A.A.; Sarhan, A.A.R.; Naser, J. CFD simulation of biomass thermal conversion under air/oxy-fuel conditions in a reciprocating grate boiler. Renew. Energy 2020, 146, 1416–1428. [Google Scholar] [CrossRef]
  18. Santos, J. Thermochemical conversion of agricultural wastes applying different reforming temperatures. Fuel Process. Technol. 2020, 203, 106402. [Google Scholar] [CrossRef]
  19. Variny, M.; Varga, A.; Rimár, M.; Janošovský, J.; Kisek, J.; Lukác, L.; Jablonský, G.; Mierka, O. Advances in biomass co-combustion with fossil fuels in the European context: A review. Processes 2021, 9, 100. [Google Scholar] [CrossRef]
  20. Vasileiadou, A.; Zoras, S.; Dimoudi, A. A comprehensive experimental study of municipal solid waste (MSW) as solid biofuel and as composite solid fuel in blends with lignite: Quality characteristics, environmental impact, modeling, and energy cover. Energy Ecol. Environ. 2023, 8, 211–240. [Google Scholar] [CrossRef]
  21. Vasileiadou, A.; Zoras, S.; Iordanidis, A. Fuel Quality Index and Fuel Quality Label: Two versatile tools for the objective evaluation of biomass/wastes with application in sustainable energy practices. Environ. Technol. Innov. 2021, 23, 101739. [Google Scholar] [CrossRef]
  22. Rocha, S.; Candia, O.; Valdebenito, F.; Espinoza-Monje, J.F.; Azócar, L. Biomass Quality Index: Searching for suitable biomass as an energy source in Chile. Fuel 2020, 264, 116820. [Google Scholar] [CrossRef]
  23. EN ISO 16948; Solid Biofuels—Determination of Total Content of Carbon, Hydrogen and Nitrogen. European Standard: Brussels, Belgium, 2015.
  24. Silva, A.; Mortari, D.A.; Cruz, G. Theoretical study from gaseous emissions generated by fish scales under stoichiometric combustion processes. In Proceedings of the 18th Brazilian Congress of Thermal Sciences and Engineering, Online, 16–20 November 2020; ABCM: Aplington, IA, USA, 2020. [Google Scholar]
  25. Silva, A.; Mortari, D.A.; Pereira, F.M.; Cruz, G. Assessment of the fish scales and coal blends combustion in a Drop Tube Furnace (DTF). In Proceedings of the 26th International Congress of Mechanical Engineering, Virtual Conference, 22–26 November 2021; ABCM: Aplington, IA, USA, 2021. [Google Scholar]
  26. Coelho, P.; Costa, M. Combustão; Orion: London, UK, 2007. [Google Scholar]
  27. Paraschiv, L.S.; Serban, A.; Paraschiv, S. Calculation of combustion air required for burning solid fuels (coal/biomass/solid waste) and analysis of flue gas composition. Energy Rep. 2020, 6, 36–45. [Google Scholar] [CrossRef]
  28. Torquato, L.D.M.; Crnkovic, P.M.; Ribeiro, C.A.; Crespi, M.S. New approach for proximate analysis by thermogravimetry using CO2 atmosphere: Validation and application to different biomasses. J. Therm. Anal. Calorim. 2017, 128, 1–14. [Google Scholar] [CrossRef]
  29. Gonzales, A.F.R.; Montes, C.F. Valorización de resíduos de frutas para combustión y pirólisis. Rev. Politécnica 2019, 28, 42–53. [Google Scholar] [CrossRef]
  30. ASTM E711; Standard Test Method for Gross Calorific Value of Refuse—Derived Fuel by the Bomb Calorimeter. American Society for Testing and Materials: West Conshohocken, PA, USA, 1987.
  31. NBR 8633; Carvão Vegetal—Determinação do Poder Calorífico. ABNT (Associação Brasileira de Normas Técnicas): Sao Paulo, Brazil, 1984.
  32. Petricoski, S.M. Briquettes produced with a mixture of urban pruning waste, glycerin and cassava processing residue. J. Agric. Sci. 2020, 12, 158. [Google Scholar] [CrossRef]
  33. ASTM E2809-22; Standard Guide for Using Scanning Electron Microscopy/Energy Dispersive X-ray Spectroscopy (SEM/EDS) in Forensic Polymer Examinations. American Society for Testing and Materials: West Conshohocken, PA, USA, 2022.
  34. ASTM E1508-12a; Standard Guide for Quantitative Analysis by Energy-Dispersive Spectroscopy. American Society for Testing and Materials: West Conshohocken, PA, USA, 2019.
  35. Xu, F.; Shi, Y.; Wang, D. X-ray scattering studies of lignocellulosic biomass: A review. Carbohydr. Polym. 2013, 94, 904–917. [Google Scholar] [CrossRef]
  36. ASTM E3294-22; Standard Guide for Forensic Analysis of Geological Materials by Powder X-ray Diffraction. American Society for Testing and Materials: West Conshohocken, PA, USA, 2022.
  37. ASTM E1252; FTIR Analysis Testing Services. American Society for Testing and Materials: West Conshohocken, PA, USA, 2021.
  38. Cruz, G.; Silva, A.V.S.; Da Silva, J.B.S.; Caldeiras, R.N.; Souza, M.E.P. Biofuels from oilseed fruits using different thermochemical processes: Opportunities and challenges. Biofuels Bioprod. Biorefin. 2020, 14, 696–719. [Google Scholar] [CrossRef]
  39. Santana-Junior, C.C.; Brito, M.R.; Barbosa, L.N.; Jaconi, A.; Rambo, M.K.D.; Rambo, M.C.D. Environmental-economic assessment of lignocellulosic residual from the Legal Amazon for conversion in biochars and bioproducts for biorefineries. Int. J. Adv. Eng. Res. Sci. 2020, 7, 324–337. [Google Scholar] [CrossRef]
  40. Yao, B.Y.; Changkook, R.; Adela, K.; Yates, N.E.; Sharifi, V.N.; Swithenbank, J. Effect of fuel properties on biomass combustion. Modelling approach identification of the controlling factors. Fuel 2005, 84, 2116–2130. [Google Scholar]
  41. Garcia, R. Characterization of Spanish biomass wastes for energy use. Bioresour. Technol. 2012, 13, 249–258. [Google Scholar] [CrossRef]
  42. Da Silva, J.B.S.; Ferreira, J.R.; Cruz, G. Investigation of the bioenergetic potential of soybean husks for use in thermochemical process by physicochemical and morphological analysis. In Proceedings of the 19th Brazilian Congress of Thermal Sciences and Engineering, Bento Gonçalves, Brazil, 6–10 November 2022. [Google Scholar]
  43. Rasam, S.; Haghighi, A.M.; Azizi, K.; Verdugo, A.S.; Moraveji, M.K. Thermal behavior, thermodynamics and kinetics of copyrolysis of binary and ternary mixtures of biomass through thermogravimetric analysis. Fuel 2020, 280, 118665. [Google Scholar] [CrossRef]
  44. Cruz, G.; Crnkovic, P.M. Analysis of the gaseous emissions and the residues generated under oxy-fuel combustion of biomasses in a drop tube furnace (DTF). J. Eng. Res. Rep. 2020, 11, 25–40. [Google Scholar] [CrossRef]
  45. Rusch, F.; Neto, R.D.A.; De Moraes, D.L.; Hillig, E. Energy properties of bamboo biomass and mate co-products. SN Appl. Sci. 2021, 3, 602. [Google Scholar] [CrossRef]
  46. Bizzo, W.A.; Lenço, P.C.; Carvalho, D.J.; Veiga, J.P.S. The generation of residual biomass during the production of bio-ethanol from sugarcane, its characterization and its use in energy production. Renew. Sustain. Energy Rev. 2014, 29, 589–603. [Google Scholar] [CrossRef]
  47. Pena-Vergara, G.; Castro, L.R.; Gasparetto, C.A.; Bizzo, W.A. Energy from planted forest and its residues characterization in Brazil. Energy 2022, 239, 122243. [Google Scholar] [CrossRef]
  48. Kluska, J.; Ochnio, M.; Kardaś, D. Carbonization of corncobs for the preparation of barbecue charcoal and combustion characteristics of corncob char. Waste Manag. 2020, 105, 560–565. [Google Scholar] [CrossRef] [PubMed]
  49. Silva, A.V.S. Investigation of the combustion process of fish scales from Northeast Brazil in a drop tube furnace (DTF). Environ. Sci. Pollut. Res. 2022, 29, 67270–67286. [Google Scholar] [CrossRef] [PubMed]
  50. Nozela, W.C.; Braz, C.E.M.; Almeida, S. Kinetic Study of the energetic reuse from torriefied sewage slugde and urban pruning blends. J. Therm. Anal. Calorim. 2018, 134, 131–765. [Google Scholar] [CrossRef]
  51. Pehlivan, E. Non-catalytic and catalytic conversion of fruit waste to synthetic liquid fuel via pyrolysis. Processes 2023, 11, 2536. [Google Scholar] [CrossRef]
  52. Cruz, G.; Rodrigues, A.L.P.; Da Silva, D.F.; Gomes, W.C. Physical–chemical characterization and thermal behavior of cassava harvest waste for application in thermochemical processes. J. Therm. Anal. Calorim. 2020, 143, 3611–3622. [Google Scholar] [CrossRef]
  53. Nóbrega, C.R.E.S.; Silva, J.B.S.; Monteiro, T.O.; Crnkovic, P.M.; Cruz, G. An investigation on the kinetic behavior and thermodynamic parameters of the oxy-fuel combustion of Brazilian agroindustrial residues. J. Braz. Soc. Mech. Sci. Eng. 2023, 45, 65. [Google Scholar] [CrossRef]
  54. Santos, E.B. Characterization of the piau fish (Leporinus elongatus) scales and their application to remove Cu (II) from aqueous solutions. Quím. Nova 2009, 32, 134–138. [Google Scholar] [CrossRef]
  55. Rastrogi, A.; Jha, M.K.; Sarma, A.K. A comparative study of kinetics for combustion versus pyrolysis of Mesua ferrea husk, soya husk, and Jatropha curcas husk using thermogravimetry and different methods. Energy Sources Part A Recovery Util. Environ. Eff. 2016, 38, 1355–1363. [Google Scholar]
  56. Cruz, G.; Crnkovic, P.M. Assessment of the physico-chemical properties of residues and emissions generated by biomasses combustion under N2/O2 and CO2/O2 atmospheres in a Drop Tube Furnace (DTF). J. Therm. Anal. Calorim. 2019, 138, 401–415. [Google Scholar] [CrossRef]
  57. Ibrahim, H.; Hebriyah, R. Fundamentals of Torrefaction of Biomass and Its Environmental Impacts; University of Leeds: Leeds, UK, 2014. [Google Scholar]
  58. Amorim, M.O.; Sales Junior, J.C.C.; Ruiz, Y.L.; Andrade, J.C.S. Synthesis and characterization of niobium-doped fish scale-derived hydroxyapatite by physical ultrasound interference. Cerâmica 2021, 67, 23–27. [Google Scholar] [CrossRef]
  59. Cruz, G.; Braz, C.E.M.; Ávila, I.; Crnkovic, P.M. Physical-chemical properties of Brazilian biomasses: Potential applications as renewable energy source. Afr. J. Biotechnol. 2018, 17, 1–19. [Google Scholar]
  60. Oliveira, L.S.; Silva, A.V.S.; Conconi, C.C.; Gomes, E.B.; Bizzo, W.A.; Cruz, G. Thermal degradation of açaí seeds and potential application in thermochemical processes. Prod. J. Dev. 2021, 7, 1–18. [Google Scholar] [CrossRef]
  61. Seikh, A.H.; Alharbi, H.F.; Alnaser, I.A.; Karim, M.R.; Mohammed, J.A.; Aijaz, M.O.; Hassan, A.; Abdo, H.S. Study on process parameters in hydrothermal liquefaction of rice straw and cow dung: Product distribution and application of biochar in wastewater treatment. Processes 2023, 11, 2779. [Google Scholar] [CrossRef]
  62. González-Arias, J.; Sánchez, M.E.; Martínez, E.J.; Covalski, C.; Alonso-Simón, A.; González, R.; Cara-Jiménez, J. Hydrothermal carbonization of olive tree pruning as a sustainable way for improving biomass energy potential: Effect of reaction parameters on fuel properties. Processes 2020, 8, 1201. [Google Scholar] [CrossRef]
  63. Stuart, B. Infrared Spectroscopy: Fundamentals and Applications; John Wiley & Sons: Chichester, UK, 2004. [Google Scholar]
  64. Da Silva, J.B.S.; Torquato, L.D.M.; Crnkovic, P.M.; Cruz, G. Investigation of the urban pruning wastes as biofuels and possible utilization in thermal systems. Braz. J. Dev. 2021, 7, 24730–24750. [Google Scholar] [CrossRef]
  65. Caillat, S.; Vakkilainen, E. Large-scale biomass combustion plants: An overview. In Biomass Combustion Science, Technology and Engineering; Woodhead Publishing: Sawston, UK, 2013; pp. 189–224. [Google Scholar] [CrossRef]
  66. Rodrigues, S.; Da Silva, A.; De Carvalho, L. Morphological, structural, thermal properties of a native starch obtained from babassu mesocarp for food packaging application. J. Mater. Res. Technol. 2020, 9, 15670–15678. [Google Scholar] [CrossRef]
  67. Tripathi, V.; Edrisi, S.A.; Abhilash, P.C. Towards the coupling of phytoremediation with bioenergy production. Renew. Sustain. Energy Rev. 2016, 57, 1386–1389. [Google Scholar] [CrossRef]
  68. Sarkar, D. Thermal Power Plant: Design and Operation; Elsevier: Amsterdam, The Netherlands, 2015. [Google Scholar]
  69. Yang, H. Characteristics of pyrolysis of hemicellulose, cellulose, and lignin. Fuel 2007, 86, 1781–1788. [Google Scholar] [CrossRef]
  70. Jagtap, A.; Kalbande, S. Influence of model free methods on pyrolysis kinetics and thermodynamic parameters of soybean straw. Res. Sq. 2021. [Google Scholar] [CrossRef]
  71. Martinez, C.L.M.; Rocha, E.P.A.; Carneiro, A.C.O.; Gomes, F.J.B.; Batalha, L.A.R.; Vakkilainen, E.; Cardoso, M. Characterization of residual biomasses from the coffee production chain and assessment the potential for energy purposes. Biomass Bioenergy 2019, 120, 68–76. [Google Scholar] [CrossRef]
  72. Shivakumar, R.; Maitra, S. Evaluation of pore size and surface morphology during devolatilization of coconut fiber and sugarcane bagasse. Combust. Sci. Technol. 2019, 192, 2326–2344. [Google Scholar]
  73. Singh, P.; Dubey, P.; Younis, K.; Yousuf, O. A review on the valorization of coconut shell waste. Biomass Convers. Biorefinery 2022, 14, 8115–8125. [Google Scholar] [CrossRef]
  74. Gadelha, A.M.T.; Almeida, F.D.L.; Silva, R.A.; Malveira, J.Q.; Lopes, A.A.S.; Rios, M.A.S. Cashew nut husk and babassu coconut husk residues: Evaluation of their energetic properties. Energy Sources Part A Recovery Util. Environ. Eff. 2019, 1–9. [Google Scholar] [CrossRef]
  75. Al-Ayed, O.; Saadeh, W. Approaches to biomass kinetic modelling: Thermochemical biomass conversion processes. Jordanian J. Eng. Chem. Ind. 2021, 4, 1–13. [Google Scholar]
Figure 1. Samples preparation stage: (1) in natura samples (green coconut shells and fish scales), (2) running water, (3) drying oven, (4) knife and hammer mill, (5) sieves (ASTM series), and (6) average particle size.
Processes 12 00710 g001
Figure 2. Potential gaseous emissions under stoichiometric conditions for green coconut shells, fish scales, and blends in absolute values.
Processes 12 00710 g002
Figure 3. SEM micrographics for pure samples and blends and different amplitudes: (a) 100GCS—60×; (b) B75—60×; (c) B50—60×; (d) B25—60×; (e) 100FS—60×; (f) 100GCS—500×; (g) B75—250×; (h) B50—250×; (i) B25—250×; and (j) 100FS—500×.
Processes 12 00710 g003
Figure 4. X-ray diffractograms of fish scales, green coconut shell samples, and blends.
Processes 12 00710 g004
Figure 5. FTIR spectra for green coconut shells, fish scales, and blends.
Processes 12 00710 g005
Figure 6. Percentage of the main oxides formed in green coconut shells, fish scales, and their blends.
Processes 12 00710 g006
Figure 7. (a) TG, (b) DTG, and (c) DSC curves for green coconut shells, fish scales, and blends under an inert atmosphere (argon 5.0), 10 °C min−1 heating rate, and 100 mL min−1 dynamic flow rate.
Processes 12 00710 g007
Table 1. Ultimate, proximate, and calorific analyses of in natura samples (100% green coconut shell and 100% fish scales) and blends in different proportions (75, 50, and 25%).
Samples100GCSB75B50B25100FS
Ultimate analysis (%)
Carbon42.87 ± 1.1438.61 ± 1.1536.20 ± 1.1632.61 ± 1.1328.18 ± 2.04
Hydrogen5.08 ± 0.124.82 ± 0.134.70 ± 0.134.70 ± 0.144.31 ± 0.27
Oxygen51.24 ± 1.1152.38 ± 0.1252.68 ± 1.0253.47 ± 1.0154.69 ± 0.98
Nitrogen0.79 ± 0.263.80 ± 0.176.35 ± 0.238.90 ± 0.1612.11 ± 0.64
Sulfur0.02 ± 0.020.09 ± 0.010.17 ± 0.030.32 ± 0.030.35 ± 0.06
Minimum formulaC3.57H5.04O3.20 C3.21H4.78O3.29C3.01H4.66O3.29C2.71H4.66O3.34C2.35H4.31O3.42 N0.86S0.01
N0.06S0.001N0.27S0.002N0.45S0.005N0.63S0.01
Proximate analysis (%), dry basis
Moisture9.44 ± 0.188.03 ± 0.096.62 ± 0.225.21 ± 0.203.80 ± 0.17
Volatile material 92.40 ± 0.2086.64 ± 0.0779.33 ± 0.8773.09 ± 0.8067.03 ± 0.78
Fixed carbon 6.59 ± 0.045.82 ± 0.086.79 ± 1.006.89 ± 0.876.98 ± 0.92
Ash 1.00 ± 0.037.55 ± 0.0613.88 ± 0.0920.02 ± 0.9126.00 ± 0.46
Combustibility index *
CI14.0214.8911.6810.619.60
Heating value or Energy potential (MJ kg−1)
HHV16.64 ± 0.0715.80 ± 0.1814.98 ± 0.1414.16 ± 0.0413.03 ± 0.03
LHV14.33 ± 0.0914.27 ± 0.2014.25 ± 0.1713.12 ± 0.0612.15 ± 0.06
* Dimensionless index; HHV—Higher Heating Value and LHV—Lower Heating Value.
Table 2. Potential gaseous emissions (CO2, SO2, and NO), air mass requirement, and air–fuel ratio for green coconut shells, fish scales, and blends obtained under stoichiometry conditions.
SamplesCO2 (%)SO2 (ppm)NO (ppm)Air Mass (kg)Air–Fuel Ratio
100GCS22.43393543448.924.49:1
B7522.2119418,736401.434.01:1
B5021.6538132,558381.733.82:1
B2520.9977249,093349.983.50:1
100FS20.7096376,233296.552.97:1
B75 = 25% fish scales + 75% green coconut shells, B50 = 50% fish scales + 50% green coconut shells, and B25 = 75% fish scales + 25% green coconut shells.
Table 3. Main functional groups and wavelengths for green coconut shells, fish scales, and blends.
Functional GroupsWavenumbers (cm−1)
100GCSB75B50B25100FS
NH33053307331133123309
OH33273329332633313330
C-H29222941294529502962
C=O17371739174017411742
C=C16581657165916601670
C-O12471245124412481250
C-N11601162116111581157
Table 4. Percentage of the main inorganic and metallic compounds for the green coconut shells, fish scales, and blends.
100GCSB75B50B25100FS
C55.13 ± 1.0254.67 ± 0.6155.05 ± 1.2152.46 ± 2.8047.01 ± 3.93
O40.88 ± 0.8940.23 ± 1.1235.95 ± 2.7233.07 ± 2.1442.67 ± 2.76
Na0.21 ± 0.060.22 ± 0.010.18 ± 0.060.18 ± 0.030.23 ± 0.05
Mg0.16 ± 0.030.19 ± 0.030.12 ± 0.060.18 ± 0.020.20 ± 0.06
Si0.64 ± 0.270.21 ± 0.100.16 ± 0.050.02 ± 0.04n.d.
Pn.d.0.51 ± 0.081.82 ± 0.613.49 ± 1.434.24 ± 0.89
Aln.d.n.d.n.d.n.d.0.12 ± 0.02
Sn.d.0.11 ± 0.050.24 ± 0.110.33 ± 0.050.36 ± 0.01
Cl1.34 ± 0.291.22 ± 0.180.92 ± 0.260.78 ± 0.16n.d.
K1.68 ± 0.261.58 ± 0.141.03 ± 0.350.97 ± 0.290.73 ± 0.45
Ca0.15 ± 0.081.07 ± 0.234.53 ± 1.688.51 ± 3.928.91 ± 1.48
n.d.—Not detected or below the detection limit of the equipment.
Table 5. Mass losses for green coconut shells, fish scales, and blends under an inert atmosphere.
Samples100GCSB75B50B25100FS
EventsMass Losses (%)
First stage8.4512.9111.615.789.54
Second stage59.0251.5242.8744.0534.34
Third stage4.474.054.383.263.57
Residual mass28.0631.5241.1446.9152.55
Table 6. Thermal degradation steps and degradation rate for green coconut shells, fish scales, and blends under an inert atmosphere.
SamplesPeak Temperatures (°C)Degradation Rates (% min−1)
100GCS75.01.48
200.01.29
268.52.04
325.05.22
B7582.01.02
196.50.63
326.54.25
B5079.01.86
320.53.68
B2587.01.59
324.53.71
100FS79.51.42
331.53.01
Disclaimer/Publisher’s Note: The statements, opinions and data contained in all publications are solely those of the individual author(s) and contributor(s) and not of MDPI and/or the editor(s). MDPI and/or the editor(s) disclaim responsibility for any injury to people or property resulting from any ideas, methods, instructions or products referred to in the content.

