Article

Coupled Oxygen-Enriched Combustion in Cement Industry CO2 Capture System: Process Modeling and Exergy Analysis

Department of Chemical Engineering, School of Chemistry, Chemical Engineering and Life Sciences, Wuhan University of Technology, Wuhan 430070, China
*
Author to whom correspondence should be addressed.
Processes 2024, 12(4), 645; https://doi.org/10.3390/pr12040645
Submission received: 23 February 2024 / Revised: 20 March 2024 / Accepted: 20 March 2024 / Published: 24 March 2024
(This article belongs to the Topic CO2 Capture and Renewable Energy)

Abstract

:
The cement industry is regarded as one of the primary producers of world carbon emissions; hence, lowering its carbon emissions is vital for fostering the development of a low-carbon economy. Carbon capture, utilization, and storage (CCUS) technologies play significant roles in sectors dominated by fossil energy. This study aimed to address issues such as high exhaust gas volume, low CO2 concentration, high pollutant content, and difficulty in carbon capture during cement production by combining traditional cement production processes with cryogenic air separation technology and CO2 purification and compression technology. Aspen Plus® was used to create the production model in its entirety, and a sensitivity analysis was conducted on pertinent production parameters. The findings demonstrate that linking the oxygen-enriched combustion process with the cement manufacturing process may decrease the exhaust gas flow by 54.62%, raise the CO2 mass fraction to 94.83%, cut coal usage by 30%, and considerably enhance energy utilization efficiency. An exergy analysis showed that the exergy efficiency of the complete kiln system was risen by 17.56% compared to typical manufacturing procedures. However, the cryogenic air separation system had a relatively low exergy efficiency in the subsidiary subsystems, while the clinker cooling system and flue gas circulation system suffered significant exergy efficiency losses. The rotary kiln system, which is the main source of the exergy losses, also had low exergy efficiency in the traditional production process.

1. Introduction

In recent years, climate issues have garnered significant attention, and the substantial amount of CO2 emissions is a crucial factor contributing to global warming. Based on statistical data, the cement sector accounts for around 7% of the world’s total carbon emissions [1]. To solve this problem, CCUS technology is regarded as a viable method targeted at minimizing CO2 emissions and achieving a rational usage of CO2 resources [2,3]. The pre-combustion capture technique [4], post-combustion capture technology [5], and oxygen-enriched combustion technology [6,7] are the three primary CO2 capture methods available today.
Pre-combustion capture technology is a process that transfers the chemical energy from carbon components to carbon-based fuels (like coal) and then separates the carbon from other energy-carrying compounds [8]. Systems for integrated coal gasification combined with cycle power production have made extensive use of this technique [9]. Pre-combustion capture technology, however, is not relevant to the cement industry since the primary source of CO2 generation in this sector is the breakdown of carbonates. On the other hand, post-combustion capture technology involves installing CO2 separation devices on the flue gas channel to collect CO2 in the flue gas after use in fossil fuel combustion equipment [10]. However, obstacles exist in the deployment of post-combustion capture technology in cement production owing to huge exhaust gas volumes, low pressure, low carbon dioxide concentrations, and high pollutant content. Currently, the most established post-combustion capture systems include physical absorption and chemical absorption, both confronting challenges linked to costly capture costs [11]. Calcium looping is a new CO2 capture technology that uses solid adsorbents to react calcium oxide with CO2 to produce calcium carbonate, and then releases CO2 through the process of carbonate decomposition through calcination to achieve the purpose of capturing CO2. Studies have shown that calcium looping technology has a high CO2 capture efficiency and better economic indicators [12]. However, calcium looping technology is currently at an early research phase, especially addressing the difficulty of sustaining the activity of solid sorbents during long-term cycling. Therefore, there are presently no commercial-scale demonstration instances in the cement sector [13].
Oxygen-enriched combustion technology is a novel and highly effective energy-saving approach that considerably improves the combustion rate of fuels, promotes full combustion, boosts combustion temperature, decreases smoke production, and enhances energy usage efficiency. This technology has already been widely adopted in industries such as metallurgy and glass production [14,15,16]. The high cost of CO2 collection may be efficiently addressed in the cement industry by using oxygen-enriched combustion technology. It is feasible to raise the temperature at which coal powder burns while decreasing the emissions of various pollutants, such as sulfur compounds (SOX) and nitrogen oxides (NOX) under oxygen-enriched combustion circumstances. Furthermore, this may lower the energy consumption of the product and the amount of coal used under the same operating circumstances [17].
With the progress of computer technology and numerical simulation methods, theoretical research on oxygen-enriched fuel combustion in the cement industry may now be undertaken through simulations. This has significant value in guiding actual production while reducing research costs. Research suggests that raising the oxygen content in the burner considerably boosts the combustion rate and temperature of coal powder, consequently boosting the heat transfer process in the kiln [18]. Wang et al. found that increasing oxygen content also significantly increases the highest temperature in the kiln, which is beneficial to the clinker calcination process [19]. Marin et al. believed that introducing high-purity oxygen into the main burner of the kiln improves the combustion characteristics, efficiency, and production capacity of the kiln. Additionally, studies have shown that the temperature of the clinker and the kiln’s refractory elements are not significantly affected by the burning of pure oxygen fuel [20]. According to Granados et al., boosting flue gas recirculation during the burning of oxygen-enriched fuel increases the clinker output, kiln heat transfer efficiency, and combustion efficiency [21]. Ditaranto and Bakken optimized the oxygen-enriched combustion process of the rotary kiln through CFD simulation, achieving stable combustion, temperature control, heat transfer, and complete combustion [22]. Magli et al. explored the optimum design and cost analysis of carbon dioxide purification and compression devices during oxygen-enriched fuel combustion. They discovered the ideal separation temperature and pressure, stressing that air leakage greatly affects clinker prices and carbon dioxide recovery rates [23]. Relevant research suggests that compared to other carbon dioxide capture methods, oxygen-enriched combustion technology has the greatest carbon capture rate and lowest capture costs when employed in the cement sector, concurrently decreasing cement production costs [24]. Presently, research on the oxygen-enriched combustion process in cement mostly relies on numerical simulation calculations, lacking the modeling of an entire system. By integrating the oxygen-enriched combustion process with cement production, this study reduces the amount of exhaust gases released and increases the proportion of carbon dioxide in the fumes. This curbs carbon emissions and improves energy utilization efficiency. The energy efficiency of the entire kiln system was analyzed and compared to those of traditional production processes to demonstrate the superiority of the proposed solution. Additionally, the exergy efficiencies of the entire system and its subsystems were explored, as well as potential improvements within these sub-components for overall energy utilization.

2. Establishment of Full-Process System Model

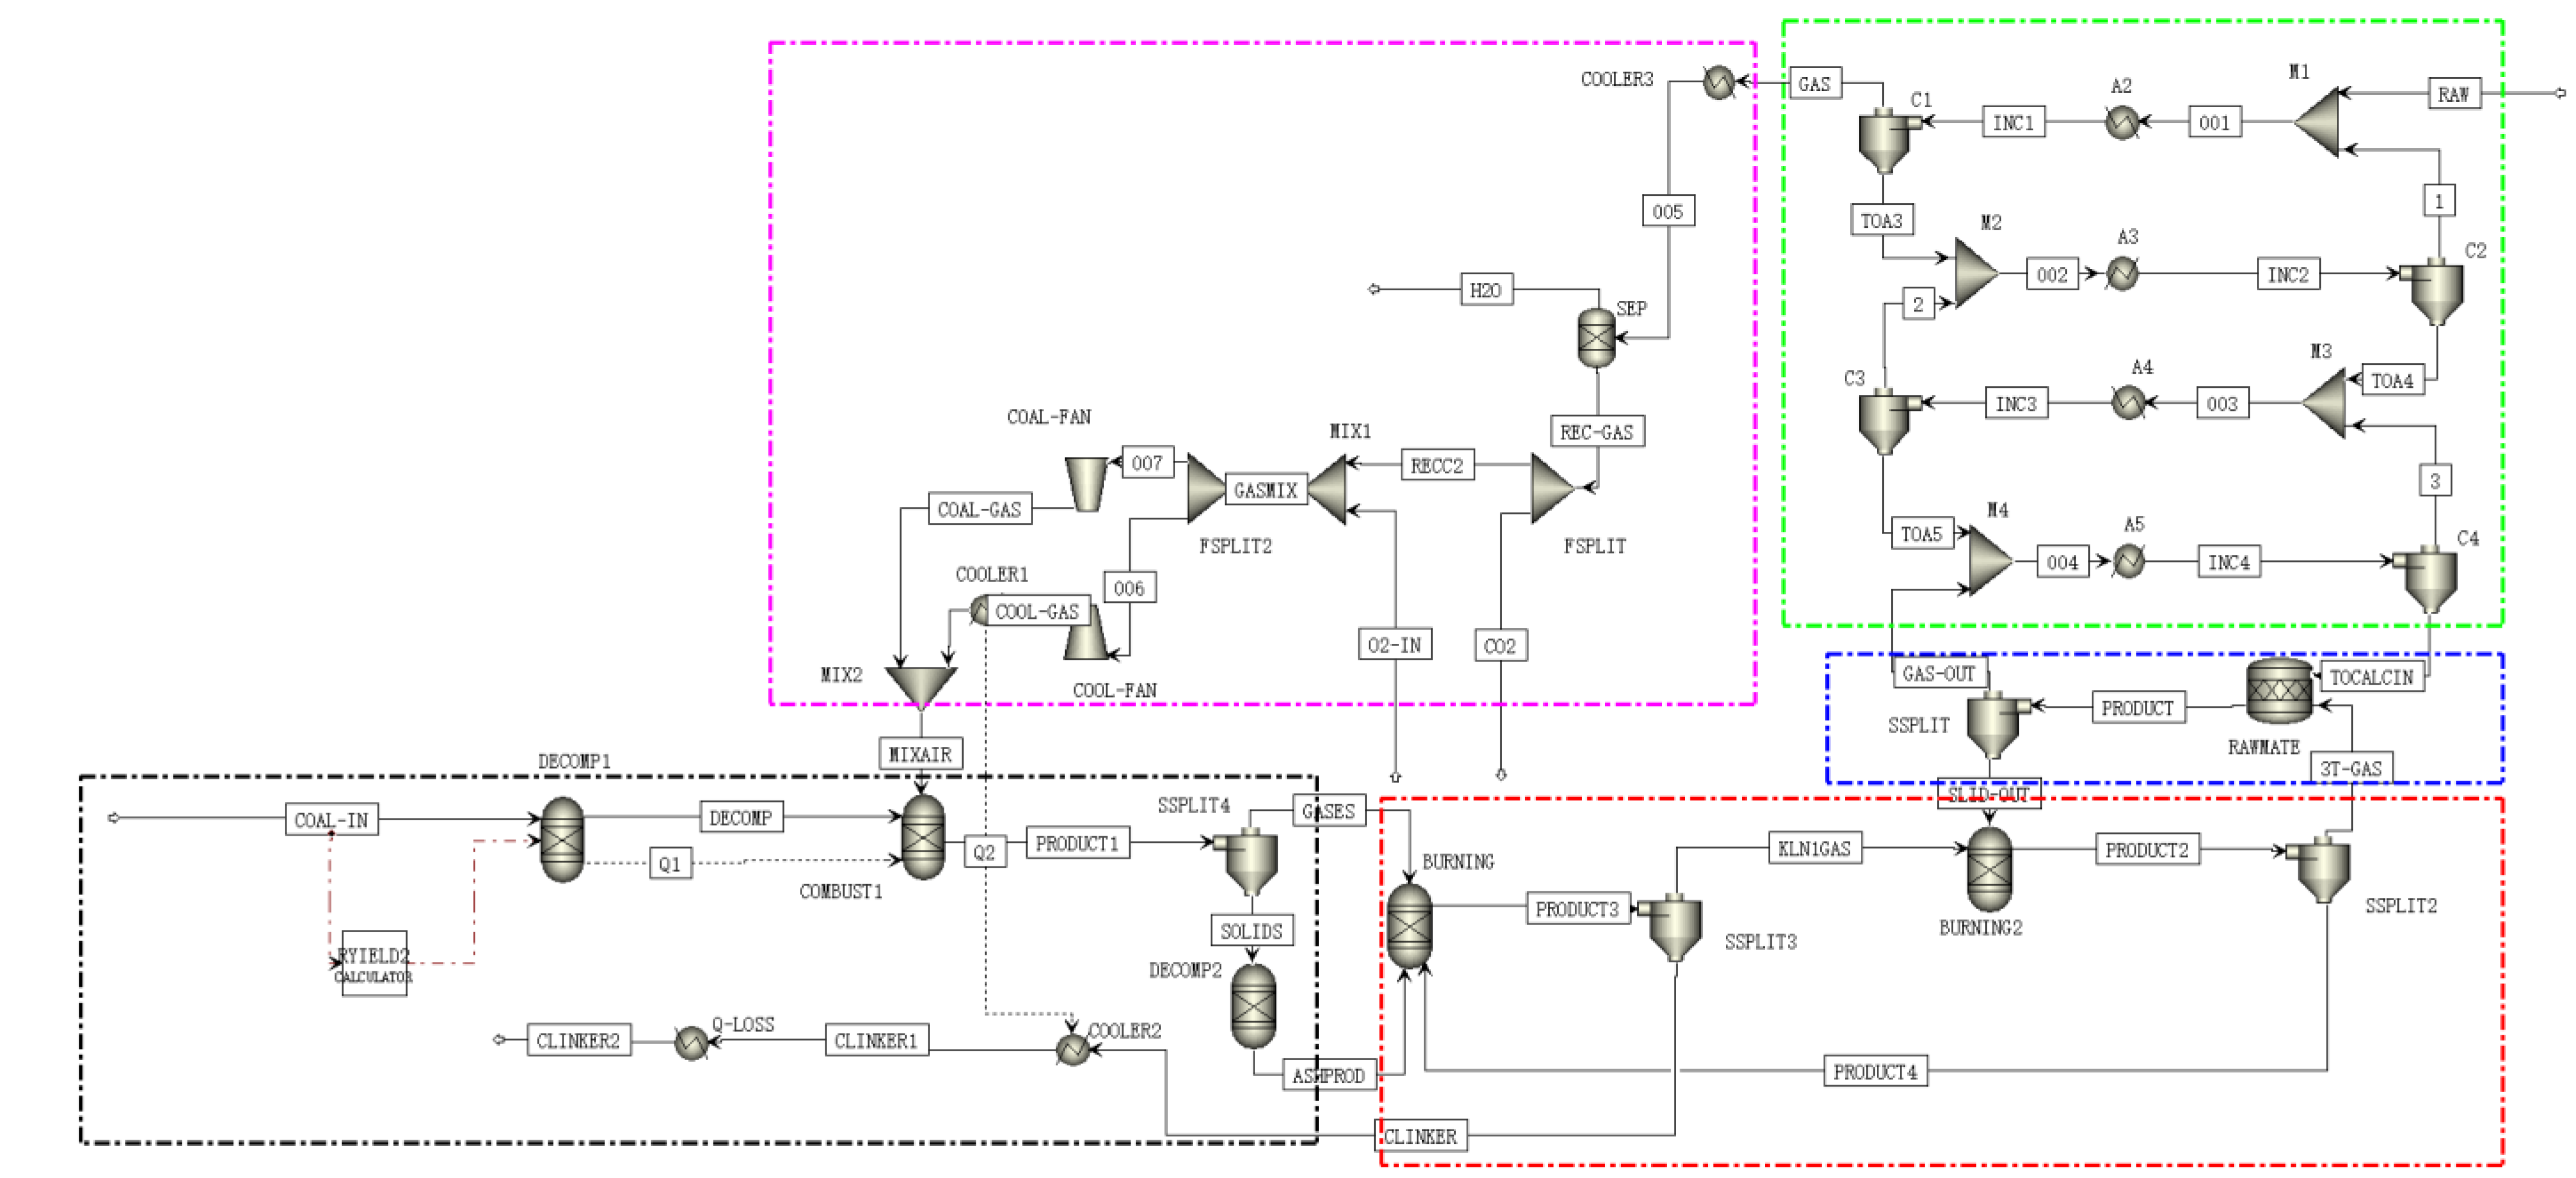
2.1. Cement Production System with Coupled Oxygen-Enriched Combustion Process

The production process of cement typically involves three steps: grinding, homogenization, and burning. Firstly, raw materials are proportioned, dried, homogenized, and finely ground to create the appropriate particle size. The compositions and flow rates of raw materials are shown in Table 1. Subsequently, the raw materials enter the suspension preheater, combining with the gas created by the rotary kiln, preheating the materials before entering the pre-decomposition furnace. Heat exchange between the solid and gas phases occurs in a countercurrent way. In a four-stage suspension preheater, the outlet gas temperature is usually between 300 °C and 380 °C. The preheated raw materials then enter the pre-decomposition furnace, where most of the CaCO3 and MgCO3 are decomposed. Once inside the rotary kiln, the broken-down raw materials exchange heat with hot flue gas in a countercurrent manner. The rotary kiln is set at a certain inclination angle, and during the rotation process, the materials gradually flow to the kiln head under the influence of gravity. Under high temperatures, the components in the raw materials undergo chemical reactions and form clinker. High-temperature flue gas from the kiln head enters the rotary kiln while the coal burns within the burner. Usually, the temperature and main air flow rate are adjusted to regulate the rotary kiln’s temperature. The high-temperature clinker is cooled by cooling air. The fourth-stage suspension preheater’s high-temperature flue gas is treated to remove dust, cool down, and dehydrate. After going through the gas distributor, some of the flue gas that was combined with high-purity oxygen is utilized to cool the clinker, and the remaining portion is used as coal injection air that enters the burner. As a complicated physical and chemical process, cement manufacturing involves the breakdown of source materials, material movement, sintering processes, and gas–solid heat transfer. Therefore, we make the following assumptions before establishing the model:
  • The whole process is in a stable condition, and the composition of the feedstock does not vary.
  • All chemical reactions within the system are in thermodynamic equilibrium.
  • The pressure decrease and partial heat loss of the process are ignored.
  • All materials in the reactor are in the same state and leave the reactor at the same temperature.
  • In total, 70% of the CaCO3 and MgCO3 are decomposed in the decomposition furnace.
  • All chemical reactions take place only in the reactor.
The physical property method used in this module is the ideal method. Coal composition is too complex to be defined using conventional methods, so the HCOALGEN and DCOALIGT models (shown in Figure 1) were used to establish the Aspen Plus process for the entire production process. The process is separated into five subsystems: a four-stage suspension preheating system, a rotary kiln system, a pre-decomposition furnace system, a coal powder combustion system, and a flue gas circulation system. The four-stage suspension preheating system, based on Aspen Plus, is mainly used for gas–solid heat transfer and separation. The heater module and the mixer module simulate gas–solid heat transfer, while the SSplit module simulates the gas–solid separation process. The rotary kiln system comprises the RGibbs module, heater module, SSplit module, and RStoic module used to model raw material breakdown and clinker sintering processes [25]. The following reaction processes are mainly considered in this process:
C a C O 3 C a O + C O 2 2 C a O + S i O 2 2 C a O S i O 2 2 C a O S i O 2 + C a O 3 C a O S i O 2 3 C a O + A l 2 O 3 3 C a O A l 2 O 3 4 C a O + A l 2 O 3 + F e 2 O 3 4 C a O A l 2 O 3 F e 2 O 3
To replicate the combustion process of pulverized coal, the RGibbs module, RYield module, and SSplit module make up the pulverized coal combustion system. The RYield module decomposes the non-conventional components of pulverized coal into the conventional components C, H, O, N, S, and ash, and the yield of each component is controlled through formulas written in Fortran. Unconventional component-pulverized coal was defined through industrial, elemental, and sulfur analyses. A composition comparison is shown in Table 2. Decomposition products are defined through the Gibbs free energy minimization principle to determine the products of the combustion reaction process as well as the composition; the solids and flue gases produced after combustion are separated from gas and solids through the separation module, and the ash materials produced are decomposed into conventional components as raw materials for cement production through the RYield module. Table 3 shows the specific configuration parameters of the module. The Gibbs function is represented in Equations (2) and (3) [26,27]:
ξ = m i n G
G = Σ j = 1 S G j m j + Σ j = s + l C Σ j l K m j l
where S is the system’s single phase; K is the total number of phases in the system; m is the number of moles; and G is the system’s Gibbs free energy.

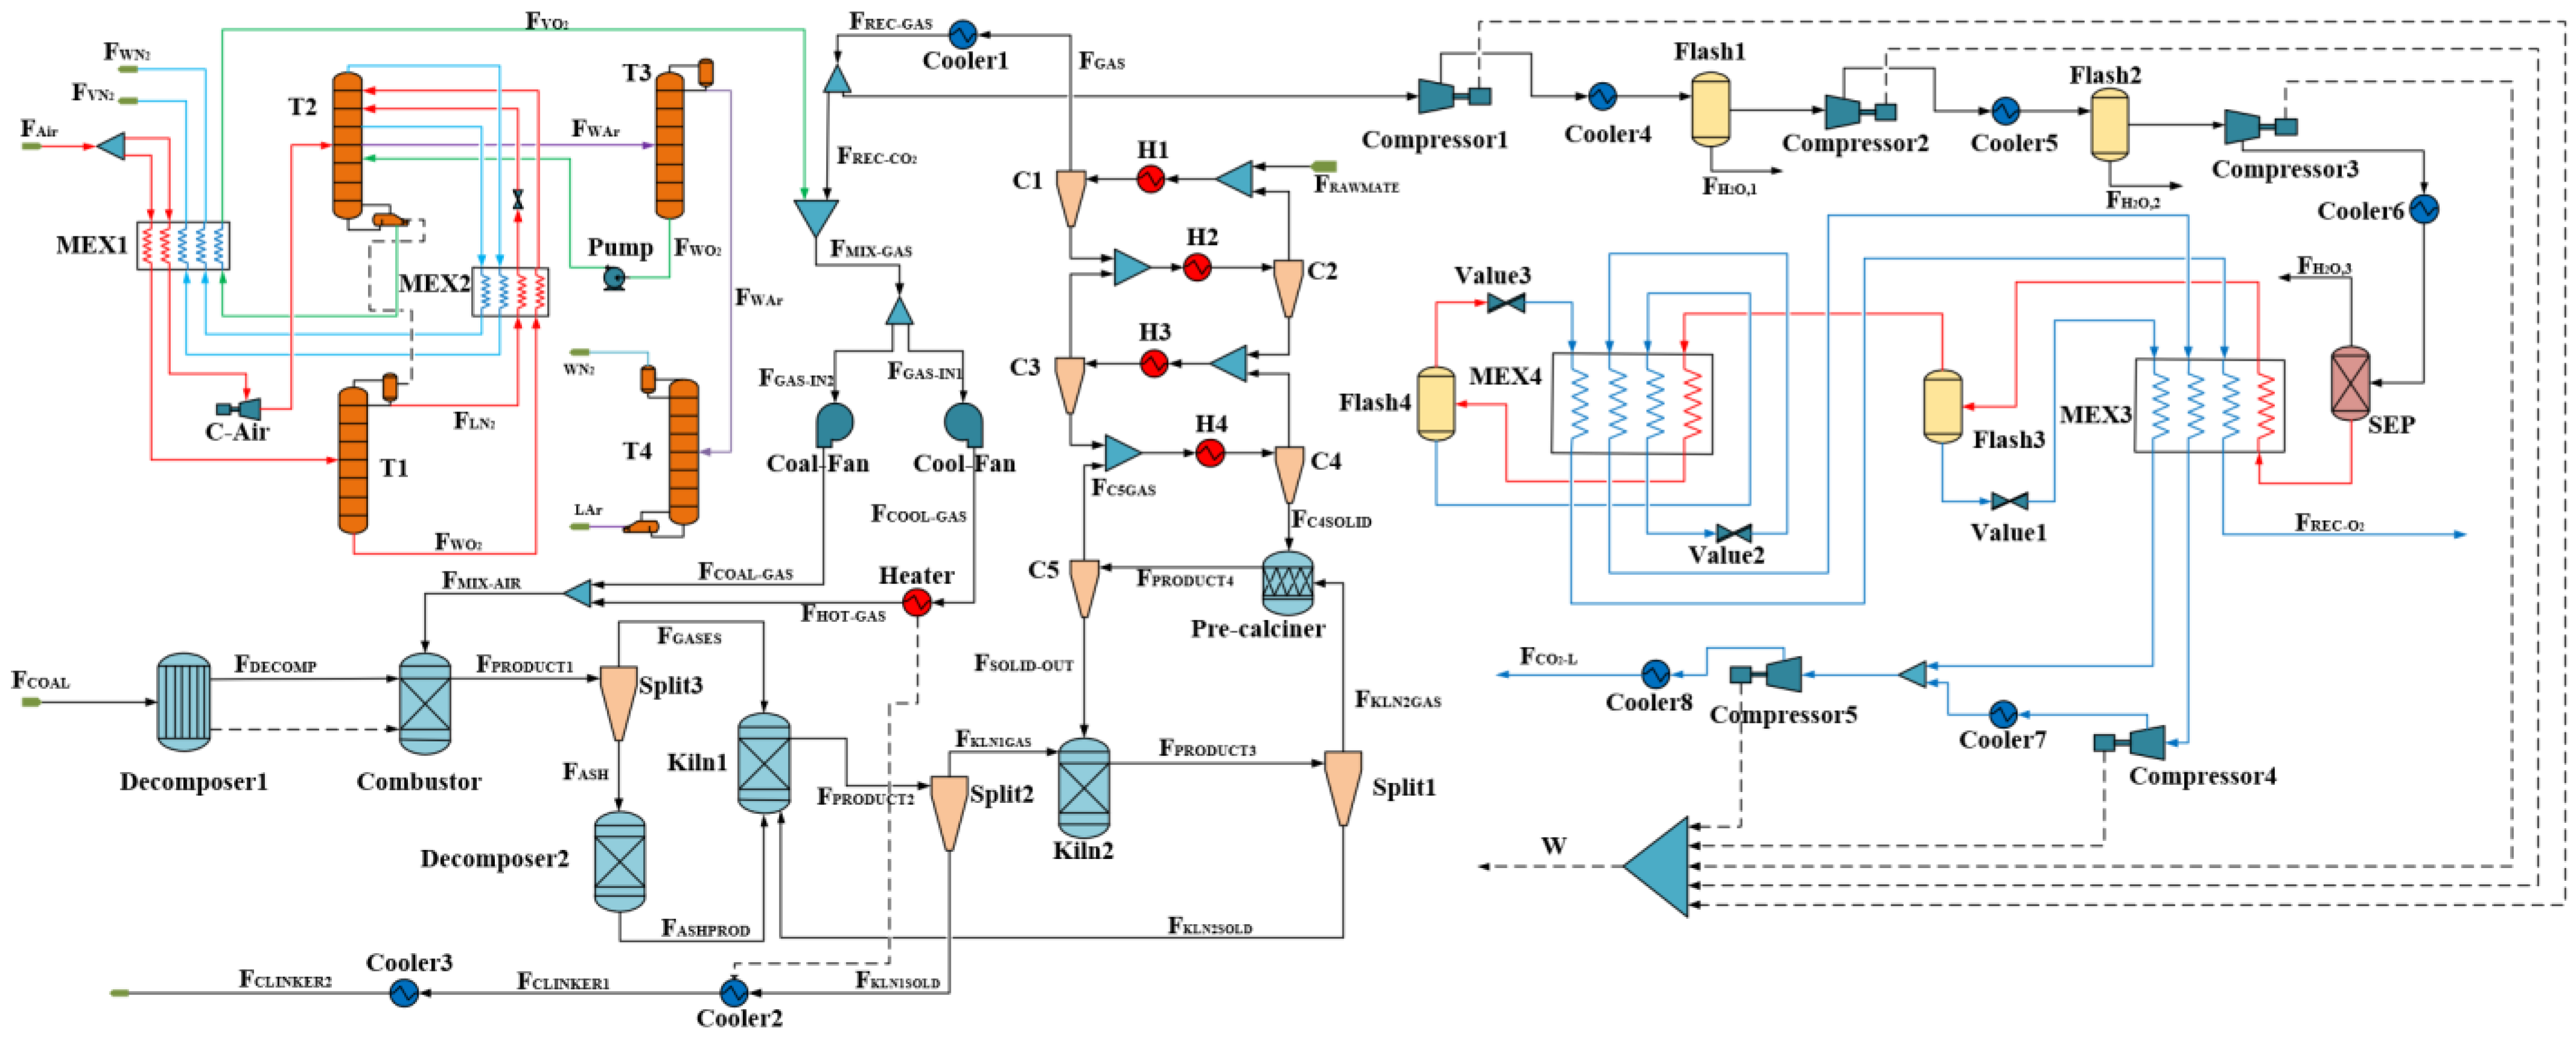
2.2. Air Separation System

This research leveraged a Cryogenic Air Separation Unit (CASU) to develop an air separation system. Compared with pressure swing adsorption and membrane separation methods, a CASU is more mature in the industry and can produce higher quantities and mass fractions of oxygen [28,29]. The air separation system was established using Aspen Plus, which includes an air compressor, a distillation tower, and heat exchangers. The entire process was simulated using the Peng Robinson property method [30]. The system adopts a full low-pressure external compression process. Prior to entering the primary heat exchanger, the air is first compressed and then condensed many times. A portion of the air is cooled to −152 °C and enters the upper tower, while another portion is cooled to −174 °C and enters the lower tower. In the lower tower, the separated rich-oxygen liquefied air and nitrogen undergo heat exchange and enter the upper tower. At the bottom of the tower, oxygen products with a purity of 99.4% are separated, while high-purity nitrogen products are also separated. The mixture of oxygen and argon, separated from the upper part of the tower, enters the crude argon tower. The top of the tower releases crude argon gas, while the bottom of the tower recovers, further separates, and purifies high-purity oxygen. Finally, the crude argon gas enters the refined argon tower to separate high-purity argon [31,32].

2.3. CO2 Purification Unit

The high level of carbon dioxide purity in the flue gas is a result of the process’s use of oxygen-enriched combustion technology, which removes the need for further carbon dioxide absorption procedures to directly purify and compress the flue gas [33]. Non-condensable gases (O2, NO, NO2, etc.) and water vapor are the primary contaminants found in flue gas [34]. The flue gas is compressed to around 3 MPa through many stages in order to separate part of the water, and using molecular sieves, the leftover water vapor is eliminated. Main heat exchanger 1’s condensers and flash tanks are positioned in between the compressors. Then, MEX3 cools the compressed flue gas to −5 °C before it reaches the first-stage flash tank for flashing. The gas phase enters main heat exchanger 2 (MEX4) and further cools to −23 °C before entering the second-stage flash tank. The cooling capacity required for the entire system can be generated through the pressure reduction throttling of the liquid product [35,36]. Since non-condensable gases (SOX and NOX) dissolve in water during the high-pressure flue gas condensation process, the entire system does not require additional desulfurization and denitrification devices [9]. After purification and compression, the CO2 mass fraction in the flue gas reaches 96%, satisfying the real storage and transit demands [37]. The compressed flue gas is pressurized to 7 MPa and then cooled to 20 °C to become liquid, which can be transported through pipelines. The system as a whole uses 4.54 MW of energy, with an adiabatic compression efficiency of 0.85. The specific energy consumption for CO2 compression is 0.568 MJ/kg. The CO2 flow rate at the inlet is 29,061.7 kg/h, and the CO2 flow rate obtained after the flue gas compression and purification is 28,185.6 kg/h, with a CO2 recovery rate of 96.98%. As shown in Figure 2, based on the three systems above, a low-carbon cement production process coupled with the CASU and CO2 purification unit was constructed.

2.4. Model Verification

Every step of the manufacturing process was modeled using Aspen Plus, and then the correctness and efficacy of the developed model were verified by comparing the simulation results with real production data. The first validation was the difference in the chemical composition of the clinker product. A chemical analysis of the clinker used in the real manufacturing process provided the reference data in Table 4. The primary cause for the disparity between the simulation results and the real production results is the removal of various minor chemical components, such as Na2SO4, CaSO4, K2SO4, TiO2, etc. From Table 4, it can be seen that there is a significant deviation in tricalcium aluminate (C3A), which is due to the lack of physical property data for tetracalcium alumino ferrite (C4AF) in the Aspen database, and its proportion in the clinker composition is relatively small. Therefore, it is expected that all tricalcium aluminate (C3A) is created throughout the reaction process. Additionally, the model implies that dicalcium silicate (C2S) combines fully with free lime (CaO) to form tricalcium silicate (C3S) [25].
Table 5 shows the contrast between actual plant operation data and Aspen Plus simulation calculation data. The majority of parameters demonstrate a close resemblance to the actual operation data; yet, due to the model’s idealized nature, a negligible disparity emerges. It is evident that the exhaust gas’s oxygen content has significantly deviated from normal. The root cause is that the production process is not a perfectly closed system, resulting in undetected air leaks, which have yet to be incorporated into the current modeling framework. Furthermore, the pulverized coal flow rate deviates significantly from the actual production process due to the intricate nature of the pulverized coal combustion process. Suboptimal combustion efficiency and other factors that are accepted in the real manufacturing process result from the unit operation model’s inability to adequately represent the many physical and chemical changes that take place throughout this process [38,39].

3. Study on System Operating Conditions Parameters

A sensitivity analysis of the main operating parameters can provide important information for the system production process. Therefore, the research and analysis of relevant parameters can improve the performance of the entire production process. This section primarily examines the effects of varying coal and oxygen flow rates on the kiln’s oxygen-fuel coupled combustion process’s performance and pollution emissions.

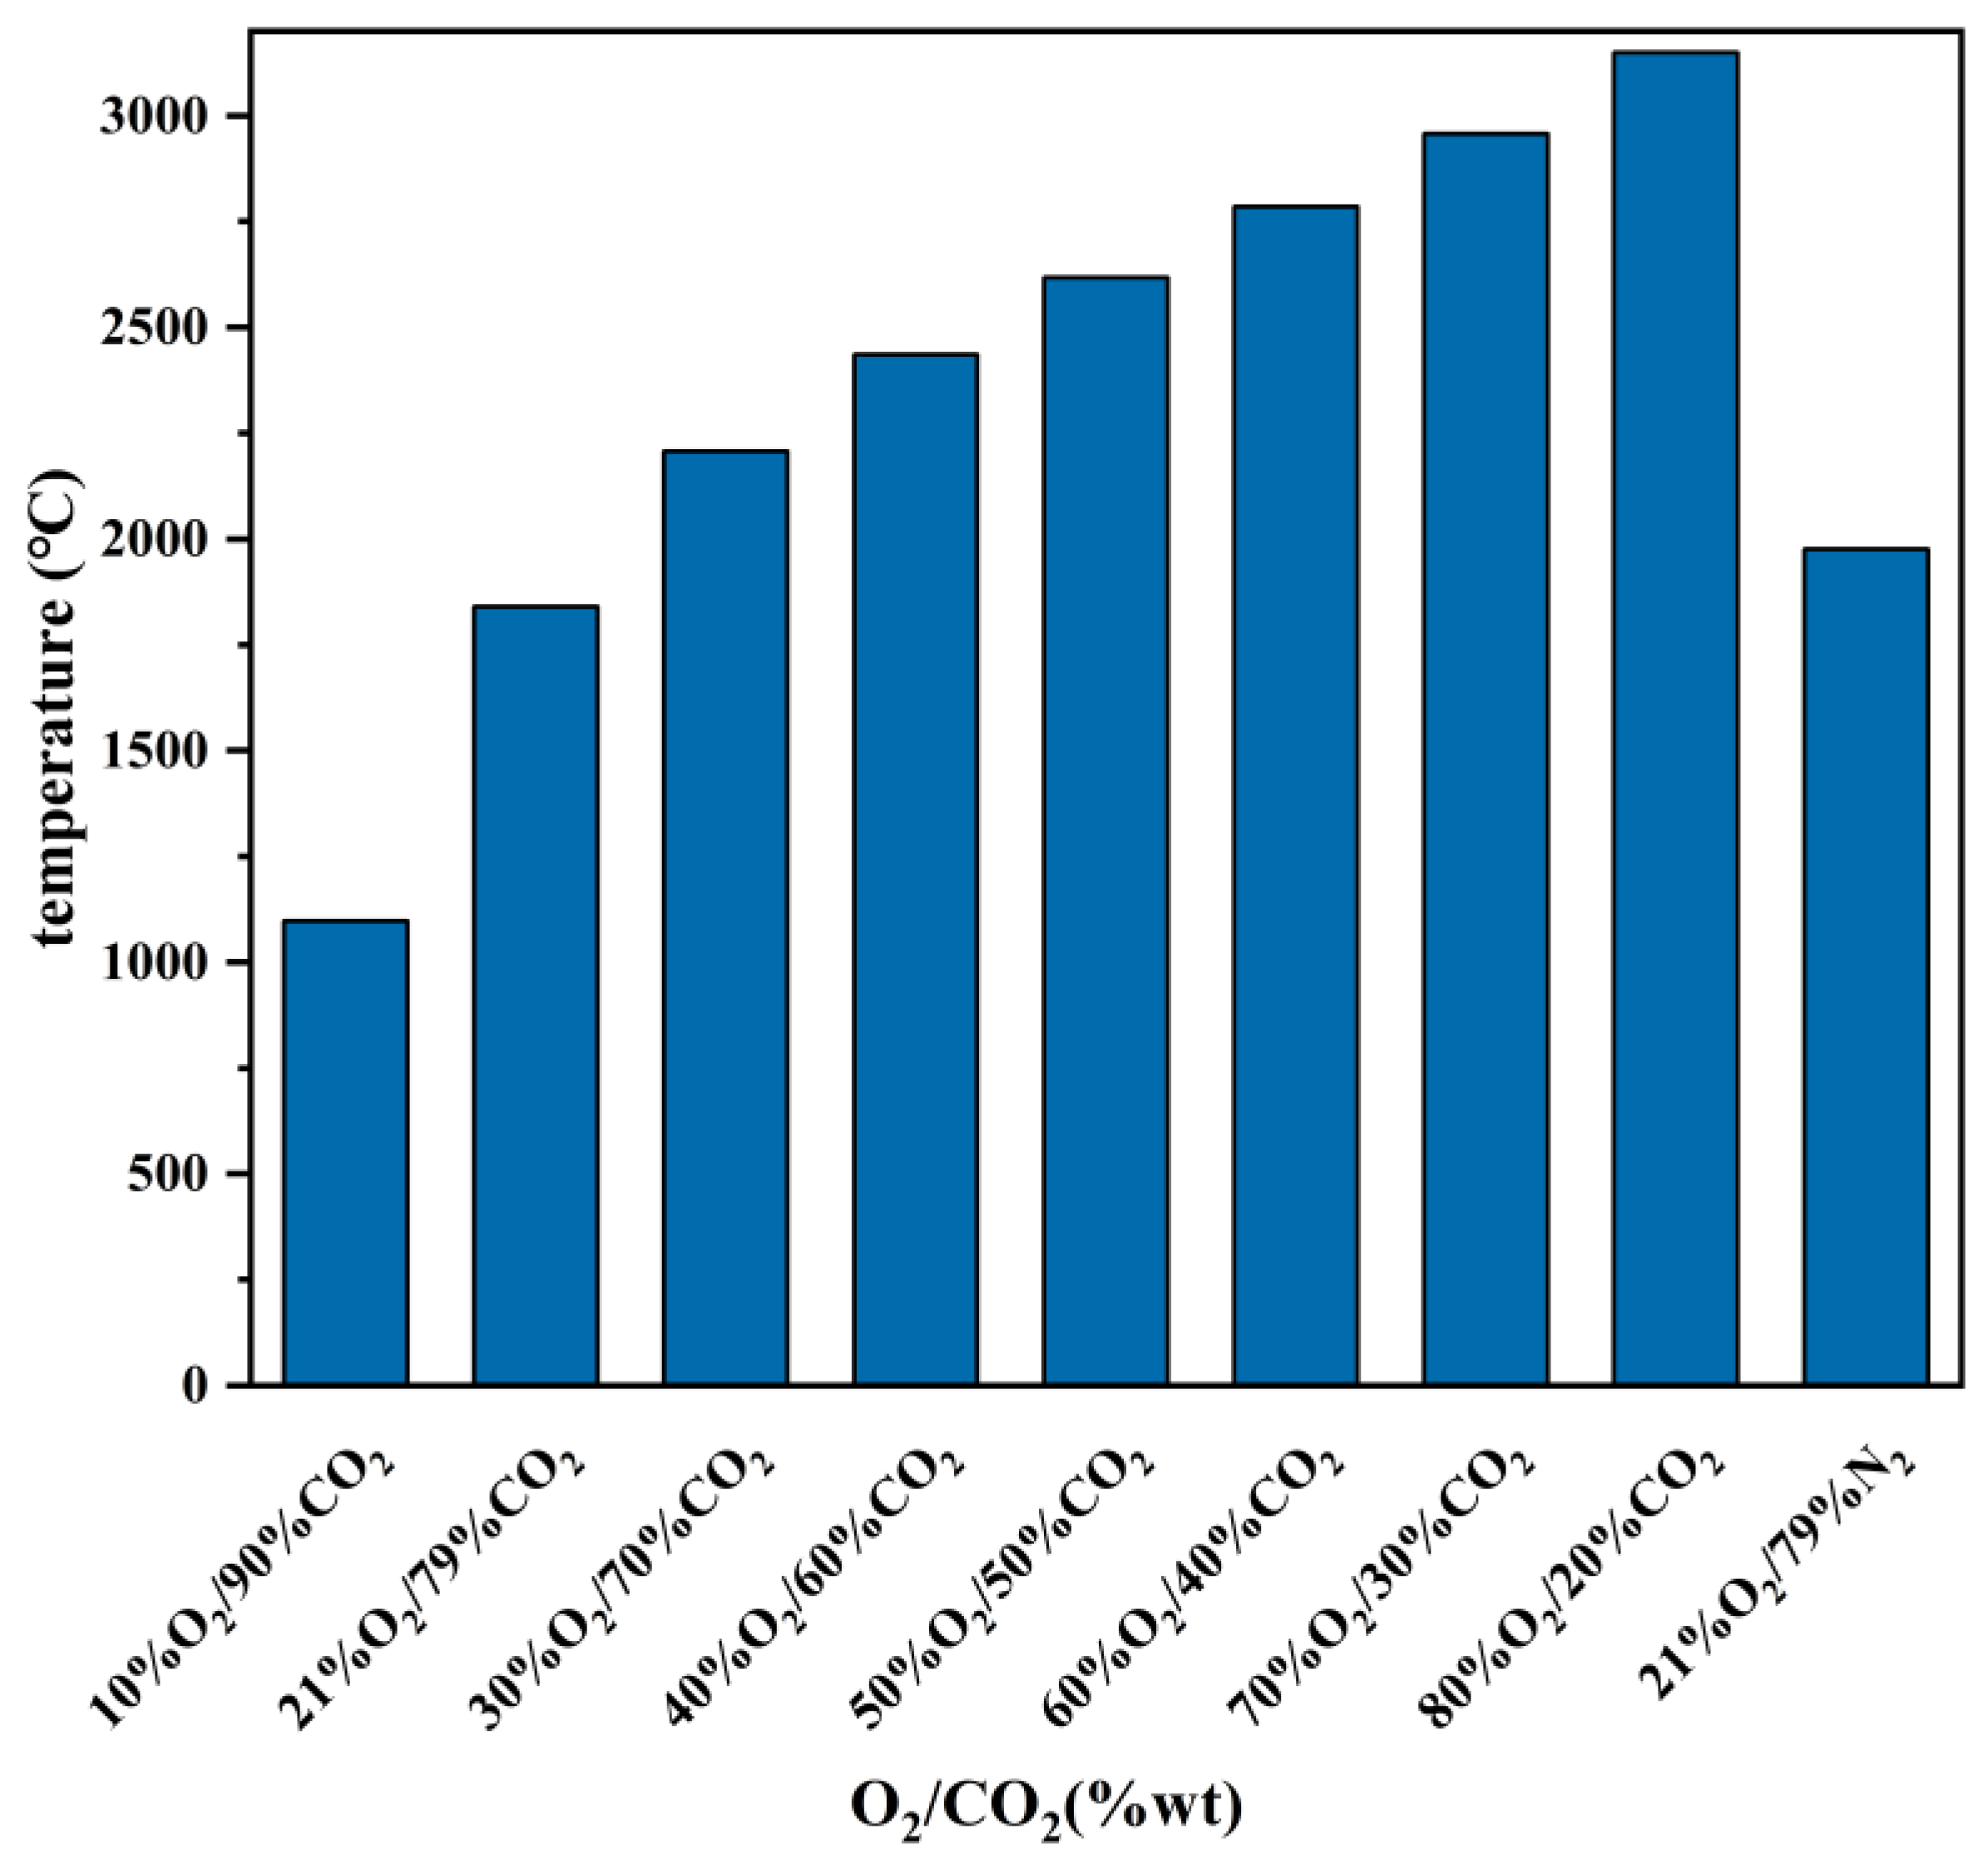
3.1. Effect of O2/CO2 Atmosphere on the System

Although higher temperatures can be achieved with less oxygen and coal flow in an oxygen-rich combustion state, the amount of flue gas generated will also decrease. Convective and radiative heat transfer are the methods used in the rotary kiln to transmit heat from the flue gas to the raw material [40,41]. Insufficient flue gas carries less enthalpy, which has a detrimental effect on clinker production. Coal combustion must be performed in an O2/CO2 environment in order to guarantee that the temperature distribution in the kiln stays consistent with the heat transfer characteristics and standard operating parameters [42]. With the results shown in Figure 3, under the condition of constant oxygen combustion ratio, the flue gas temperature under diverse O2/CO2 atmospheres was simulated. Because CO2 has a larger heat capacity than N2, the flue gas temperature in an O2/N2 atmospheric environment is somewhat higher than that of an O2/CO2 atmospheric environment. This is because the flue gas temperature in the former is lower than the air temperature in the atmospheric environment [43].

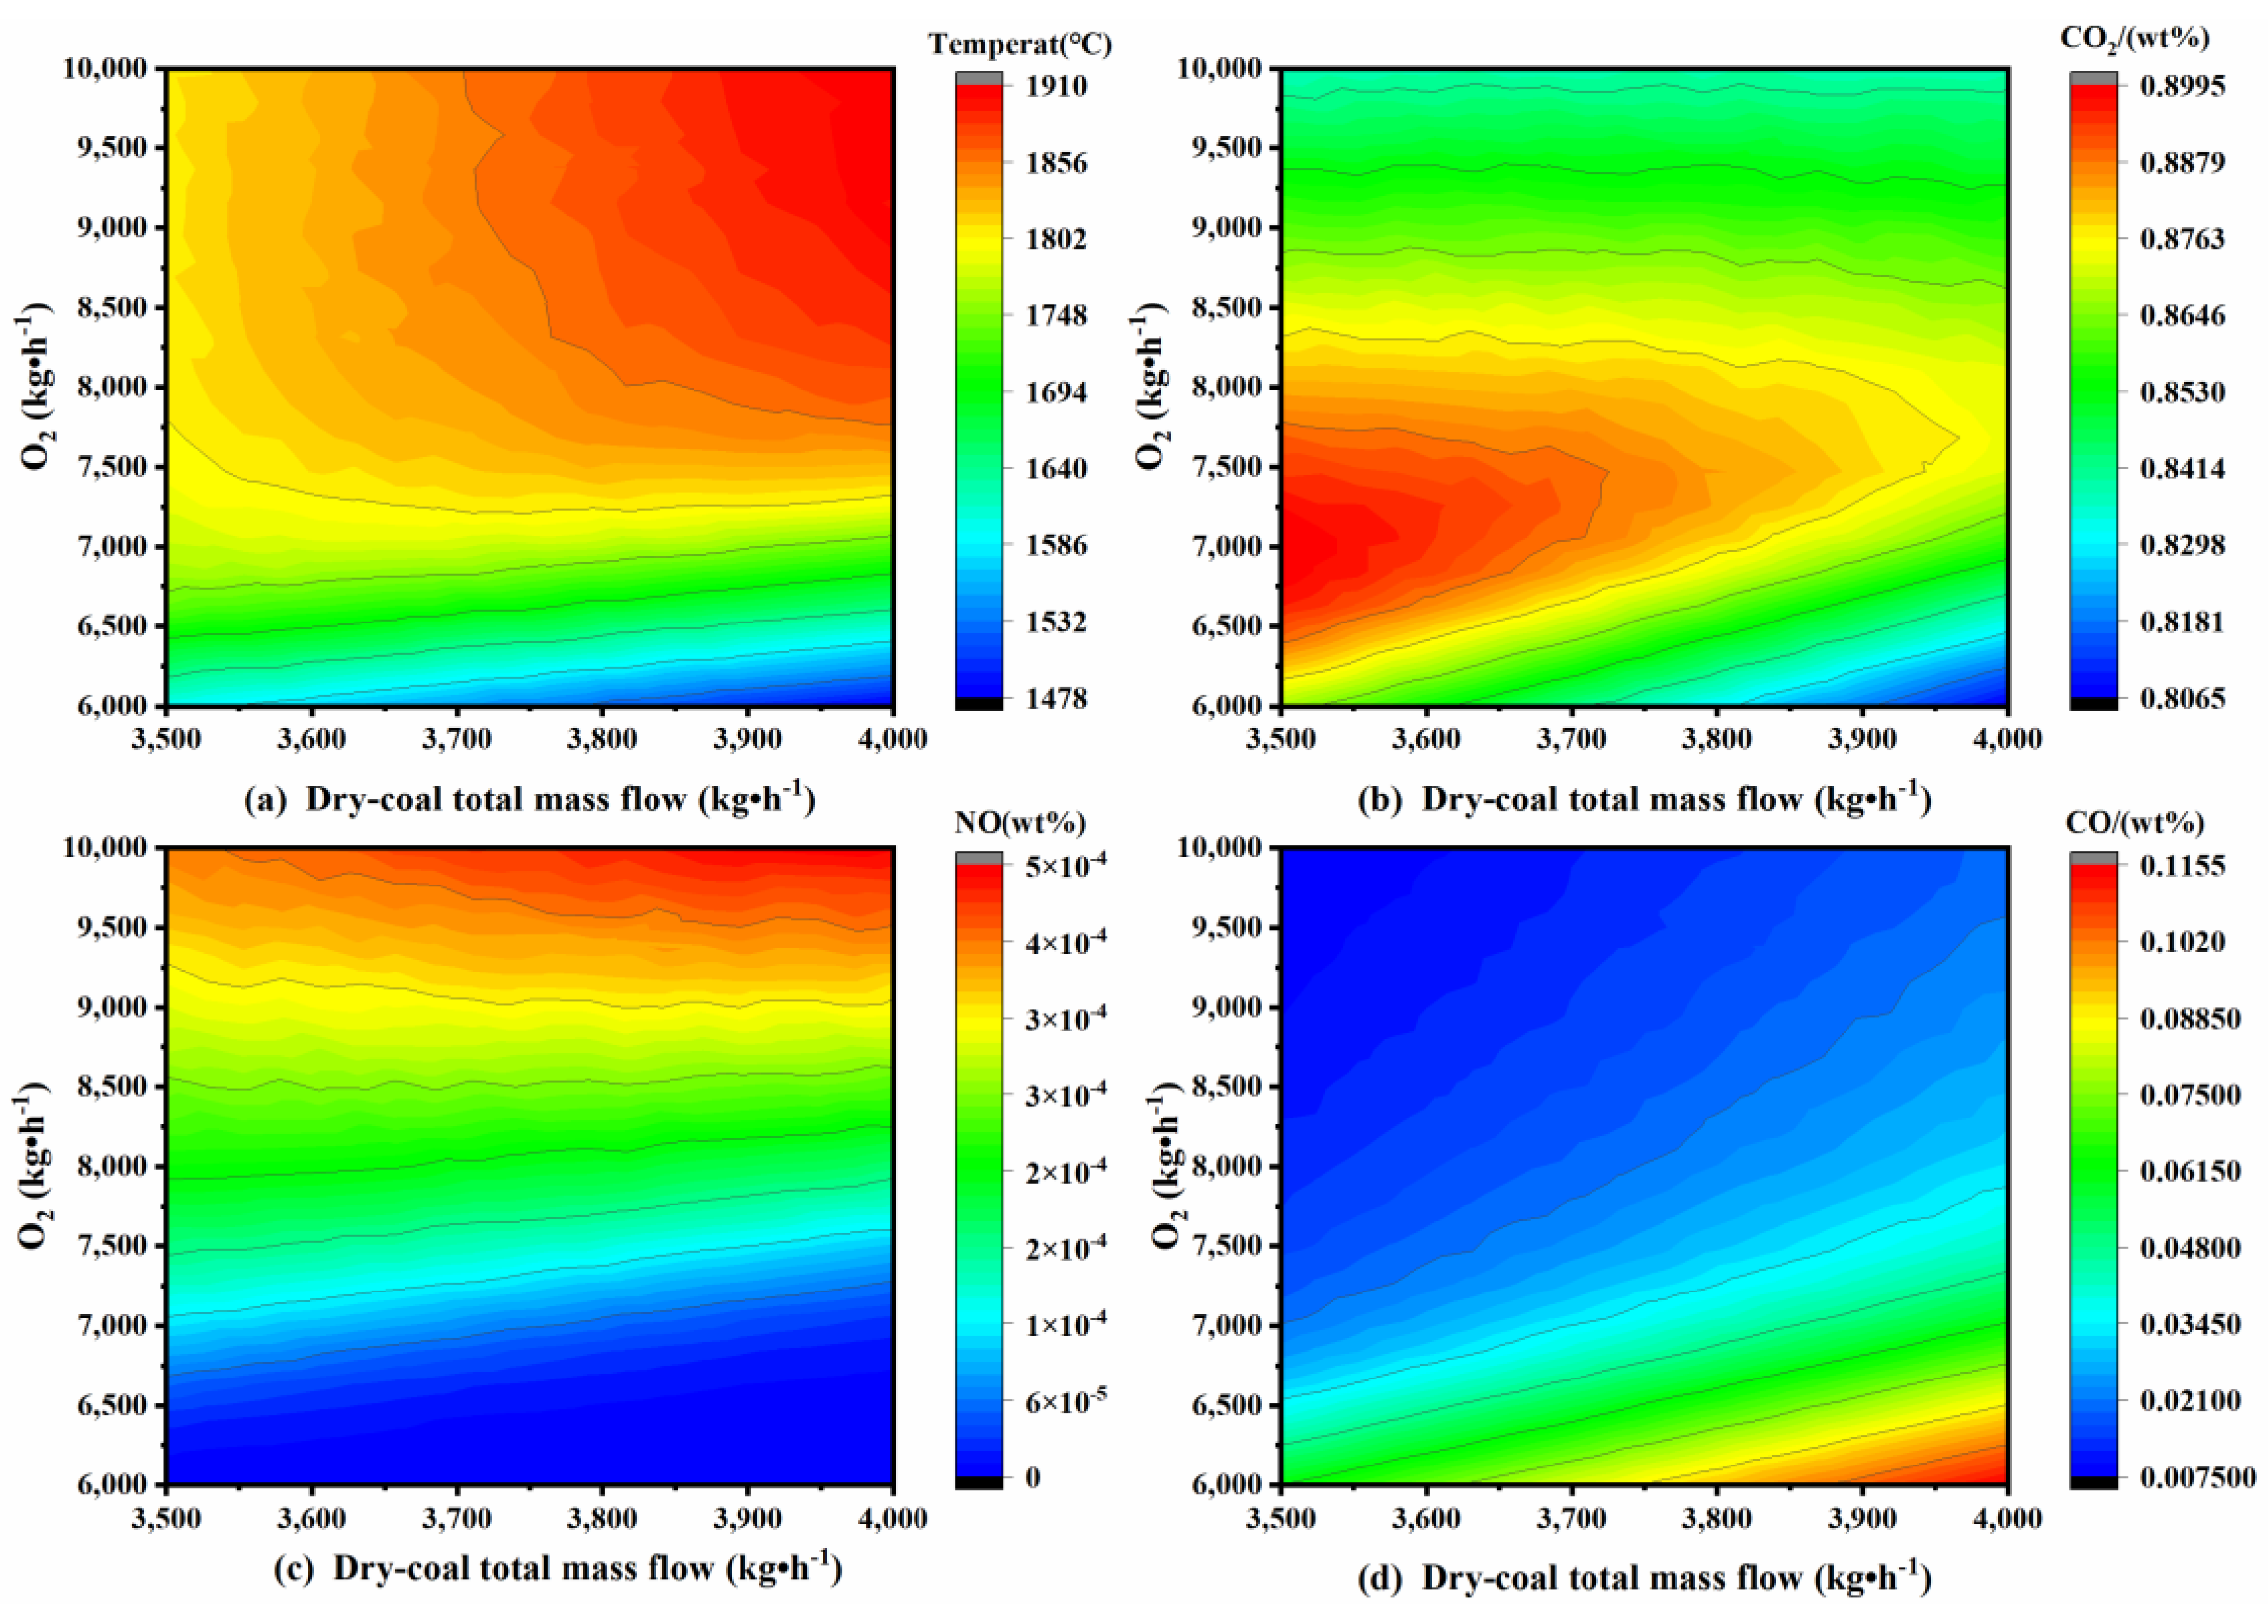
3.2. Effect of Different Oxygen and Coal Flow Rates on Combustion Systems

High-concentration oxygen with a quality score of 99.4% was chosen as the combustion-supporting gas to study the effects on the combustion system under different oxygen and coal flow conditions. The experimental findings are displayed in Figure 4. From Figure 4a, it can be noted that when mO2 = 10,000 kg/h and mcoal = 4000 kg/h, the temperature in the kiln reaches 1910 °C, which is acceptable for production. Compared to the coal flow rate utilized in the reference (mcoal = 5000 kg/h), roughly 20% of coal usage may be avoided. The clinker output on this manufacturing line is 35,000 kg/h, with a specific energy consumption of 4200 kJ/kg coal. When the coal input rate is 4000 kg/h, the specific energy consumption in the rotary kiln is 3360 kJ/kg coal, suggesting a decrease of around 840 kJ/kg coal in specific energy consumption. It should be noted that this can be achieved only under ideal conditions without considering heat loss, system air leakage, or combustion in the production process, but overall, the oxygen-rich state can still achieve significant coal-saving effects. Figure 4b–d show the variation trends of the main gas product contents with oxygen and coal flow rates. When mO2 = 7052.632 kg/h and mcoal = 3500 kg/h, the maximum CO2 content is 89.94% (wt.%), indicating the optimal stoichiometric ratio between coal powder and oxygen, and the combustion is more complete. The CO decreases with an increase in the oxygen-to-coal ratio. When mO2 = 10,000 kg/h and mcoal = 3500 kg/h, the mass fraction is 0.75%, indicating that the excess O2 increases the generation of CO. The trend of NO is opposite to that of CO. With an increase in the oxygen-to-coal ratio, its content dramatically increases. When the oxygen-to-coal ratio is about 2.5, its concentration is 4.63 × 10⁻⁴ (wt.%). As indicated in Figure 4a, the gas temperature under this working state is quite high, which is favorable to the generation of thermal NOX [44].
The fuel specific heat energy consumption was calculated as follows:
q = m c o a l · L H V m f
where q (kJ/kg) is specific heat energy consumption, LHV (kJ/kg) encompasses lower fuel heating values, mcoal (kg/h) is the fuel flow rate, and mf (kg/h) is the clinker flow rate.

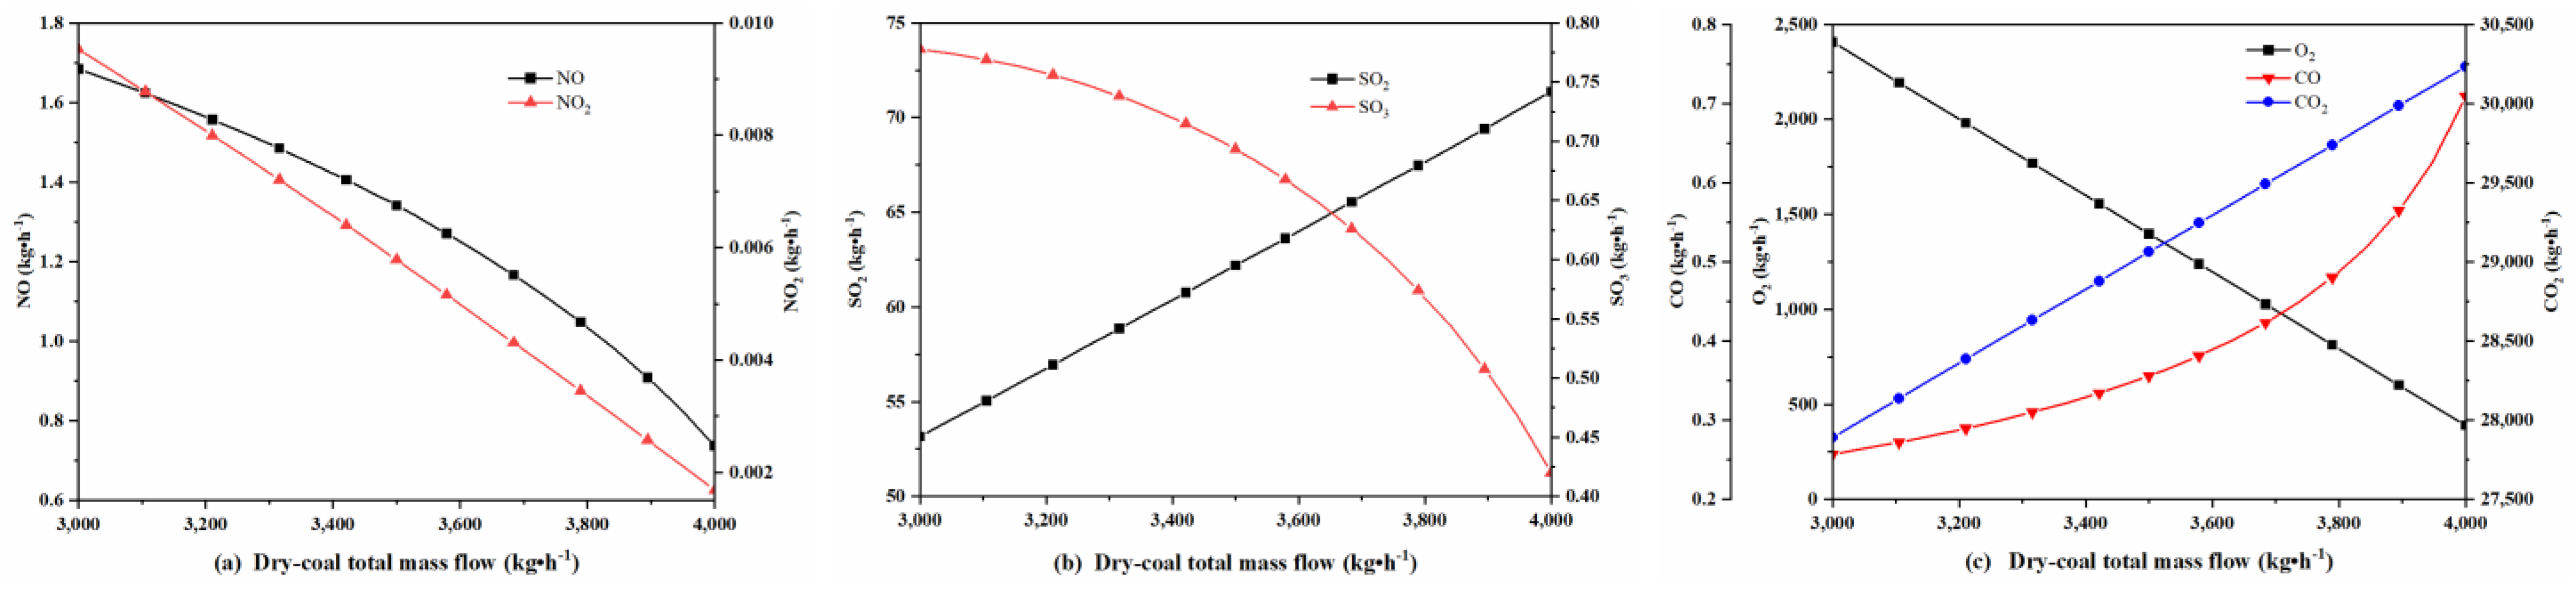
3.3. Effect of Pulverized Coal Flow on Tail Gas Emissions

Under oxygen-rich combustion circumstances, the impact of the coal powder flow rate on pollutant emissions in the exhaust gas was evaluated. The simulation results are shown in Figure 5. With a rise in the coal powder flow rate, the flow of CO2 increases while the flow of O2 drops. Therefore, at mO2 = 8500 kg/h and from mcoal = 3000 kg/h to mcoal = 3000 kg/h, the coal powder is in a good combustion state. The rise in CO flow rate may be attributed to the increase in the coal flow rate, which elevates the temperature of the flue gas and causes the dissociation of a tiny quantity of CO2. Both NOX and SO3, the main pollutants, show decreasing trends, but the flow rate of SO3 increases significantly due to the high temperature promoting the generation of SO2 during combustion [45].

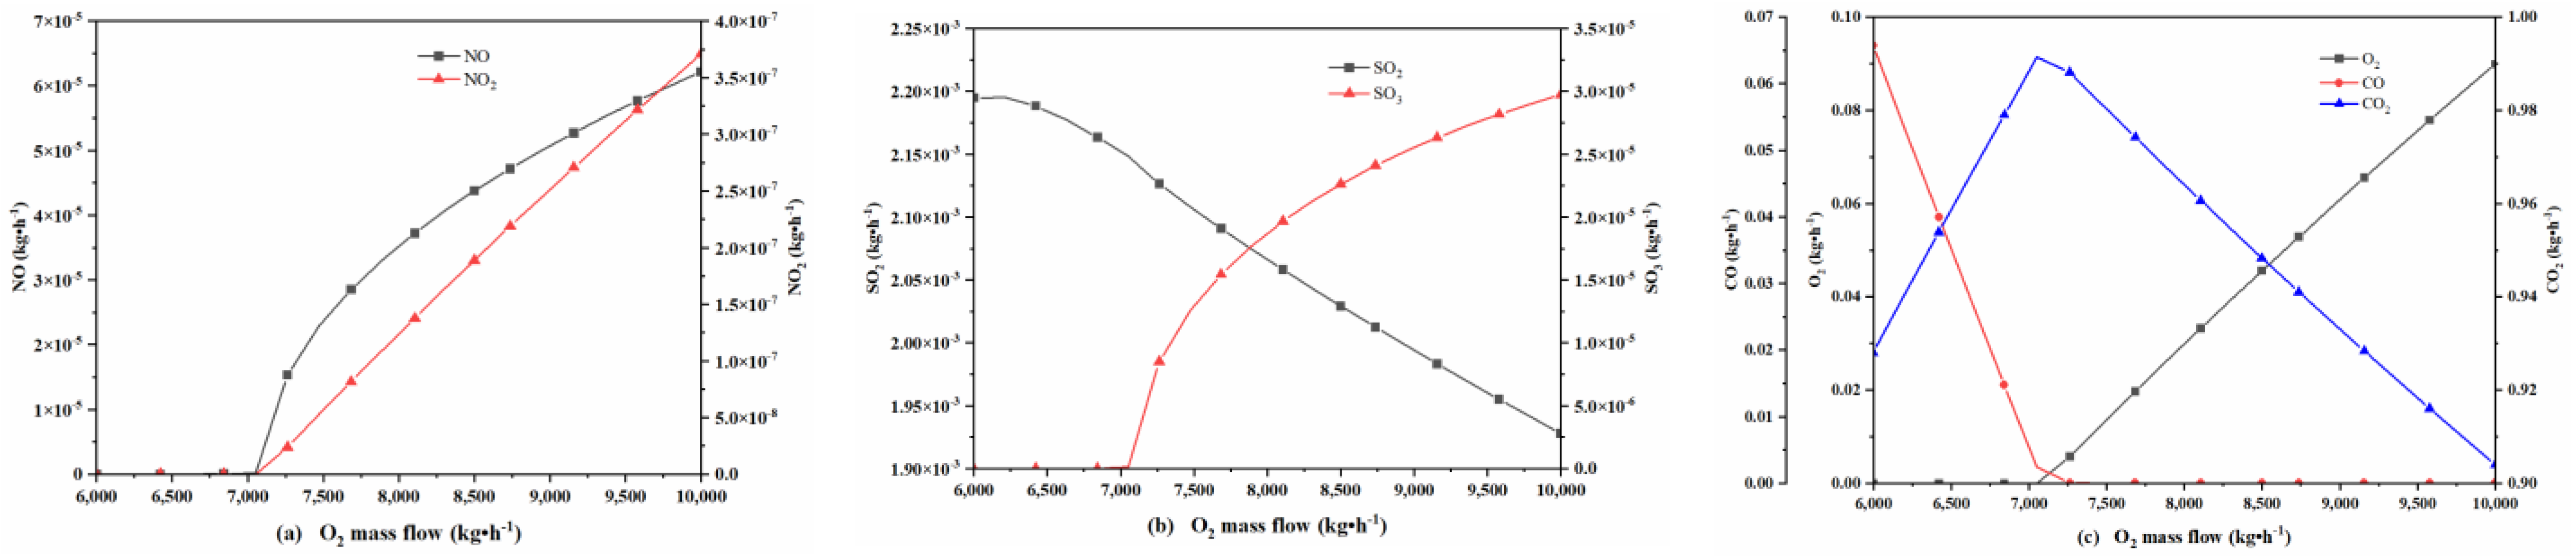
3.4. Effect of Oxygen Flow Rate on Tail Gas Emissions

The sensitivity analysis results of oxygen flow rate are shown in Figure 6. When mO2 = 7000 kg/h, the flow rates of O2, SO3, NO, and NO2 in the exhaust gas are close to 0 kg/h, and then they start to increase linearly. This shows that previous to this, the incomplete burning of coal powder and lower combustion zone temperature prevented the creation of thermal NOX, and at this moment, the predominant kind of NOX formed is fuel related. At this time, the main type of NOX generation is fuel type. When mO2 = 6000 kg/h, the flow rate of CO reaches its maximum at 1852 kg/h, and then declines to close to 0 kg/h with the rise of oxygen flow rate. Generally, the generation of SO2 increases with the increase in the combustion zone temperature. Before mO2 = 7000 kg/h, with the increase in the oxygen flow rate, the ideal oxygen-to-coal ratio is progressively achieved, and the combustion zone temperature also increases. However, the ongoing rise in the quantity of oxygen results in a part of the heat being used to heat the extra oxygen, thereby decreasing the temperature of the combustion zone and leading to a subsequent drop in the flow of SO2. CO2 linearly increases to 29,061 kg/h at mO2 = 7000 kg/h, and then remains constant. This is because at this moment, the coal powder has been totally consumed, and under the circumstance of abundant oxygen, no additional CO2 is formed. It is evident from a comparison of Figure 5 and Figure 6 that variations in the oxygen flow rate are more sensitive to changes in the exhaust gas composition than are variations in the coal powder flow rate.

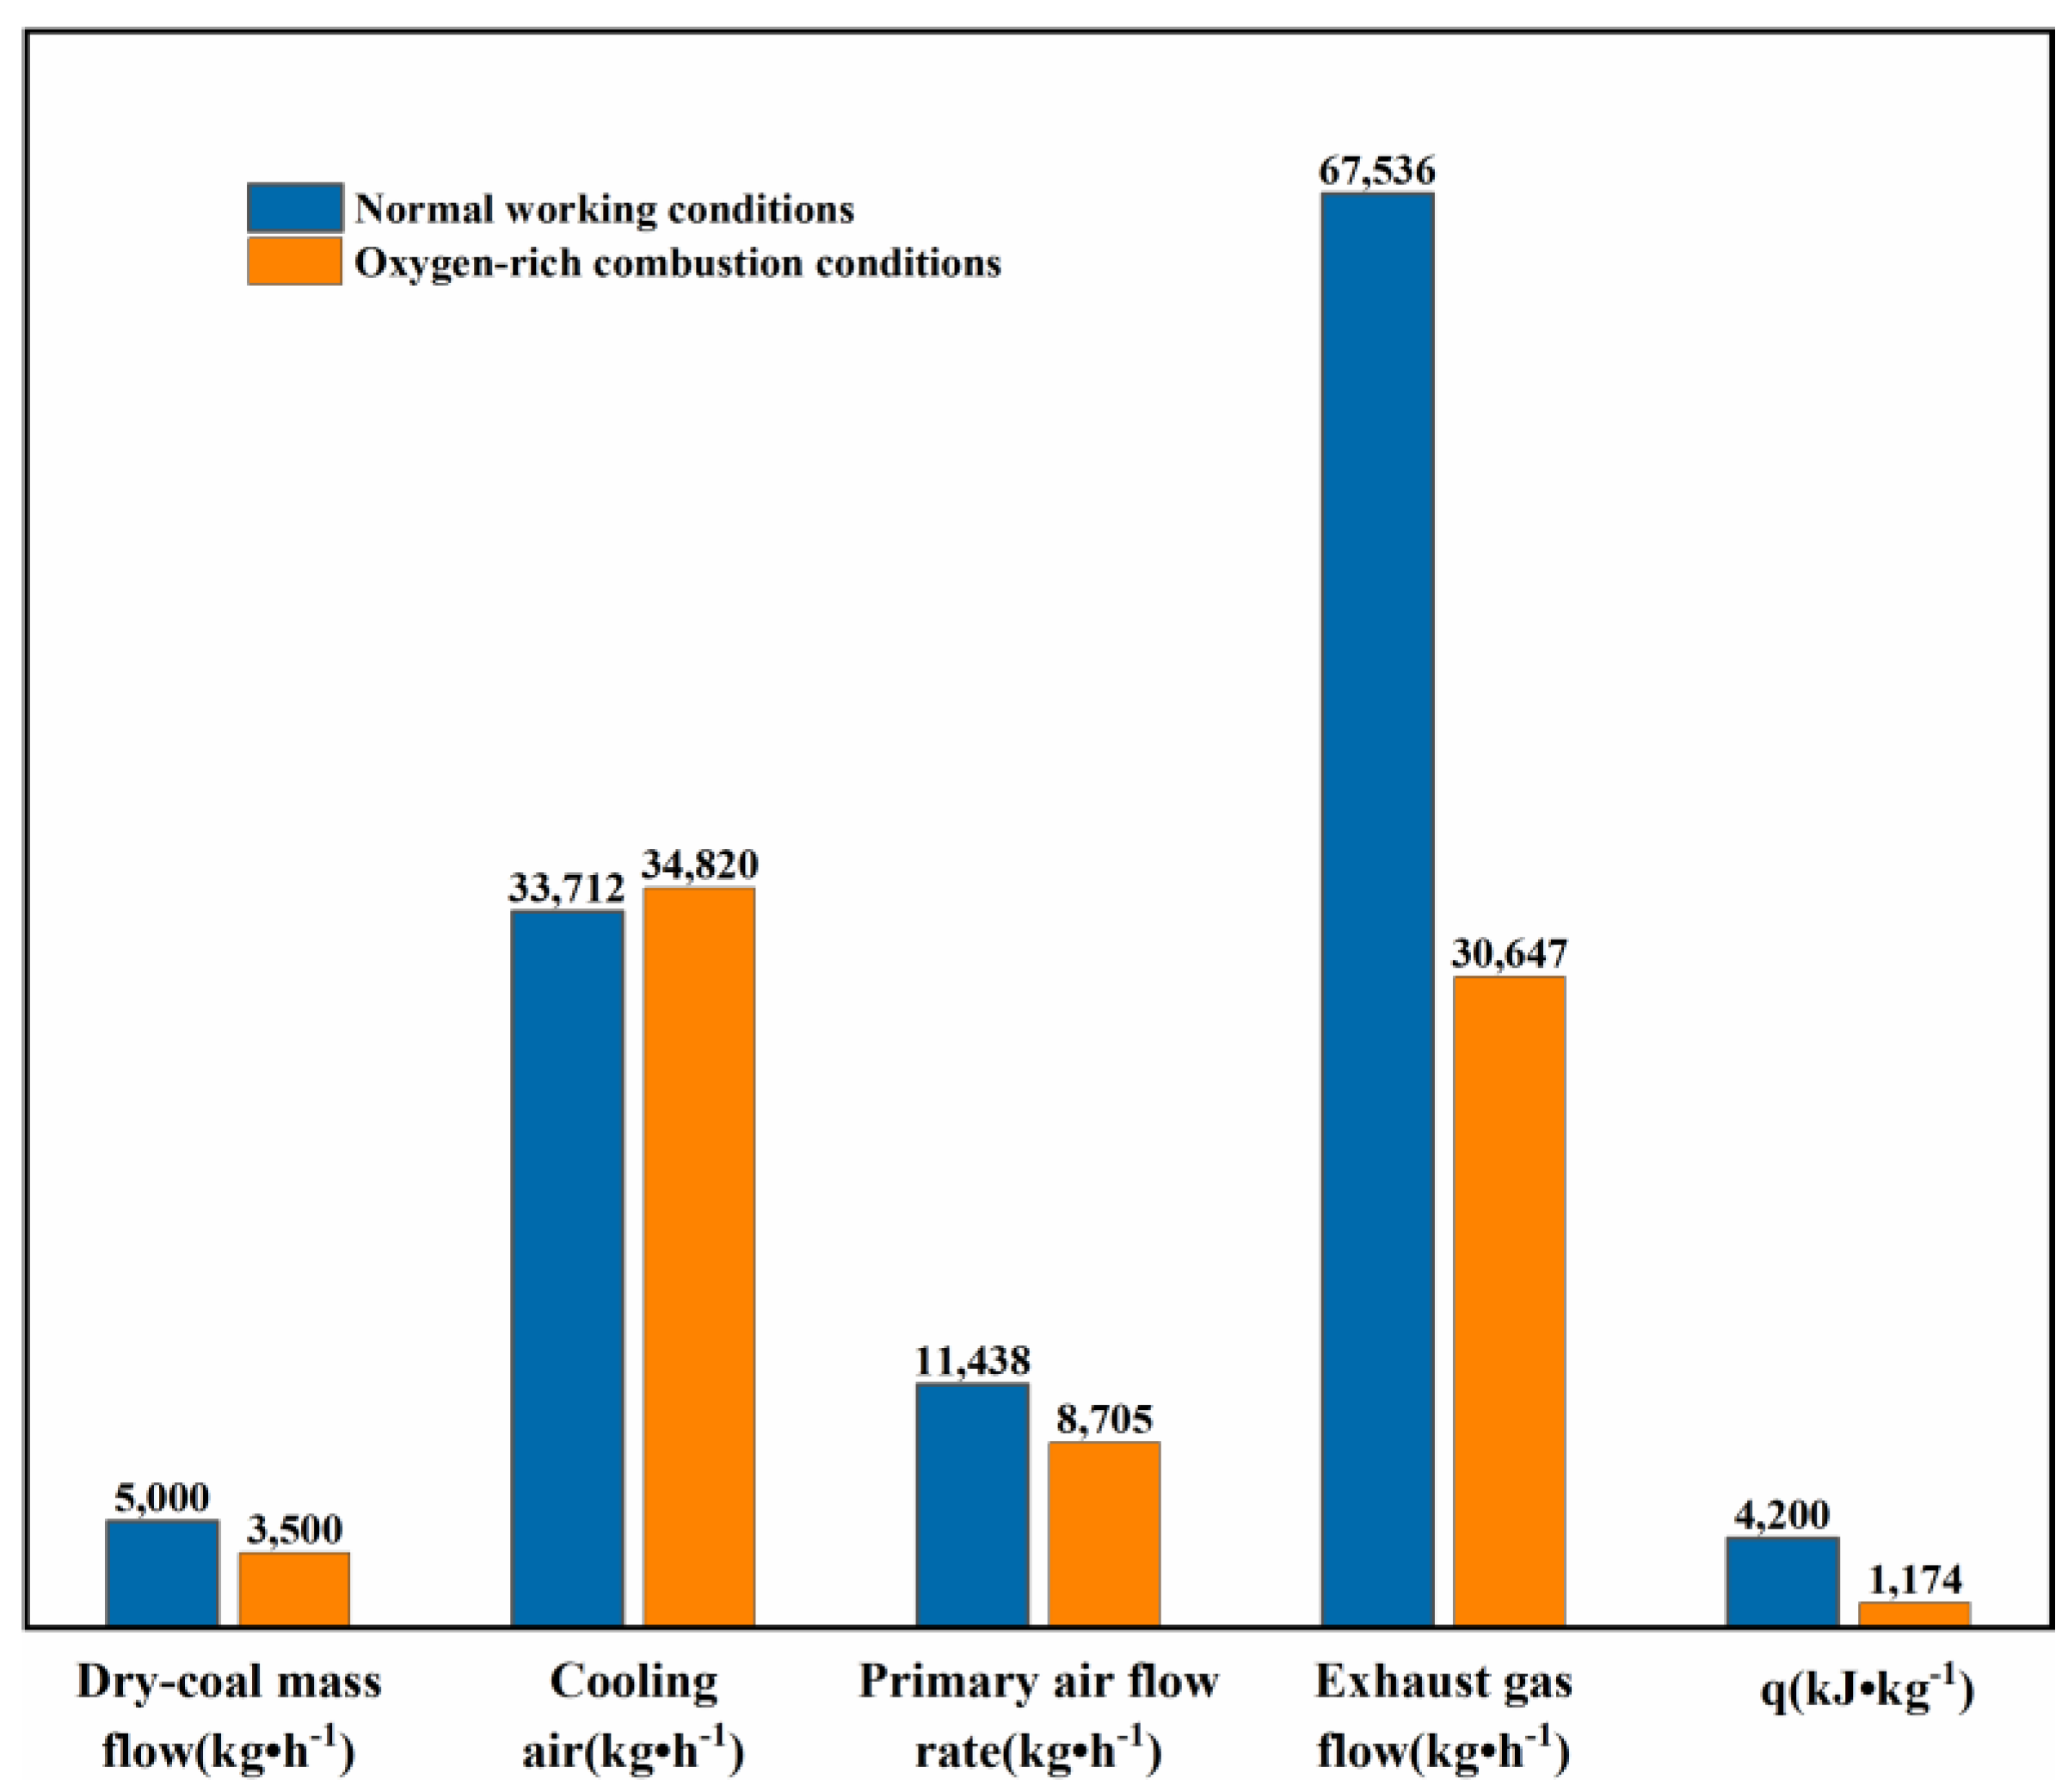
3.5. Results under Different Working Conditions

Figure 7 compares the differences in various production parameters between conventional conditions and oxygen-enriched combustion conditions. The graph shows that the coal powder feed decreased from the real operating state of 5000 kg/h to 3500 kg/h under the oxygen-rich condition, saving almost 30% of the coal. However, if the actual combustion efficiency and heat losses are taken into account, it should be lower than this. In addition, the specific energy consumption decreases from 4200 kJ/kg coal to 1174 kJ/kg coal. The primary air flow rate reduces from 11,438 kg/h to 8750 kg/h, owing to the lower gas supply volume under pure oxygen circumstances. The secondary air flow rate is reasonably close, since the circulating flue gas is important for recovering the heat of the clinker and increasing the heat transfer properties of the kiln. The exhaust gas flow rate decreases from 67,536 kg/h to 30,647 kg/h, which is a reduction of 54.6%. In the oxygen-enriched combustion process, the source of the secondary air shifts from air to circulating flue gas, resulting in a considerable drop in the exhaust gas flow rate. At the same time, the decreased exhaust gas flow rate helps to minimize the energy consumption in the later CO2 collection operation.
Table 6 shows a comparison of various components in the exhaust gas under normal operating conditions and oxygen-enriched combustion conditions. From the table, it can be observed that the mass fraction of CO2 in the exhaust gas is 94.828% under oxygen-enriched combustion circumstances, whereas the mass fraction of CO2 at normal operating settings is only 34.642%. This creates suitable circumstances for a later CO2 collection and may considerably lower the cost of collecting CO2 in cement kilns. Due to the employment of high-purity oxygen as a combustion helper, the content of N2 drops, resulting in reductions in the amounts of NO and NO2. The increases in SO2 and SO3 may be due to the favorable conditions for the formation of SO2 under higher combustion zone temperature under oxygen-enriched combustion conditions. In addition, the percentage of N2 in the exhaust gas under oxygen-enriched combustion circumstances reduces dramatically to 0.318%, whereas the mass fraction of N2 under normal operating settings is 63.534%. During the production process, a considerable amount of heat is used to heat N2, which is then lost in a subsequent heat transfer, resulting in a decrease in the overall system thermal efficiency.

4. Exergy Analysis of Production Process

4.1. Exergy Analysis and Calculation Method

Energy analysis and exergy analysis are excellent thermodynamic analytical methodologies. Energy analysis is based on the first rule of thermodynamics, quantitatively revealing the energy transmission in the system. In contrast, energy analysis employs the second rule of thermodynamics to assess energy from a mass viewpoint. It may also pinpoint the origins and locations of thermodynamic losses [46,47]. Energy analysis is crucial for assessing industrial process systems in the context of sustainable energy development [48,49]. Therefore, in this part, the performance of the oxygen-enriched combustion cement manufacturing system is analyzed utilizing the benefits of exergy analysis. The exergy balance of the whole system was computed using the following equation:
in   E i n , j + E Q = out   E o u t , j + W + E d , j
where Ein and Eout, respectively, indicate the exergy flow rates entering and exiting each unit of the process, kW; Ed,j denotes the exergy destruction rate of subsystem j, kW; and W stands for the shaft power of compressors and pumps, kW. The environmental reference for exergy was specified as T0 = 301.15 K and P0 = 101.325 kPa (the average ambient temperature and pressure during system operation). EQ signifies the heat exergy entering the system, kW, and its calculation formula is as follows:
E Q = 1 T 0 T Q
The physical exergy flow rate EPH is
E P H = F h i h 0 T 0 s i s 0
where F represents the molar flow rate of the stream, mol/h; hi stands for the specific enthalpy of the stream, kJ/mol; si denotes the specific entropy of the stream, kJ/(mol/K); h0 is the specific enthalpy at the reference state, kJ/mol; and s0 is the specific entropy at the reference state, kJ/(mol/K). The exergy value of a process unit or stream, under the condition that there are no substantial changes in velocity and elevation between the intake and output, was determined by adding the physical and chemical exergy changes together. This is stated as follows:
E = E P H + E K N + E P T + E C H
The kinetic and potential exergies of the system in this investigation may be disregarded:
E = E P H + E C H
The cement production process involves the flow of solid and gas mixtures at different temperatures and pressures. Additionally, various chemical reactions occur within the kiln system. The chemical exergy of several ideal gas combinations [50,51] was calculated as follows:
e M I G C H = i = 1 n   x i e i C H + R T o i = 1 n   x i l n x i
For multi-component mixtures, their chemical exergy [52] is
e C H = L o i = 1 n   x 0 , i e C H , o l + V o i = 1 n   y 0 , i e C H , o v
where Lo and Vo represent the liquid-phase and vapor-phase flow rates of n components, respectively. eCH,ol and eCH,ov denote the standardized chemical exergies of the liquid-phase and vapor-phase components. X0,I and y0,i, respectively, indicate the liquid and gas molar fractions of the stream. Th total exergy efficiency of the entire system is expressed as
η t o t = E o u t , tot E i n , tot = 1 E d , t o t + E l , tot E F , tot
The exergy efficiency of the subsystem is expressed as
η i = E i n , i   E o u t ,   i  
and the exergy destruction ratio is expressed as
γ i = E d , i i = 1 n   E d , i
The exergy efficiency of process units in the design may be assessed by examining the exergy information, which includes both the physical and chemical exergies of each process stream. This information is shown in Table 7. The method assumes that the exergy variations resulting from heat loss in each process unit and mixing operations are not taken into account. The chemical exergy value of coal was determined using the following calculation [53]:
E c o a l = 363.439 × C ( % ) + 1075.633 × H ( % ) 86.308 × O ( % ) + 4.417 × N ( % ) 190.798 × S ( % ) 21.1 × Ash ( % )  

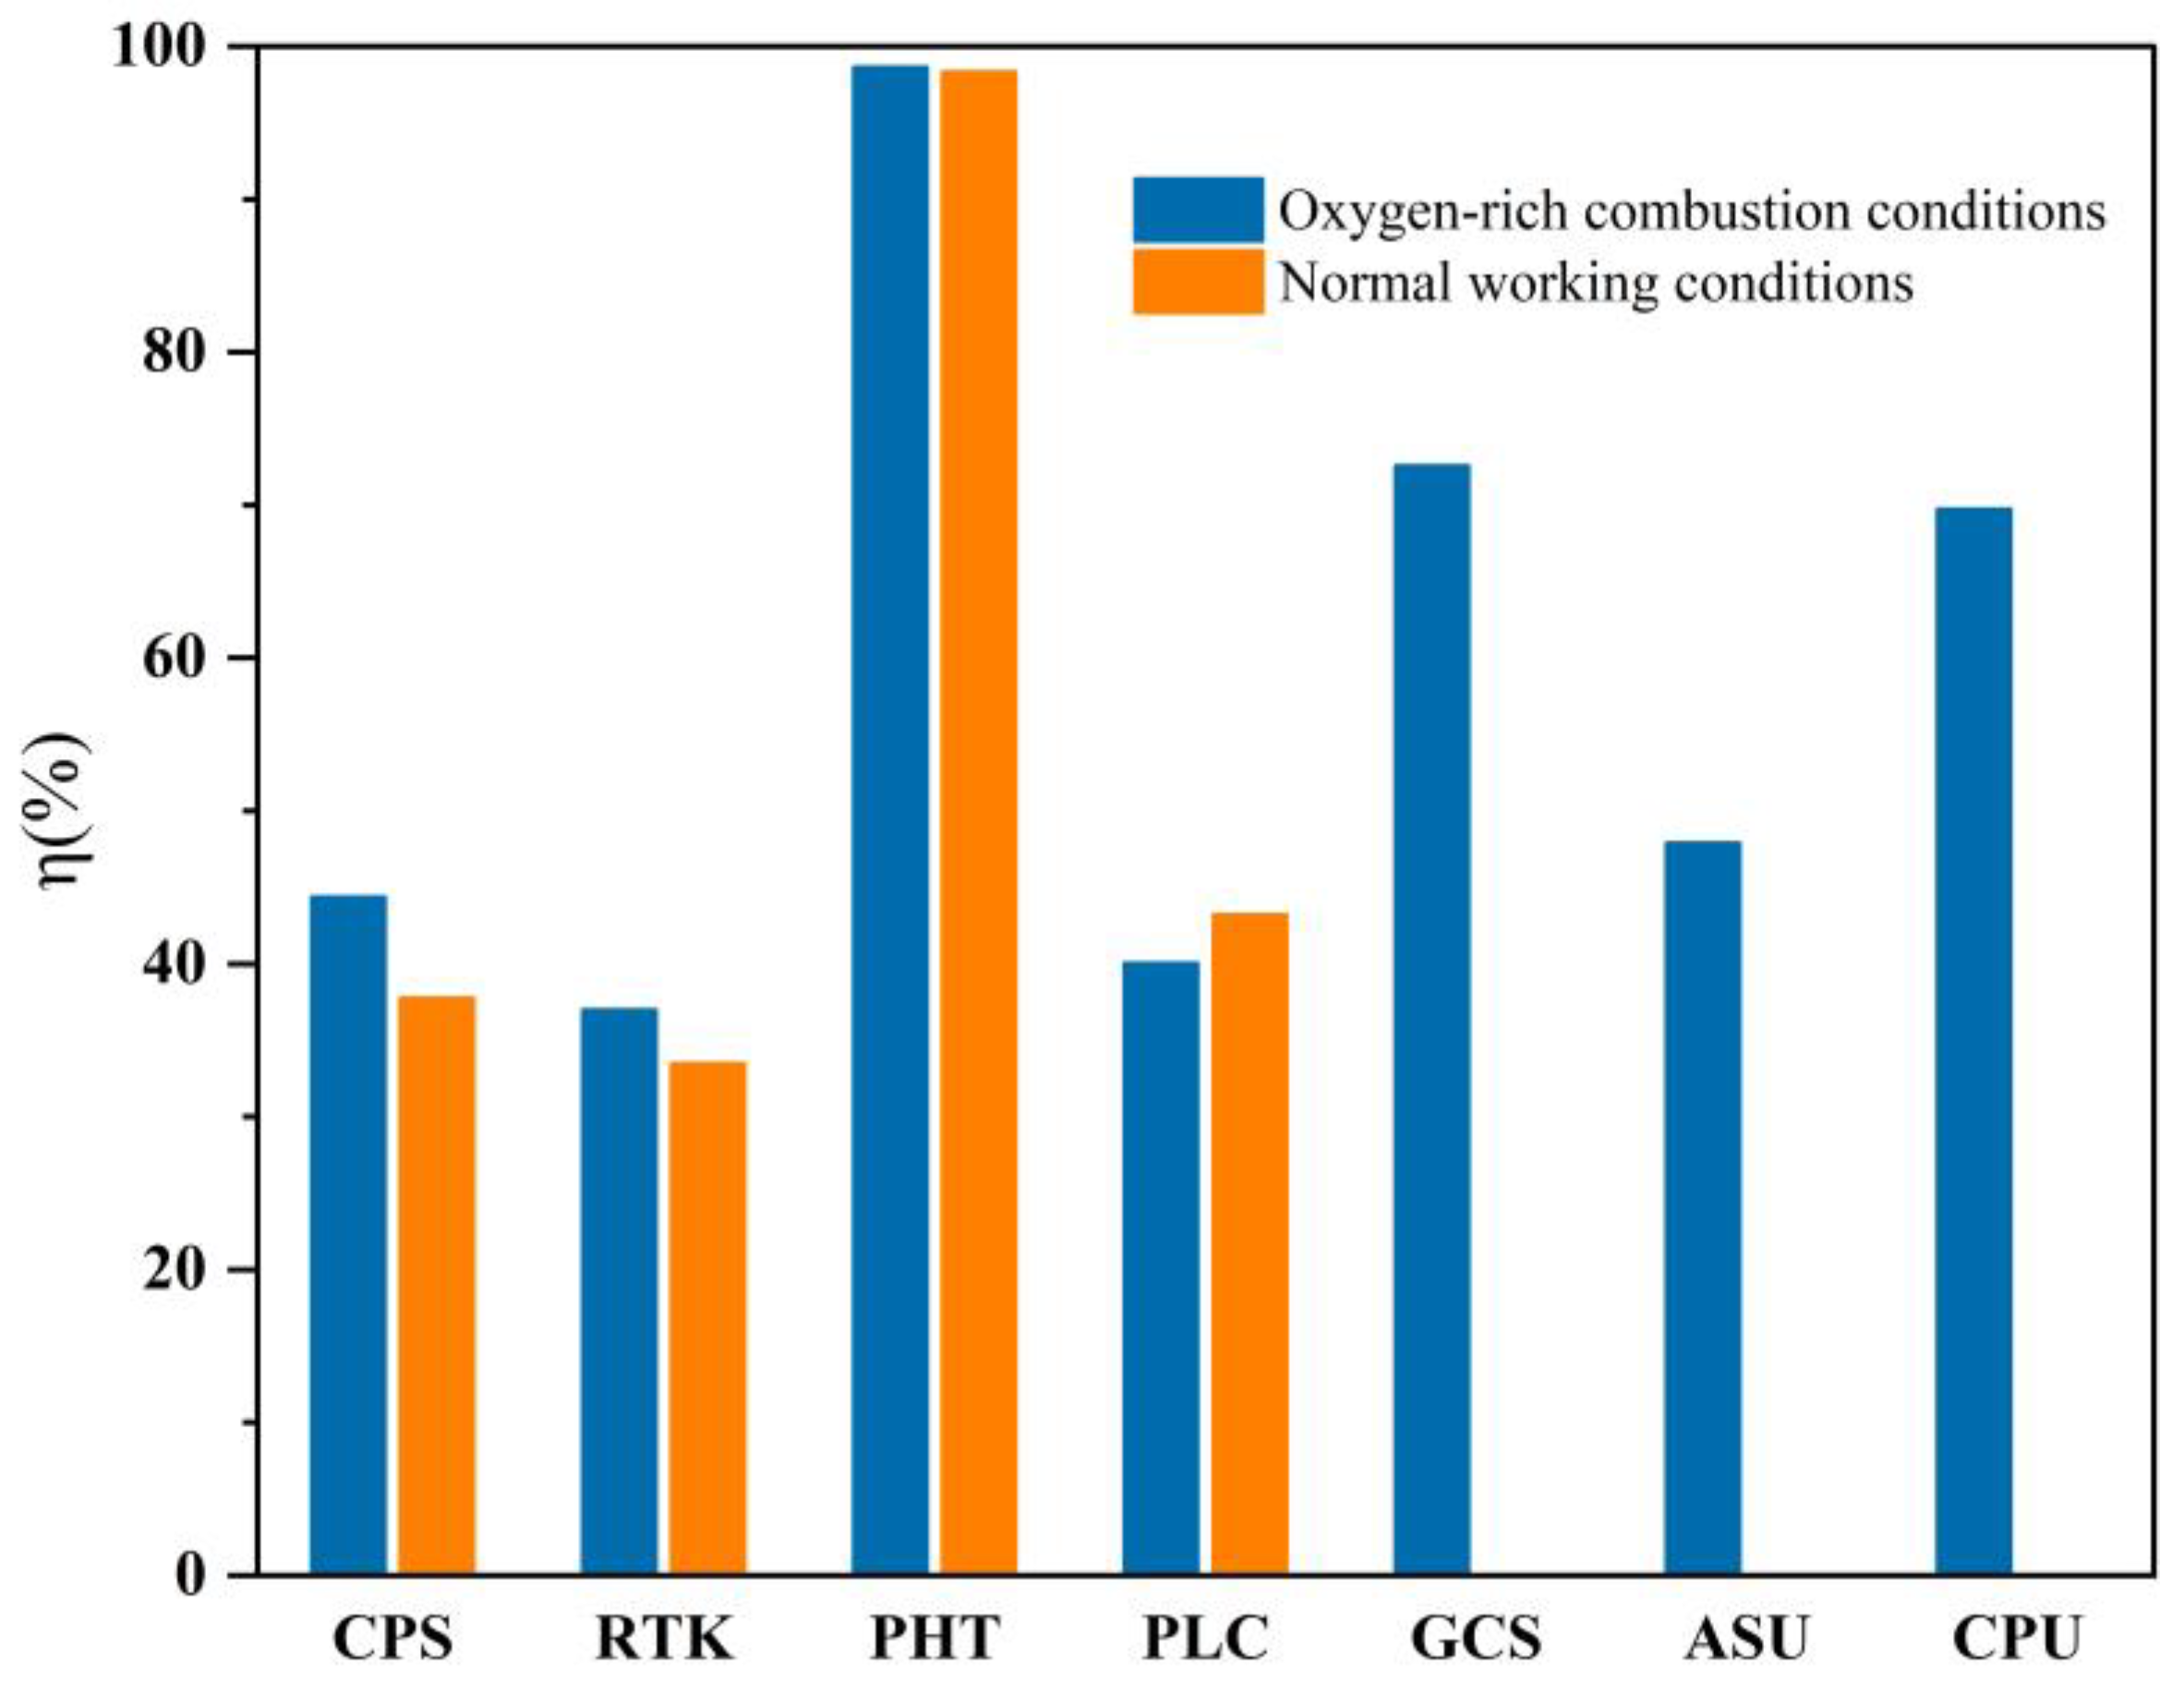
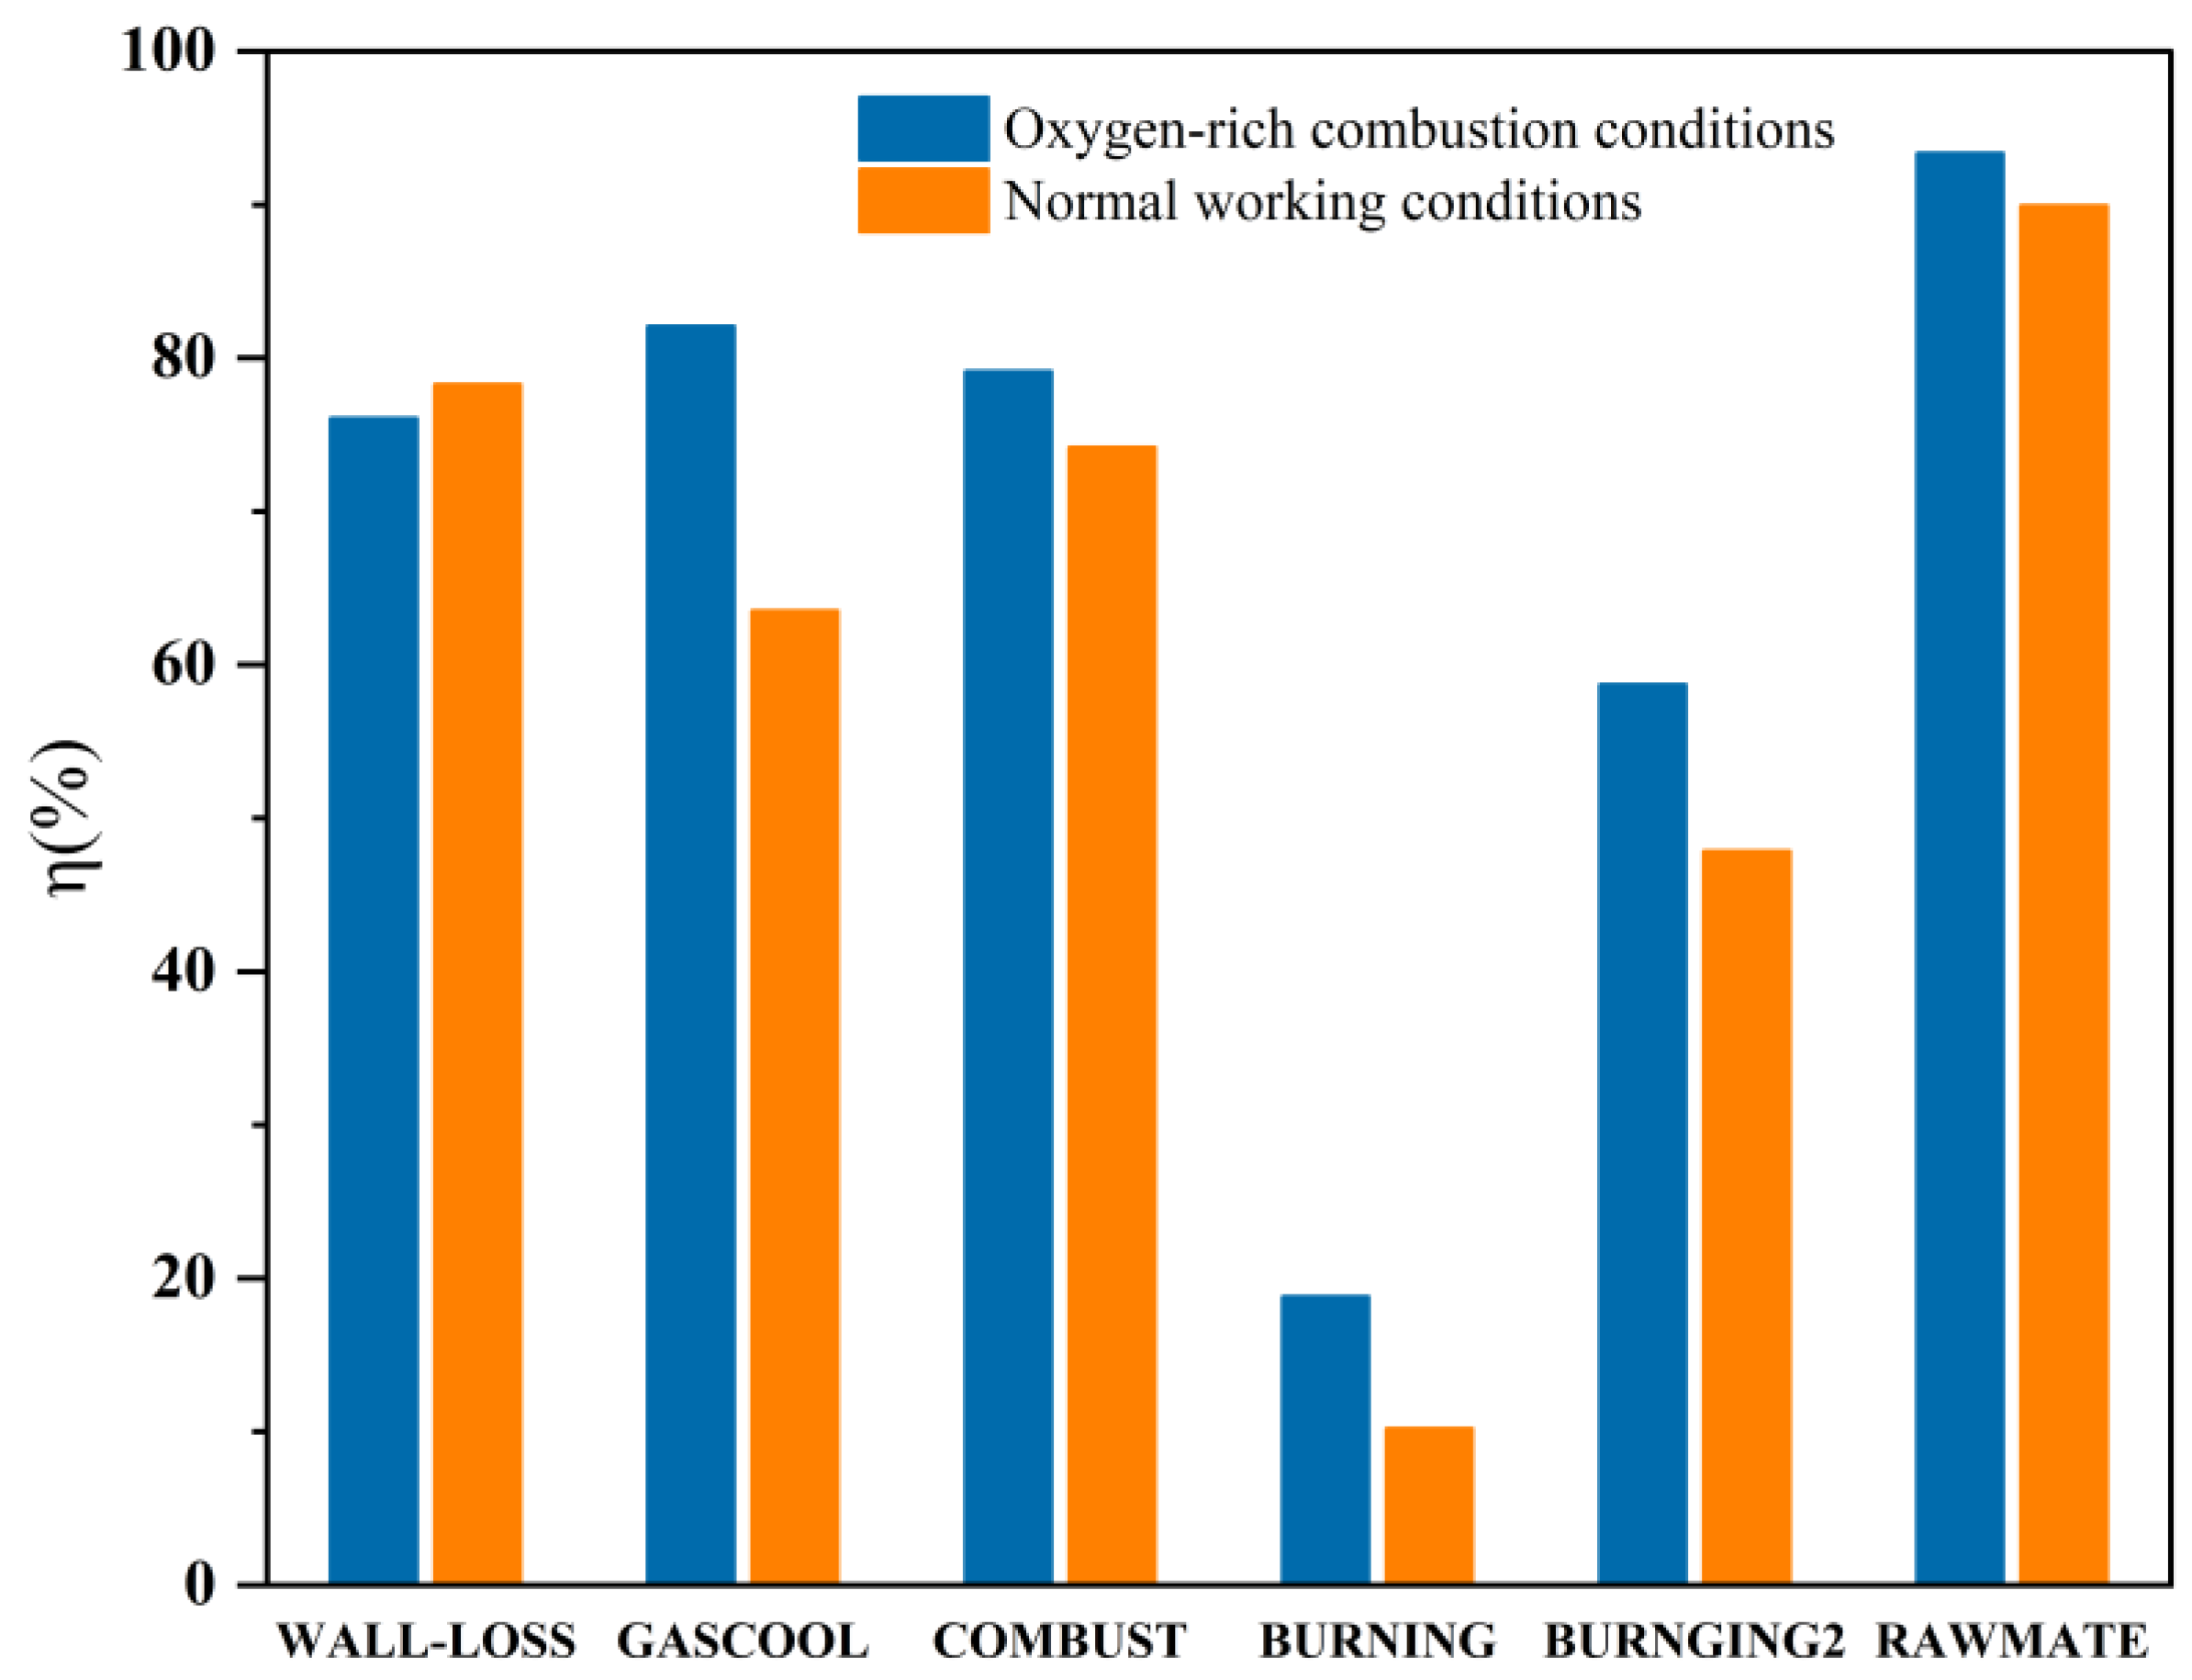
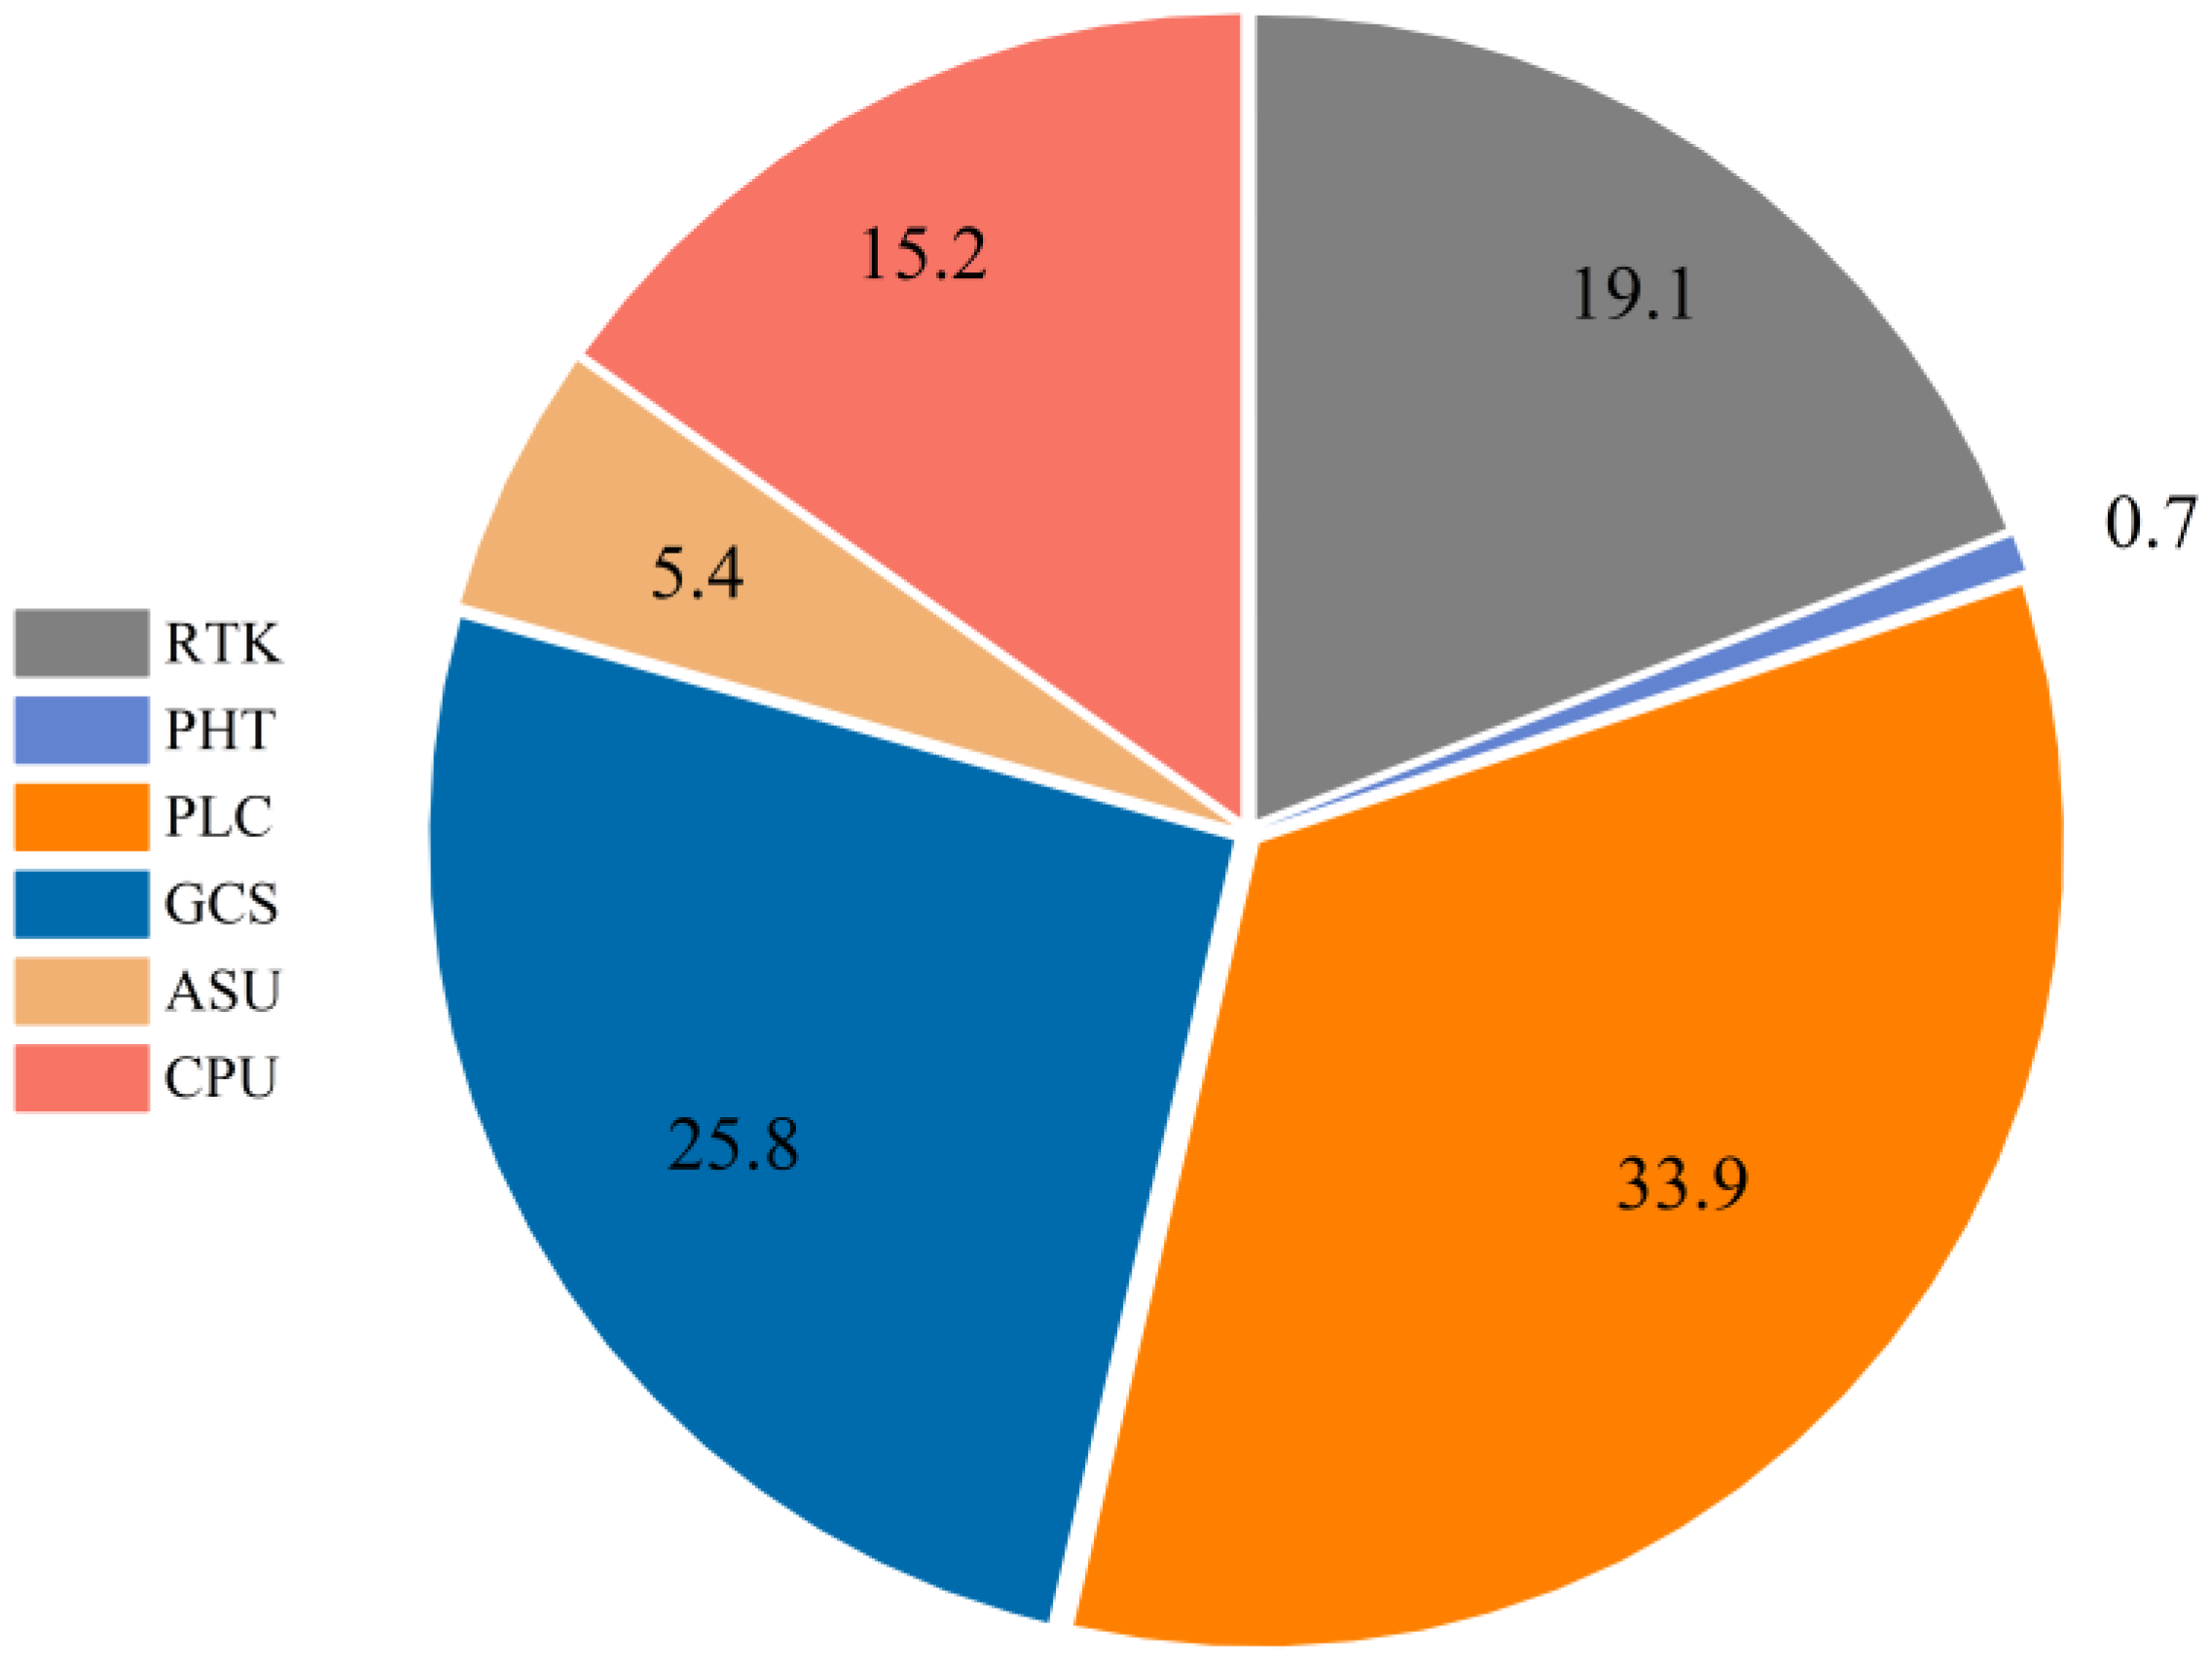
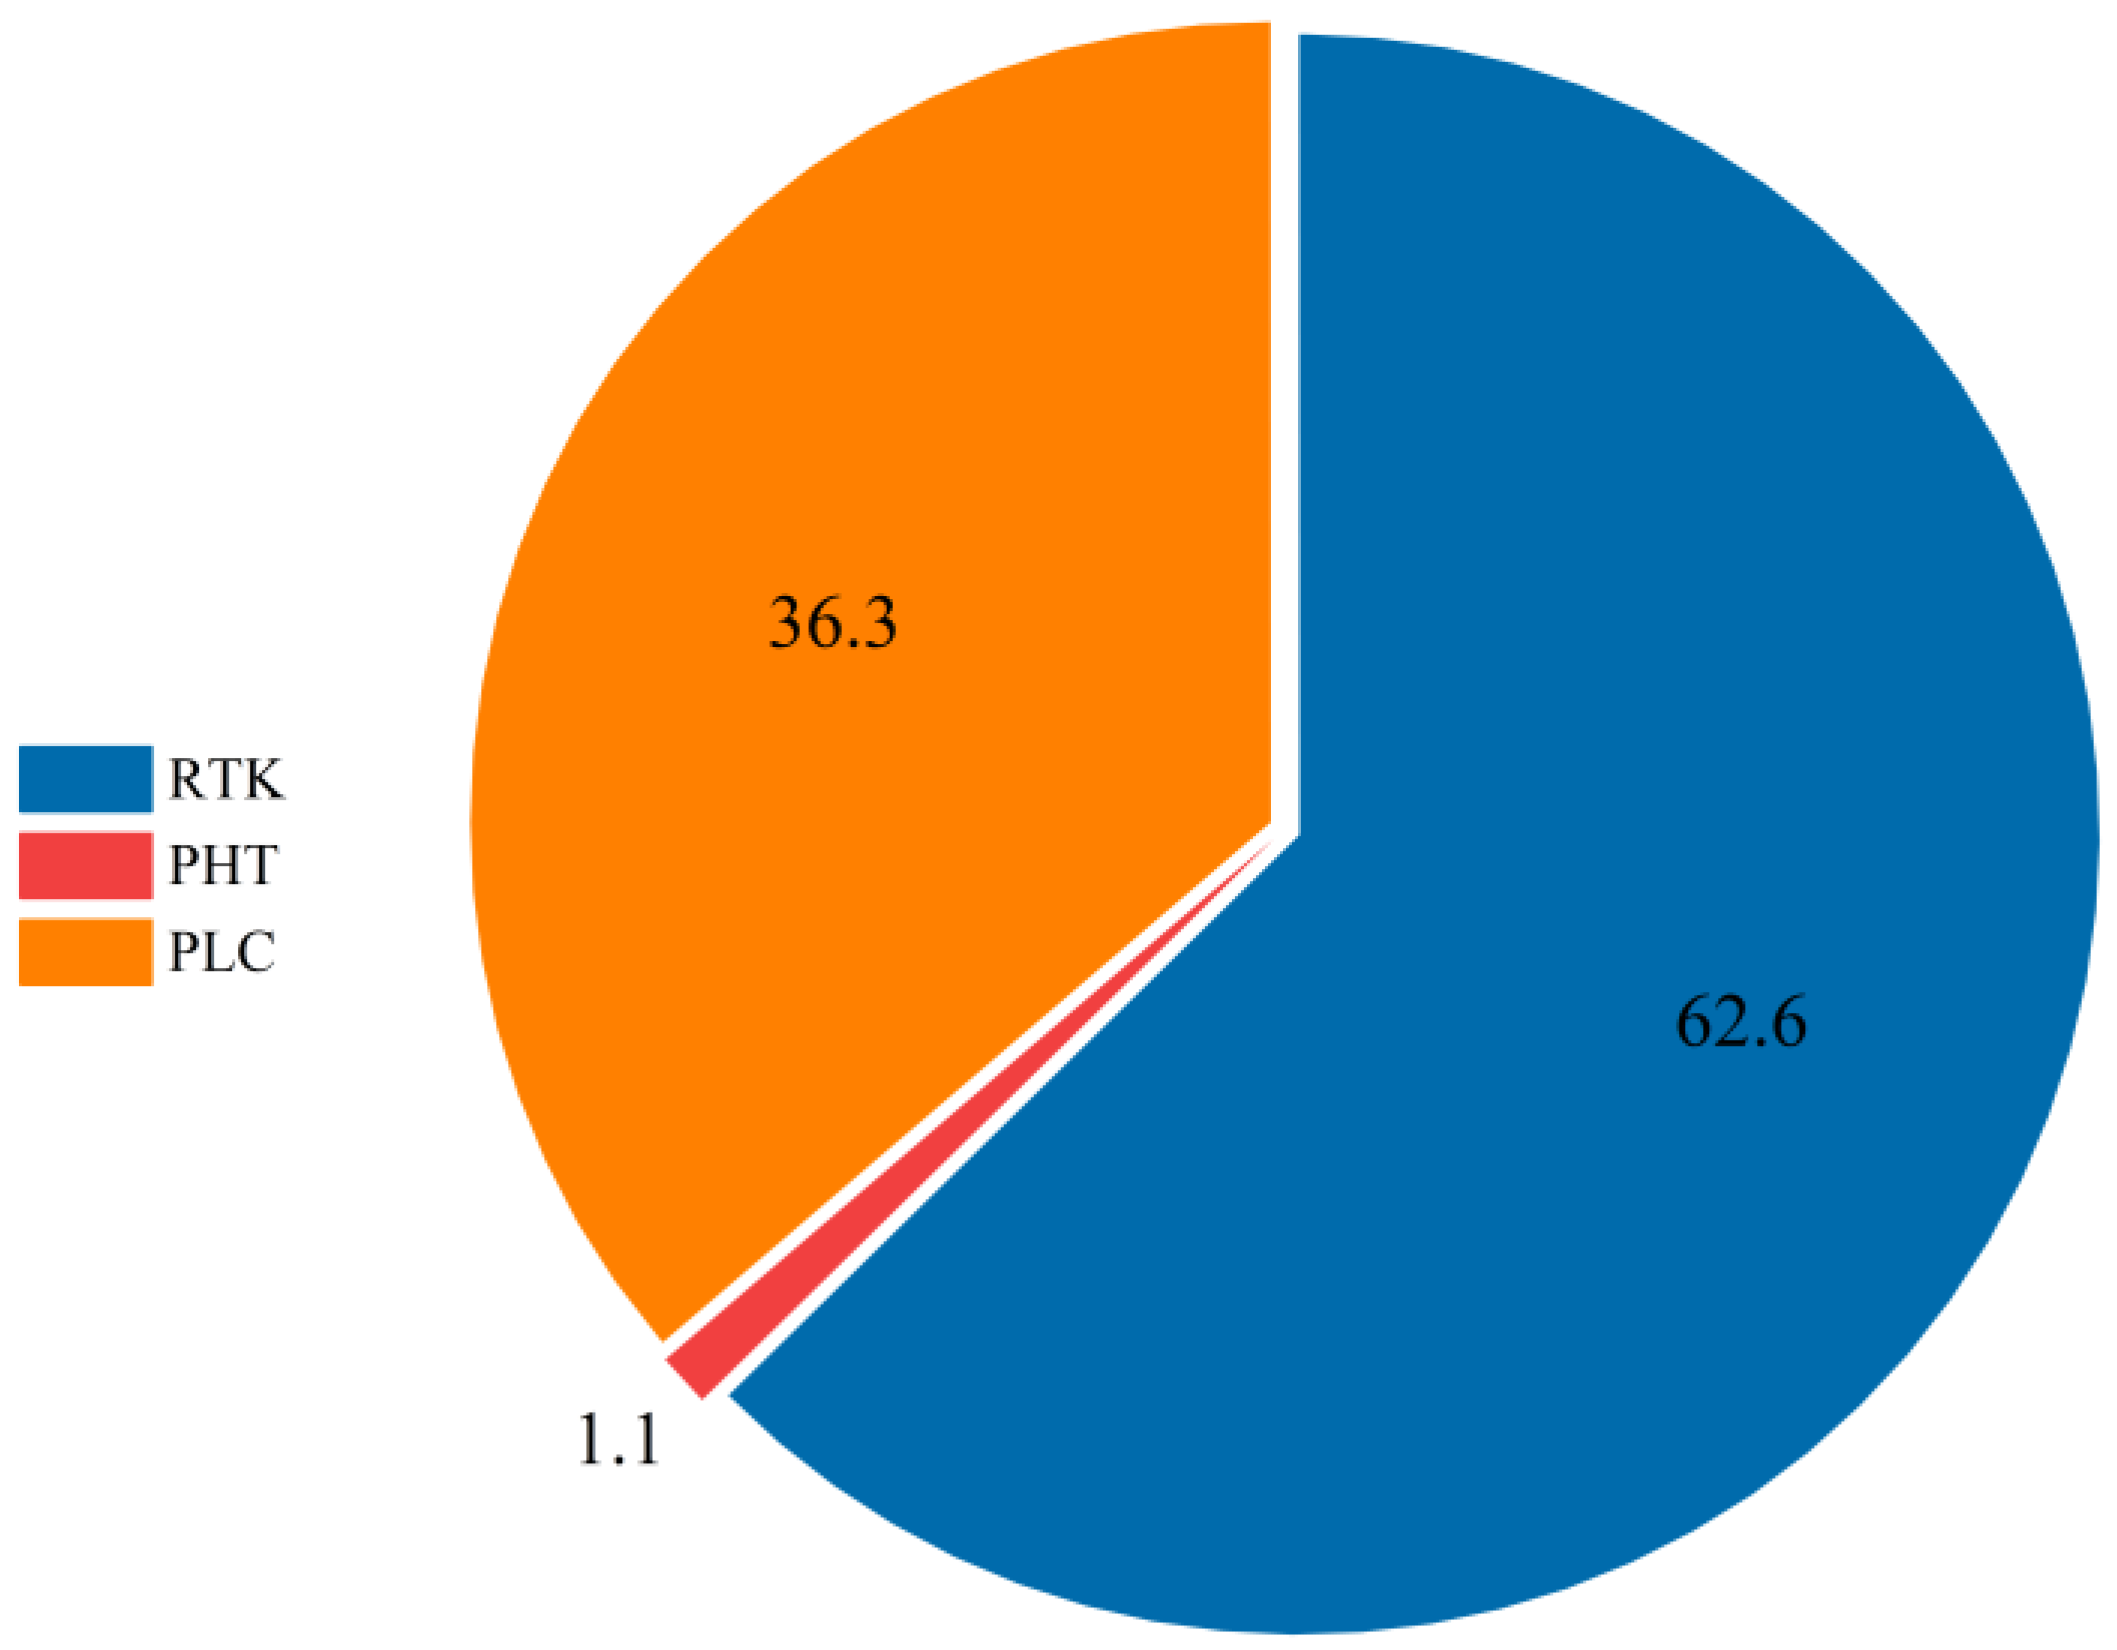
4.2. Exergy Analysis and Discussion

The whole system’s mass and energy balance were computed using a simulator. In addition, the exergy efficiency and exergy destruction rates of both the overall system and each individual subsystem were computed using the reference environmental model established by Morris and Szargut [54]. This analysis helped identify specific locations within the system where improvements might be made.
Figure 8 and Figure 9 show the exergy efficiencies of the overall system and each subsystem for the cement manufacturing process. This method includes the use of linked enhanced oxygen combustion technology and CO2 capture purification compression technology, as well as the standard cement production process. Based on these data, an exergy evaluation was undertaken for the process. For the complete cement manufacturing system, the exergy efficiency of the traditional production process was 37.75%, whereas the system’s exergy efficiency after linked enhanced oxygen combustion improved to 44.38%, an increase of roughly 17.56%. Figure 7 and Table 6 indicate that in using high-purity oxygen instead of air, the exhaust gas flow and N2 content decreased significantly, thereby reducing the exergy efficiency drop caused by heat loss. Moreover, pure oxygen enhances coal combustion, improving thermal efficiency, resulting in higher exergy efficiency for COMBUST under enriched oxygen combustion conditions. In other subsystems, the exergy efficiency of the cryogenic air separation system is poor owing to repetitive operations of compression, decompression, and heat exchange, considerably lowering the system’s exergy efficiency. The PHT (preheater tower) subsystem employs a more idealized model and involves no chemical reactions, thus exhibiting a high exergy efficiency with almost no energy loss. The BURNING reactor demonstrates a lower exergy efficiency, as it simulates the sintering stage of the kiln involving complex physical and chemical changes, resulting in significant exergy losses. Except for the WALL-LOSS module, the exergy efficiencies of all other modules have shown improvement.
Figure 10 and Figure 11 exhibit the exergy destruction ratios of several subsystems in the cement manufacturing process. In the cement production process employing coupled enriched oxygen combustion technology, the smoke cooling system and smoke circulation system exhibit higher proportions of exergy destruction due to significant heat losses in these two processes. Therefore, developing better techniques to recover heat from clinker and lowering heat losses in the smoke circulation process will effectively decrease the exergy destruction rate of the system. In the case of the typical manufacturing process, the rotary kiln system displays the greatest exergy destruction ratio owing to irreversible exergy losses generated by chemical reactions and gas–solid heat transfer processes.

5. Conclusions

In this study, the traditional cement production process was combined with low-temperature air separation technology and carbon dioxide purification and compression technology to deal with the high emission, low carbon dioxide concentration, high pollutant content and high carbon capture difficulty in the cement production process. A complete production model was established using Aspen Plus V11 software, and a sensitivity analysis of related production parameters was carried out. An exergy analysis of the whole furnace system revealed the major energy loss sources in the traditional production process, and revealed improvement measures, which provide a way for the technical transformation of the cement industry. The results indicate that following the adoption of coupled enriched oxygen combustion technology, with the same raw material treatment volume, the overall coal consumption was reduced by approximately 30%, and the specific energy consumption (q) decreased by about 72%. Simultaneously, there was a decrease of around 54.6% in the exhaust gas flow rate, with the CO2 mass fraction in the exhaust gas rising to 94.83%. A further exergy analysis found a 17.56% improvement in the total exergy efficiency of the kiln system compared to the traditional method, where the RTK (Rotary kiln) and PHT subsystems demonstrated better exergy efficiencies in the enriched oxygen combustion process. However, the cryogenic air separation subsystem in the ancillary system showed a lower exergy efficiency. Additionally, an analysis of the exergy destruction ratio indicated significant exergy losses in the clinker cooling system and the smoke circulation system in the enriched oxygen combustion process. Thus, minimizing heat losses in these two systems might effectively reduce the energy consumption of the overall system. In contrast, for the traditional process, the rotary kiln system was the major source of exergy losses, highlighting its potential for development. Future work will emphasize studying the process of integrating novel oxygen supply systems and CO2 capture systems, along with the need for an economic evaluation to verify the industrial potential of this process.

Author Contributions

Conceptualization, B.S. and L.W.; methodology, L.W.; software, L.W.; validation, L.W.; formal analysis, L.W.; investigation, L.W.; resources, B.S.; writing—original draft preparation, L.W.; writing—review and editing, B.S.; project administration, B.S. All authors have read and agreed to the published version of the manuscript.

Funding

This work is financially supported by the National Key Research and Development Program of China (No. 2019YFC1904900).

Data Availability Statement

The data that support the findings of this study are available from the corresponding author upon reasonable request.

Acknowledgments

Thanks are given for the support provided by the National Key Research and Development Program of China.

Conflicts of Interest

The authors declare no conflicts of interest.

Nomenclature

GGibbs free energy W power of compressors and pumps
qspecific heat energy consumptionξminimum Gibbs free energy
LHVlower heating value m f raw feed flow
Fmolar flow rate m c o a l coal mass flow
CPScement production system h i specific enthalpy
RTKrotary kiln h 0 specific enthalpy at the reference state
PHTpreheater tower s i specific entropy
PLCplanetary clinker cooler s 0 specific entropy at the reference state
GCSgas recycle system e C H chemical exergy
ASUair separation unit e M I G C H chemical exergy of various ideal gas mixtures
CPUCO2 purification unit L o liquid-phase flow rates
Einexergy flow rates entering V o vapor-phase flow rates
Eoutexergy flow rates leaving x i molar fraction
Ed,jexergy destruction rate x 0 , i liquid-phase molar fraction
EQheat exergy y 0 , i vapor-phase molar fraction
EPHphysical exergy flow rate e C H , o l chemical exergies of liquid-phase
E C H chemical exergy flow rate e C H , o v chemical exergies of vapor-phase
E K N kinetic exergy flow rate η t o t total exergy efficiency
E P T potential exergy flow rate η i exergy efficiency of the subsystem
E c o a l chemical exergy of coal γ i exergy destruction ratio
R ideal gas constant

References

  1. Supriya; Chaudhury, R.; Sharma, U.; Thapliyal, P.C.; Singh, L.P. Low-CO2 emission strategies to achieve net zero target in cement sector. J. Clean. Prod. 2023, 417, 137466. [Google Scholar] [CrossRef]
  2. Dziejarski, B.; Krzyżyńska, R.; Andersson, K. Current status of carbon capture, utilization, and storage technologies in the global economy: A survey of technical assessment. Fuel 2023, 342, 127776. [Google Scholar] [CrossRef]
  3. Bhavsar, A.; Hingar, D.; Ostwal, S.; Thakkar, I.; Jadeja, S.; Shah, M. The current scope and stand of carbon capture storage and utilization—A comprehensive review. Case Stud. Chem. Environ. Eng. 2023, 8, 100368. [Google Scholar] [CrossRef]
  4. Theo, W.L.; Lim, J.S.; Hashim, H.; Mustaffa, A.A.; Ho, W.S. Review of pre-combustion capture and ionic liquid in carbon capture and storage. Appl. Energy 2016, 183, 1633–1663. [Google Scholar] [CrossRef]
  5. Wang, M.; Joel, A.S.; Ramshaw, C.; Eimer, D.; Musa, N.M. Process intensification for post-combustion CO2 capture with chemical absorption: A critical review. Appl. Energy 2015, 158, 275–291. [Google Scholar] [CrossRef]
  6. Shen, M.; Tong, L.; Yin, S.; Liu, C.; Wang, L.; Feng, W.; Ding, Y. Cryogenic technology progress for CO2 capture under carbon neutrality goals: A review. Sep. Purif. Technol. 2022, 299, 121734. [Google Scholar] [CrossRef]
  7. Yin, C.; Yan, J. Oxy-fuel combustion of pulverized fuels: Combustion fundamentals and modeling. Appl. Energy 2016, 162, 742–762. [Google Scholar] [CrossRef]
  8. Scholes, C.A.; Smith, K.H.; Kentish, S.E.; Stevens, G.W. CO2 capture from pre-combustion processes—Strategies for membrane gas separation. Int. J. Greenh. Gas Control 2010, 4, 739–755. [Google Scholar] [CrossRef]
  9. Li, X.; Zhang, L.; Luo, C.; Zhang, Z.; Xu, Y.; Zheng, C. Experimental Investigation and Process Simulation of Oxy-fuel Flue Gas Denitrification in CO2 Compression Process. Energy Fuels 2018, 32, 11666–11673. [Google Scholar] [CrossRef]
  10. Gkotsis, P.; Peleka, E.; Zouboulis, A. Membrane-Based Technologies for Post-Combustion CO2 Capture from Flue Gases: Recent Progress in Commonly Employed Membrane Materials. Membranes 2023, 13, 898. [Google Scholar] [CrossRef]
  11. Julio, A.A.V.; Castro-Amoedo, R.; Maréchal, F.; González, A.M.; Escobar Palacio, J.C. Exergy and economic analysis of the trade-off for design of post-combustion CO2 capture plant by chemical absorption with MEA. Energy 2023, 280, 128004. [Google Scholar] [CrossRef]
  12. Cormos, A.-M.; Dragan, S.; Petrescu, L.; Sandu, V.; Cormos, C.-C. Techno-Economic and Environmental Evaluations of Decarbonized Fossil-Intensive Industrial Processes by Reactive Absorption & Adsorption CO2 Capture Systems. Energies 2020, 13, 1268. [Google Scholar]
  13. Plaza, M.G.; Martínez, S.; Rubiera, F. CO2 Capture, Use, and Storage in the Cement Industry: State of the Art and Expectations. Energies 2020, 13, 5692. [Google Scholar] [CrossRef]
  14. Fan, Y.; Si, P. The Study of Numerical Simulation of Oxygenenriched Burner System. CFD Lett. 2010, 2, 197–207. [Google Scholar]
  15. Zhou, S.; Li, S.; Ouyang, D.; Wang, S. Increase in Energy Efficiencies. In Handbook of Air Quality and Climate Change; Springer: Berlin/Heidelberg, Germany, 2023; pp. 1–32. [Google Scholar]
  16. Buhre, B.J.P.; Elliott, L.K.; Sheng, C.D.; Gupta, R.P.; Wall, T.F. Oxy-fuel combustion technology for coal-fired power generation. Prog. Energy Combust. Sci. 2005, 31, 283–307. [Google Scholar] [CrossRef]
  17. Carrasco-Maldonado, F.; Spörl, R.; Fleiger, K.; Hoenig, V.; Maier, J.; Scheffknecht, G. Oxy-fuel combustion technology for cement production—State of the art research and technology development. Int. J. Greenh. Gas Control 2016, 45, 189–199. [Google Scholar] [CrossRef]
  18. Murphy, J.J.; Shaddix, C.R. Combustion kinetics of coal chars in oxygen-enriched environments. Combust. Flame 2006, 144, 710–729. [Google Scholar] [CrossRef]
  19. Wang, M.; Liao, B.; Liu, Y.; Wang, S.; Qing, S.; Zhang, A. Numerical simulation of oxy-coal combustion in a rotary cement kiln. Appl. Therm. Eng. 2016, 103, 491–500. [Google Scholar] [CrossRef]
  20. Marin, O.; Charon, O.; Dugue, J.; Dukhan, S.; Zhou, W.E.I. Simulating the Impact of Oxygen Enrichment in a Cement Rotary Kiln Using Advanced Computational Methods. Combust. Sci. Technol. 2001, 164, 193–207. [Google Scholar] [CrossRef]
  21. Granados, D.A.; Chejne, F.; Mejía, J.M.; Gómez, C.A.; Berrío, A.; Jurado, W.J. Effect of flue gas recirculation during oxy-fuel combustion in a rotary cement kiln. Energy 2014, 64, 615–625. [Google Scholar] [CrossRef]
  22. Ditaranto, M.; Bakken, J. Study of a full scale oxy-fuel cement rotary kiln. Int. J. Greenh. Gas Control 2019, 83, 166–175. [Google Scholar] [CrossRef]
  23. Magli, F.; Spinelli, M.; Fantini, M.; Romano, M.C.; Gatti, M. Techno-economic optimization and off-design analysis of CO2 purification units for cement plants with oxyfuel-based CO2 capture. Int. J. Greenh. Gas Control 2022, 115, 103591. [Google Scholar] [CrossRef]
  24. Cormos, C.-C. Decarbonization options for cement production process: A techno-economic and environmental evaluation. Fuel 2022, 320, 123907. [Google Scholar] [CrossRef]
  25. John, J.P. Parametric Studies of Cement Production Processes. J. Energy 2020, 2020, 4289043. [Google Scholar] [CrossRef]
  26. Ren, C.Y.; Yang, Y.; Liu, Y.; Kao, H.T. Process Simulation of Alkali Chloride Sulfur Cycle and Enrichment in Cement Precalcination System. Bull. Chin. Ceram. Soc. 2019, 38, 423–430. [Google Scholar]
  27. Liu, D.P.; Zhou, Y.K. Simulation and Emission Reduction Optimization of NOX Generation in Cement Kiln Based on Aspen Plus. Bull. Chin. Ceram. Soc. 2021, 40, 351–358. [Google Scholar]
  28. Belaissaoui, B.; Le Moullec, Y.; Hagi, H.; Favre, E. Energy Efficiency of Oxygen Enriched Air Production Technologies: Cryogeny vs. Membranes. Energy Procedia 2014, 63, 497–503. [Google Scholar] [CrossRef]
  29. Banaszkiewicz, T.; Chorowski, M.; Gizicki, W. Comparative analysis of cryogenic and PTSA technologies for systems of oxygen production. AIP Conf. Proc. 2014, 1573, 1373–1378. [Google Scholar]
  30. Mahapatra, P.; Bequette, B.W. Design and Control of an Elevated-Pressure Air Separations Unit for IGCC Power Plants in a Process Simulator Environment. Ind. Eng. Chem. Res. 2012, 52, 3178–3191. [Google Scholar] [CrossRef]
  31. Fu, C.; Gundersen, T. Using exergy analysis to reduce power consumption in air separation units for oxy-combustion processes. Energy 2012, 44, 60–68. [Google Scholar] [CrossRef]
  32. Fu, Q.; Zhu, L.; Chen, X. Complete Equation-Oriented Approach for Process Analysis and Optimization of a Cryogenic Air Separation Unit. Ind. Eng. Chem. Res. 2015, 54, 12096–12107. [Google Scholar] [CrossRef]
  33. Tranier, J.-P.; Dubettier, R.; Darde, A.; Perrin, N. Air separation, flue gas compression and purification units for oxy-coal combustion systems. Energy Procedia 2011, 4, 966–971. [Google Scholar] [CrossRef]
  34. Porter, R.T.J.; Fairweather, M.; Pourkashanian, M.; Woolley, R.M. The range and level of impurities in CO2 streams from different carbon capture sources. Int. J. Greenh. Gas Control 2015, 36, 161–174. [Google Scholar] [CrossRef]
  35. Jiang, R.; Gan, S.; Li, X.S.; Ni, H.W.; Nai, Y.J.; Li, L. Optimization Analysis of CO2 Liquefaction Purification Process Based on Oxygen Enriched Combustion. J. Chin. Soc. Power Eng. 2023, 43, 102–108. [Google Scholar]
  36. Zanganeh, K.E.; Shafeen, A.; Salvador, C.; Beigzadeh, A.; Abbassi, M. CO2 processing and multi-pollutant control for oxy-fuel combustion systems using an advanced CO2 capture and compression unit (CO2CCU). Energy Procedia 2011, 4, 1018–1025. [Google Scholar] [CrossRef]
  37. Kolster, C.; Mechleri, E.; Krevor, S.; Mac Dowell, N. The role of CO2 purification and transport networks in carbon capture and storage cost reduction. Int. J. Greenh. Gas Control 2017, 58, 127–141. [Google Scholar] [CrossRef]
  38. Yadav, S.; Mondal, S.S. A complete review based on various aspects of pulverized coal combustion. Int. J. Energy Res. 2019, 43, 3134–3165. [Google Scholar] [CrossRef]
  39. Chen, L.; Yong, S.Z.; Ghoniem, A.F. Oxy-fuel combustion of pulverized coal: Characterization, fundamentals, stabilization and CFD modeling. Prog. Energy Combust. Sci. 2012, 38, 156–214. [Google Scholar] [CrossRef]
  40. Yang, W.; Ryu, C.; Choi, S.; Choi, E.; Lee, D.; Huh, W. Modeling of Combustion and Heat Transfer in an Iron Ore Sintering Bed with Considerations of Multiple Solid Phases. ISIJ Int. 2004, 44, 492–499. [Google Scholar] [CrossRef]
  41. Yi, Z.-m.; Xiao, H.; Song, J.-l.; Ma, G.-b.; Zhou, J.-m. Mathematic simulation of heat transfer and operating optimization in alumina rotary kiln. J. Cent. South Univ. 2013, 20, 2775–2780. [Google Scholar] [CrossRef]
  42. Yi, B.; Zhang, L.; Mao, Z.; Huang, F.; Zheng, C. Effect of the particle size on combustion characteristics of pulverized coal in an O2/CO2 atmosphere. Fuel Process. Technol. 2014, 128, 17–27. [Google Scholar] [CrossRef]
  43. Liu, H.; Zailani, R.; Gibbs, B. Comparisons of pulverized coal combustion in air and in mixtures of O2/CO2. Fuel 2005, 84, 833–840. [Google Scholar] [CrossRef]
  44. Yu, M.C.; Wang, G.H.; Li, W.B.; Zhu, Z.; Li, J.; Shu, G.; Zhu, Y. Research on Formation and Influence Factors of Thermal NOX During Coke Oven Heating. Ind. Saf. Environ. Prot. 2016, 42, 75–78. [Google Scholar]
  45. Li, Y.J.; Zou, K.W.; Song, Z.G.; Li, R.D.; Chi, Y. Simulation on oxygen-enriched combustion of refuse derived fuel by aspen plus. Therm. Power Gener. 2013, 42, 65–69. [Google Scholar]
  46. Reddy, V.S.; Kaushik, S.C.; Tyagi, S.K.; Panwar, N. An Approach to Analyse Energy and Exergy Analysis of Thermal Power Plants: A Review. Smart Grid Renew. Energy 2010, 1, 143–152. [Google Scholar] [CrossRef]
  47. Lee, J.C.; Lee, H.H.; Joo, Y.J.; Lee, C.H.; Oh, M. Process simulation and thermodynamic analysis of an IGCC (integrated gasification combined cycle) plant with an entrained coal gasifier. Energy 2014, 64, 58–68. [Google Scholar] [CrossRef]
  48. Arango-Miranda, R.; Hausler, R.; Romero-López, R.; Glaus, M.; Ibarra-Zavaleta, S. An Overview of Energy and Exergy Analysis to the Industrial Sector, a Contribution to Sustainability. Sustainability 2018, 10, 153. [Google Scholar] [CrossRef]
  49. Calise, F.; Costa, M.; Wang, Q.; Zhang, X.; Duić, N. Recent Advances in the Analysis of Sustainable Energy Systems. Energies 2018, 11, 2520. [Google Scholar] [CrossRef]
  50. Pal, R. Chemical exergy of ideal and non-ideal gas mixtures and liquid solutions with applications. Int. J. Mech. Eng. Educ. 2017, 47, 44–72. [Google Scholar] [CrossRef]
  51. Xiang, J.Y.; Calì, M.; Santarelli, M. Calculation for physical and chemical exergy of flows in systems elaborating mixed-phase flows and a case study in an IRSOFC plant. Int. J. Energy Res. 2004, 28, 101–115. [Google Scholar] [CrossRef]
  52. Hinderink, A.P.; Kerkhof, F.P.J.M.; Lie, A.B.K.; De Swaan Arons, J.; Van Der Kooi, H.J. Exergy analysis with a flowsheeting simulator—I. Theory; calculating exergies of material streams. Chem. Eng. Sci. 1996, 51, 4693–4700. [Google Scholar] [CrossRef]
  53. Song, G.; Xiao, J.; Zhao, H.; Shen, L. A unified correlation for estimating specific chemical exergy of solid and liquid fuels. Energy 2012, 40, 164–173. [Google Scholar] [CrossRef]
  54. Morris, D.R.; Szargut, J. Standard chemical exergy of some elements and compounds on the planet earth. Energy 1986, 11, 733–755. [Google Scholar] [CrossRef]
Figure 1. Simulation flow of cement oxygen-enriched combustion process based on Aspen Plus.
Processes 12 00645 g001
Figure 2. The coupling of the CASU and CO2 purification unit within the low-carbon cement production process.
Processes 12 00645 g002
Figure 3. Effect of O2/CO2 atmosphere on combustion temperature.
Processes 12 00645 g003
Figure 4. Effects of different oxygen and combustion flows on combustion system.
Processes 12 00645 g004
Figure 5. Effect of pulverized coal flow on flue gas emission.
Processes 12 00645 g005
Figure 6. Effects of oxygen flow on flue gas emission.
Processes 12 00645 g006
Figure 7. Parameter comparison under different working conditions.
Processes 12 00645 g007
Figure 8. Exergy efficiency of subsystems.
Processes 12 00645 g008
Figure 9. Exergy efficiency of the system modules.
Processes 12 00645 g009
Figure 10. Exergy destruction ratios of individual subsystems under oxygen-rich combustion settings.
Processes 12 00645 g010
Figure 11. Exergy destruction ratios of various subsystems under normal operating circumstances.
Processes 12 00645 g011
Table 1. Raw materials compositions (wt.%).
CaCO379.9
SiO21.64
MgCO312.84
Fe2O32.42
Al2O33.2
Raw material flow58,000 kg/h
Table 2. Coal compositions and heating values.
Coal Compositions
Proximate analysiswt.%
Moisture 1.4
Volatiles 31.27
Fixed carbon 42.86
Ash 25.87
Ultimate analysiswt.%
C 64.76
H 4.16
O 1.74
N 1.61
S 0.91
Ash 26.11
Lower heating valueMJ/kg20.35
Ash compositionwt.%
SiO2 39.5
CaO 37.69
Fe2O3 10.25
Al2O3 12.56
Table 3. Aspen Plus cement production system module descriptions.
ModelAspen Plus ModelSpecification and Function
Decompser1RYieldDecomposing coal into C, H, O, N, S,
and other basic elements
T = 28.32 °C; P = 1 bar
Decompser2Decomposition of ash into
conventional components
T = 2028 °C; P = 0.8673 bar
CombustorRGibbsSimulation of pulverized coal
combustion reaction
P = 0.8673 bar
Kiln1Simulation of C3S and C3A generation
T = 1450 °C; P = 0.8673 bar
Kiln2Simulation of C2S generation
T = 1250 °C; P = 1 bar
Pre-calcinerRStoicSimulation of the decomposition
reactions of CaCO3
T = 900 °C; P = 1 bar; CaCO3 → CaO + CO2 with 70% conversion
HeaterHeaterClinker cooling process
Cooler2
Cooler1Exhaust gas cooling process
Cooler3Defining the heat loss of the grate cooler
Table 4. Simulation results of Aspen Plus were compared with actual clinker composition data.
SubstanceReference Data [25]Simulation DataError/%
SiO2/wt.%22.2420.42−8.1%
Al2O3/wt.%5.145.7111.1%
Fe2O3/wt.%3.524.3122.4%
CaO/wt.%67.5568.271.1%
MgO/wt.%1.221.295.7%
SO3/wt.%0.01-N/A
K2O/wt.%0.29-N/A
Na2O/wt.%0.18-N/A
TiO2/wt.%0.30-N/A
P2O5/wt.%0.04-N/A
C3S/wt.%70.0078.2711.8%
C3A/wt.%10.0013.8238.2%
Table 5. Aspen Plus simulation results are compared with operating parameters.
Parameter TypeOperating ParametersReference Data [25]Simulation DataError/%
OutputClinker flow rate/kg/h35,00038,19710.6
Clinker temperature/°C2452450
Flue gas temperature/°C20001976−1.2
Secondary air temperature/°C8008040.5
Oxygen content of tail gas/%31.60−46.7
Decomposition furnace
feed temperature/°C
8368400.5
Decomposition furnace
flue gas temperature/°C
9589580
Exhaust gas temperature/°C340326−4.1
InputPrimary air flow/kg/h11,43811,4380
Secondary air flow/kg/h33,71233,7120
Raw material flow/kg/h58,00058,0000
Dry coal flow/kg/h5,0004,158−16.8
Table 6. Comparison of exhaust gas components in different working conditions.
Substance (wt.%)Normal Working ConditionsOxygen-Rich
Combustion Conditions
O20.016870.04561
CO8.94047 × 10−61.16086 × 10⁻⁵
CO20.346420.94828
NO3.75276 × 10−44.37472 × 10⁻⁵
NO25.37097 × 10−71.88675 × 10⁻⁷
SO25.77039 × 10−40.00203
SO32.61885 × 10−62.26208 × 10⁻⁵
N20.635340.00318
Table 7. Mass flow rates and exergy flow rates of process streams.
Process Streamsm/kg/h h i /kW E P H / k W E C H / k W E t o t / k W
FRAWMATE58,000200,522.000.000.000.00
FGAS68,536159,898.861743.397897.639641.02
FC4SOLID58,000186,985.037110.771574.068684.83
FPRODUCT4111,924283,123.6816,666.8719,366.4436,033.31
FC5GAS68,536146,318.4310,546.927897.6318,444.54
FKLN2GAS53,924106,862.0913,901.866109.3720,011.23
FPRODUCT391,051223,331.8022,377.0917,254.7339,631.82
FSLID-OUT43,389136,805.256119.9511,468.8117,588.76
FKLN2SOLD37,127116,469.708475.2411,145.3619,620.59
FKLN1GAS47,66290,067.2115,283.455347.9920,631.44
FPRODUCT285,690207,610.1725,126.4416,876.0142,002.45
FGASES47,66284,658.9819,525.876255.5125,781.38
FASHPROD9012446.34569.91262.82832.73
FPRODUCT148,56387,508.0519,552.455636.2025,188.64
FDECOMP3500901.160.7326,062.4226,063.15
FCOAL35006688.670.0026,726.5326,726.53
FKLN1SOLD38,028117,542.969842.9911,528.0221,371.01
FCLINKER138,028124,640.324272.1511,528.0215,800.16
FCLINKER238,028132,116.14491.2811,528.0212,019.30
FREC-GAS68,536165,048.5365.797897.637963.42
FCO231,98377,021.9230.703685.523716.23
FREC-CO236,55388,026.6135.094212.104247.19
FVO2851118.2965.27289.97355.24
FMIX-GAS45,06388,044.9025.984164.814190.79
FGAS-IN213,51926,413.477.791249.441257.24
FGAS-IN131,54461,631.4318.192915.362933.55
FCOAL-GAS13,51926,352.4453.321249.441302.77
FCOOL-GAS31,54461,562.9868.832915.362984.20
FHOT-GAS31,54454,466.943813.552915.366728.91
FMIX-AIR45,06380,819.383402.554164.817567.36
Disclaimer/Publisher’s Note: The statements, opinions and data contained in all publications are solely those of the individual author(s) and contributor(s) and not of MDPI and/or the editor(s). MDPI and/or the editor(s) disclaim responsibility for any injury to people or property resulting from any ideas, methods, instructions or products referred to in the content.

