
Solubility of Methane in Ionic Liquids for Gas Removal Processes Using a Single Multilayer Perceptron Model

Abstract
:1. Introduction
2. Multilayer Perceptron
3. Results and Discussion
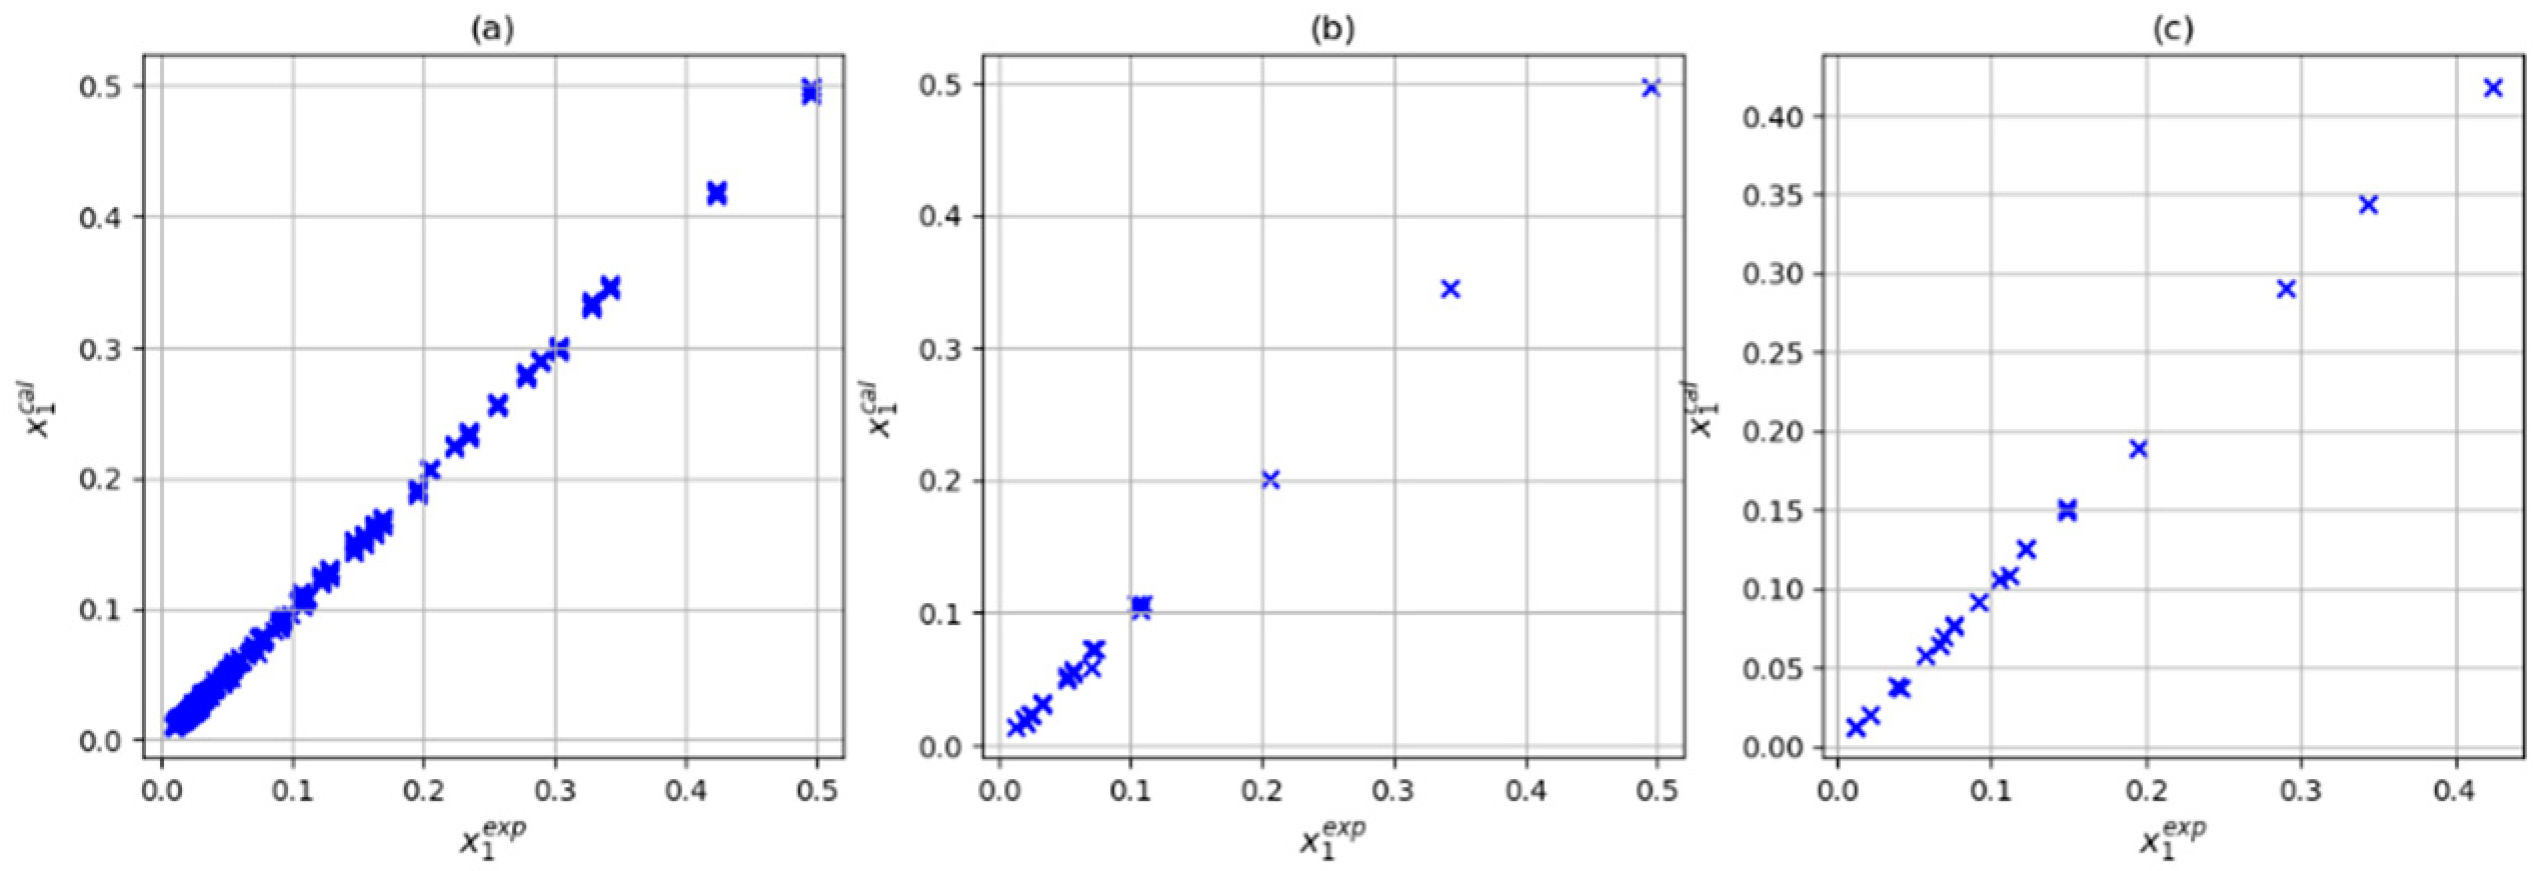
Learning Process
4. Conclusions
Supplementary Materials
Author Contributions
Funding
Data Availability Statement
Acknowledgments
Conflicts of Interest
References
- Yuan, X.L.; Zhang, S.J.; Lu, X.M. Hydroxyl Ammonium Ionic Liquids: Synthesis, Properties, and Solubility of SO2. J. Chem. Eng. Data 2007, 52, 596–599. [Google Scholar] [CrossRef]
- Li, G.; Qing, Z.; Xiangping, Z.; Lei, W.; Suojiang, Z.; Jianwei, L. Solubilities of ammonia in basic imidazolium ionic liquids. Fluid Phase Equilibria 2010, 297, 34–39. [Google Scholar] [CrossRef]
- Hamedi, N.; Rahimpour, M.R.; Keshavarz, P. Methane solubility in ionic liquids: Comparison of cubic-plus-association and modified Sanchez-lacome equations of states. Chem. Phys. Lett. 2020, 738, 136903. [Google Scholar] [CrossRef]
- Kurnia, K.A.; Matheswaran, P.; How, C.J.; Noh, M.H.; Kusumawati, Y. A comprehensive study on the impact of chemical structures of ionic liquids on the solubility of ethane. New J. Chem. 2020, 44, 11155–11163. [Google Scholar] [CrossRef]
- Liu, X.; Afzal, W.; Prausnitz, J.M. Solubilities of Small Hydrocarbons in Tetrabutylphosphonium Bis(2,4,4-trimethylpentyl) Phosphinate and in 1-Ethyl-3-methylimidazolium Bis(trifluoromethylsulfonyl)imide. Ind. Eng. Chem. Res. 2013, 52, 14975–14978. [Google Scholar] [CrossRef]
- Faúndez, C.A.; Díaz-Valdés, J.F.; Valderrama, J.O. Consistency test of solubility data of ammonia in ionic liquids using the modified Peng–Robinson equation of Kwak and Mansoori. Fluid Phase Equilibria 2013, 348, 33–38. [Google Scholar] [CrossRef]
- Faúndez, C.A.; Fierro, E.N.; Valderrama, J.O. Solubility of hydrogen sulfide in ionic liquids for gas removal processes using artificial neural networks. J. Environ. Chem. Eng. 2016, 4, 211–218. [Google Scholar] [CrossRef]
- Kurnia, K.A.; Matheswaran, P.; How, C.J.; Noh, M.H.; Kusumawati, Y. Solubility of Methane in Alkylpyridinium-Based Ionic Liquids at Temperatures between 298.15 and 343.15 K and Pressures up to 4 MPa. J. Chem. Eng. Data 2020, 65, 4642–4648. [Google Scholar] [CrossRef]
- Henni, N.; Henni, A.; Ibrahim, H. Solubility of carbon dioxide in promising methylimidazolium-based ionic liquids. Fluid Phase Equilibria 2023, 565, 113619. [Google Scholar] [CrossRef]
- Rahmati-Rostami, M.; Ghotbi, C.; Hosseini-Jenab, M.; Ahmadi, A.N.; Jalili, A.H. Solubility of H2S in Ionic Liquids 1-Ethyl-3-methylimidazolium Hexafluorophosphate ([emim][PF6]) and 1-Ethyl-3-methylimidazolium Bis(trifluoromethyl)sulfonylimide ([emim][Tf2N]). J. Chem. Thermodyn. 2010, 55, 5839–5845. [Google Scholar] [CrossRef]
- Carvalho, P.J.; Coutinho, J.A.P. Non-ideality of Solutions of NH3, SO2, and H2S in Ionic Liquids and the Prediction of Their Solubilities Using the Flory−Huggins Model. Energy Fuels 2010, 24, 6662–6666. [Google Scholar] [CrossRef]
- Jalili, A.H.; Mehdizadeh, A.; Shokouhi, M.; Ahmadi, A.N.; Hosseini-Jenab, M.; Fateminassab, F. Solubility and diffusion of CO2 and H2S in the ionic liquid 1-ethyl-3-methylimidazolium ethylsulfate. J. Chem. Thermodyn. 2010, 42, 1298–1303. [Google Scholar] [CrossRef]
- Shokouhi, M.; Adibi, M.; Jalili, A.H.; Hosseini-Jenab, M.; Mehdizadeh, A. Solubility and Diffusion of H2S and CO2 in the Ionic Liquid 1-(2-Hydroxyethyl)-3-methylimidazolium Tetrafluoroborate. J. Chem. Eng. Data 2009, 55, 1663–1668. [Google Scholar] [CrossRef]
- Wypych, G. Handbook of Solvents; ChemTec Publishing: Toronto, ON, Canada, 2001. [Google Scholar]
- Heintz, A. Recent developments in thermodynamics and thermophysics of non-aqueous mixtures containing ionic liquids. A review. J. Chem. Thermodyn. 2005, 37, 525–535. [Google Scholar] [CrossRef]
- Kokorin, A. (Ed.) Ionic Liquids: Applications and Perspectives; InTech: Rijeza, Croatia, 2010. [Google Scholar]
- Lei, Z.; Dai, C.; Wang, W.; Chen, B. UNIFAC Model for Ionic Liquid-CO2 Systems. AIChE J. 2014, 60, 716–729. [Google Scholar] [CrossRef]
- Scovazzo, P.; Camper, D.; Kieft, J.; Poshusta, J.; Koval, C.; Noble, R. Regular Solution Theory and CO2 Gas Solubility in Room-Temperature Ionic Liquids. Ind. Eng. Chem. Res. 2004, 43, 6855–6860. [Google Scholar] [CrossRef]
- Arce, A.; Earle, M.J.; Katdare, S.P.; Rodríguez, H.; Seddon, K.R. Phase equilibria of mixtures of mutually immiscible ionic liquids. Fluid Phase Equilibria 2007, 261, 427–433. [Google Scholar] [CrossRef]
- Santiago, R.S.; Santos, G.R.; Aznar, M. UNIQUAC correlation of liquid–liquid equilibrium in systems involving ionic liquids: The DFT–PCM approach. Fluid Phase Equilibria 2009, 278, 54–61. [Google Scholar] [CrossRef]
- Vega, L.F.; Vilaseca, O.; Llovell, F.; Andreu, J.S. Modeling ionic liquids and the solubility of gases in them: Recent advances and perspectives. Fluid Phase Equilibria 2010, 294, 15–30. [Google Scholar] [CrossRef]
- Faúndez, C.A.; Barrientos, L.A.; Valderrama, J.O. Modeling and thermodynamic consistency of solubility data of refrigerants in ionic liquids. Int. J. Refrig. 2013, 36, 2242–2250. [Google Scholar] [CrossRef]
- Faúndez, C.A.; Campusano, R.A.; Valderrama, J.O. Henry’s law constant as a function of temperatura and pressure to calcu-late the solubility of difluoromethane (R-32) in ionic liquids. Int. J. Refrig. 2020, 119, 401–409. [Google Scholar] [CrossRef]
- Fierro, E.N.; Faúndez, C.A.; Muñoz, A.S. Influence of thermodynamically inconsistent data on modeling the solubilities of refrigerants in ionic liquids using an artificial neural network. J. Mol. Liq. 2021, 337, 116417. [Google Scholar] [CrossRef]
- Fierro, E.N.; Faúndez, C.A.; Muñoz, A.S.; Cerda, P.I. Application of a Single Multilayer Perceptron Model to Predict the Solubility of CO2 in Different Ionic Liquids for Gas Removal Processes. Processes 2022, 10, 1686. [Google Scholar] [CrossRef]
- Faúndez, C.A.; Díaz-Valdés, J.F.; Valderrama, J.O. Testing solubility data of H2S and SO2 in ionic liquids for sulfur-removal processes. Fluid Phase Equilibria 2014, 375, 152–160. [Google Scholar] [CrossRef]
- Faúndez, C.A.; Quiero, F.A.; Valderrama, J.O. Correlation of solubility data of ammonia in ionic liquids for gas separation processes using artificial neural networks. Comptes Rendus Chim. 2014, 17, 1094–1101. [Google Scholar] [CrossRef]
- Valderrama, J.O.; Faúndez, C.A.; Díaz-Valdés, J.F. Equation of state dependency of thermodynamic consistency methods. Application to solubility data of gases in ionic liquids. Fluid Phase Equilibria 2017, 449, 76–82. [Google Scholar] [CrossRef]
- Althuluth, M.; Kroon, M.C.; Peters, C.J. Solubility of Methane in the Ionic Liquid 1-Ethyl-3-methylimidazolium Tris(pentafluoroethyl)trifluorophosphate. Ind. Eng. Chem. Res. 2012, 51, 16709–16712. [Google Scholar] [CrossRef]
- Loreno, M.; Reis, R.A.; Mattedi, S.; Paredes, M.L. Predicting the solubility of carbon dioxide or methane in imidazolium-based ionic liquids with GC-sPC-SAFT equation of state. Fluid Phase Equilibria 2018, 479, 85–98. [Google Scholar] [CrossRef]
- Huang, X. Experimental and simulation study on the capture and separation of CO2/CH4 by alkali metal complex ionic liquid. Fuel 2022, 329, 125444. [Google Scholar] [CrossRef]
- Safamirzaei, M.; Modarress, H. Correlating and predicting low pressure solubility of gases in [bmim][BF4] by neural network molecular modeling. Thermochim. Acta 2012, 545, 125–130. [Google Scholar] [CrossRef]
- Behera, S.K.; Meher, S.K.; Park, H.-S. Artificial neural network model for predicting methane percentage in biogas recovered from a landfill upon injection of liquid organic waste. Clean Technol. Environ. Policy 2014, 17, 443–453. [Google Scholar] [CrossRef]
- Nair, V.V.; Dhar, H.; Kumar, S.; Thalla, A.K.; Mukherjee, S.; Wong, J.W. Artificial neural network based modeling to evaluate methane yield from biogas in a laboratory-scale anaerobic bioreactor. Bioresour. Technol. 2016, 217, 90–99. [Google Scholar] [CrossRef]
- Dashti, A.; Harami, H.R.; Rezakazemi, M.; Shirazian, S. Estimating CH4 and CO2 solubilities in ionic liquids using computational intelligence approaches. J. Mol. Liq. 2018, 271, 661–669. [Google Scholar] [CrossRef]
- Valderrama, J.O.; Forero, L.A.; Rojas, R.E. Extension of a group contribution method to estimate the critical prop-erties of ionic liquids of high molecular mass. Ind. Eng. Chem. Res. 2015, 54, 3480–3487. [Google Scholar] [CrossRef]
- Rosenblatt, F. The perceptron: A probabilistic model for information storage and organization in the brain. Psychol. Rev. 1958, 65, 386–408. [Google Scholar] [CrossRef]
- Minsky, M.; Papert, S. Perceptron: An introduction to computational geometry. Camb. Tiass. HIT 1969, 479, 104. [Google Scholar]
- Raeissi, S.; Peters, C. High pressure phase behaviour of methane in 1-butyl-3-methylimidazolium bis(trifluoromethylsulfonyl)imide. Fluid Phase Equilibria 2010, 294, 67–71. [Google Scholar] [CrossRef]
- Ramdin, M.; Amplianitis, A.; Bazhenov, S.; Volkov, A.; Volkov, V.; Vlugt, T.J.; de Loos, T.W. Solubility of CO2 and CH4 in ionic liquids: Ideal CO2/CH4 selectivity. Ind. Eng. Chem. Res. 2014, 53, 15427–15435. [Google Scholar] [CrossRef]
- Mirzaei, M.; Mokhtarani, B.; Badiei, A.; Sharifi, A. Solubility of carbon dioxide and methane in 1-hexyl-3-methylimidazolium nitrate ionic liquid, experimental and thermodynamic modeling. J. Chem. Thermodyn. 2018, 122, 31–37. [Google Scholar] [CrossRef]
- Anderson, J.L.; Dixon, J.K.; Brennecke, J.F. Solubility of CO2, CH4, C2H6, C2H4, O2, and N2 in 1-Hexyl-3-methylpyridinium Bis (trifluoromethylsulfonyl) imide: Comparison to Other Ionic Liquids. Acc. Chem. Res. 2007, 40, 1208–1216. [Google Scholar] [CrossRef] [PubMed]
- Yuan, X.; Zhang, S.; Chen, Y.; Lu, X.; Dai, W.; Mori, R. Solubilities of Gases in 1,1,3,3-Tetramethylguanidium Lactate at Elevated Pressures. J. Chem. Eng. Data 2006, 51, 645–647. [Google Scholar] [CrossRef]
- Sedghamiz, M.A.; Rasoolzadeh, A.; Rahimpour, M.R. The ability of artificial neural network in prediction of the acid gases solubility in different ionic liquids. J. CO2 Util. 2015, 9, 39–47. [Google Scholar] [CrossRef]
- Eslamimanesh, A.; Gharagheizi, F.; Mohammadi, A.H.; Richon, D. Artificial Neural Network modeling of solubility of supercritical carbon dioxide in 24 commonly used ionic liquids. Chem. Eng. Sci. 2011, 66, 3039–3044. [Google Scholar] [CrossRef]
- Baghban, A.; Ahmadi, M.A.; Shahraki, B.H. Prediction carbon dioxide solubility in presence of various ionic liquids using computational intelligence approaches. J. Supercrit. Fluids 2015, 98, 50–64. [Google Scholar] [CrossRef]
- MATLAB (R2023a). MathWorks 2023. Available online: https://www.mathworks.com/ (accessed on 1 March 2023).
- Althuluth, M.; Kroon, M.C.; Peters, C.J. High pressure solubility of methane in the ionic liquid 1-hexyl-3-methylimidazolium tricyanomethanide. J. Supercrit. Fluids 2017, 128, 145–148. [Google Scholar] [CrossRef]
- Oliveira, L.M.; Ribeiro, F.R.; Alcantara, M.L.; Pisoni, G.O.; Cabral, V.F.; Cardozo-Filho, L.; Mattedi, S. High pres-sure vapor-liquid equilibria for binary methane and protic ionic liquid based on propionate anions. Fluid Phase Equilibria 2016, 426, 65–74. [Google Scholar] [CrossRef]
- Alcantara, M.L.; Ferreira, P.I.; Pisoni, G.O.; Silva, A.K.; Cardozo-Filho, L.; Lião, L.M.; Pires, C.A.; Mattedi, S. High pressure vapor-liquid equilibria for binary protic ionic liquids + methane or carbon dioxide. Sep. Purif. Technol. 2018, 196, 32–40. [Google Scholar] [CrossRef]
- Bermejo, M.D.; Fieback, T.M.; Martín, Á. Solubility of gases in 1-alkyl-3methylimidazolium alkyl sulfate ionic liquids: Experimental determination and modeling. J. Chem. Thermodyn. 2013, 58, 237–244. [Google Scholar] [CrossRef]


| System | N | T(K) | P(MPa) | x1 | Reference |
|---|---|---|---|---|---|
| [C4mim][Tf2N] | 8 | 300.31–314.31 | 1.510–16.105 | 0.030–0.225 | [39] |
| 5 | 332.58–342.31 | 1.618–10.503 | 0.030–0.163 | ||
| 4 | 352.00–352.08 | 3.237–10.982 | 0.056–0.163 | ||
| 5 | 371.33–371.38 | 1.736–11.352 | 0.030–0.163 | ||
| 5 | 390.69–400.47 | 1.836–11.652 | 0.030–0.163 | ||
| 5 | 410.09–410.22 | 3.583–8.440 | 0.056–0.122 | ||
| 5 | 429.56–429.80 | 3.659–11.978 | 0.056–0.122 | ||
| 5 | 448.96–449.12 | 1.938–12.054 | 0.030–0.163 | ||
| [C4py][BF4] | 6 | 298.15 | 1.670–3.910 | 0.012–0.026 | [8] |
| 5 | 313.15 | 1.770–3.910 | 0.011–0.023 | ||
| 5 | 328.15 | 2.140–4.120 | 0.012–0.022 | ||
| 4 | 343.15 | 2.370–3.890 | 0.012–0.020 | ||
| [C4py][Tf2N] | 7 | 298.15 | 0.900–4.120 | 0.011–0.049 | |
| 6 | 313.15 | 1.360–4.030 | 0.014–0.047 | ||
| 7 | 328.15 | 1.030–4.150 | 0.011–0.042 | ||
| 6 | 343.15 | 1.310–3.990 | 0.012–0.036 | ||
| [C6py][Tf2N] | 7 | 298.15 | 0.700–3.990 | 0.013–0.074 | |
| 7 | 313.15 | 0.720–3.940 | 0.012–0.066 | ||
| 7 | 328.15 | 0.930–3.990 | 0.014–0.060 | ||
| 6 | 343.15 | 1.270–3.920 | 0.019–0.054 | ||
| [C2mim][dep] | 5 | 303.17–303.44 | 1.685–8.310 | 0.020–0.076 | [40] |
| 5 | 313.13–313.24 | 1.755–8.565 | 0.020–0.076 | ||
| 5 | 323.06–323.25 | 1.820–8.800 | 0.020–0.076 | ||
| 5 | 333.02–333.25 | 1.880–9.020 | 0.020–0.076 | ||
| 5 | 343.02–343.25 | 1.930–9.176 | 0.020–0.076 | ||
| 5 | 353.05–353.25 | 1.975–9.316 | 0.020–0.076 | ||
| 5 | 362.92–363.29 | 2.025–9.441 | 0.020–0.076 | ||
| [C2mim][FAP] | 3 | 293.30–293.58 | 2.076–5.831 | 0.052–0.129 | [29] |
| 4 | 303.29–303.57 | 2.151–7.728 | 0.052–0.155 | ||
| 4 | 313.42–313.54 | 2.185–7.951 | 0.052–0.155 | ||
| 4 | 323.36–323.52 | 2.234–8.123 | 0.052–0.155 | ||
| 4 | 333.27–333.47 | 2.299–8.321 | 0.052–0.155 | ||
| 4 | 343.32–343.45 | 2.368–8.484 | 0.052–0.155 | ||
| 4 | 353.24–353.44 | 2.392–8.583 | 0.052–0.155 | ||
| 4 | 363.13–363.42 | 2.421–8.692 | 0.052–0.155 | ||
| [C6mim][NO3] | 5 | 293.15 | 0.874–2.580 | 0.020–0.087 | [41] |
| 5 | 303.15 | 0.905–2.680 | 0.021–0.089 | ||
| 5 | 313.15 | 0.935–2.778 | 0.022–0.091 | ||
| 5 | 323.15 | 0.966–2.876 | 0.022–0.093 | ||
| 5 | 333.15 | 0.996–2.972 | 0.023–0.095 | ||
| 5 | 343.15 | 1.025–3.055 | 0.024–0.099 | ||
| [C6mim][Tf2N] | 8 | 298.15 | 0.400–0.999 | 0.012–0.028 | [42] |
| 7 | 313.15 | 0.501–0.998 | 0.012–0.027 | ||
| 8 | 333.15 | 0.400–1.000 | 0.010–0.024 | ||
| [C6mpy][Tf2N] | 8 | 298.15 | 0.400–0.999 | 0.012–0.028 | |
| 7 | 313.15 | 0.501–0.998 | 0.012–0.027 | ||
| 8 | 333.15 | 0.400–1.000 | 0.010–0.024 | ||
| [tes][Tf2N] | 5 | 303.10–303.43 | 1.246–7.039 | 0.024–0.111 | [40] |
| 5 | 312.87–313.25 | 1.301–7.314 | 0.024–0.111 | ||
| 5 | 322.85–323.25 | 1.351–7.534 | 0.024–0.111 | ||
| 5 | 333.11–333.28 | 1.391–7.749 | 0.024–0.111 | ||
| 5 | 342.96–343.34 | 1.426–7.925 | 0.024–0.111 | ||
| 5 | 353.16–353.36 | 1.467–8.090 | 0.024–0.111 | ||
| 5 | 362.94–363.46 | 1.507–8.230 | 0.024–0.111 | ||
| [thtdp][dca] | 7 | 302.13–303.38 | 1.428–9.638 | 0.079–0.343 | |
| 7 | 312.14–313.39 | 1.503–10.049 | 0.079–0.343 | ||
| 7 | 322.25–323.47 | 1.576–10.433 | 0.079–0.343 | ||
| 7 | 332.29–333.52 | 1.651–10.759 | 0.079–0.343 | ||
| 7 | 342.31–343.53 | 1.697–11.059 | 0.079–0.343 | ||
| 7 | 352.36–353.46 | 1.752–11.329 | 0.079–0.343 | ||
| 7 | 362.34–363.48 | 1.792–11.569 | 0.079–0.343 | ||
| [thtdp][phos] | 6 | 302.00–303.25 | 1.015–9.708 | 0.107–0.496 | |
| 6 | 311.98–313.25 | 1.066–10.173 | 0.107–0.496 | ||
| 6 | 322.05–323.19 | 1.131–10.628 | 0.107–0.496 | ||
| 6 | 332.02–333.22 | 1.171–11.023 | 0.107–0.496 | ||
| 6 | 342.05–343.25 | 1.216–11.404 | 0.107–0.496 | ||
| 6 | 352.11–353.26 | 1.261–11.734 | 0.107–0.496 | ||
| 6 | 362.15–363.27 | 1.301–12.049 | 0.107–0.496 | ||
| [toa][Tf2N] | 5 | 302.96–303.55 | 1.725–6.067 | 0.076–0.290 | |
| 5 | 312.94–313.28 | 1.815–6.332 | 0.076–0.290 | ||
| 5 | 322.92–323.33 | 1.905–6.588 | 0.076–0.290 | ||
| 5 | 332.96–333.53 | 1.336–6.848 | 0.076–0.290 | ||
| 5 | 343.21–343.65 | 1.386–7.103 | 0.076–0.290 | ||
| 5 | 353.22–353.75 | 1.436–7.328 | 0.076–0.290 | ||
| 5 | 363.25–363.72 | 1.481–7.543 | 0.076–0.290 | ||
| TMGL | 8 | 308.00 | 2.560–9.660 | 0.012–0.043 | [43] |
| 7 | 318.00 | 3.510–9.990 | 0.013–0.039 | ||
| 7 | 328.00 | 3.690–10.340 | 0.010–0.031 |
| System | IUPAC Name | Tc | Pc | Zc | ω |
|---|---|---|---|---|---|
| [C4mim][Tf2N] | 1-Butyl-3-methylimidazolium bis(trifluoromethylsulfonyl)imide | 1258.9 | 27.64 | 0.2592 | 0.3370 |
| [C4py][BF4] | 1-Butylpyridinium tetrafluoroborato | 597.6 | 20.33 | 0.2652 | 0.8207 |
| [C4py][Tf2N] | 1-Butylpyridinium bis(trifluorometanosulfonyl)imide | 1229.1 | 27.71 | 0.2666 | 0.2505 |
| [C6py][Tf2N] | 1-Hexylpyridinium bis(trifluorometanosulfonyl)imide | 1252.3 | 23.93 | 0.2522 | 0.3383 |
| [C2mim][dep] | 1-ethyl-3-methylimidazolium diethylphosphate | 877.2 | 21.47 | 0.2349 | 0.7219 |
| [C2mim][FAP] | 1-ethyl-3-methylimidazolium tris(perfluoroethyl)trifluorophosphate | 740.6 | 10.05 | 0.1944 | 1.3993 |
| [C6mim][NO3] | 1-Hexyl-3-methylimidazolium nitrate | 991.8 | 23.16 | 0.2135 | 0.7242 |
| [C6mim][Tf2N] | 1-Hexyl-3-methylimidazolium bis(trifluoromethylsulfonyl)imide | 1293.3 | 23.89 | 0.2454 | 0.3874 |
| [hmpy][Tf2N] | 1-Hexyl-1-methylpyrrolidinium bis(trifluorometanosulfonyl)imide | 1265.2 | 22.25 | 0.2439 | 0.4060 |
| [tes][Tf2N] | triethylsulfonium bis(trifluoromethylsulfonyl)imide | 1189.9 | 21.90 | 0.2317 | 0.1603 |
| [thtdp][dca] | trihexyltetradecylphosphonium dicyanamide | 1505.8 | 7.65 | 0.1388 | 1.0319 |
| [thtdp][phos] | trihexyltetradecylphosphonium bis(2,4,4-trimethylpentyl)phosphinate | 1819.5 | 5.51 | 0.1157 | 0.0924 |
| [toa][Tf2N] | methyltrioctylammonium bis(trifluoromethylsulfonyl)imide | 1347.6 | 10.64 | 0.1988 | 1.6063 |
| TMGL | 1,1,3,3-tetramethylguanidium lactate | 816.9 | 27.18 | 0.2557 | 1.1188 |
| 1% TRAINING SECTION% 2% Reading independent variables for training 3p = xlsread(‘variables_X1_training’);p = p’; 4%Reading the dependent variable for training; 5t = xlsread(‘X1_for_training’);t = t’; 6% Normalization of all data (values between −1 and y +1) 7[pn,minp,maxp,tn,mint,maxt] = premnmx(p,t); 8% Definition of ANN:(topology, activation functions, training algorithm) 9net = newff(minmax(pn),[6,6,1],{‘tansig’,’tansig’,’purelin’},’trainlm’); 10% Definition of frequency of visualization of errors during training 11net.trainParam.show = 10; 12% Definition of number of maximum iterations and global error between iterations 13net.trainParam.epochs = 1000; net.trainParam.goal = 1 × 10⁻⁴; 14% Network starts: reference random weights and gains 15w1 = net.IW{1,1}; w2 = net.LW{2,1}; w3 = net.LW{3,2}; 16b1 = net.b{1}; b2 = net.b{2}; b3 = net.b{3}; 17% First iteration with reference values and correlation coefficient 18before_training = sim(net,pn); 19corrbefore_training= corrcoef(before_training,tn); 20% Training process and results 21[net,tr] = train(net,pn,tn); after_training = sim(net,pn); 22% Back-Normalization of results, from values between −1 y and +1 to real values 23after_training = postmnmx(after_training,mint,maxt); after_training = after_training’; 24Res = sim(net,pn); 25% Saving results, correlated solubility in an Excel file 26dmwrite(‘X1_correlated.xls’,after_training,char(9)); 27save w 28%TESTING SECTION 29%Reading weight and other characteristics of the trained ANN saved in the file W 30load w 31% Reading of Excel file with new independent variables to predict 32pnew = xlsread(‘variables_sol_ prediction’); pnew = pnew’; 33% Normalization of all variables (values between −1 y and +1) 34pnewn = tramnmx(pnew,minp,maxp); 35% Testing the ANN obtaining the properties for the variables provided 36anewn = sim(net,pnewn); 37% Transformation of the normalized exits (between −1 y and +1) determined by the ANN to real values 38anew = postmnmx(anewn,mint,maxt); anew = anew’; 39% Saving the testing properties in an Excel file 40dlmwrite(‘solub_ testing.xls’,anew,char(9)); 41%PREDICTION SECTION 42%Reading weight and other characteristics of the trained ANN saved in the file W 43load w 44% Reading of Excel file with new independent variables to predict 45pnew = xlsread(‘variables_sol_ prediction’); pnew = pnew’; 46% Normalization of all variables (values between −1 y and +1) 47pnewn = tramnmx(pnew,minp,maxp); 48% Testing the ANN obtaining the properties for the variables provided 49anewn = sim(net,pnewn); 50% Transformation of the normalized exits (between −1 y and +1) determined by the ANN to real values 51anew = postmnmx(anewn,mint,maxt); anew = anew’; 52% Saving the predicted properties in an Excel file 53dlmwrite(‘solub_ predicted.xls’,anew,char(9)); |
| Algorithm | Training Function | Run | Best Performance | |Δx1%|Training | |Δx1%|Testing |
|---|---|---|---|---|---|
| Levenberg–Marquardt | trainlm | 14 | 0.007 | 17.88 | 18.77 |
| BFGS quasi-Newton | trainbfg | 37 | 0.027 | 17.40 | 18.24 |
| One-step secant | trainoss | 10 | 0.0038 | 19.16 | 22.29 |
| Resilient backpropagation | trainrp | 13 | 0.0042 | 18.46 | 20.05 |
| Scaled conjugate gradient | trainscg | 16 | 0.0031 | 18.22 | 19.32 |
| Fletch–Powell conjugate gradient | traincgf | 5 | 0.0032 | 19.16 | 20.17 |
| Polak–Ribière conjugate gradient | traincgp | 26 | 0.0031 | 18.78 | 19.55 |
| Variable learning rate | traingdx | 21 | 0.0076 | 23.44 | 22.76 |
| Architecture | Np | Run | Training (396 Data Point) | Testing (22 Data Point) | Prediction (22 Data Point) | |||
| |Δx1%| | |Δx1%|max | |Δx1%| | |Δx1%|max | |Δx1%| | |Δx1%|max | |||
| 4,6,2,1 | 47 | 50 | 4.33 | 57.43 | 3.49 | 14.87 | 3.78 | 16.81 |
| 4,6,3,1 | 55 | 1 | 4.83 | 59 | 3.89 | 23.16 | 4.37 | 16.79 |
| 4,6,4,1 | 63 | 21 | 4.2 | 41.23 | 4.48 | 19.57 | 3.55 | 15 |
| 4,6,5,1 | 71 | 5 | 3.31 | 30.33 | 4.16 | 26.33 | 2.77 | 13.28 |
| 4,6,6,1 | 79 | 27 | 4.76 | 56.52 | 3.64 | 13.14 | 3.86 | 18.59 |
| 4,6,7,1 | 87 | 13 | 4.28 | 63.36 | 4.85 | 13.08 | 3.1 | 9.8 |
| 4,6,8,1 | 95 | 6 | 4.5 | 54.71 | 5 | 14.51 | 3.78 | 15.68 |
| 4,6,9,1 | 103 | 48 | 4.61 | 47.92 | 4.42 | 13.69 | 3.22 | 15.16 |
| 4,6,10,1 | 111 | 26 | 3.63 | 37.64 | 5.78 | 20 | 1.99 | 10.17 |
| 4,5,2,1 | 40 | 42 | 4.61 | 32.29 | 5.86 | 29.86 | 3.58 | 15.76 |
| 4,5,3,1 | 47 | 33 | 5.06 | 37.2 | 4.76 | 22.9 | 3.87 | 14.89 |
| 4,5,4,1 | 54 | 28 | 3.81 | 27.07 | 3.81 | 17.31 | 3.68 | 13.33 |
| 4,5,5,1 | 61 | 31 | 5.17 | 49.05 | 4.62 | 16.53 | 3.38 | 15.18 |
| 4,5,6,1 | 68 | 9 | 4.32 | 51.52 | 4.71 | 35.03 | 3.34 | 10.67 |
| 4,5,7,1 | 75 | 44 | 4.44 | 37.39 | 4.9 | 18.89 | 3.54 | 12.82 |
| 4,5,8,2 | 82 | 1 | 4.56 | 30.84 | 3.41 | 11.93 | 3.49 | 12.95 |
| 4,5,9,2 | 89 | 14 | 4.25 | 36.35 | 5.86 | 27.55 | 2.93 | 9.97 |
| 4,5,10,2 | 96 | 18 | 3.44 | 33.84 | 4.44 | 12.74 | 2.24 | 7.19 |
| 4,4,2,1 | 33 | 5 | 5.68 | 55.22 | 6.2 | 23.08 | 5.86 | 21.88 |
| 4,4,3,1 | 39 | 38 | 7.52 | 57.43 | 6.92 | 40.37 | 4.63 | 16.96 |
| 4,4,4,1 | 45 | 15 | 3.59 | 25.12 | 3.57 | 13.12 | 2.2 | 11.92 |
| 4,4,5,1 | 51 | 33 | 4.26 | 33.38 | 4.62 | 23.7 | 3.42 | 13.36 |
| 4,4,6,1 | 57 | 21 | 3.82 | 34.47 | 3.96 | 25.12 | 3.22 | 11.01 |
| 4,4,7,1 | 63 | 3 | 3.4 | 31.75 | 5.02 | 25 | 2.48 | 9.71 |
| 4,4,8,1 | 69 | 31 | 4.64 | 41.64 | 4.65 | 18.91 | 3.04 | 17.44 |
| 4,4,9,1 | 75 | 48 | 3.62 | 23.49 | 4.12 | 17.49 | 3.09 | 10.51 |
| 4,4,10,1 | 81 | 28 | 2.87 | 24.72 | 3.44 | 17.71 | 2.49 | 11.79 |
| Ionic liquid | Trange (K) | Prange (Mpa) | Model | Comments | Ref. |
|---|---|---|---|---|---|
| [C6mim][TCM] | 293–363 | Up to 10 | Peng–Robinson EoS with only one temperature-independent binary interaction parameter. | The calculated results are in a good agreement with the experimental data, with an average absolute deviation of less than 2%. | [48] |
| [m2HEA][Pr] | 331–363 | 4–16 | Redlich–Kwong/Peng–Robinson EoS coupled to cubic van der Waals mixing rules. | The average error for the mole fraction of methane was around 9.7%. | [49] |
| [m-2HEA][Pr] [BHEA][Bu] | 313.1–353.1 | Up to 20 | Redlich–Kwong/Peng–Robinson equation of state (RKPR-EoS). | The model adjustment resulted in average deviations from data below 10% for molar fraction. | [50] |
| [C6mim][NO3] | 293.1–342.15 | Up to 4 | Extended Henry’s law model. | Data were correlated with a reasonable accuracy. The average absolute relative deviation in fugacity was 0.257%. | [41] |
| [C2mim][dep] [thtdp][phos] [thtdp][dca] [amim][dca] [bmpyrr][dca] [cprop][dca] [cprop][Tf2N] [bmpip][Tf2N] [tes][Tf2N] [toa][Tf2N] | 303.15–363.15 | Up 14 | Peng–Robinson equation of state in combination with van der Waals mixing rules. | They compared the experimental results with those of the model by means of graphical representations. However, they did not present the deviations obtained for these systems. | [40] |
| [C2mim][EtSO4 | 293 K | 0.2–10 | Group contribution equation of state. | Average deviation between experimental and calculated equilibrium pressures of 2.3%. | [51] |
Disclaimer/Publisher’s Note: The statements, opinions and data contained in all publications are solely those of the individual author(s) and contributor(s) and not of MDPI and/or the editor(s). MDPI and/or the editor(s) disclaim responsibility for any injury to people or property resulting from any ideas, methods, instructions or products referred to in the content. |
© 2024 by the authors. Licensee MDPI, Basel, Switzerland. This article is an open access article distributed under the terms and conditions of the Creative Commons Attribution (CC BY) license (https://creativecommons.org/licenses/by/4.0/).
Share and Cite
Faúndez, C.A.; Fierro, E.N.; Muñoz, A.S. Solubility of Methane in Ionic Liquids for Gas Removal Processes Using a Single Multilayer Perceptron Model. Processes 2024, 12, 539. https://doi.org/10.3390/pr12030539
Faúndez CA, Fierro EN, Muñoz AS. Solubility of Methane in Ionic Liquids for Gas Removal Processes Using a Single Multilayer Perceptron Model. Processes. 2024; 12(3):539. https://doi.org/10.3390/pr12030539
Chicago/Turabian StyleFaúndez, Claudio A., Elías N. Fierro, and Ariana S. Muñoz. 2024. "Solubility of Methane in Ionic Liquids for Gas Removal Processes Using a Single Multilayer Perceptron Model" Processes 12, no. 3: 539. https://doi.org/10.3390/pr12030539