Article

Determination of 24 Trace Aromatic Substances in Rosemary Hydrosol by Dispersed Liquid–Liquid Microextraction–Gas Chromatography

Hunan Provincial Institute of Product and Goods Quality Inspection, Changsha 410007, China
*
Authors to whom correspondence should be addressed.
Processes 2024, 12(3), 498; https://doi.org/10.3390/pr12030498
Submission received: 8 February 2024 / Revised: 24 February 2024 / Accepted: 25 February 2024 / Published: 28 February 2024

Abstract

:
A combined dispersed liquid–liquid microextraction (DLLME) and chromatography (GC) method was developed for the determination of 24 aromatic substances in rosemary hydrosol in this work. The pretreatment method of DLLME was optimized by carefully selecting the appropriate extraction agents, dispersants, and their respective amounts. With carbon tetrachloride as the extractant and acetone as the dispersant, the enrichment factor of DLLME is 13.3, and the 24 target substances such as eucalyptol, camphor and verbenone can be separated within 31 min and quantified by an external standard method using gas chromatography (GC). The correlation coefficient r2 of the linear regression equation is within the range of 0.9983 to 0.9991. The detection limit of the method was 0.02 mg/L, the recovery rate of the spiked solution was 76.4–118.4%, the relative standard deviation was 0.4–6.9% and the method was used to detect the semi-finished products of rosemary hydrosol and the finished rosemary hydrosol sold on the market. This method also provides a reference for the qualitative and quantitative determination of aromatic substances in other hydrosols.

1. Introduction

Rosemary, also known as Rosmarinus officinalis, is a perennial evergreen subshrub plant, belonging to the angiosperms, dicotyledonous plants and tubular flowering trees. Rosemary is native to Europe and North Africa along the Mediterranean coast and is now widely cultivated in many countries in Europe, North America and China [1,2,3]. Rosemary hydrosol has a natural rosemary fragrance, which can be used as a raw material for the production of cosmetics or facial masks [4]. It has antioxidant [5,6], antibacterial [7,8] and other effects. Tornuk et al. [9] used rosemary extract as a food disinfectant in their research. The composition of rosemary essential oils varies greatly due to different germplasm resources, growing regions, climates and environments [10,11]. Similar to rosemary essential oil, rosemary hydrosol can be divided into Tunisian, Moroccan and Spanish types according to their different germplasm resources. Among them, Tunisian and Moroccan rosemary hydrosol are habitually called “camphor rosemary hydrosol” because they are rich in camphor, and Spanish rosemary hydrosol is habitually called “verbenone rosemary hydrosol” because it is rich in verbenone [12,13].
In the field of rosemary hydrosol analysis, researchers have explored various methods to determine the composition and content of its components. Two commonly used techniques are direct injection and concentrated injection after ether extraction [5,14,15]. Direct injection involves directly injecting the rosemary hydrosol sample into the analytical instrument without any additional sample preparation steps. This method is simple and convenient but may not be sensitive enough to detect trace organic matter due to the low organic content in rosemary hydrosol. Concentrated injection after ether extraction, on the other hand, involves extracting the components from the hydrosol using an ether solvent and then concentrating the extract before injection into the instrument. This method allows for better detection of trace organic compounds by increasing their concentration. However, it requires a significant amount of ether per sample and can lead to the loss of volatile components during the concentration process. In a study conducted by Kenichi Tomi et al., 1000 μL of hydrosol was transferred into a 1.5 mL sample tube, and then 100 μL of n-hexane and 50 mg of NaCl were added to extract aroma components into the organic fraction; finally, 0.5 μL of the resulting organic fraction was injected into the GC-MS system using a 5.0 μm micro syringe. However, the absolute content of analytes were not discussed in their work [15]. And in a study by Matteo Politi et al., the target analytes of rosemary samples were concentrated by solid phase microextraction (SPME) and analyzed by GC-MS. They also obtained the results of the relative content of rosemary samples [16]. To overcome these limitations, dispersive liquid–liquid microextraction (DLLME) has emerged as a promising technique for rosemary hydrosol analysis. DLLME involves dispersing a small volume of an extraction solvent (such as chloroform or dichloromethane) and a dispersant (typically a water-miscible organic solvent like acetone or ethanol) in the sample solution, creating a cloudy mixture [17,18,19]. Upon phase separation, the target analytes partition into the fine droplets of the extraction solvent, leading to improved enrichment efficiency and sensitivity. DLLME offers several advantages over traditional methods. It is relatively simple, rapid, cost-effective and requires only a small amount of extractants. Furthermore, DLLME reduces the consumption of organic solvents compared to other extraction techniques [20]. It can be easily coupled with various analytical instruments such as gas chromatography (GC) [21,22], liquid chromatography (LC) [23] or mass spectrometry (MS) [24] for the separation and detection of target compounds. However, there is currently a lack of literature reports utilizing DLLME as a pretreatment method for the determination of absolute content of aromatic compounds in rosemary by GC analysis. In this study, DLLME was selected as the extraction and concentration method for rosemary hydrosol analysis. The pretreatment method of DLLME was optimized by carefully selecting appropriate extraction agents, dispersants, and their respective amounts. By fine-tuning the extraction parameters, the method achieved a very low detection limit, enabling accurate determination of trace components in rosemary hydrosol when combined with gas chromatography. This advanced approach provides valuable insights into the antioxidant, antibacterial and odor-related properties of rosemary hydrosol, contributing to a deeper understanding of its chemical composition and potential benefits in various applications. It offers a novel and efficient way to analyze rosemary hydrosol and can serve as a foundation for further research in this field.

2. Materials and Methods

2.1. Materials and Reagents

The specified purities of the following standard substances were obtained from Shanghai Aladdin Biochemical Technology Co., Ltd. (Shanghai, China): α-Pinene (≥98.0%), (±)-Camphene (≥95.0%), β-Pinene (≥98.0%), Myrcene (≥90.0%), α-Terpinene (≥90.0%), (R)-(+)-Limonene (≥99.0%), Eucalyptol (≥99.5%), trans-2-Hexen-1-a (≥98.0%), γ-Terpinene (≥95.0%), 4-lsopropyltoluene (≥99.5%), Terpinolene (≥90.0%), Methyl heptenone (≥98.0%), cis-3-Hexen-1-ol (≥98.0%), D(+)-Camphor (≥96.0%), Linalool (≥98.0%), Linalyl Acetate (≥96.0%), Isobornyl Acetate (≥94.0%), (-)-trans-Caryophyllene (≥98.0%), 4-Carvomenthenol (≥98.0%), Isoborneol (≥90.0%), α-Terpineol (≥98.0%), (-)-Verbenone (≥95.0%), Neryl acetate (≥95.0%) and Geraniol (≥98.0%).
HPLC-grade carbon tetrachloride (MackLin, Shanghai, China) was used as the extractant, while pesticide residue-grade chloroform (Anpel, Shanghai, China) and dichloromethane (Anpel, Shanghai, China) were used as alternative extractants. Pesticide residue-grade acetone (Anpel, Shanghai, China) served as the dispersant and was also used for standard preparation. Additionally, HPLC-grade carbon disulfide (MackLin, Shanghai, China), pesticide residue-grade methanol (Anpel, Shanghai, China), pesticide-residue grade acetonitrile (Anpel, Shanghai, China), and HPLC-grade ethanol (Anpel, Shanghai, China) were utilized as dispersants. Analytical reagent sodium chloride (Sinopharm Chemical Reagent, Shanghai, China) was employed as an electrolyte. Ultrapure water (PERSEE, resistance = 18.2 MΩ, Shenzhen, China) was utilized for the experiment. Samples included both semi-finished rosemary hydrosols from a plant extract enterprise in Changsha, China, and finished rosemary hydrosols sourced from Taobao in Hangzhou, China. To prepare the calibration curve, the 24 types of standards were dissolved and freshly diluted in acetone to concentrations of 5, 10, 20, 50, 100 and 200 μg/mL.

2.2. Instruments and Equipment

An Nexis GC-2030 GC with a flame ionization detector (Shimadzu, Kyoto, Japan) and fused silica capillary column DB-WAX (polyethylene glycol coating, 30 m × 0.32 mm, 0.25 μm, Agilent, Santa Clara, CA, USA) were used for data acquisition. The detail paraments of the GC can be seen in Table 1. BSA224S electronic balance (accuracy 0.1 mg, Sedoris, Göttingen, Germany) was used for weighing reagents; S225D-1CN electronic balance (accuracy 0.01 mg, Sartorius, Göttingen, Germany) was used for weighing standard substances; 200 μL and 1 mL pipette guns (Eppendorf, Hamburg, Germany) were used to transfer standard solutions, extractants, and dispersants; EOFO-945617 single-hole vortex mixer (digital type, Talboys, Columbia, MD, USA) was used for extraction; H/T16MM centrifuge (Hexi, Tianjin, China) was used for centrifugal stratification; high-purity nitrogen (purity ≥ 99.999%, Changsha Rizhen, Changsha, China) was used for carrier gas.

2.3. Method

2.3.1. Preparation of Standard Solution and Establishing of Standard Curve

We accurately measured 100 mg of a standard substance and transferred it into a 50 mL beaker. Subsequently, 10–20 mL of acetone was added to the beaker, followed by dissolution through ultrasound. The resulting solution was then transferred to a 5 mL brown volumetric flask and further diluted with acetone. After thorough shaking, a 20 mg/mL single standard stock solution was prepared. To obtain single standard solutions for analysis in gas chromatography (GC), each single standard stock solution was sequentially diluted stepwise with acetone to achieve a concentration of 100 μg/mL. Retention time, determined by GC analysis, served as the qualitative basis for identifying each standard substance. For the preparation of a mixed standard stock solution, precisely 200 μL of each single standard stock solution was transferred into a 5 mL brown volumetric flask, followed by dilution with acetone and thorough shaking. This resulted in an 800 μg/mL mixed standard stock solution. Dilutions of the mixed standard stock solution with acetone were performed to obtain concentrations of 5, 10, 20, 50, 100, and 200 μg/mL for each standard substance. The pH value of rosemary hydrosol was approximately 5.5.
The enrichment factor (EF) plays a crucial role in evaluating the performance of the dispersive liquid–liquid microextraction (DLLME) method. It represents the concentration of the target substance in the extractant after extraction divided by the concentration of the target substance in the aqueous phase before extraction. Under the assumption that all target substances are fully extracted into the extractant, and the volumes of the extractant and aqueous phase remain constant before and after extraction, the enrichment factor can be calculated as the ratio of the volume of the aqueous phase to the volume of the extractant.
However, in practical analytical procedures, the volume of the organic phase may not necessarily match the volume of the added extractant after liquid–liquid microextraction. Some of the dispersant may be carried into the organic phase by the extractant, resulting in a larger final volume of the organic phase compared to the added extractant. Simultaneously, a portion of the extractant may be carried into the aqueous phase by the dispersant, leading to a smaller final volume of the organic phase than the added extractant. To account for these discrepancies, it becomes necessary to introduce a correction factor, denoted as K, to adjust the test results accordingly.
The incorporation of the correction factor K allows for accurate determination of the actual enrichment factor, considering the potential alterations in the volumes of both the organic phase and the extractant caused by the dispersant during the liquid–liquid microextraction process. This correction factor ensures the reliability and validity of the obtained results.

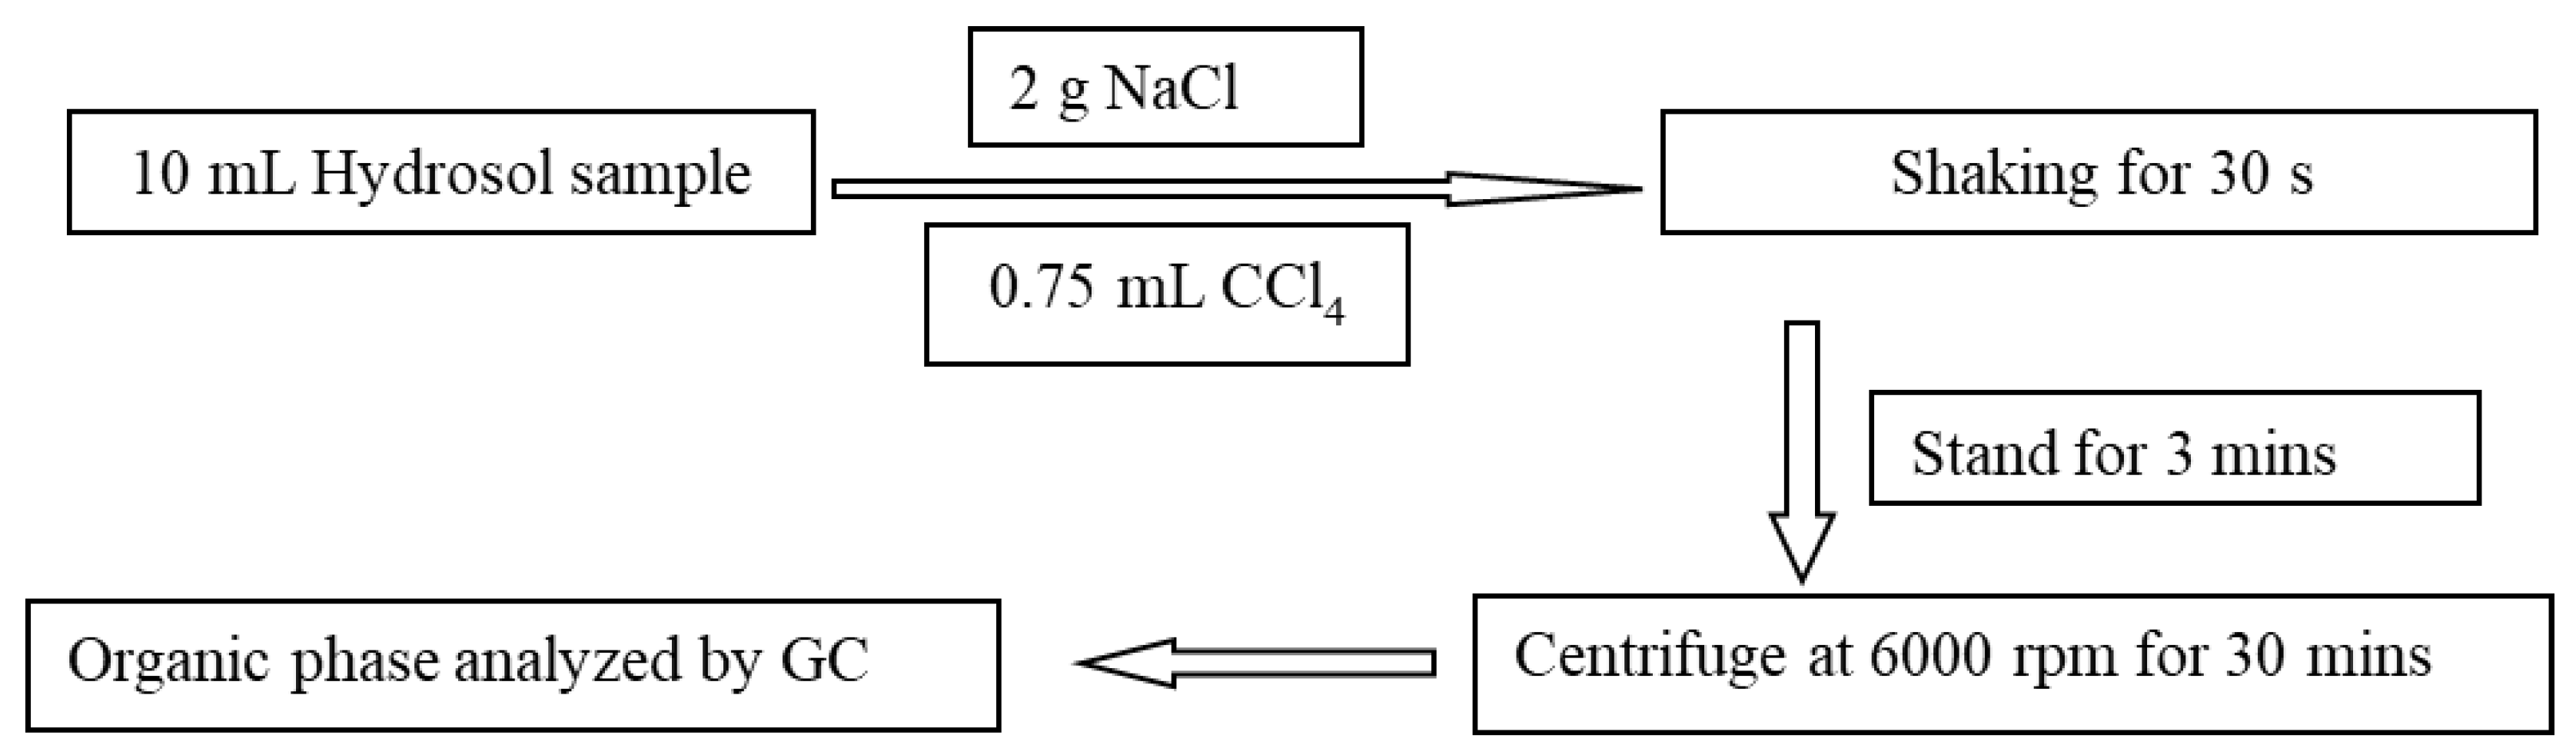
2.3.2. Sample Collection, Preparation and Detection

Eight samples were included in this study; Sample 1, Sample 2, Sample 3 and Sample 5 were purchased through the Taobao network. Sample 7 was a hydrosol produced from imported rosemary leaves and was provided by a plant extract company. Additionally, samples of hydrosol produced from rosemary leaves in Hunan (Sample 8), Henan (Sample 9), and Yunnan (Sample 10) were also included.
For the sample preparation, we referred to a previous study [19] and conducted certain optimizations based on them, the detailed steps were as follows: a 10 mL hydrosol sample was taken and mixed with 1.5 mL of acetone, followed by the addition of 2 g of NaCl. Subsequently, 0.75 mL of carbon tetrachloride was added to the mixture. The resulting solution was manually shaken 100 times and then subjected to scrolling for 30 s. After allowing the solution to stand undisturbed for 3 min, centrifugation was performed at a speed of 6000 r/min for 5 min. The organic phase present at the bottom of the centrifuge tube was carefully collected and transferred to an injection vial for further determination. Figure 1 shows the flow chart of sample pretreatment for 24 trace aromatic substances in rosemary hydrosol.

3. Results and Discussion

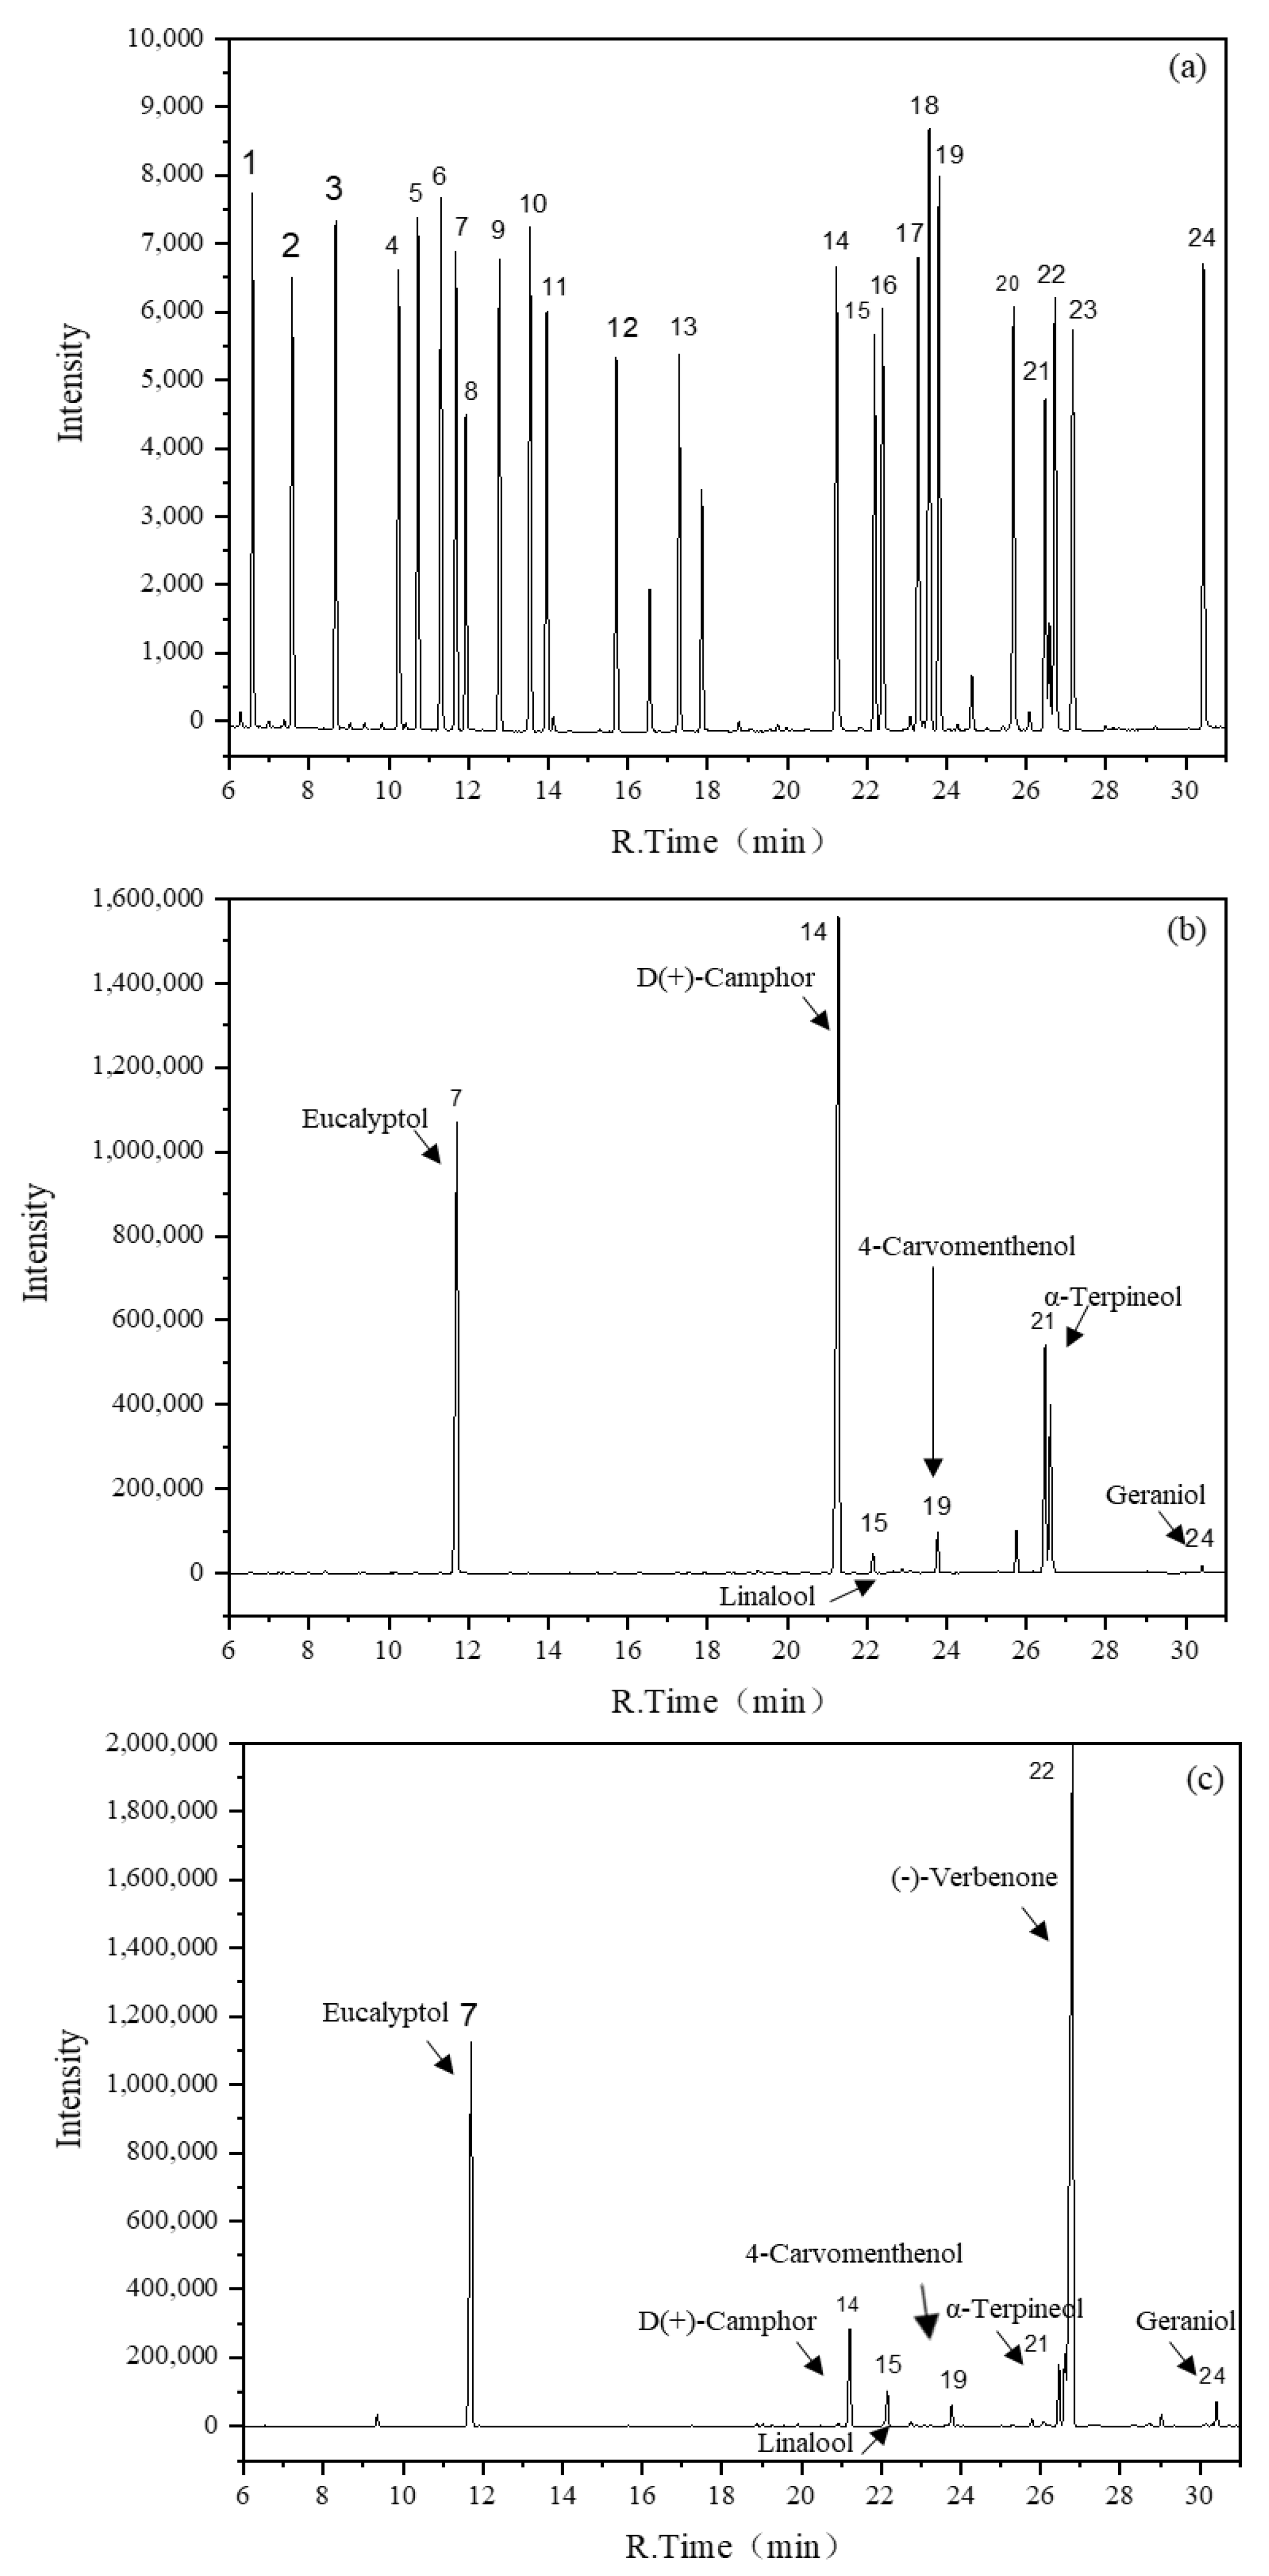
3.1. Gas Chromatograms of Target Analytes in Samples

As can be seen from Figure 2a, the 24 aromatic organic compounds of the gas chromatogram were completely separated in 31 min. After conducting calculations, the resolution of the 24 compounds ranged from 2.03 to 39.76, exceeding the minimum requirement of 1.5. This indicates that our method satisfies the criteria for both chromatographic separation and quantitative analysis. Table 2 presents the identification of the 24 target compounds along with their corresponding retention times, as denoted by the serial numbers in Figure 2a–c. Figure 2b,c show the gas chromatograms of the rosemary hydrosol produced by the imported rosemary leaves and the rosemary hydrosol produced by the Chinese rosemary leaves, respectively. As can be seen from Figure 2a and Table 2, the main components of rosemary hydrosol produced from imported leaves were eucalyptol and camphor, while the main components of hydrosol produced from domestic leaves were eucalyptol and verbenone.

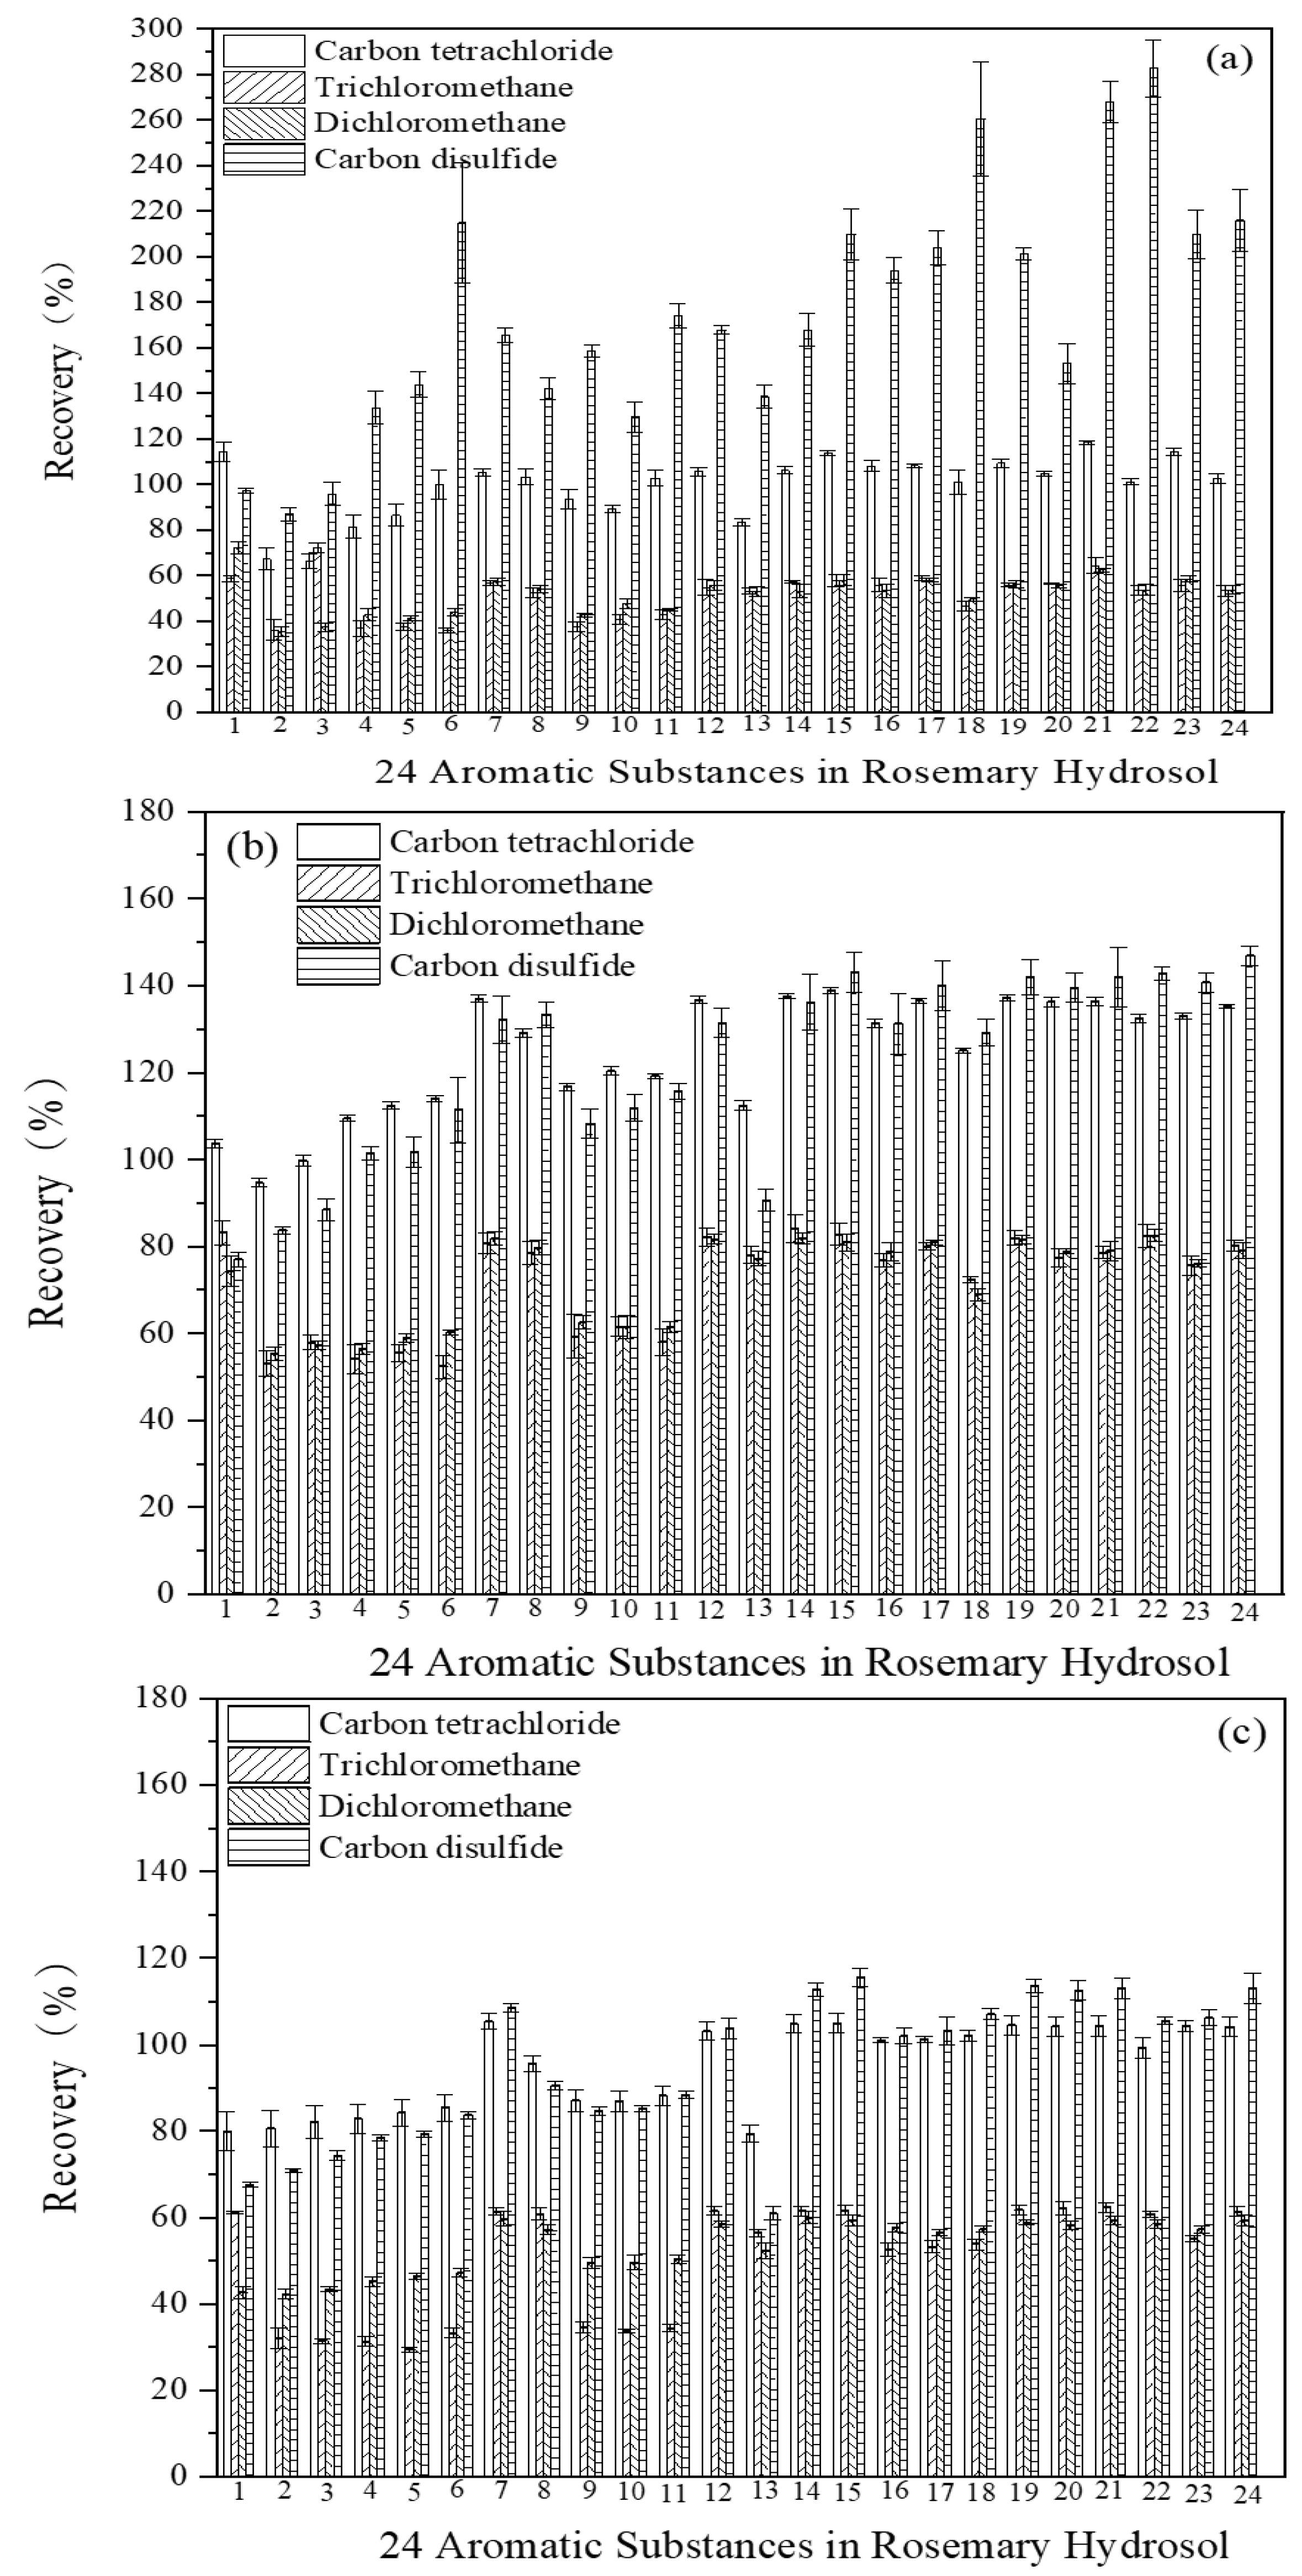
3.2. Selection of Extractant

Selection of an appropriate extractant is crucial for the extraction process to ensure the complete dissolution of all standard substances. The solubility of the target substance in the chosen extractant should be significantly higher compared to water. Additionally, the density of the chosen extractant should be notably greater than that of water to facilitate efficient centrifugation and stratification post-extraction. In this study, trichloromethane, dichloromethane, carbon tetrachloride and carbon disulfide were chosen as the extractants. To evaluate the recovery rates of the 24 standard substances at different spiking levels, mixed standard solution spikes with concentrations of 1.5 μg, 15 μg and 150 μg were added to the blank matrix for each extractant tested. Comparisons were made between the recovery rates of the 24 standard substances across the various extractants and concentrations. The recovery rates of the 24 standard substances were presented in Figure 3a–c. Notably, when carbon disulfide was employed as the extractant, significant variations were observed among different analytes, which could be attributed to their varying solubilities in carbon disulfide. Consequently, carbon disulfide was excluded from consideration as an extractant in this study. Comparative analysis revealed that carbon tetrachloride exhibited significantly higher recoveries (around 100%) for the 24 analytes compared to dichloromethane and chloroform. Furthermore, the chromatographic peak of trichloromethane substantially overlapped with (±)-2-pinene, while dichloromethane demonstrated a propensity to emulsify with water when used as an extractant. Therefore, carbon tetrachloride was selected as the preferred extractant for this investigation.

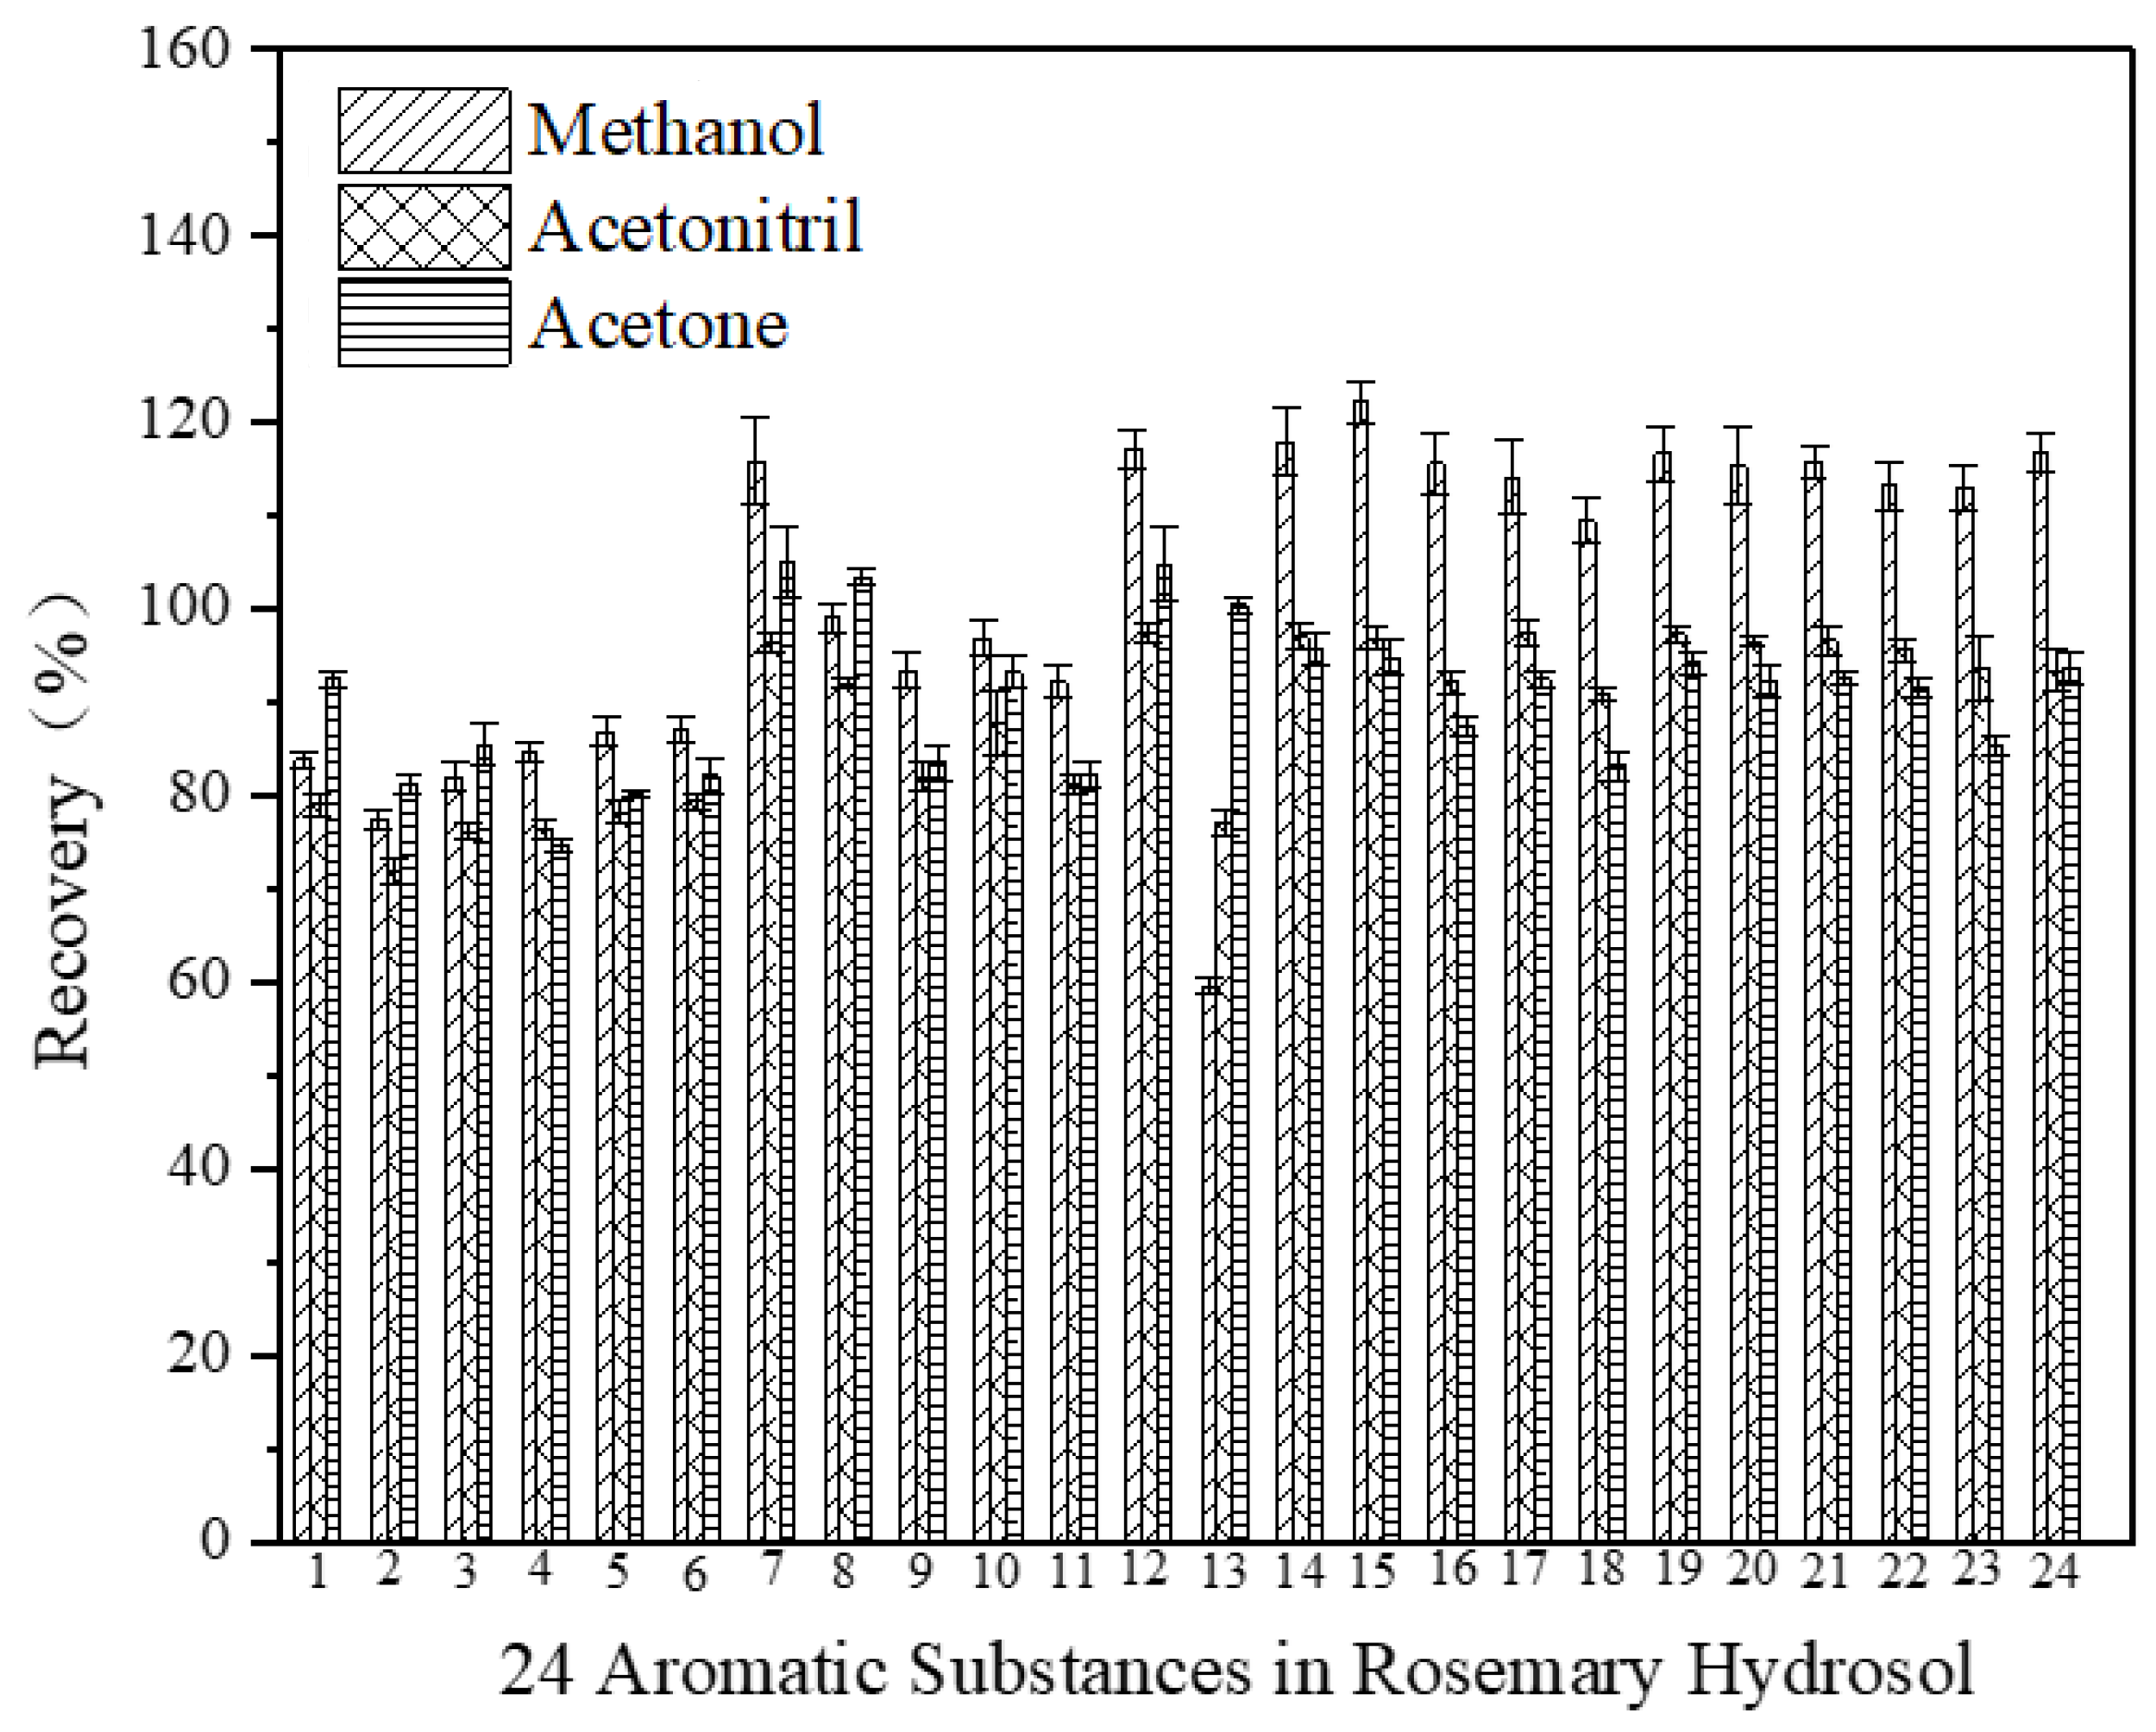
3.3. Selection of Dispersant

In order to facilitate the transfer of target analytes between the aqueous and organic phases, it is crucial for the dispersant to possess favorable solubility in both water and the chosen extractant. Additionally, the dispersant should demonstrate excellent solubility in the 24 reference materials. For the purpose of this study, acetone, hexane and methanol were carefully chosen as the dispersants for comprehensive evaluation. To evaluate the recovery rates of the 24 analytes at different concentrations, a standard solution containing 15 μg was added to the blank matrix using each dispersant. The main objective was to compare the recovery rates of the 24 analytes across various concentrations and dispersants, with the ultimate goal of identifying the most suitable dispersant that could effectively facilitate the smooth transfer of the reference materials between the aqueous and organic phases while achieving optimal recovery rates. The recovery rates of the 24 standard substances are presented in Figure 4. When methanol was utilized as the dispersant, it led to a higher migration of cis-3-hexene-1-ol into the water phase, resulting in an insufficient recovery rate of the spiked compound. Conversely, when acetone was used as the dispersant, the recovery rate of the added standard exceeded that of acetonitrile. Additionally, it was observed that acetonitrile had a propensity to cause losses in the gas chromatographic column. Consequently, acetone was chosen as the preferred dispersant for this study.

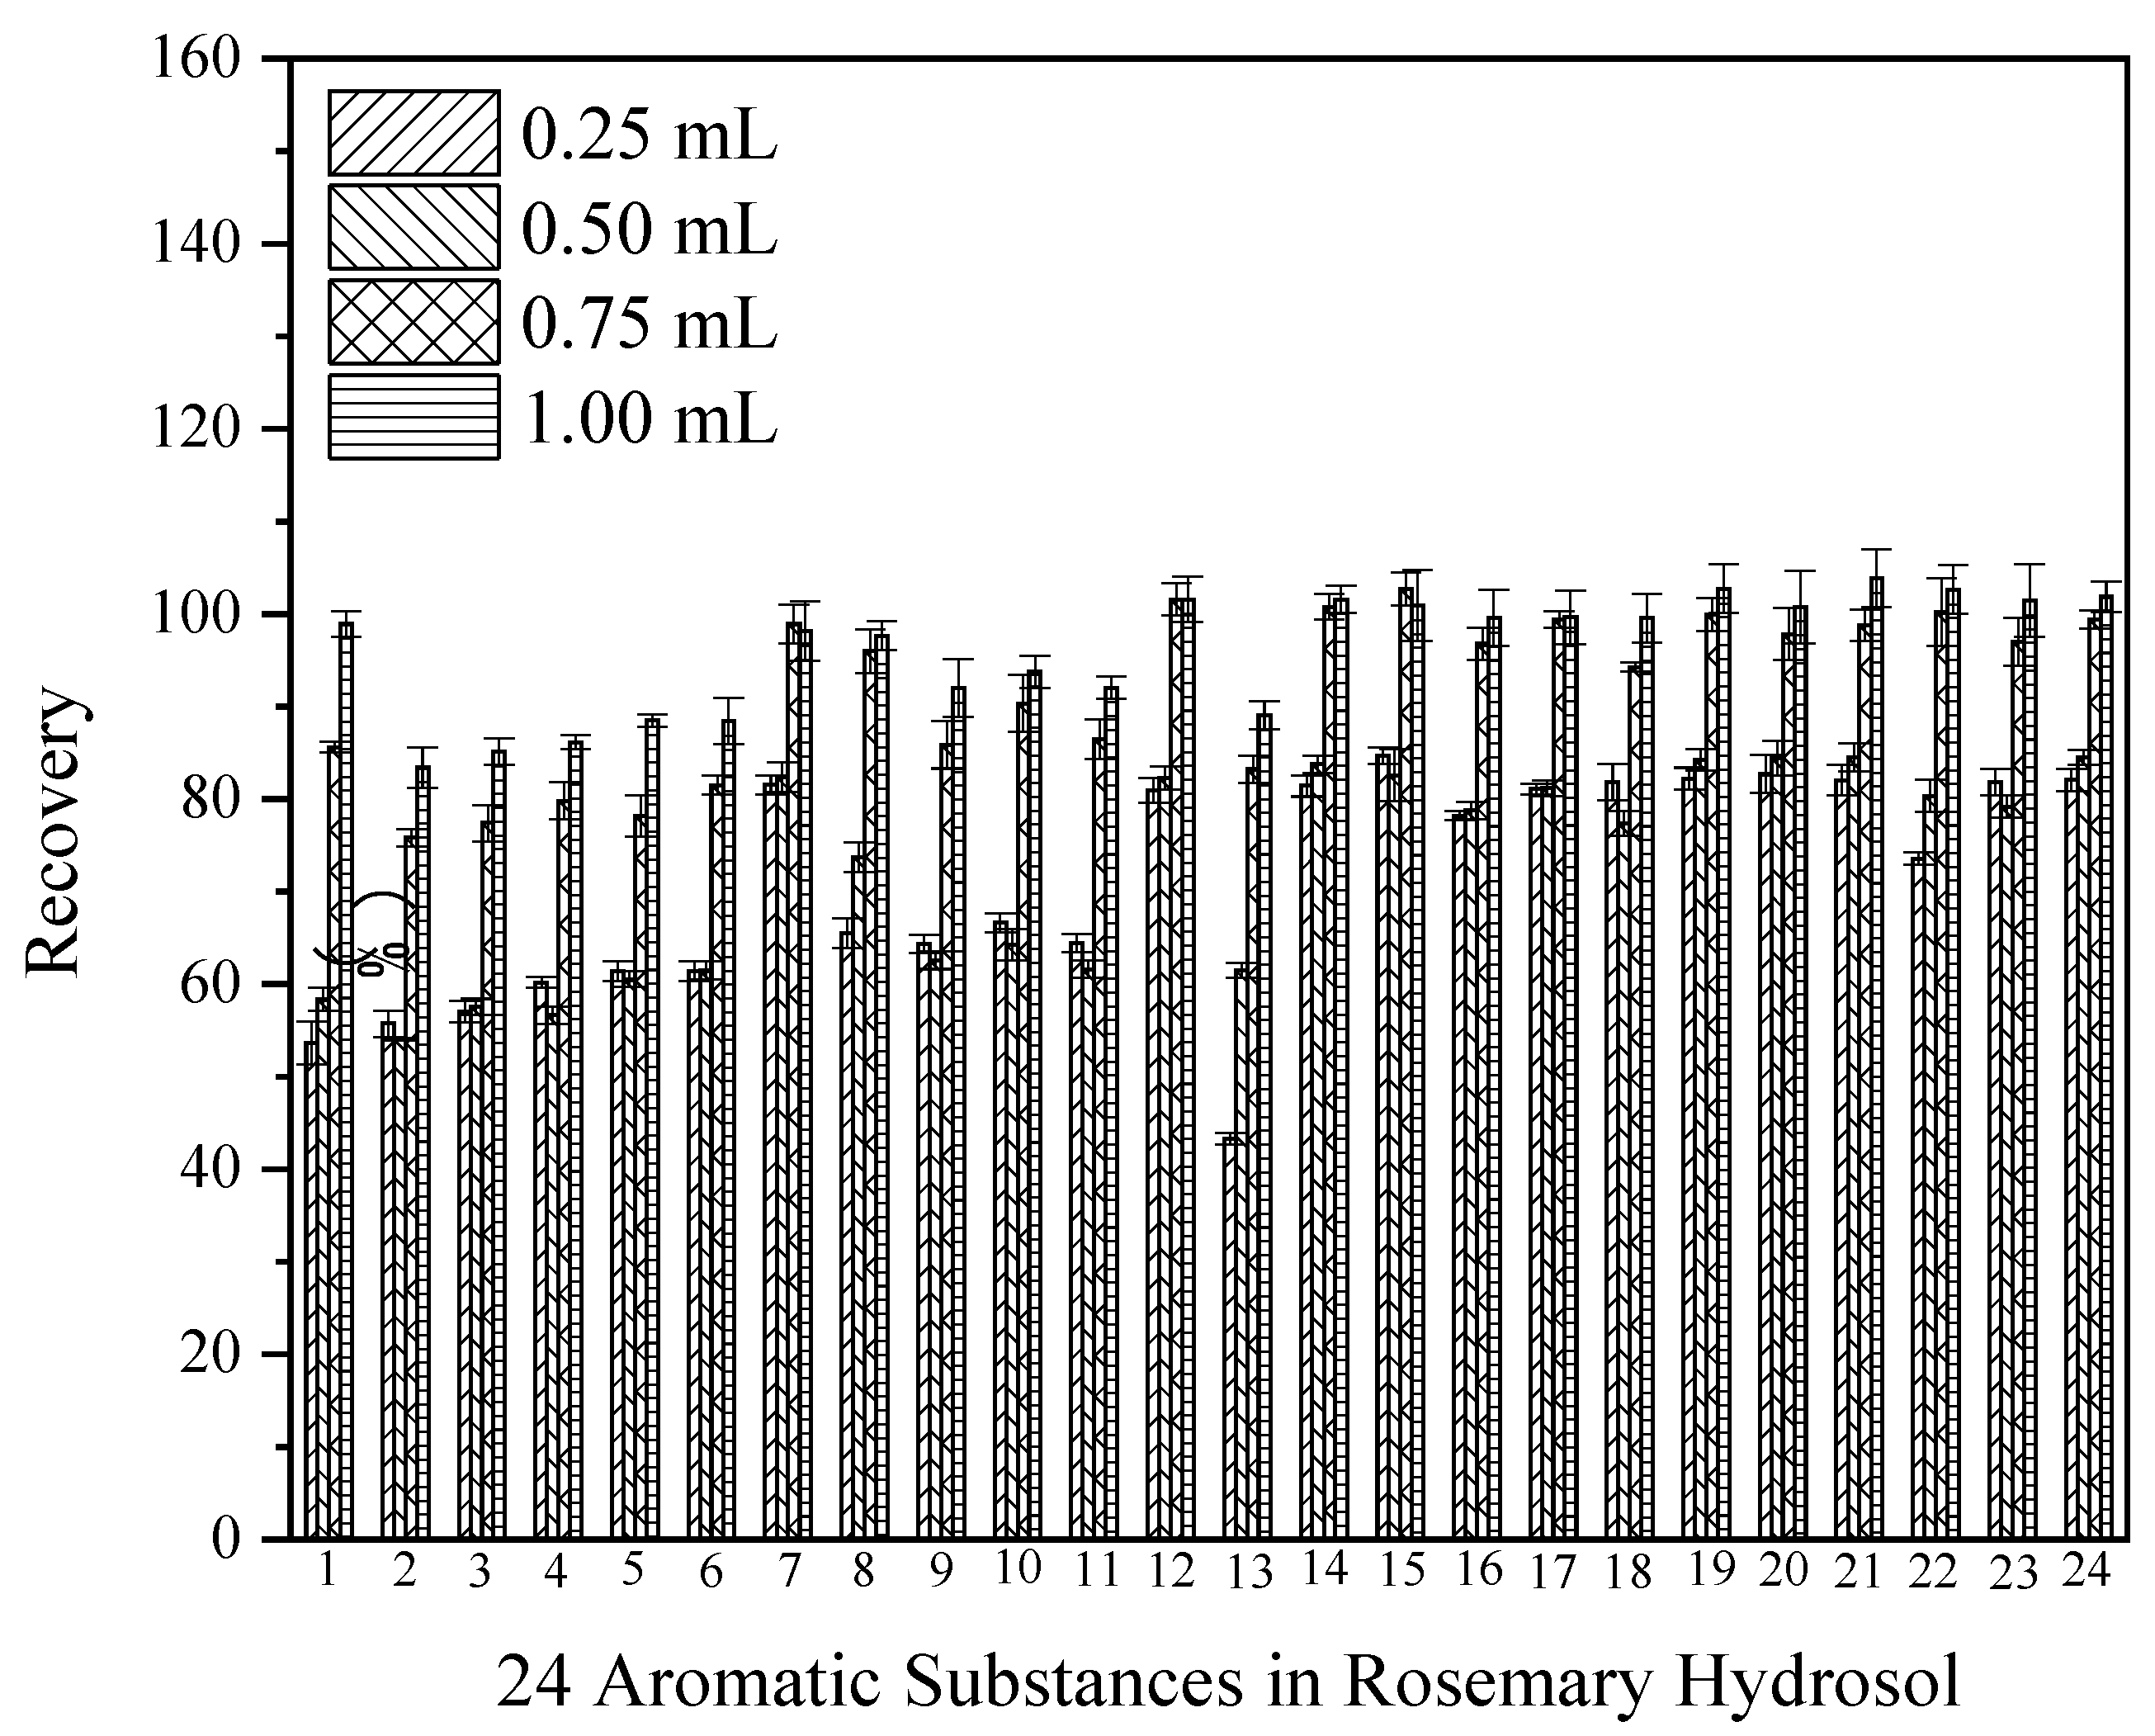
3.4. Optimization of Extractant Volume

The volume of the extractant plays a crucial role in determining the extraction efficiency. Insufficient extractant volume may result in incomplete transfer of the target substance from the aqueous phase to the organic phase, while excessive extractant volume can lead to reduced enrichment factor and higher detection limits for the target substances, thereby negating the advantages of dispersed liquid–liquid microextraction. In this study, carbon tetrachloride was selected as the extractant, and volumes of 0.25 mL, 0.50 mL, 0.75 mL, and 1.00 mL were chosen for evaluation of the extraction of 24 aromatic organic compounds in samples. Each volume of extractant was added to the blank matrix containing 15 μg of the mixed standard solution. The objective of this investigation was to compare the recovery rates of the 24 standard substances under different dispersants at varying volumes of carbon tetrachloride extractant. And the recovery rate of 24 standard substances in samples is shown in Figure 5. The recovery rates of carbon tetrachloride extractant at 0.75 and 1.0 mL were significantly higher than that at 0.25 and 0.50 mL. When the volume of extractant was 0.75 mL and 1.0 mL, the recovery rate of spiking was similar. Considering the same sample volume, the larger the volume of the extractant was, the smaller the enrichment factor was. So, 0.75 mL was selected as the volume of carbon tetrachloride as the extractant in this study.

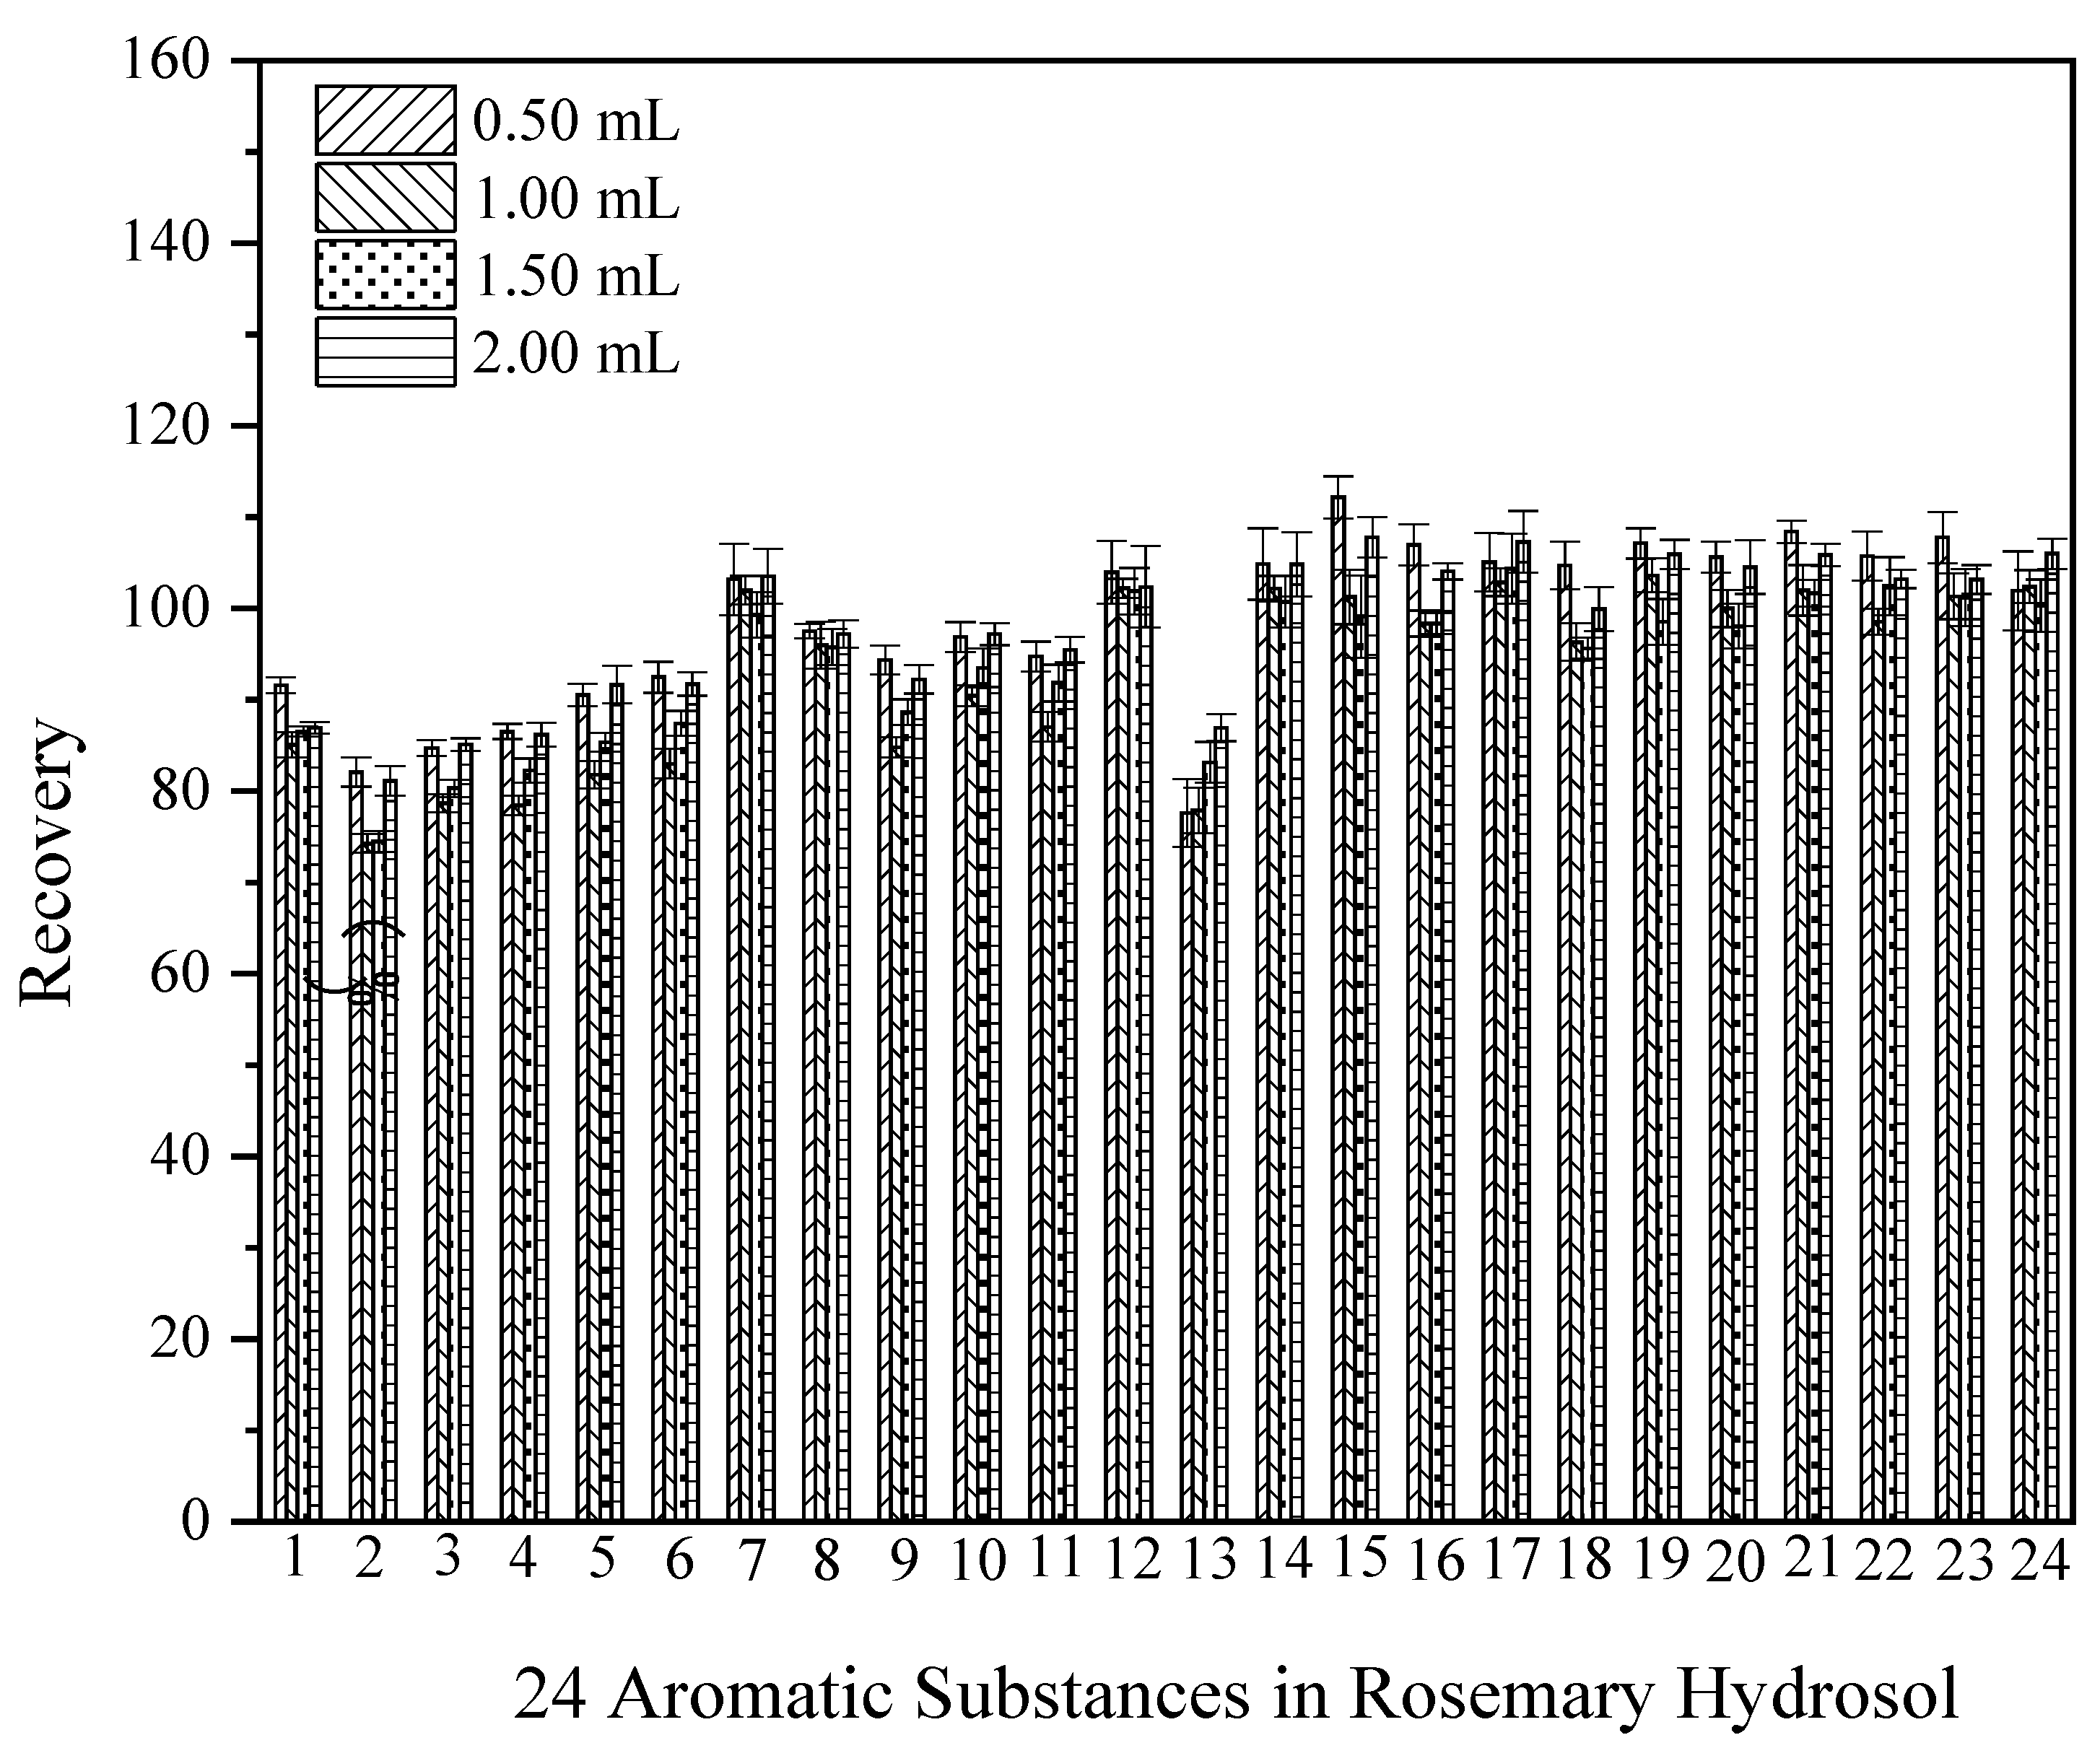
3.5. Optimization of Dispersant Volume

The volume of the dispersant plays a crucial role in determining the efficiency of extraction. Insufficient dispersant volume can hinder the rapid transfer of the target substance between the aqueous and organic phases, while excessive dispersant volume can result in a larger organic phase volume and reduced enrichment factor. Moreover, some dispersants may dissolve in the water phase after microextraction, leading to the loss of target substances and lower recovery rates. In this study, acetone was chosen as the dispersant. Each volume of dispersant was added to the blank matrix containing 15 μg of the mixed standard solution. The recovery rates of the 24 standard substances when varying the volume of acetone dispersant to 0.75, 1.0, 1.5 and 2.0 mL, respectively, are shown in Figure 6. It was observed that there was minimal variation in the recovery of the 24 reference materials as the volume of dispersant changed. Therefore, for this study, a volume of 1.5 mL was selected as the appropriate amount of acetone dispersant.

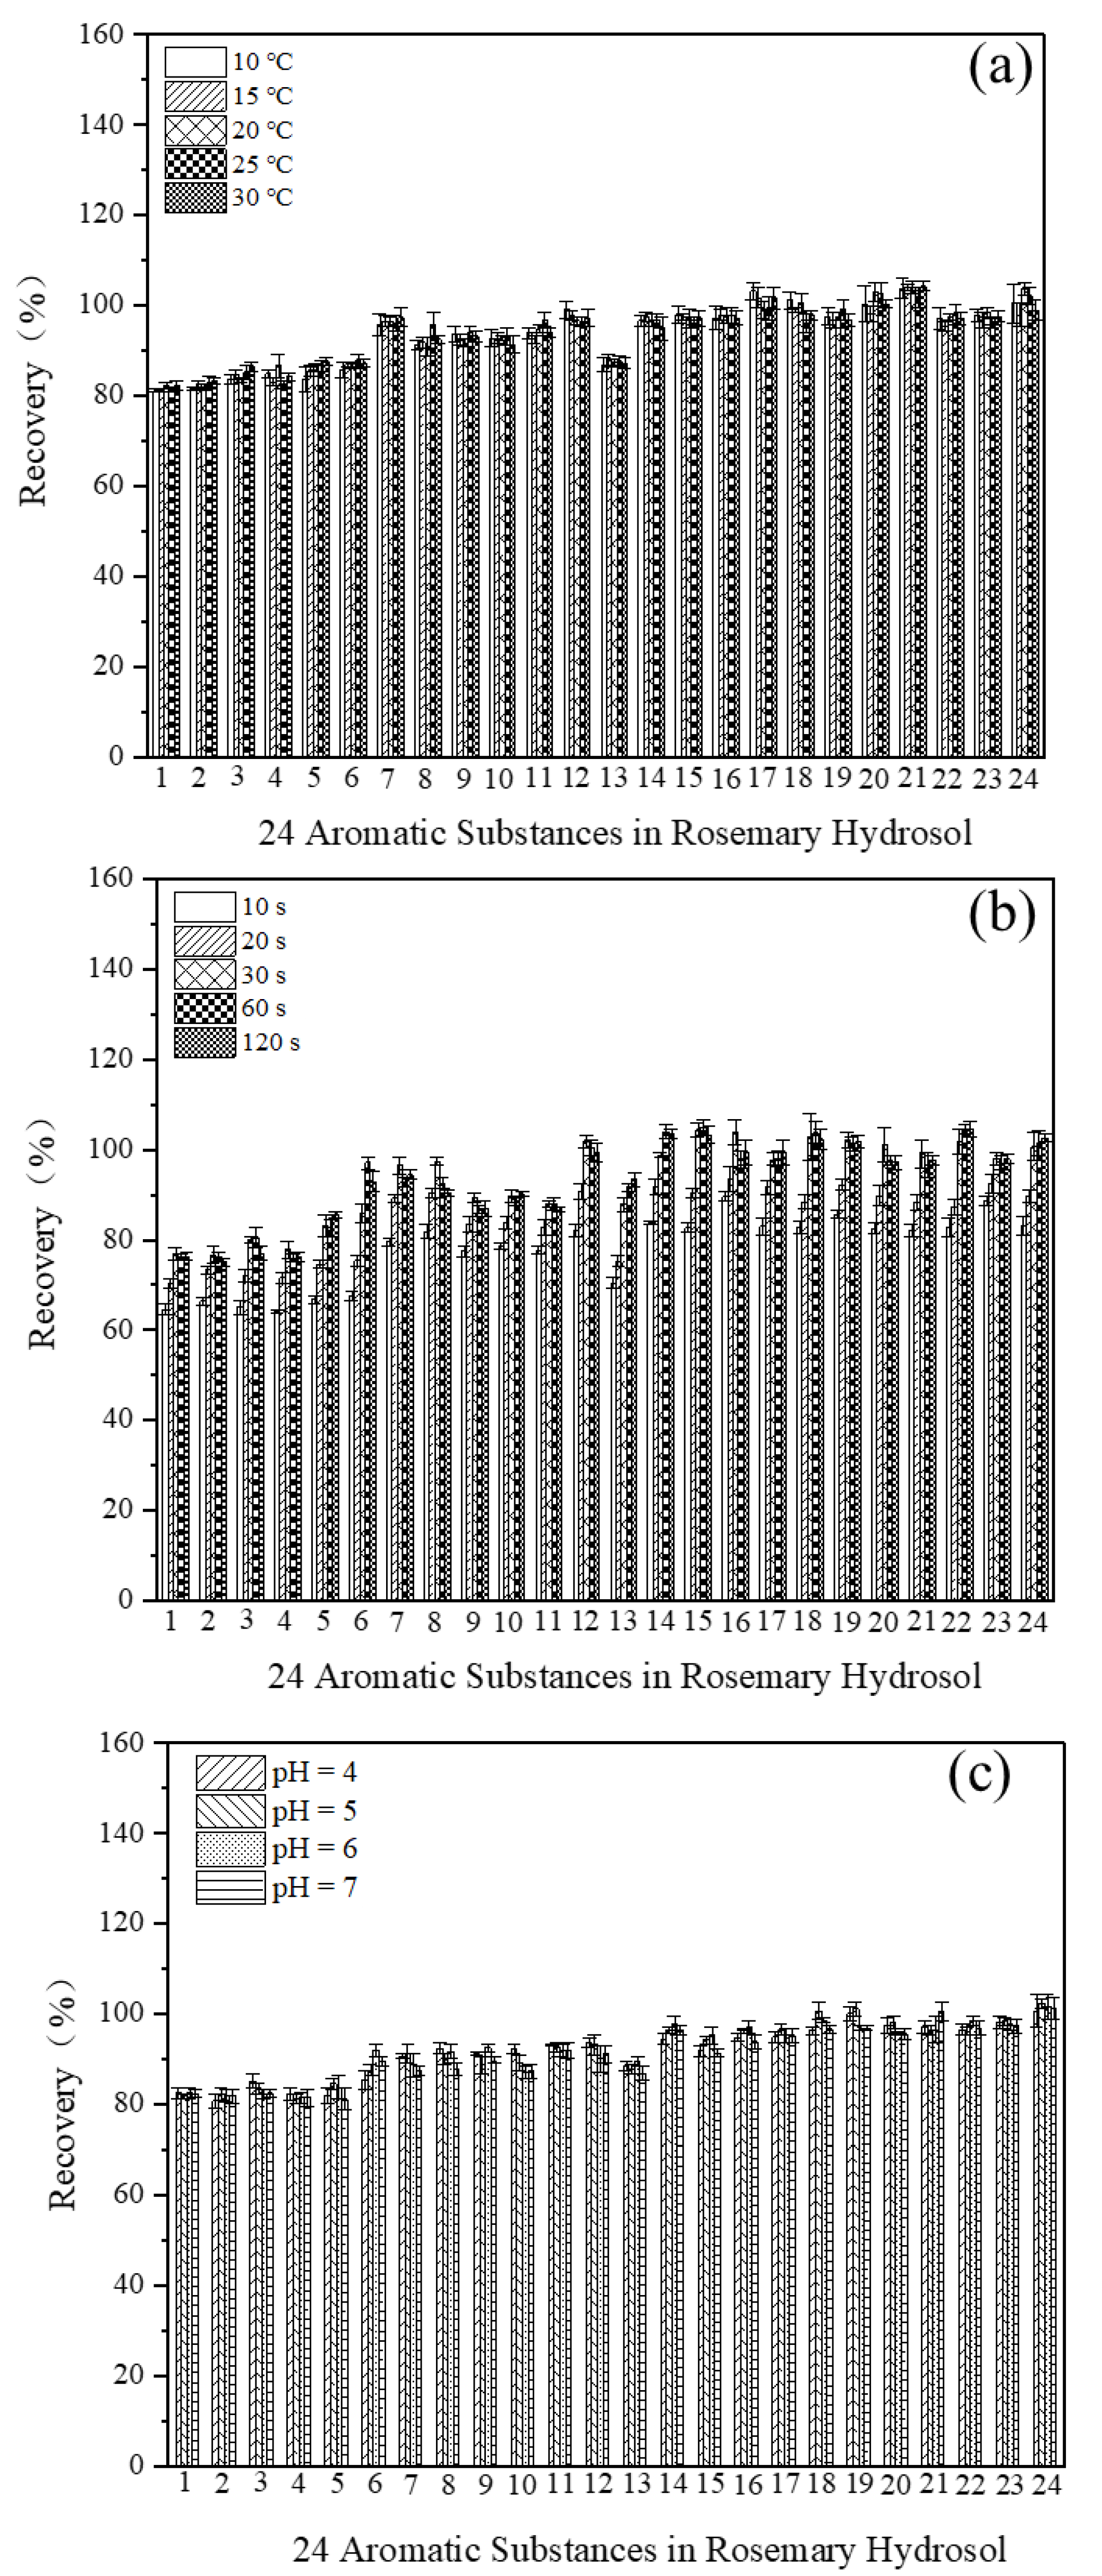
3.6. Optimization of DLLME Parameters

The pretreatment parameters of DLLME, including extraction time, temperature and pH value, may affect the extraction recovery of the 24 target analytes in rosemary hydrosol samples. So, in this work, the parameters of extraction time (10, 20, 30, 60, 120 s), temperature (10, 15, 20, 25, 30 °C) and pH (4, 5, 6 and 7) were optimized. As shown in Figure 7a, extraction temperature had a minimal impact on the recovery rate of analytes, so the extraction experiments can be conducted at room temperature (10–30 °C). As for the extraction time (see Figure 7b), the extraction efficiency gradually increases when the extraction time is between 10 and 30 s, and it stabilizes when the extraction time is between 30 and 120 s. According to the principles of DLLME, the dispersant transfers multiple times between the sample and the extraction solvent during the extraction process. The target analytes are quickly extracted from the sample into the extraction solvent. This is one of the advantages of DLLME compared to other extraction methods. Thus, 30 s was chosen as the optimal extraction time. Moreover, as can be seen from Figure 7c, pH had a negligible effect on the recovery rate when the pH value was in the range of 4–6. Consequently, there was no requirement for pH adjustment during the analytical determination of the sample.

3.7. Retention Time, Method Detection Limit, Linear Regression Equation and Correlation Coefficient

The peak time, method detection limit, linear regression equation and correlation coefficient r2 of 24 standard substances are shown in Table 3. The linearity of 24 reference materials was good in the range of 5~200 μg/mL, and the detection limits of the method were 0.02 mg/L. The detection limits of the liquid–liquid microextraction method were significantly lower than those of the direct injection and liquid–liquid extraction method.
Table 4 shows the comparison of different pretreatment methods for the detection of aromatic compounds in rosemary hydrosol. The aromatic substances in rosemary hydrosol were directly injected and detected using GC-MS, obtaining the relative content of compounds through the reported studies [25,26,27]. And in the work conducted by Dganit Sadeh, 1 g sample was added into 0.01 L solvent, and then shaken for 24 h at room temperature, then 2 mL sample was injected into the GC-MS system after the cleaning steps, obtaining the relative content of analytes [10]. Through comparative analysis, the method of DLLME combined with GC for the detection of 24 aromatic compounds in rosemary hydrosol exhibits several advantages, including reduced pre-processing time and lower reagent consumption. Most significantly, our method allows for the absolute quantification of aromatic compounds in rosemary, a capability that distinguishes it from other approaches in the field.

3.8. Recovery, Precision, Enrichment Factor and Correction Factor

All figures and tables show that, for the samples spiked with 1.5, 15 and 150 μg concentrations determined by GC, as can be seen from Table 4, the recovery rate was in the range of 76.4~138.8%, and the relative standard deviation of the 24 target substances was 0.4~6.9%. This indicated that most of the aromatic organic compounds in samples could be extracted using the DLLME method. High recoveries of target compounds in samples demonstrated that the proposed method could be efficient in determining the 24 target substances in realistic rosemary hydrosol.
In this study, the sampling volume was 10 mL, and the extraction volume was 0.75 mL, resulting in an enrichment factor of 13.3. In the actual testing process, the volume of the organic phase may not be consistent with the volume of the added extractant in liquid–liquid microextraction. This is due to the potential transfer of dispersants between phases, leading to variations in the final organic phase volume compared to the added extractant volume. To account for these effects, a correction factor (K) is introduced. The value of the correction factor (K) can be determined based on the recovery rates of the 24 target substances at different spiked concentrations.
From Table 5, it can be observed that when the mixed standard was added at a quantity of 1.5 μg, the recovery range was between 76.4% and 118.4%, indicating good recovery rates. Therefore, for sample contents equal to or less than 0.15 mg/L, the correction factor was considered as 1. Similarly, when the mixed standard was added at a quantity of 150 μg, the recovery range ranged from 81.3% to 105.4%, demonstrating satisfactory recovery rates. Hence, for sample contents greater than or equal to 15 mg/L, the correction factor was also determined as 1. Additionally, when the mixed standard plus scalar quantity amounted to 15 μg, the recovery rate fell within the range of 94.6% to 137.0%, indicating relatively high recovery rates. After multiplying the recovery rates of the 24 target substances by 0.85, the corrected recovery rates were found to range from 80.4% to 116.4%. Therefore, for sample contents ranging from 1.5 mg/L to 15 mg/L, the target substance content in the sample should be multiplied by the correction factor of 0.85.

3.9. Determination of Real Samples

Table 6 reveals significant differences in the content of main components among various samples. The semi-finished rosemary hydrosol products (Sample 7, Sample 8, Sample 9 and Sample 10) exhibited considerably higher content levels compared to commercially available rosemary products (Sample 1, Sample 2, Sample 3 and Sample 5). Additionally, the aroma of the semi-finished products was noticeably stronger than that of regular rosemary products. These findings suggest potential dilution or blending practices during the production of semi-finished rosemary hydrosol products. Moreover, the main component content varied significantly between semi-finished rosemary hydrosol products made from imported rosemary leaves and those produced using domestically grown leaves from Hunan, Henan, and Yunnan Provinces in China. This indicates that the origin of the raw materials influences the composition of the semi-finished hydrosol products.

4. Conclusions

A method for the determination of 24 target substances in rosemary hydrosol using external standard dispersion liquid–liquid microextraction and gas chromatography was established. The effects of different extractants, dispersant types and contents on the recovery rate of spiking were compared. Carbon tetrachloride and acetone were selected as extractants and dispersants, respectively. The volume of extractant was 0.75 mL and the volume of dispersant was 1.5 mL. The linearity was good, within the range of 5~200 μg/mL, the detection limit of the method was 0.02 mg/L and the recovery rate and precision were good. It is a good method to detect the absolute content of trace aromatic substances in rosemary hydrosol, and also provides a reference for the detection of trace aromatic substances in other hydrosols.

Author Contributions

Experimental design, X.Z.; Experimental operation and article writing, H.H.; Spectra analysis, L.Y.; Data processing and statistics, H.W.; Sample pretreatment, C.Z. All authors have read and agreed to the published version of the manuscript.

Funding

This work was financially supported by the National Natural Science Foundation of Hunan province (Grant no. 2023JJ60528 and 2023JJ60147), and Hunan Provincial Market Supervision Administration Science and Technology Plan Project (2023KJJH21).

Data Availability Statement

The data presented in this study are available on request from the corresponding author.

Conflicts of Interest

The authors declare no conflicts of interest.

References

  1. Dai, P.; Liu, H. Research on the biological activity of rosemary extracts and its application in food. E3S Web Conf. EDP Sci. 2021, 251, 02034. [Google Scholar] [CrossRef]
  2. Touafek, O.; Nacer, A.; Kabouche, A.; Kabouche, Z.; Bruneau, C. Chemical composition of the essential oil of Rosmarinus officinalis cultivated in the Algerian Sahara. Chem. Nat. Compd. 2004, 40, 28–29. [Google Scholar] [CrossRef]
  3. Holmes, P. Rosemary oil The wisdom of the heart. Int. J. Aromather. 1998, 9, 62–66. [Google Scholar] [CrossRef]
  4. Damianova, S.; Tasheva, S.; Stoyanova, A.; Damianov, D. Investigation of extracts from rosemary (Rosmarinus officinalis L.) for application in cosmetics. J. Essent. Oil Bear. Plants 2010, 13, 1–11. [Google Scholar] [CrossRef]
  5. Jeon, D.H.; Moon, J.Y.; Hyun, H.B.; Cho, S.K. Composition analysis and antioxidant activities of the essential oil and the hydrosol extracted from Rosmarinus officinalis L. and Lavandula angustifolia Mill. produced in Jeju. J. Appl. Biol. Chem. 2013, 56, 141–146. [Google Scholar] [CrossRef]
  6. Aazza, S.; Lyoussi, B.; Miguel, M.G. Antioxidant activity of some Morrocan hydrosols. J. Med. Plants Res. 2011, 5, 6688–6696. [Google Scholar]
  7. Dheyab, A.S.; Kanaan, M.Q.; Hussein, N.A.; AlOmar, M.K.; Sabran, S.F.; Abu Bakar, M.F. Antimycobacterial Activity of Rosmarinus officinalis (Rosemary) Extracted by Deep Eutectic Solvents. Separations 2022, 9, 271. [Google Scholar] [CrossRef]
  8. Jiang, Y.; Wu, N.; Fu, Y.-J.; Wang, W.; Luo, M.; Zhao, C.-J.; Zu, Y.-G.; Liu, X.-L. Chemical composition and antimicrobial activity of the essential oil of Rosemary. Environ. Toxicol. Pharmacol. 2011, 32, 63–68. [Google Scholar] [CrossRef]
  9. Tornuk, F.; Cankurt, H.; Ozturk, I.; Sagdic, O.; Bayram, O.; Yetim, H. Efficacy of various plant hydrosols as natural food sanitizers in reducing Escherichia coli O157: H7 and Salmonella Typhimurium on fresh cut carrots and apples. Int. J. Food Microbiol. 2011, 148, 30–35. [Google Scholar] [CrossRef]
  10. Sadeh, D.; Nitzan, N.; Chaimovitsh, D.; Shachter, A.; Ghanim, M.; Dudai, N. Interactive effects of genotype, seasonality and extraction method on chemical compositions and yield of essential oil from rosemary (Rosmarinus officinalis L.). Ind. Crop. Prod. 2019, 138, 111419. [Google Scholar] [CrossRef]
  11. Celiktas, O.Y.; Kocabas, E.E.H.; Bedir, E.; Sukan, F.V.; Ozek, T.; Baser, K.H.C. Antimicrobial activities of methanol extracts and essential oils of Rosmarinus officinalis, depending on location and seasonal variations. Food Chem. 2007, 100, 553–559. [Google Scholar] [CrossRef]
  12. Singh, M.; Guleria, N. Influence of harvesting stage and inorganic and organic fertilizers on yield and oil composition of rosemary (Rosmarinus officinalis L.) in a semi-arid tropical climate. Ind. Crop. Prod. 2013, 42, 37–40. [Google Scholar] [CrossRef]
  13. Issabeagloo, E.; Kermanizadeh, P.; Taghizadieh, M.; Forughi, R. Antimicrobial effects of rosemary (Rosmarinus officinalis L.) essential oils against Staphylococcus spp. J. Microbiol. Res. 2012, 6, 5039–5042. [Google Scholar]
  14. Boussalah, N.M. Chemical composition and biological activities of essential oil and hydrosol extract from aerial parts of Cynoglossum cheirifolium L. from Algeria. J. Essent. Oil Bear. Plants 2020, 23, 97–104. [Google Scholar] [CrossRef]
  15. Tomi, K.; Kitao, M.; Konishi, N.; Murakami, H.; Matsumura, Y.; Hayashi, T. Enantioselective GC–MS analysis of volatile components from rosemary (Rosmarinus officinalis L.) essential oils and hydrosols. Biosci. Biotechnol. Biochem. 2016, 80, 840–847. [Google Scholar] [CrossRef]
  16. Politi, M.; Ferrante, C.; Menghini, L.; Angelini, P.; Flores, G.A.; Muscatello, B.; De Leo, M. Hydrosols from Rosmarinus officinalis, Salvia officinalis, and Cupressus sempervirens: Phytochemical analysis and bioactivity evaluation. Plants 2022, 11, 349. [Google Scholar] [CrossRef]
  17. Ding, M.; Liu, W.; Peng, J.; Liu, X.; Tang, Y. Simultaneous determination of seven preservatives in food by dispersive liquid-liquid microextraction coupled with gas chromatography-mass spectrometry. Food Chem. 2018, 269, 187–192. [Google Scholar] [CrossRef] [PubMed]
  18. Luo, M.; Liu, D.; Zhou, Z.; Wang, P. A new chiral residue analysis method for triazole fungicides in water using dispersive liquid-liquid microextraction (DLLME). Chirality 2013, 25, 567–574. [Google Scholar] [CrossRef] [PubMed]
  19. Rezaee, M.; Assadi, Y.; Hosseini, M.-R.M.; Aghaee, E.; Ahmadi, F.; Berijani, S. Determination of organic compounds in water using dispersive liquid–liquid microextraction. J. Chromatogr. A 2006, 1116, 1–9. [Google Scholar] [CrossRef] [PubMed]
  20. Dmitrienko, S.G.; Apyari, V.V.; Tolmacheva, V.V.; Gorbunova, M.V. Dispersive liquid–liquid microextraction of organic compounds: An overview of reviews. J. Anal. Chem. 2020, 75, 1237–1251. [Google Scholar] [CrossRef]
  21. Rezk, M.R.; Abd El-Aleem, A.E.; Khalile, S.M.; El-Naggar, O.K. Determination of residues of diazinon and chlorpyrifos in lavender and rosemary leaves by gas chromatography. J. AOAC Int. 2018, 101, 587–592. [Google Scholar] [CrossRef] [PubMed]
  22. Chandra, S.; Mahindrakar, A.N.; Shinde, L.P. Gas chromatography–mass spectrometry determination of pesticide residue in fruits. Int. J. Chemtech. Res. 2014, 6, 124–130. [Google Scholar]
  23. Newair, E.F.; Garcia, F. Identification of adducts between oxidized rosmarinic acid and glutathione compounds by electrochemistry, liquid chromatography and mass spectrometry. Anal. Methods 2022, 14, 286–297. [Google Scholar] [CrossRef] [PubMed]
  24. Herrero, M.; Plaza, M.; Cifuentes, A.; Ibáñez, E. Green processes for the extraction of bioactives from Rosemary: Chemical and functional characterization via ultra-performance liquid chromatography-tandem mass spectrometry and in-vitro assays. J. Chromatogr. A 2010, 1217, 2512–2520. [Google Scholar] [CrossRef]
  25. Nanashima, N.; Kitajima, M.; Takamagi, S.; Fujioka, M.; Tomisawa, T. Comparison of chemical composition between Kuromoji (Lindera umbellata) essential oil and hydrosol and determination of the deodorizing effect. Molecules 2020, 25, 4195. [Google Scholar] [CrossRef]
  26. Allal, A.; Bellifa, S.; Benmansour, N.; Selles, C.; Semaoui, M.; Hassaine, H.; Muselli, A. Essential oil and hydrosol extract chemical profile, antioxidant and antimicrobial potential of Daphne gnidium L. from Algeria. J. Essent. Oil Bear. Plants 2019, 22, 1277–1288. [Google Scholar] [CrossRef]
  27. El Amine Dib, M.; Djabou, N.; Allali, H.; Paolini, J.; Tabti, B.; Costa, J.; Muselli, A. Chemical composition of essential oils and hydrosol extracts of Daucus muricatus and assessment of its antioxidant activity. J. Herbs Spices Med. Plants 2015, 21, 23–37. [Google Scholar] [CrossRef]
Figure 1. A flow chart of sample pretreatment for 24 trace aromatic substances in rosemary hydrosol.
Processes 12 00498 g001
Figure 2. (a) Gas chromatogram of reference materials (concentration: 20 μg/mL) (a), natural rosemary hydrosol (imported rosemary leaves) (b) and natural rosemary hydrosol (rosemary leaves from China) (c).
Processes 12 00498 g002
Figure 3. The recovery rate of 24 target substances using different extractants spiked with concentrations of 1.5 μg (a), 15 μg (b) and 150 μg (c) (n = 3).
Processes 12 00498 g003
Figure 4. The recovery rate of 24 target substances when using different dispersants (n = 3).
Processes 12 00498 g004
Figure 5. Recovery rate of 24 target substances with different extractant volumes (n = 3).
Processes 12 00498 g005
Figure 6. Recovery rate of 24 target substances with different dispersant volumes (n = 3).
Processes 12 00498 g006
Figure 7. Optimization of DLLME parameters: (a) extraction temperature, (b) extraction time and (c) pH (n = 3).
Processes 12 00498 g007
Table 1. Instrumental parameters of GC data acquisition.
Instrumental ParametersValue
Injection port
Injection volume (μL)1.0
Injection port temperature (°C)250
Split ratio20:1
Chromatographic column
Column flow (mL/min)1.00
Programmed temperature rise procedure50 °C for 3 min,
4 °C/min to 160 °C,
0 min, 20 °C/min to 240 °C, 5.5 min
Detector
Detector temperature (°C)300
Hydrogen flow (mL/min)32.0
Air flow (mL/min)200.0
Tail gas flow (mL/min)24.0
Table 2. The retention time of 24 target analytes in rosemary hydrosol separated by GC.
No.Target AnalytesRetention Time (min)No.Target AnalytesRetention Time (min)
1α-Pinene6.58913cis-3-Hexen-1-ol17.298
2(±)-Camphene7.58114D(+)-Camphor21.248
3β-Pinene8.67415Linalool22.199
4Myrcene10.26116Linalyl Acetate22.401
5α-Terpinene10.73917Isobornyl acetate23.294
6(R)-(+)-Limonene11.31818(-)-trans-Caryophyllene23.575
7Eucalyptol11.693194-Carvomenthenol23.817
8trans-2-Hexen-1-al11.94520Isoborneol25.690
9γ-Terpinene12.78821α-Terpineol26.479
104-lsopropyltoluene13.55922(-)-Verbenone26.730
11Terpinolene13.97223Neryl acetate27.174
12Methyl heptenone15.72024Geraniol30.458
Table 3. Retention time, method detection limit, linear regression equation and correlation coefficient r of 24 target substances r (n = 3).
Serial No.Target AnalytesRetention Time (min)Method Detection Limit (mg/L)Linear Regression EquationCorrelation Coefficient
r
1α-Pinene6.5810.02Y = 1166.1X − 6 59.20.9991
2(±)-Camphene7.5730.02Y = 1174.7X − 5 48.50.9991
3β-Pinene8.6650.02Y = 1237.2X − 723.10.9990
4Myrcene10.2450.02Y = 1143.4X − 695.70.9990
5α-Terpinene10.7280.02Y = 1276.8X − 793.40.9989
6(R)-(+)-Limonene11.3070.02Y = 1318.4X − 964.50.9989
7Eucalyptol11.6810.02Y = 1247.9X − 905.10.9990
8trans-2-Hexen-1-al11.9340.02Y = 758.4X − 598.90.9989
9γ-Terpinene12.7770.02Y = 1192.9X − 796.60.9990
104-lsopropyltoluene13.5480.02Y = 1302.2X − 982.00.9989
11Terpinolene13.9610.02Y = 1090.2X − 680.40.9990
12Methyl heptenone15.7100.02Y = 975.7X − 868.10.9988
13cis-3-Hexen-1-ol17.2890.02Y = 925.4X − 804.80.9989
14D(+)-Camphor21.2380.02Y = 1398.6X − 1343.30.9989
15Linalool22.1910.02Y = 1041.4X − 1030.90.9987
16Linalyl Acetate22.3890.02Y = 1194.6X − 1132.60.9988
17Isobornyl acetate23.2820.02Y = 1416.6X − 1406.30.9988
18(-)-trans-Caryophyllene23.5610.02Y = 1850.6X − 1710.00.9987
194-Carvomenthenol23.8070.02Y = 1542.2X − 1693.40.9986
20Isoborneol25.6780.02Y = 1207.1X − 1193.30.9989
21α-Terpineol26.4710.02Y = 897.5X − 718.50.9988
22(-)-Verbenone26.7180.02Y = 1321.7X − 1808.10.9985
23Neryl acetate27.1660.02Y = 1146.7X − 1024.00.9987
24Geraniol30.4500.02Y = 1300.5X − 1759.00.9983
Table 4. Comparison of different pretreatment methods.
ReferencesPretreatment MethodsPretreatment TimeDetectorOrganic Reagent DosageLOD
(mg/L)
Quantitative Method
[25]Direct injection0 hGC and GC-MS0 mL/Area normalization method
[27]Direct injection0 hGC-MS0 mL/Area normalization method
[26]Direct injection0 hGC-MS0 mL/Area normalization method
[10]Solvent extraction24 hGC-MS10 mL/Area normalization method
This methodDLLME10 minGC2.25 mL0.02External standard method
Table 5. The recoveries and relative standard deviation of 24 target substances at different spiked concentration levels (n = 6).
Serial No.Scalar1.5 μg15 μg150 μg
Target SubstanceRecovery %RSD %Recovery %RSD %Recovery %RSD %
1α-Pinene107.62.0103.61.082.55.0
2(±)-Camphene77.36.994.61.081.33.8
3β-Pinene76.44.999.81.382.24.6
4Myrcene81.65.9109.40.782.94.1
5α-Terpinene86.45.5112.40.884.33.7
6(R)-(+)-Limonene100.06.4114.10.785.43.6
7Eucalyptol105.11.6137.00.7105.41.8
8trans-2-Hexen-1-al103.33.4129.00.795.72.0
9γ-Terpinene93.34.5116.80.787.03.0
104-lsopropyltoluene89.32.0120.40.786.82.7
11Terpinolene102.73.4119.20.688.22.6
12Methyl heptenone105.61.6136.70.6103.22.0
13cis-3-Hexen-1-ol83.62.0112.40.981.32.4
14D(+)-Camphor106.21.6137.50.4104.82.0
15Linalool113.80.9138.80.5105.02.1
16Linalyl Acetate108.02.2131.30.7101.10.6
17Isobornyl acetate108.20.7136.60.4101.20.7
18(-)-trans-Caryophyllene100.95.3125.00.4102.01.3
194-Carvomenthenol109.31.6137.30.5104.52.2
20Isoborneol104.91.0136.20.7104.22.1
21α-Terpineol113.40.6136.30.8104.42.4
22(-)-Verbenone101.11.4132.40.799.32.3
23Neryl acetate114.21.5132.90.5104.31.2
24Geraniol102.71.9135.20.4104.12.2
Table 6. Detection of target substances in 8 rosemary hydrosol samples (unit: mg/L) (n = 3).
No.Target SubstanceSample 1Sample 2Sample 3Sample 5Sample 7Sample 8Sample 9Sample 10
1α-Pinene36.8 ± 0.700.6 ± 0.060.6 ± 0.060.6 ± 0.100.7 ± 0.060.7 ± 0.060.7 ± 0.060.6 ± 0.06
2(±)-Camphene9.7 ± 0.21ND 1ND0.6 ± 0.060.4 ± 0.060.4 ± 0.06NDND
3β-Pinene2.1 ± 0.06NDNDNDNDNDNDND
4Myrcene3 ± 0.10NDNDND0.6 ± 0.060.7 ± 0.060.7 ± 0.06ND
5α-Terpinene0.9 ± 0.06ND0.4 ± 0.06ND0.4 ± 0.06ND0.4 ± 0.12ND
6(R)-(+)-Limonene4.6 ± 0.21NDNDND0.5 ± 0.060.5 ± 0.100.5 ± 0.060.5 ± 0.06
7Eucalyptol154.6 ± 2.27103.9 ± 1.6536.3 ± 0.452.9 ± 1.2217.6 ± 3.89224.3 ± 3.27237.7 ± 2.45226.4 ± 6.95
8trans-2-Hexen-1-alNDNDNDND1.2 ± 0.101.2 ± 0.101.3 ± 0.061.1 ± 0.06
9γ-Terpinene1 ± 0.06NDNDNDNDNDNDND
104-lsopropyltoluene3.9 ± 0.10NDNDND0.4 ± 0.12NDNDND
11Terpinolene0.8 ± 0.06NDNDNDNDNDNDND
12Methyl heptenone0.4 ± 0.060.6 ± 0.060.6 ± 0.06ND0.5 ± 0.120.9 ± 0.100.9 ± 0.060.8 ± 0.10
13cis-3-Hexen-1-ol0.4 ± 0.060.6 ± 0.060.6 ± 0.06ND1.1 ± 0.121.8 ± 0.151.5 ± 0.151.7 ± 0.21
14D(+)-Camphor32.3 ± 0.4016 ± 0.4611 ± 0.311 ± 0.12354.1 ± 5.4657.3 ± 0.7177.3 ± 1.0548.5 ± 0.85
15Linalool3.6 ± 0.0618 ± 0.317.6 ± 0.210.7 ± 0.1210.4 ± 0.3019.2 ± 1.0514.7 ± 0.7221.7 ± 1.56
16Linalyl AcetateNDNDNDNDNDNDNDND
17Isobornyl acetate0.6 ± 0.060.6 ± 0.060.5 ± 0.06ND1 ± 0.151.2 ± 0.151.3 ± 0.121.2 ± 0.06
18(-)-trans-Caryophyllene3.4 ± 0.10NDNDND0.7 ± 0.12ND1.5 ± 0.06ND
194-Carvomenthenol2.2 ± 0.104.6 ± 0.153.4 ± 0.100.6 ± 0.0614.6 ± 0.539.8 ± 0.5010.9 ± 0.429.6 ± 0.32
20Isoborneol1.6 ± 0.06NDNDNDNDNDNDND
21α-Terpineol7.5 ± 0.0615.2 ± 0.2617 ± 0.361.3 ± 0.06152.2 ± 2.9547.9 ± 1.5752.3 ± 0.845.6 ± 1.12
22(-)-VerbenoneND62.7 ± 1.61130.4 ± 3.6712.4 ± 0.29ND576.5 ± 4.31545.2 ± 6.45569.2 ± 14.50
23Neryl acetate0.4 ± 0.06NDNDNDNDNDNDND
24Geraniol0.6 ± 0.067.7 ± 0.153.2 ± 0.210.5 ± 0.064.4 ± 0.1513 ± 6.7610.7 ± 0.2113.4 ± 0.55
1 Note: ND means not detected.
Disclaimer/Publisher’s Note: The statements, opinions and data contained in all publications are solely those of the individual author(s) and contributor(s) and not of MDPI and/or the editor(s). MDPI and/or the editor(s) disclaim responsibility for any injury to people or property resulting from any ideas, methods, instructions or products referred to in the content.

