
New Approach to the Analysis of Manufacturing Processes with the Support of Data Science
 ,
,  ,
,
Abstract
:1. Introduction
- Handling large volumes of data;
- Adapting to dynamic changes in processes;
- Supporting decision-making processes without extensive expertise.
- Enhancing the ability to detect and react to process changes in real-time.
- Providing deeper insights into the causes and effects of process variations.
- Facilitating more precise and efficient process optimization.
- Insufficient planning and management: If processes are not properly planned and managed, it can lead to excessive use of resources and unnecessary tasks;
- Inefficient use of resources: This can include using more materials or energy than necessary or employing labor that is not required for specific tasks;
- Obsolete or inefficient technologies: Old or inefficient technologies can increase costs and reduce process efficiency;
- Errors or failures: Errors in processes can lead to waste by requiring repairs or re-execution of tasks;
- Lack of quality control: If the quality of processes and outputs is not properly monitored and controlled, it can lead to waste through poor performance or product defects.
- Identification of unnecessary or inefficient steps: Process mining can visualize the entire process and identify steps that do not add value;
- Performance and quality analysis: Process mining can analyze the performance of individual process steps and the quality of outputs, which helps to identify areas for improvement;
- Prediction and prevention of problems: Using advanced techniques such as machine learning, process mining can predict potential problems and enable their resolution before they occur;
- Resource optimization: Process mining can help to optimize the use of resources by revealing where and when resources are needed and where they can be used more efficiently.
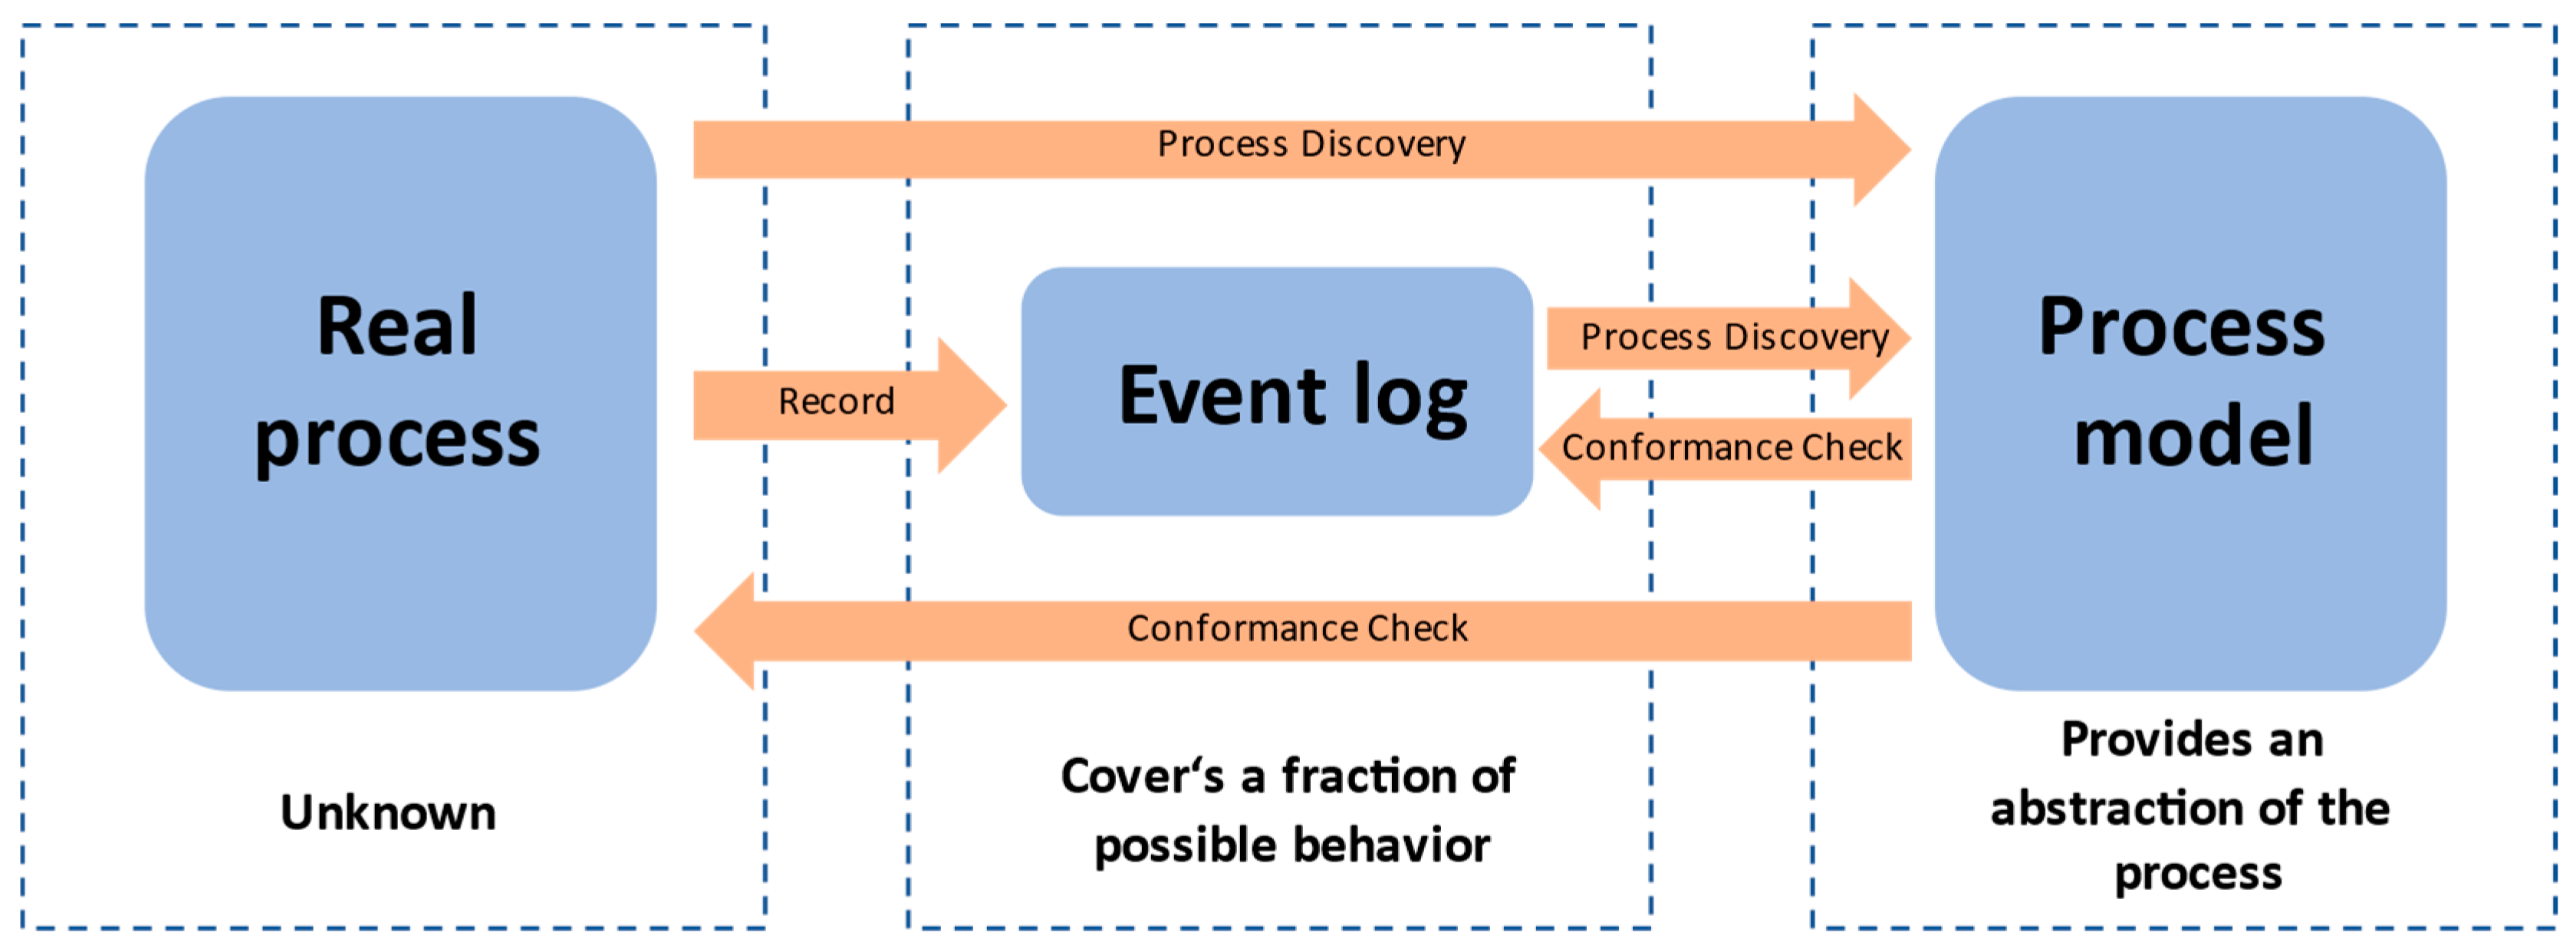
Basic Definitions
- Gain an overview of how the business process is defined, understand how it works, and know what its limitations and problems are;
- Support discussion and brainstorming about the business process. It should create a common starting situation that is acceptable and concrete to start a discussion;
- Document and educate, i.e., increase transparency and knowledge sharing; inform all relevant sources about their tasks, responsibilities, and the impact of their activities;
- Audit and verify the process; review and search for errors and mistakes in design, systems, or even individual activities;
- Analyze the performance of processes and enforce improvements. By understanding the process and also being able to determine the key weak points, the solution should allow for identifying key factors of change that will improve the level of services;
- Animate and replay models, which allow users to explore the process and bring new insights and feedback about the process;
- Design the process for system or process specification, meaning the model can serve as a binding contract or requirements list for system setup on the one hand and as a starting point for process change on the other.
2. Materials and Methods
2.1. Algirithms of Process Mining
- YW is the set of all pairs (A, B) of maximal sets of tasks such that neither A × A and B × B contain any members of > and A × B is a subset of →;
- PW contains one place p(A,B) for every member of YW, plus the input place iW and the output place oW.
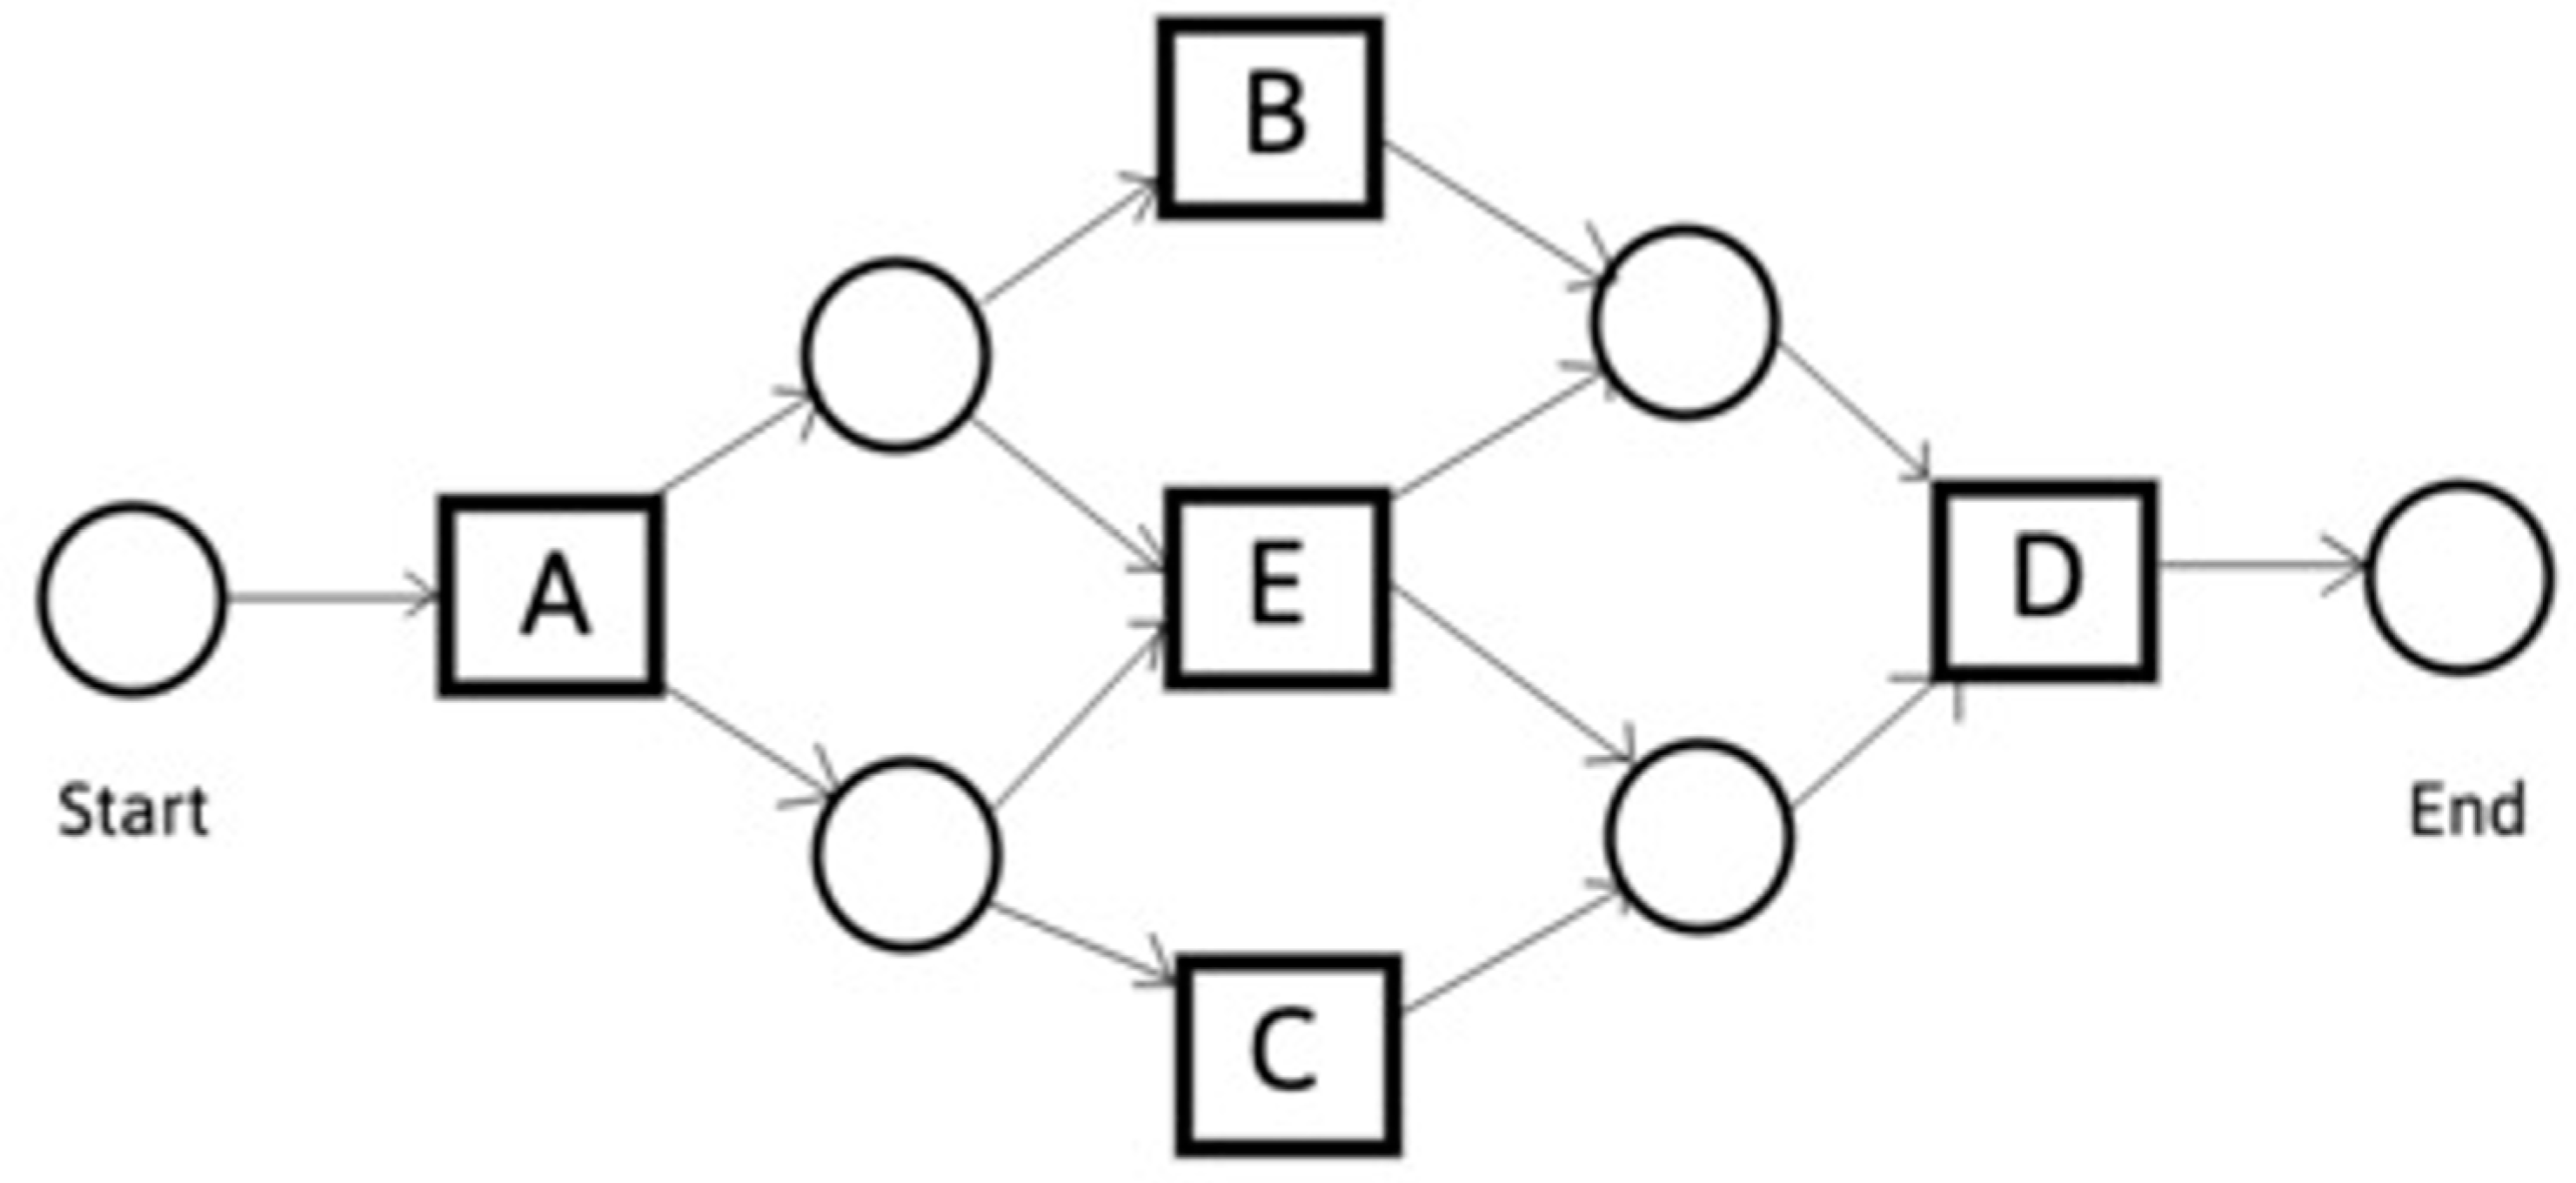
- A Petri net structure α(W) = (PW, TW, FW);
- One input place iW and one output place oW;
- Every transition of TW is on a FW-path from iW to oW; it is indeed a workflow net.
- Implicit places: The α-miner cannot distinguish between implicit and required places and, therefore, may result in additional unnecessary places in the discovered Petri net.
- Loops: The α-miner is unable to discover loops of lengths 1 and 2 in the process model.
- Representational bias: The α-miner can only discover a Petri net, which introduces representational bias, such as the requirement for unique visible labels for each transition.
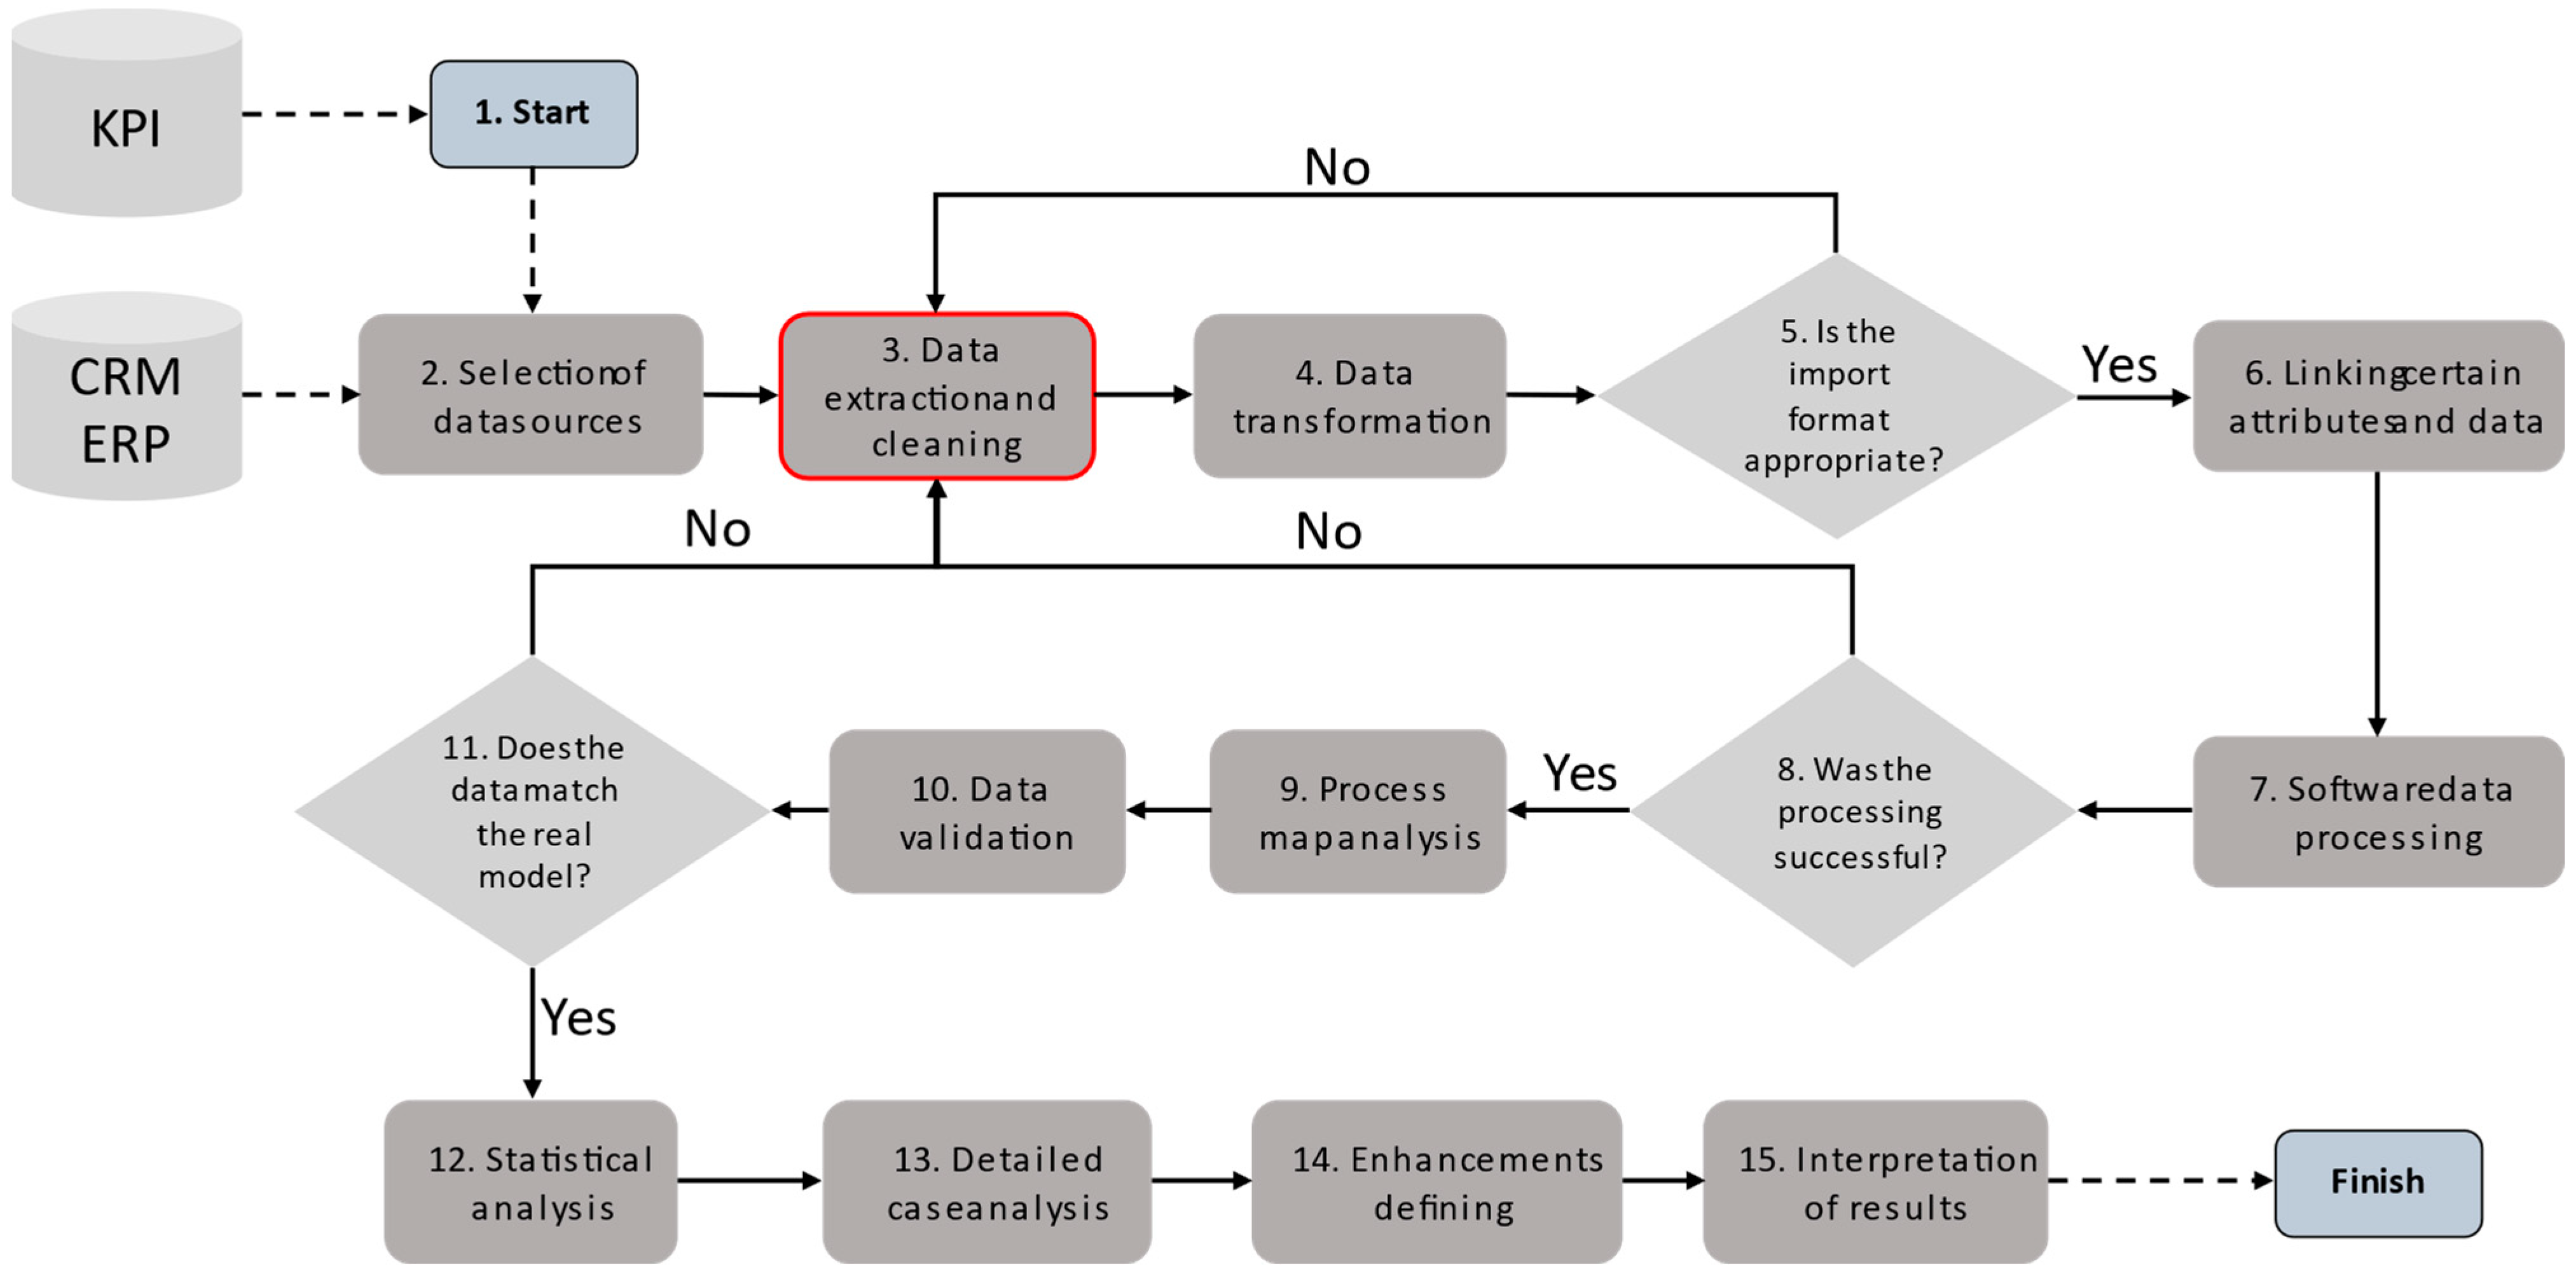
2.2. Methodology for Analyzing Manufacturing Processes Using Process Mining
- Defining KPIs:
- 1.
- Beginning:
- A map of the sequence of the overall manufacturing process and individual orders;
- Time utilization of all or selected critical equipment;
- Rework analysis (quality indicator);
- Lead times;
- Number of work-in-progress manufacturing orders;
- Effective times;
- Order lifecycle.
- 2.
- Selection of data sources:
- Process logs: These data are generated automatically during the execution of manufacturing processes. They may contain records of individual steps, times, actions performed by the operator, order statuses, and other relevant information. Process logs are often stored in the form of log files or records in information systems.
- System Records: These data come from various information systems, such as Manufacturing Execution Systems (MESs), Enterprise Resource Planning (ERP) systems, or production-tracking systems. These records contain information about orders, times, quantities, operators, and other relevant data [31].
- Sensor data: In some cases, manufacturing processes are monitored using sensors that collect data on temperature, pressure, speed, vibrations, and other physical parameters. These sensor data can be integrated into process mining analysis to gain additional insights into processes.
- Identifier data: In some cases, identifiers such as barcodes or RFID tags are used to track the movement of materials, products, or workers within manufacturing processes. These data can provide information on material flow, timing, and resource movement in the process.
- Event Log: CSV (Comma-Separated Values), XES (eXtensible Event Stream);
- Network Log (Petri net logs): PNML (Petri Net Markup Language), BPMN (Business Process Model and Notation);
- Relational Databases: SQL (Structured Query Language)—for the process of extracting from the database and importing data into the tool;
- Digital Document Format Files: XLS, XLSX (XML Spreadsheet), CSV (Comma-Separated Values).
- 3.
- Data extraction and cleaning:
- Identification of relevant data: In the first step, it is necessary to identify data sources and determine which of them are relevant for the analysis of manufacturing processes. This includes identifying relevant logs, database tables, or other sources that contain necessary information about processes.
- Data extraction: After identifying relevant data, the extraction of these data from the source systems is performed. Extraction can be performed using automated scripts or data extraction tools that allow for the necessary information to be obtained from structured or unstructured sources.
- Data cleaning: Various issues, such as missing or invalid values, inconsistent formats, or duplicates, can occur during the extraction process. Data cleaning involves removing these impurities and ensuring that the data are accurate, complete, and consistent. Various techniques are used, such as removing duplicates, supplementing missing values, correcting erroneous values, or normalizing data.
- Normalization of data structures: When analyzing different source data, data may be stored in various formats or structures. For a successful analysis and comparison, it is important to normalize these data structures into a uniform format. This step involves aligning attributes, creating a uniform table structure, or grouping data from different sources into a single file.
- 4.
- Data transformation:
- Attribute Transformation: This step involves transforming individual attributes (columns) of data. This can include converting data into a different format, such as changing time to a different time zone, converting text to uppercase, or creating new attributes by combining existing ones.
- Aggregation and Grouping: In some cases, it may be necessary to aggregate and group data to obtain a summary or high-level information. This step allows for the reduction of data complexity and provides an overview of the overall course of processes.
- Time Normalization: If data come from various sources or systems, it may be necessary to normalize time data to make them comparable. This includes aligning timestamps, creating a uniform timeline, and adjusting time intervals.
- Identifier Normalization: If data contain various forms of identifiers, such as different names for the same process activities, they need to be normalized. This ensures a uniform identifier for the same objects and facilitates later analysis and process mapping.
- 5.
- Decision block: “Appropriate format for import”:
- 6.
- Linking specific attributes and data:
- Case ID: This determines the scope of the process. The process ID is a specific case of the process. The significance of a case in a particular situation depends overall on the process and input data.
- Activity: This determines the steps on the process maps. For example, a process in production may consist of steps such as “sanding”, “cutting”, “pressing”, “levelling”, “bending”, “storing”, “dispatching”, or naming specific machines (performed by various people, e.g., workers and masters). Some of these steps may occur more than once in a case, and not all may always be performed.
- Timestamp: If a sequential log file is not available, timestamps determine the sequence of activities in the process. The third important prerequisite for process mining is to have at least one column with a timestamp indicating when the individual activities took place. This is important not only for analyzing the timing behavior of the process but also for establishing the sequence of activities in the event log.
- 7.
- Data processing using software:
- Data inconsistency error (missing, incorrect format, unexpected data volume, incorrect attribute identification, incorrect timestamps, unreadable text format, time axis gaps).
- The process map does not correspond to the actual state of the processes. Visually, it is possible to identify the sequence of steps in the process map and check lead times.
- Statistical evaluations do not match actual values.
- Case analysis incorrectly identifies and divides individual cases based on the assigned ID attribute.
- 8.
- Decision block: “Was processing successful?”
- 9.
- Process map analysis:
- Time Filtering: The software allows the user to define the time span in which to analyze events. This allows for the analysis of a specific period, such as a month, week, or day, and it also allows for the observation of changes and trends in the processes within that time frame.
- Source Filtering: The user can select specific roles (individuals, departments, or machineries) and limit the analysis to their activities in the process. This can help explore how individual resources contribute to the process flow and identify any issues associated with their participation.
- Step Filtering: The user has the option to select specific steps in the process and narrow down the analysis to these steps. This can examine a specific part of the process and obtain detailed information on how it is performed and how it differs from the expected model.
- 10.
- Data validation:
- Comparison with historical data: This represents the validation of the accuracy of the simulation results by comparing them with available historical data from a real operational environment. This comparison allows for the identification of any discrepancies and ensures that the model adequately reflects actual processes.
- Quantitative analysis of deviations: A quantitative analysis of deviations is performed to numerically express the differences between the results and the actual data. This method helps us determine the accuracy and reliability rates of the model.
- Statistical verification: We use statistical tests, such as the t-test or ANOVA, to verify whether the differences between the results and historical data are statistically significant. This allows us to assess whether the model’s results can be considered trustworthy.
- Expert evaluation: The model’s results are provided for evaluation by a group of experts on the subject, who provide a qualitative assessment of the realism and relevance of the results.
- Iterative optimization: Based on the results of the validation, iterative modifications of the model are performed until the set criteria for accuracy and reliability are met.
- 11.
- Decision block: “Do the data match the real model?”
- 12.
- Statistical analysis:
- Overview information: key overview data, global statistics, the number of events and cases in the dataset, the number of different activities, the median and average case duration, and the time frame included in the log.
- Performance charts: Several pre-generated charts visualizing performance metrics are displayed. Charts can be exported.
- Detailed information: At the bottom of the screen, detailed statistical information is displayed in tabular form. Tables can be exported as CSV files for further processing in other tools.
- Global statistics: Overview statistics about the entire dataset, individual cases, and variants.
- Activity statistics: Statistics on individual process steps in the dataset are displayed.
- Resource statistics: Statistics about people or organizational units in the dataset are displayed.
- 13.
- Detailed case analysis:
- Complete log: Displays a list of all cases in the data set.
- Individual variants: It is possible to select an individual variant, which is a specific sequence of activities. The case list will then show only the cases that follow the same sequence of activities. Sorting is carried out by the frequency of variants.
- List of cases: A list of case identifiers for either the complete log or the selected variant.
- Individual cases: It is possible to view further details about the currently selected case.
- Searching: For specific case IDs or attribute values.
- Filtering: Filtering controls for logs of the current data set are accessible for each examined item. Filters are, indeed, important for examining specific aspects of the process and, of course, for focusing the analysis.
- Copying, removing, and exporting data files: Data files can be copied, removed, and exported directly from the current analysis view.
- 14.
- Defining Improvements:
- Identification of improvement opportunities: Based on the analysis of available data and the results of previous steps, areas of manufacturing processes where improvements can be achieved are identified. This may include identifying activities that are inefficient or lead to errors and problems.
- Formulation of specific steps and measures: Based on identified areas for improvement, specific steps, measures, and improvements that could be implemented are proposed. These measures should be clearly defined and should focus on improving the efficiency, quality, and performance of manufacturing processes.
- Use of key improvement indicators: Key performance indicators (KPIs) are the main indicators for improvement. These indicators may include factors such as time costs, quality, productivity, resource utilization, time cycles, and other relevant metrics. Based on these indicators, priority areas for improvement are identified, and goals and measurable parameters for improvement are determined.
- Identification of secondary problematic situations and discrepancies: In addition to the main areas for improvement, secondary problematic situations and discrepancies may be identified. These can provide additional opportunities for improving manufacturing processes and can be included in the overall improvement plan.
- 15.
- Interpretation of results:
- Analysis of obtained results: Based on the processing and evaluation of data and information from previous steps, an analysis of the obtained results is conducted. Patterns, trends, relationships, and dependencies identified during the analysis process are analyzed.
- Context of set objectives: The analysis results are interpreted in the context of the set objectives and requirements of manufacturing processes. It is examined whether the set goals were achieved and how the results relate to these goals.
- Provision of conclusions: Based on the interpretation of results, conclusions are drawn, and main findings and discoveries are formulated. Relevant information and facts from the collected analytical results bolster these conclusions.
- Recommendations and guidance for future decision-making: Based on the conclusions and knowledge, recommendations and guidelines for future decisions regarding manufacturing processes are developed. These recommendations focus on improving the efficiency, productivity, quality, and performance of processes.
- Actions concerning manufacturing processes: Based on the interpretation of results and recommendations, specific actions and measures aimed at implementing the proposed improvements in manufacturing processes are planned and implemented. These actions may include changes in procedural processes, technology enhancements, employee training, and other relevant initiatives.
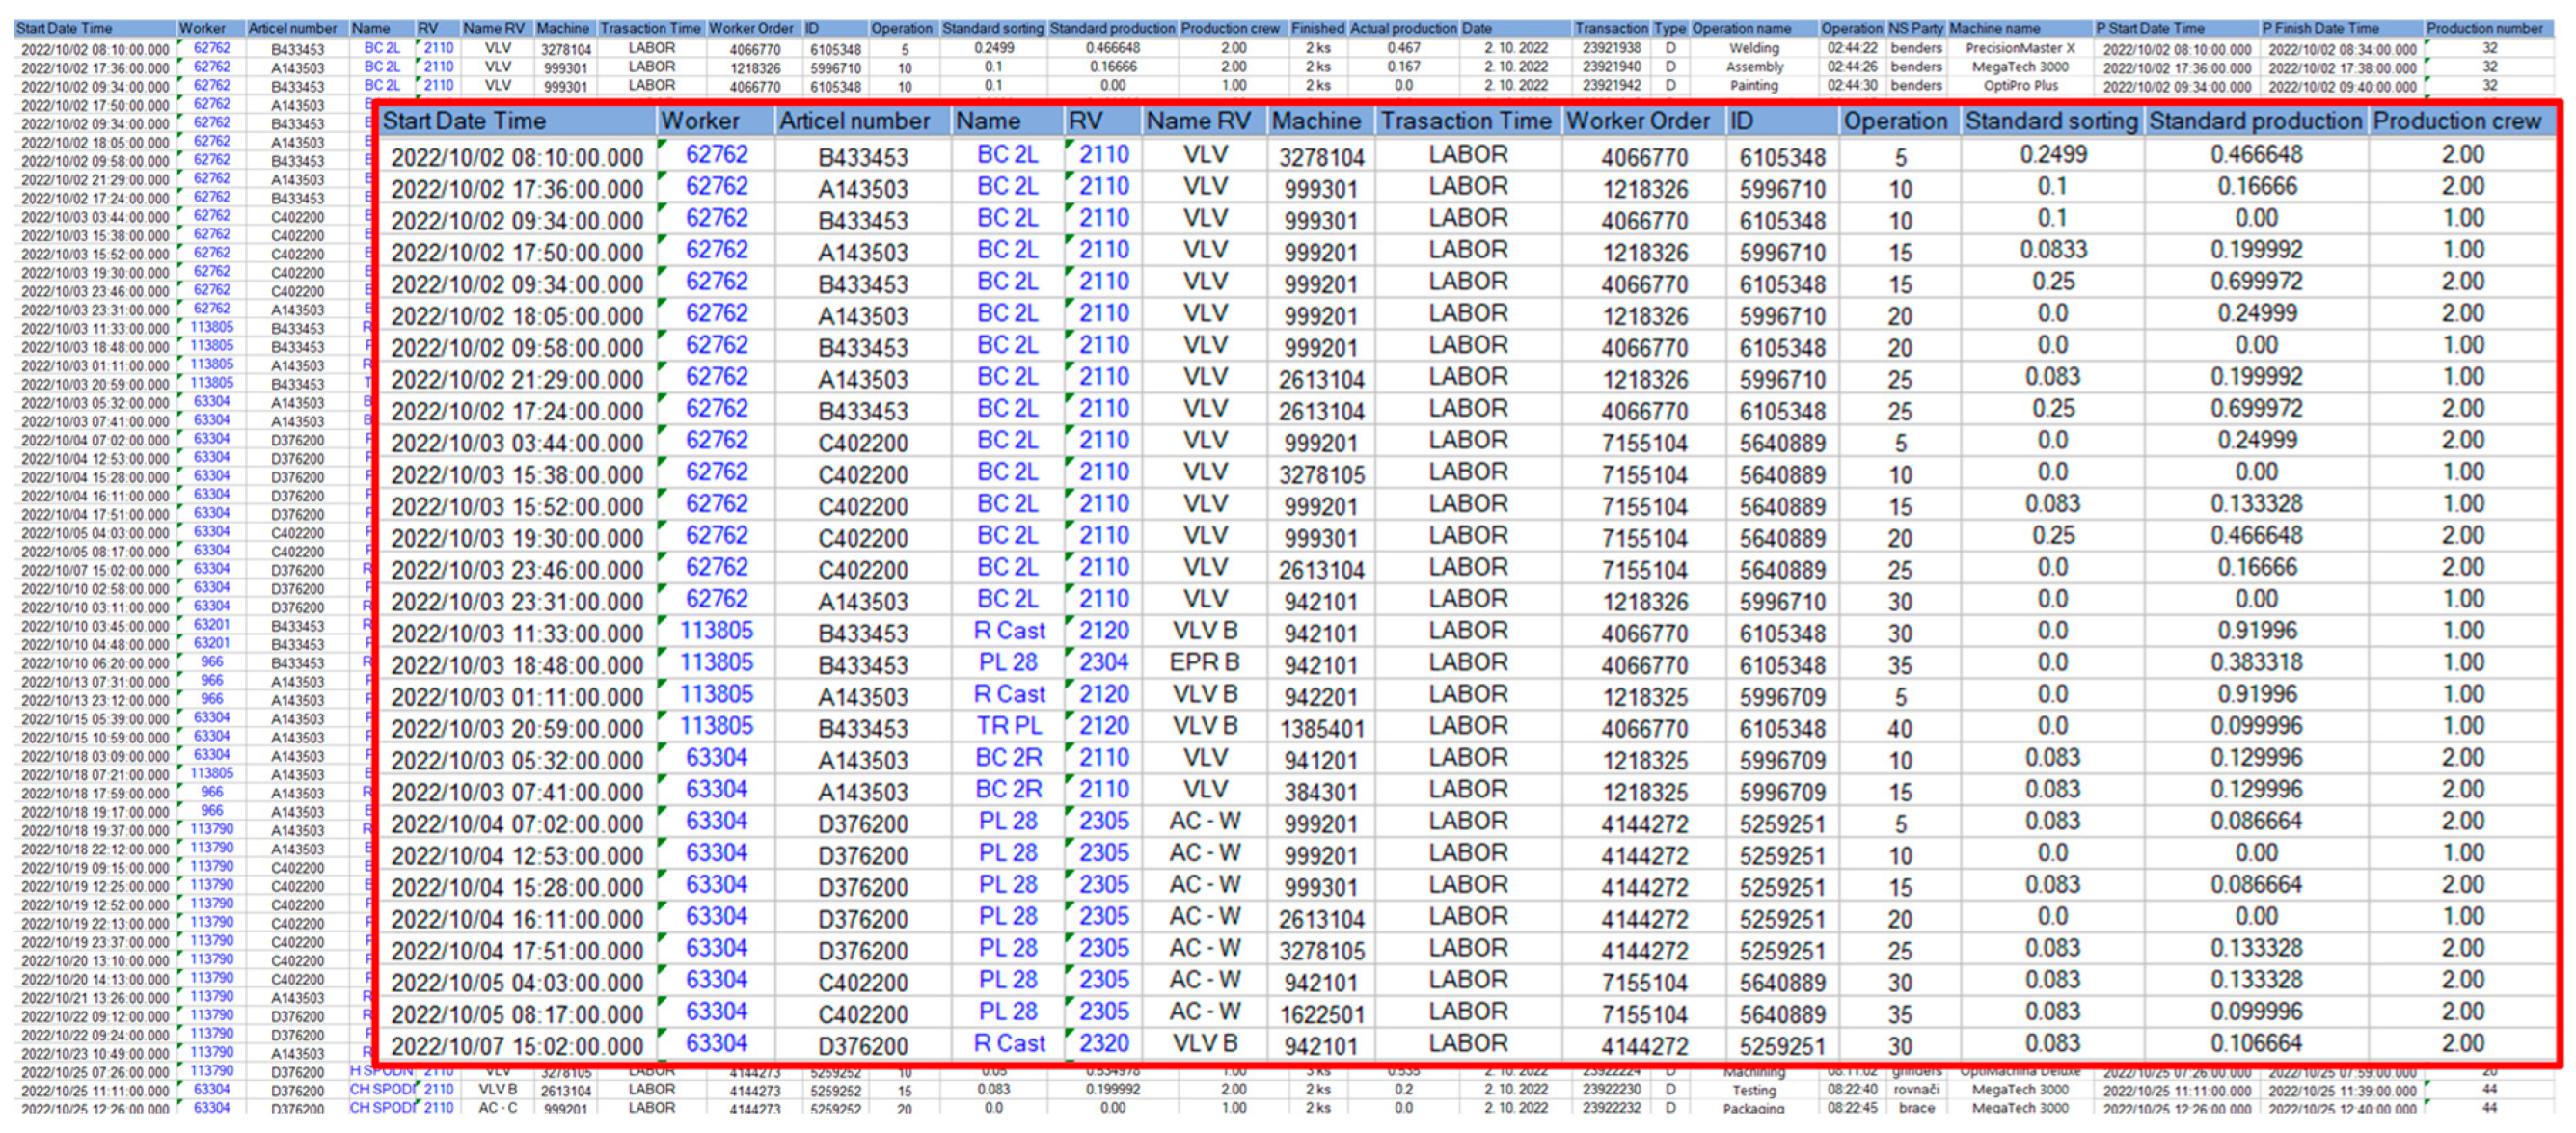
3. Results
- Timestamp;
- Article number;
- Worker ID;
- Machine ID;
- Work order;
- Operation numbers of the technological process;
- Identifiers of batches and transactions;
- Number of completed pieces;
- Operation names;
- Planned deadlines for each activity;
- Additional information and other similar details.
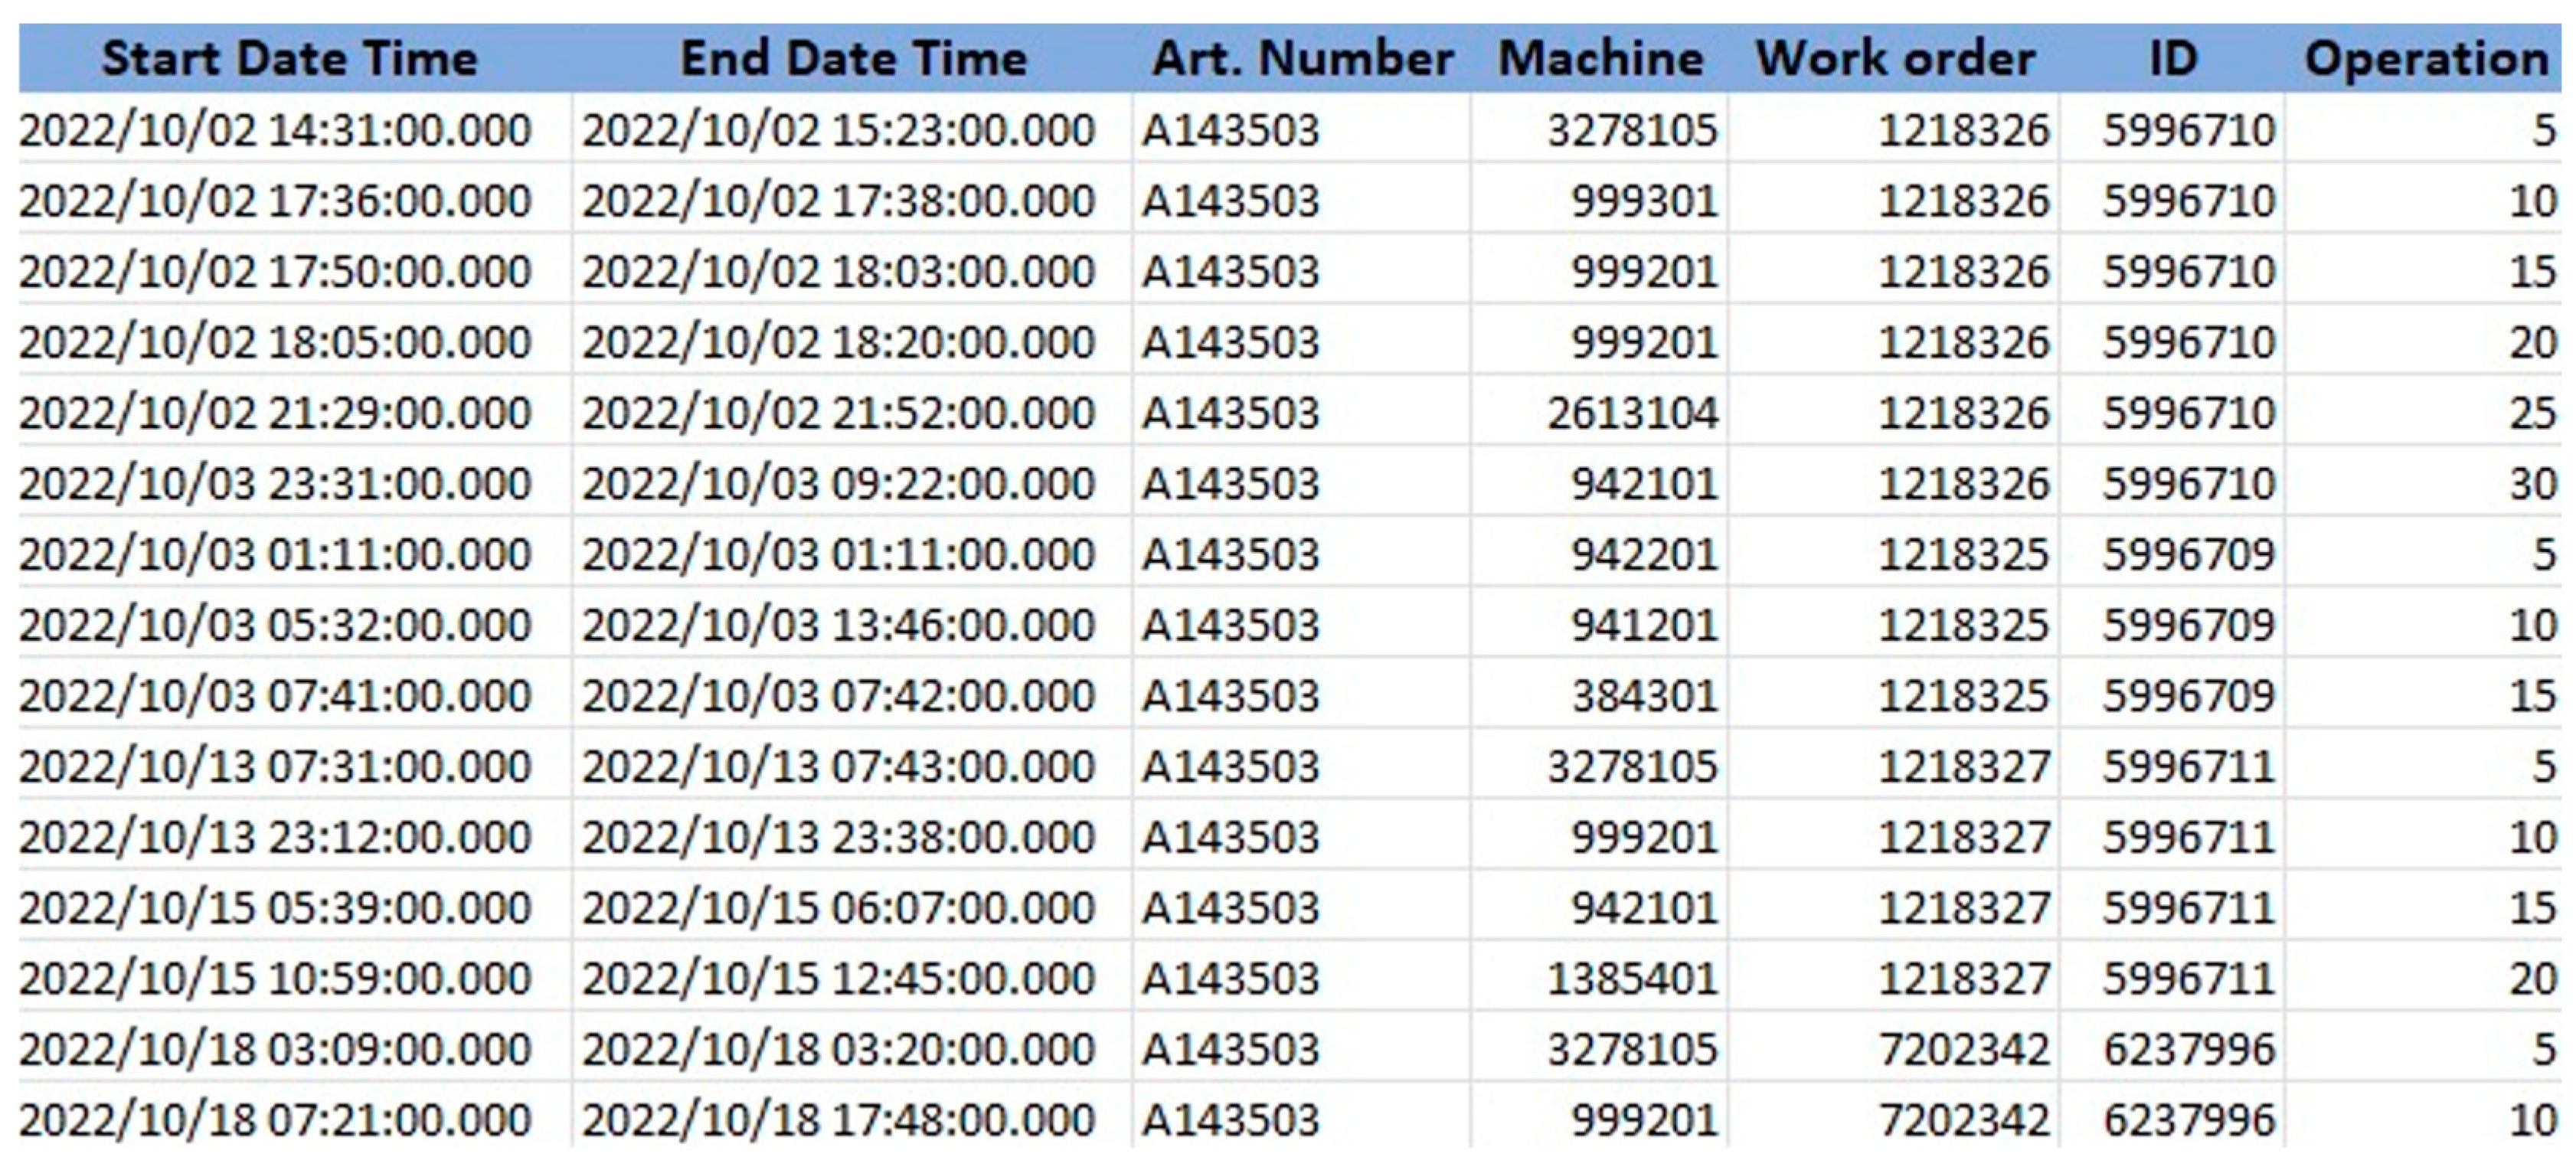
- Timestamp (time attribute);
- Article number (main case attribute);
- Production order (secondary case attribute);
- Worker ID (human resource attribute);
- Machine ID (production resource attribute);
- Numbers of technological procedure operations (attribute of the sequence of technological operations).
- Timestamp (time attribute): for correct time sequencing and duration calculations;
- Article number (main case attribute): for the correct division of each production order;
- Work order (secondary case attribute): for the complex division of each order into individual work orders;
- Machine ID (production resource attribute): a visual representation of the process map for analyzing work efficiency and inefficiencies, logistical times, and production resources;
- Numbers of operations of the technological procedure (attribute of the sequence of technological operations)—for understanding the technological sequence of operations within each order.
- Events over time: The timeline on the horizontal axis of the log displays the total time frame recorded in the log. The metric of events over time shows the activity in the process and the number of activities carried out. The chart allows for viewing individual data points and uncovering seasonal and weekly patterns in the process, such as peaks on workdays and lower activity during weekends or increased activity during a certain season.
- Activity statistics: This section contains performance metrics about activities in the process. Depending on the import configuration, an activity may consist of multiple columns. The cumulative count and Pareto diagram are analytical tools used for identifying and prioritizing key processes in the organization.
- The number of event occurrences at each machine facility.
- The level of process stability.
- The percentage share of a specific machine facility out of all available facilities. This is also an indicator of the utilization of production resources.
- A detailed characterization of the lead times of machinery.
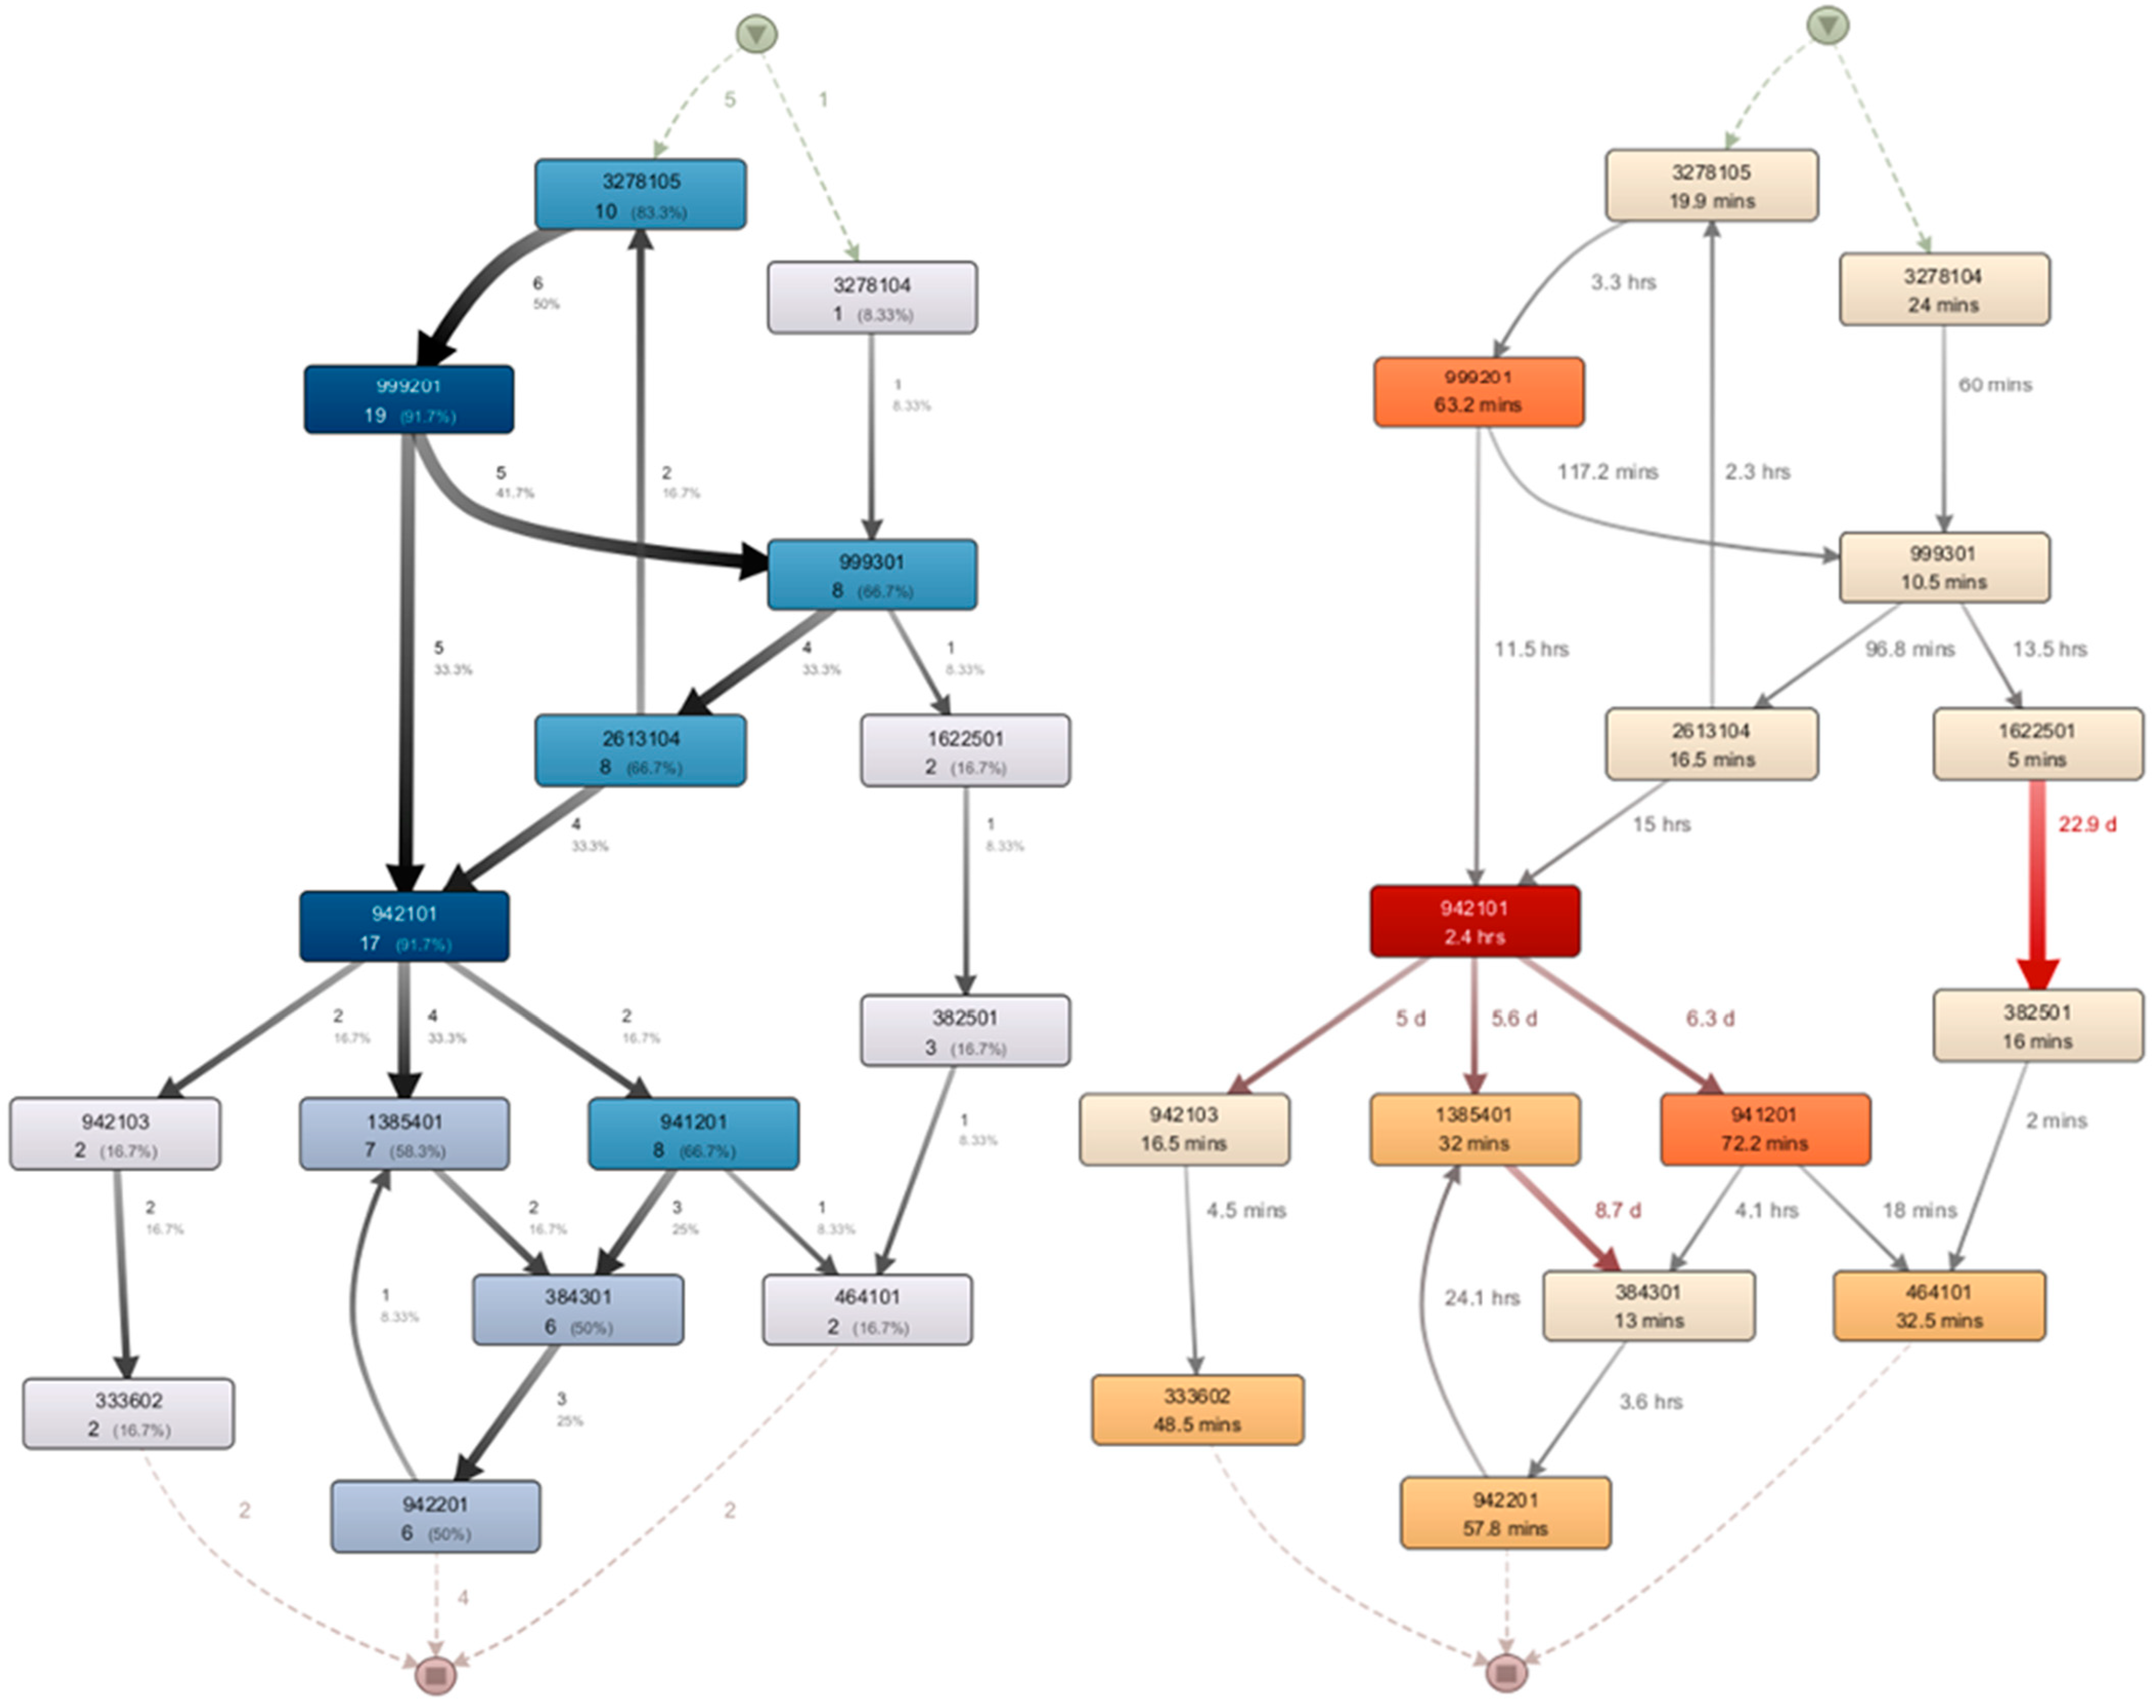
- Analysis of available attributes and gaining an overview of the current state: The case study focuses on orders and machinery equipment;
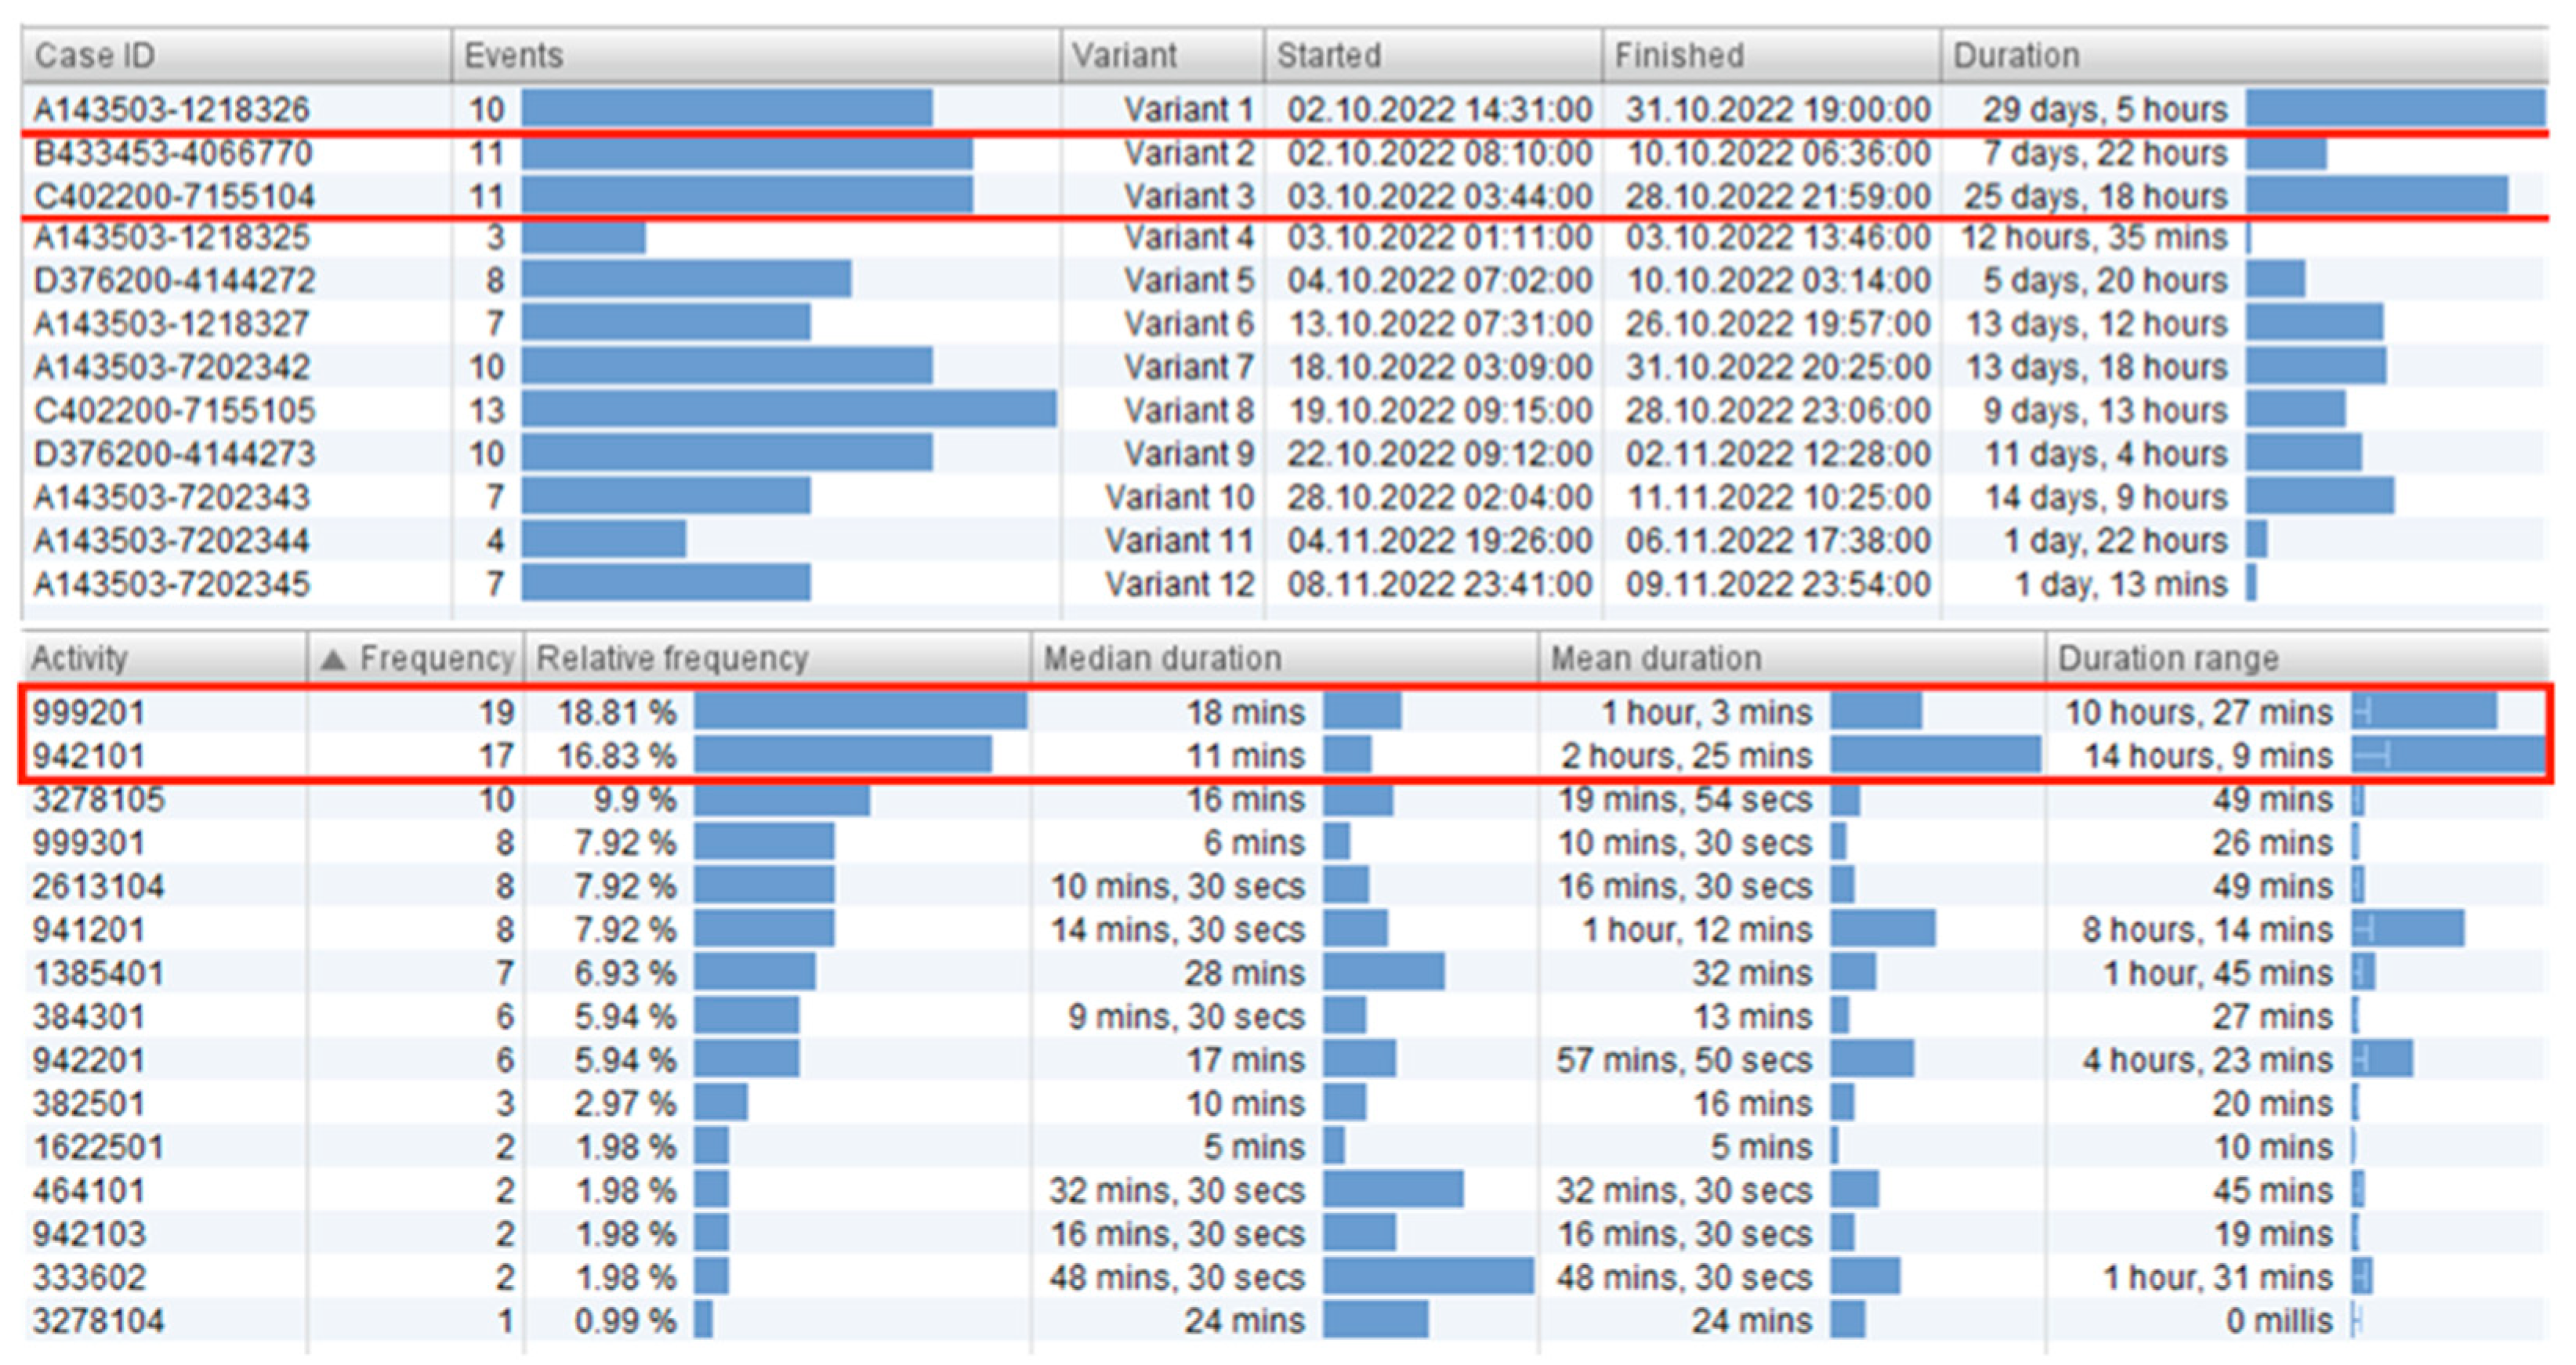
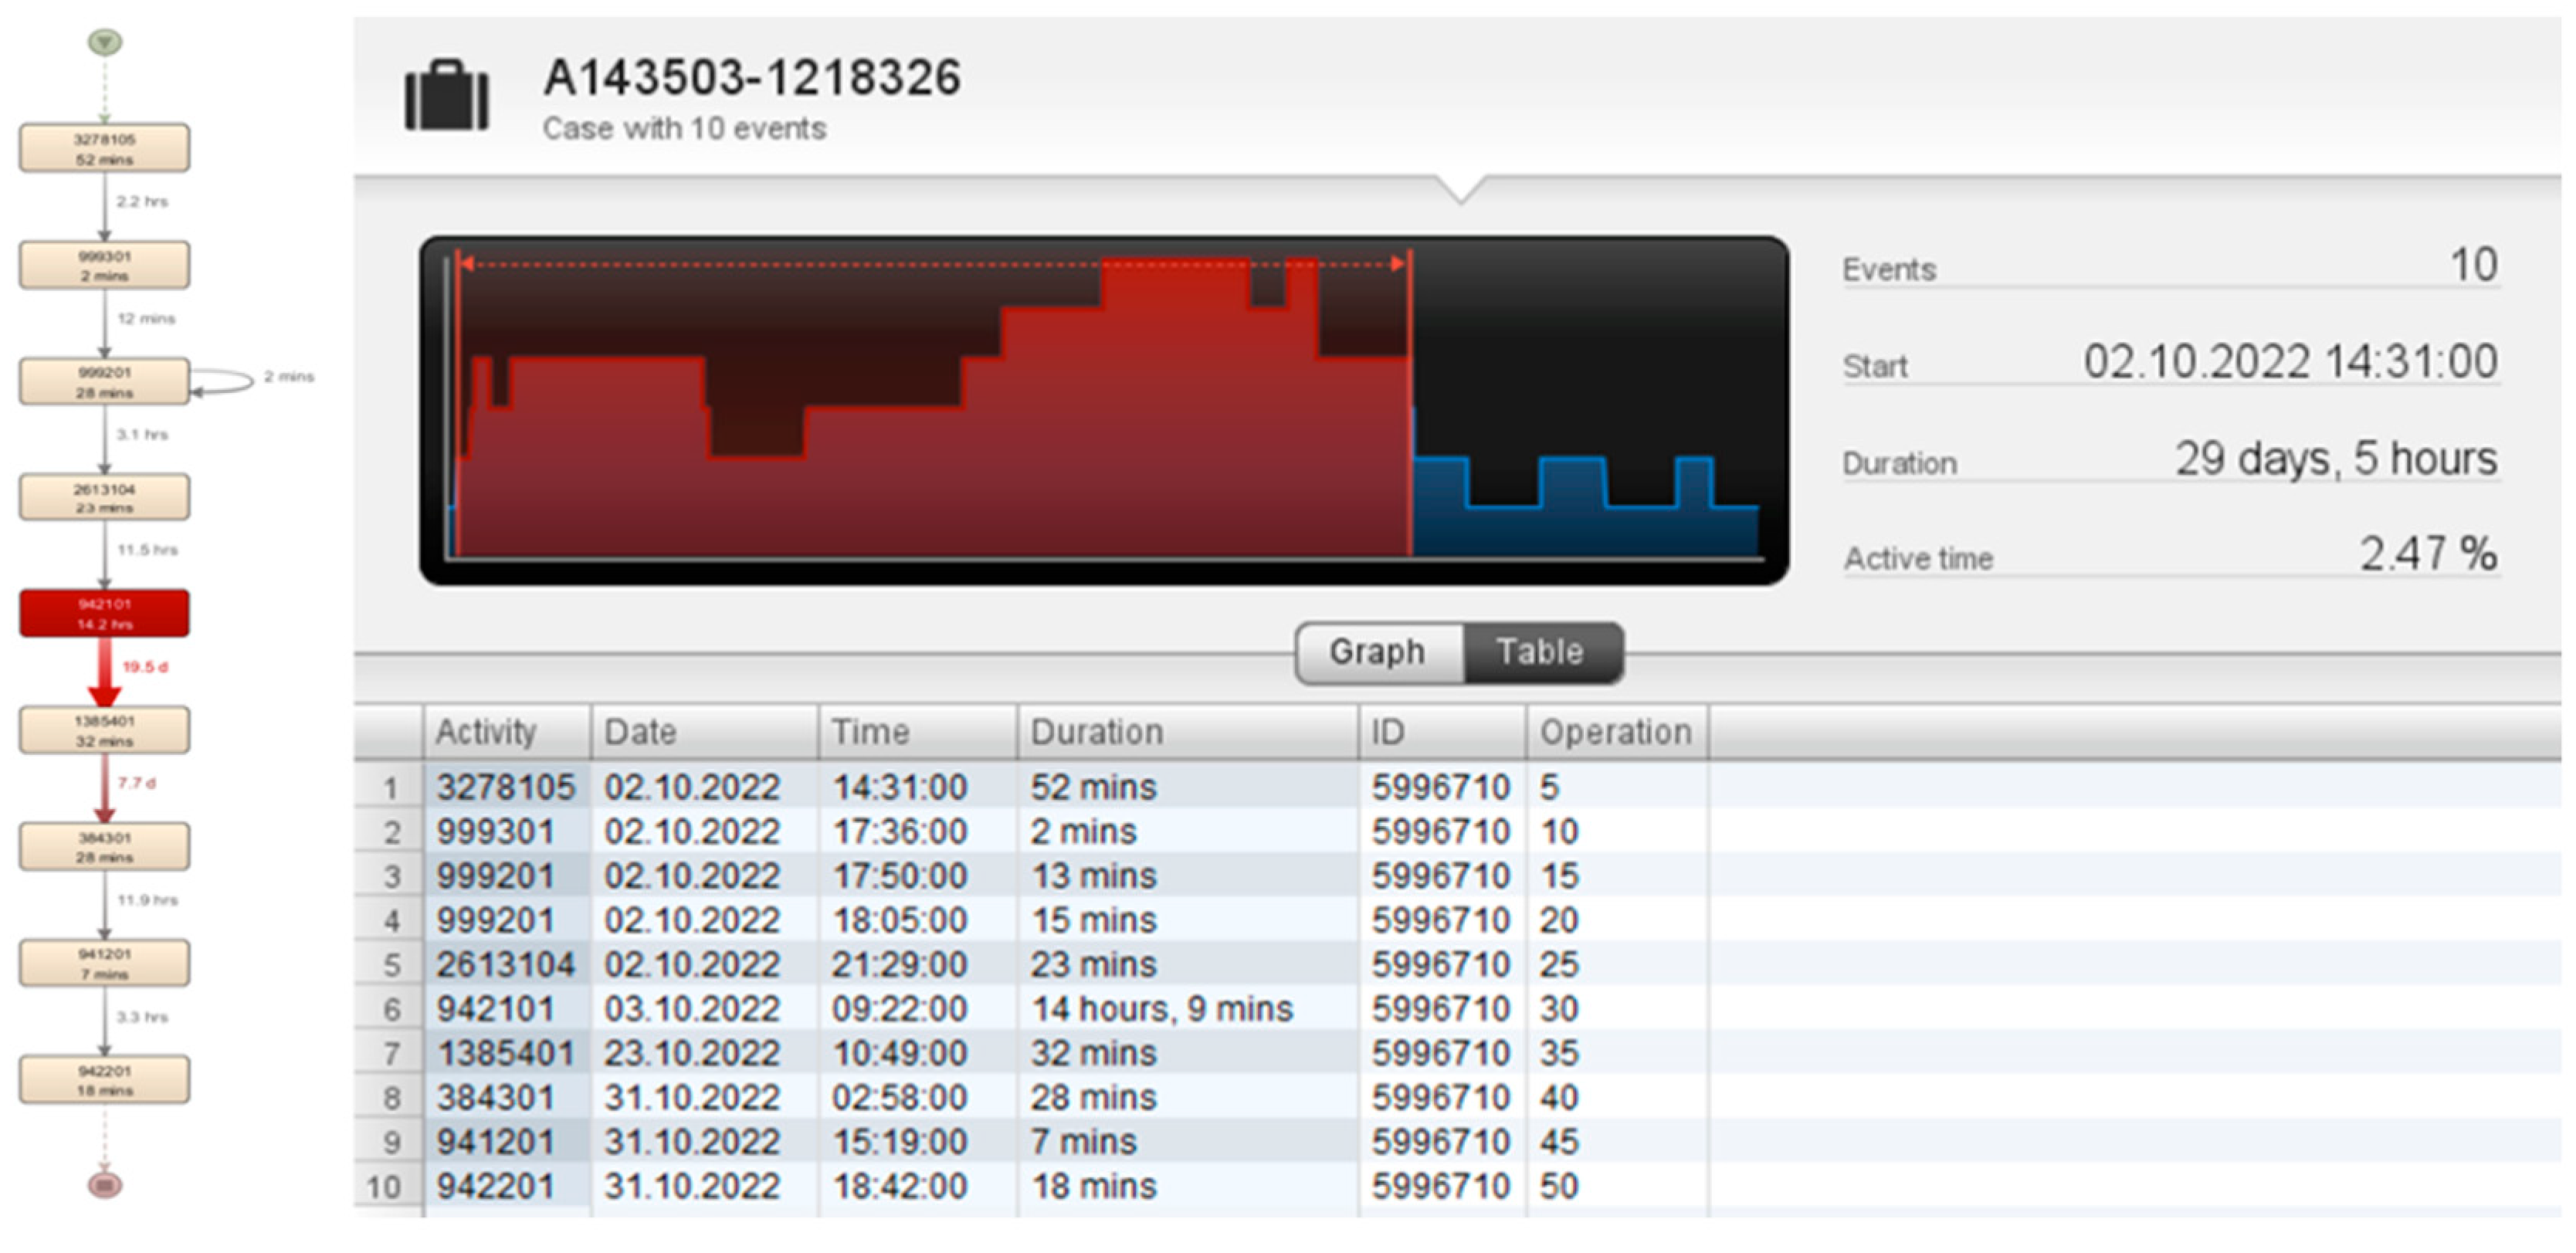
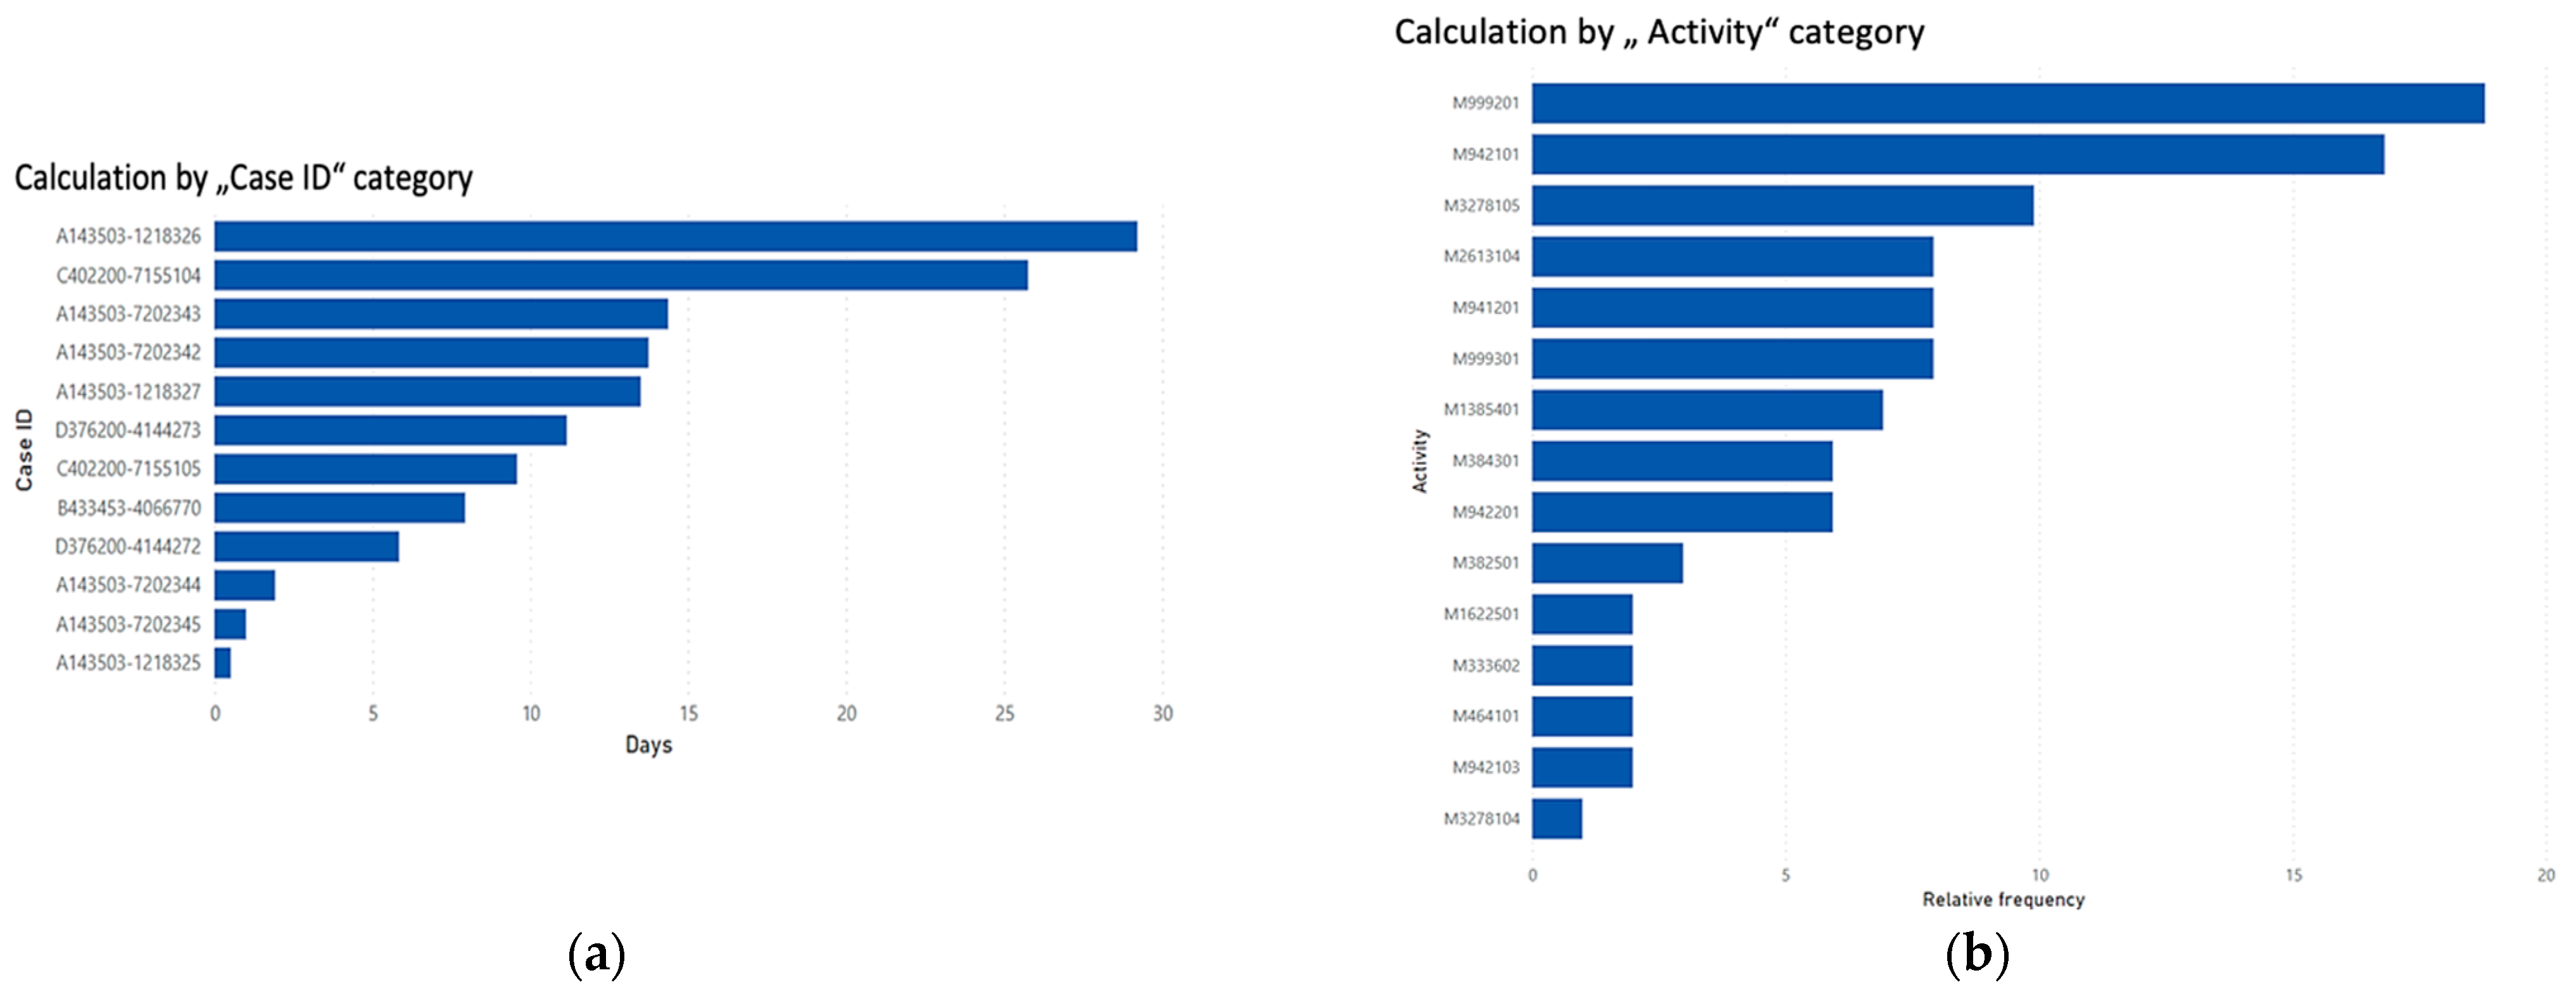
- Identification of critical orders and equipment: In this case, orders with the longest lead times and the most utilized equipment are searched for (Figure 10):
- Order number “A143503-1218326” includes 10 activities, with a total duration of 29 days and 5 h;
- Order number “C402200-7155104” includes 11 activities, with a total duration of 25 days and 18 h;
- Machineries numbered “999201” and “942101” are the most active and, together, make up more than 1/3 (36%) of the share of the entire manufacturing process compared to other machineries.
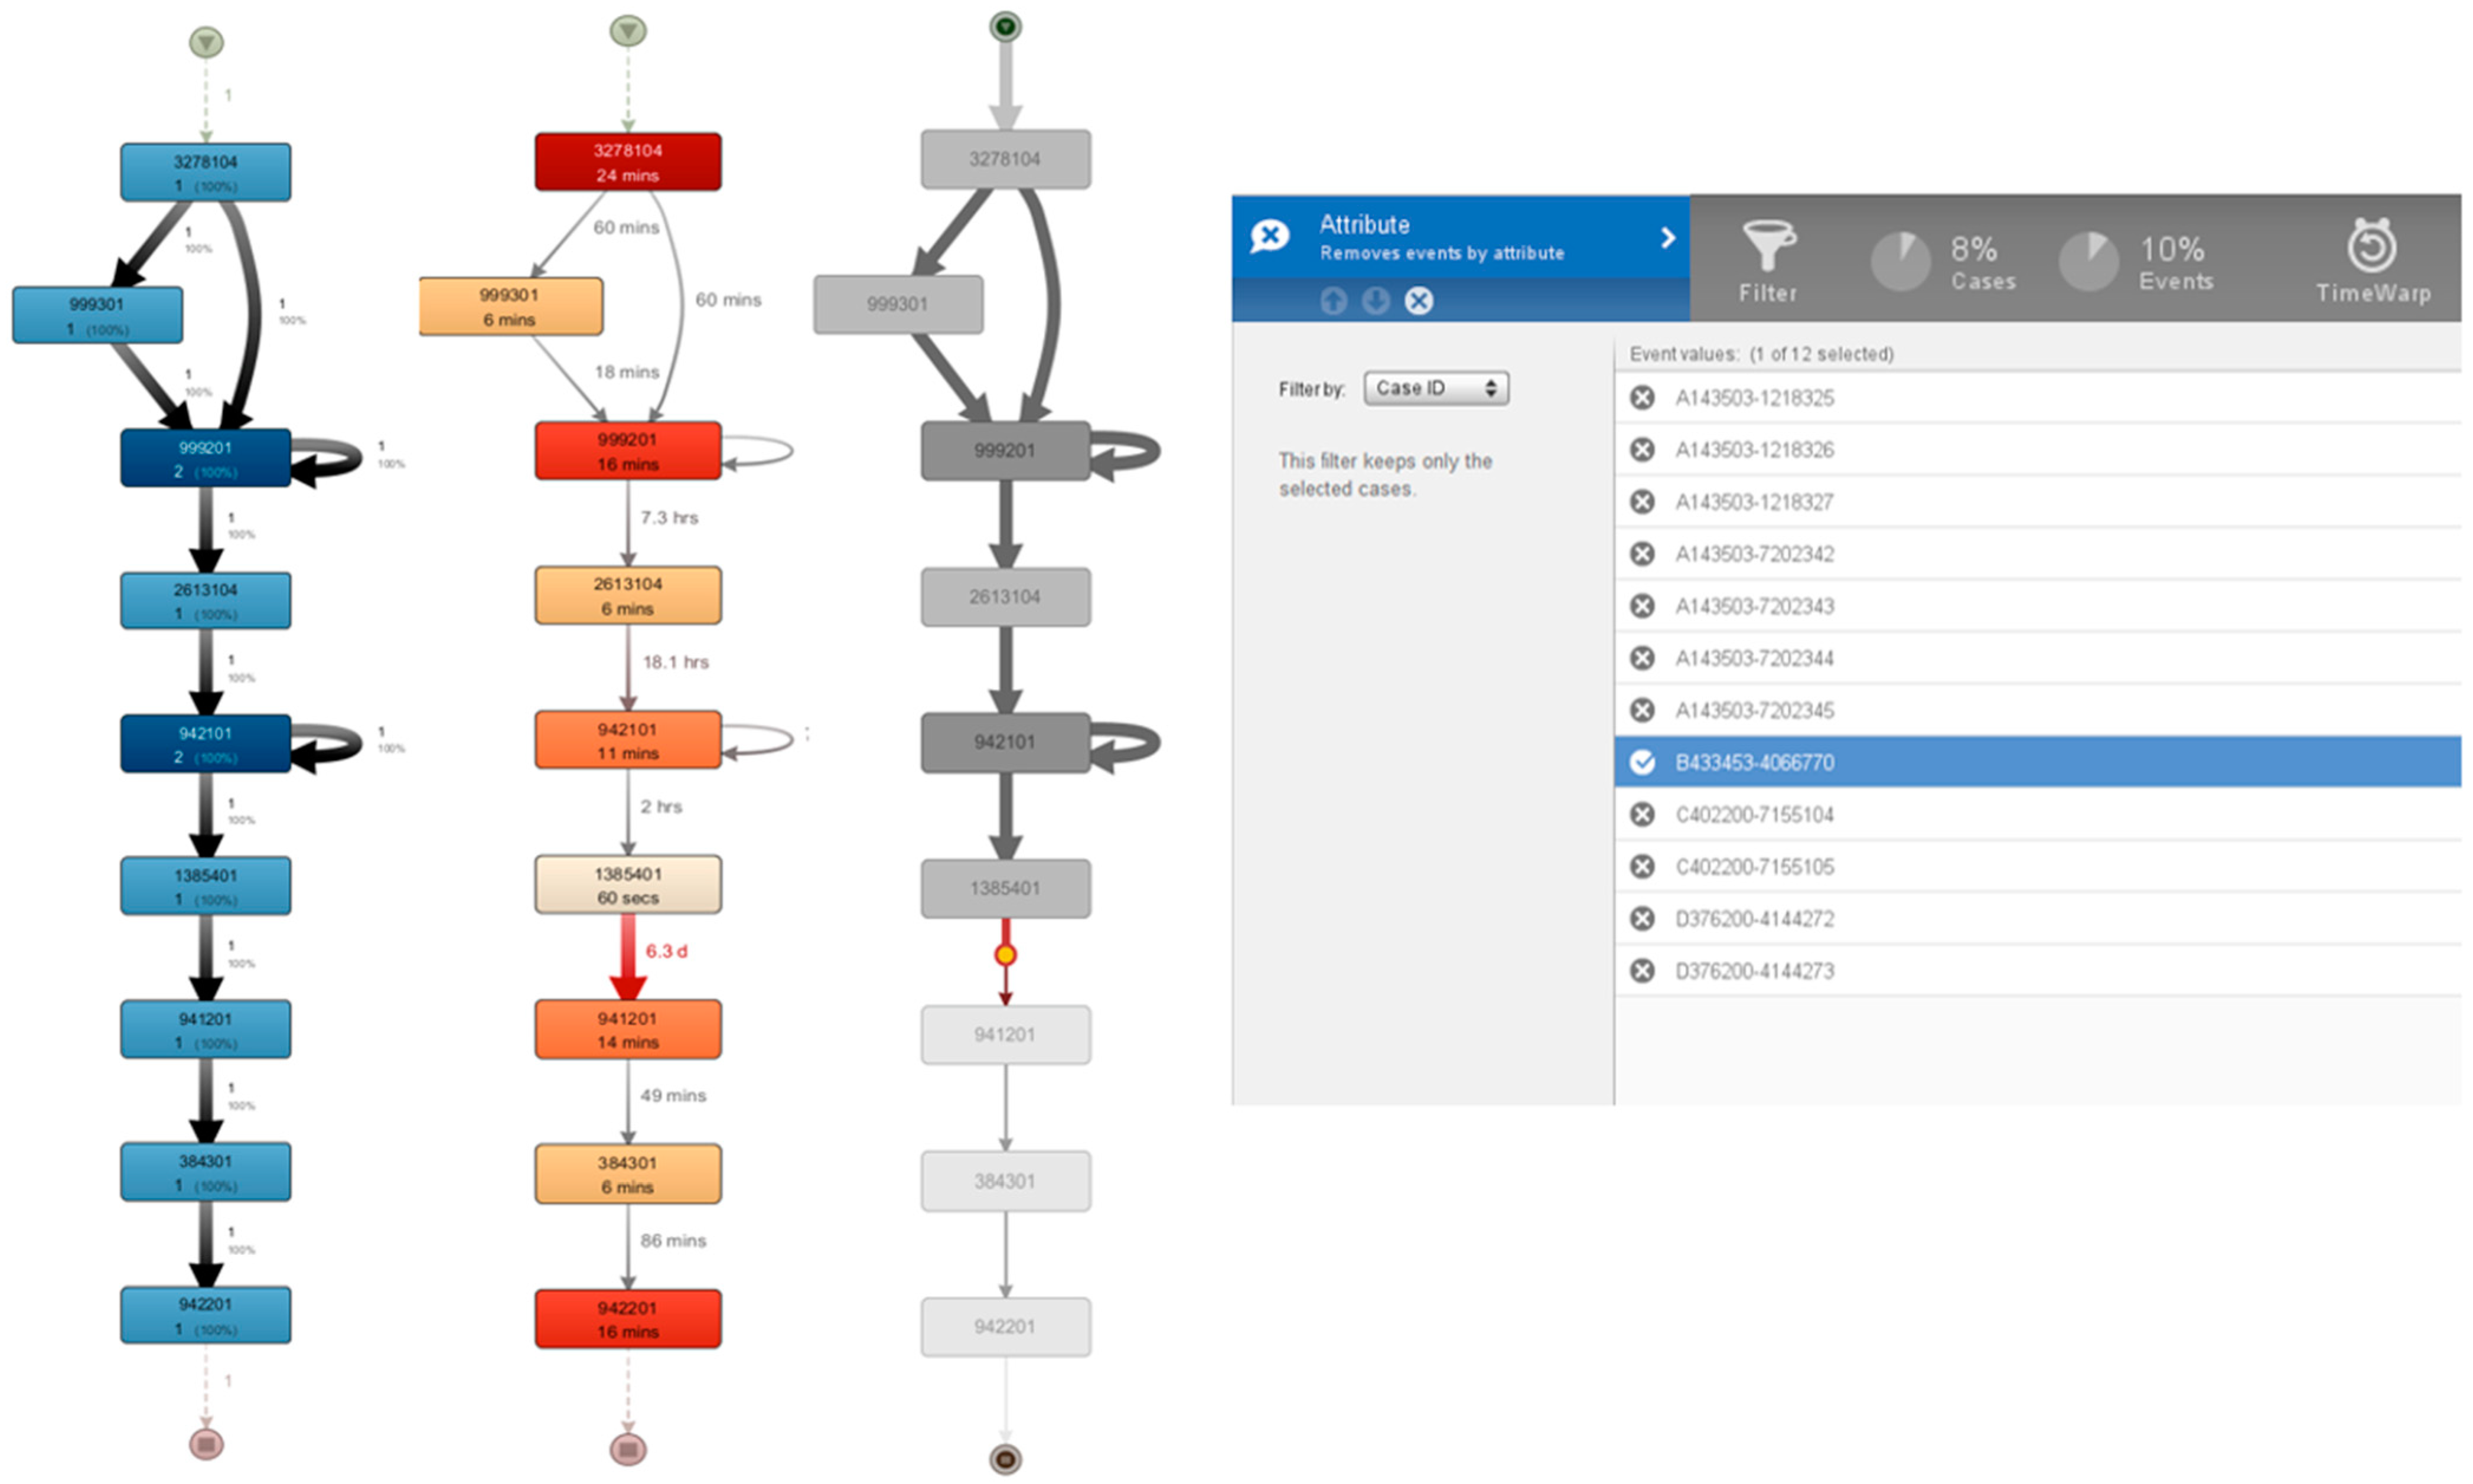
3.1. Use of Filters to Reveal Selected Processes and Equipment
- Order numbers “A143503-1218326” and “C402200-7155104”;
- Machinery numbers “999201” and “942101”.
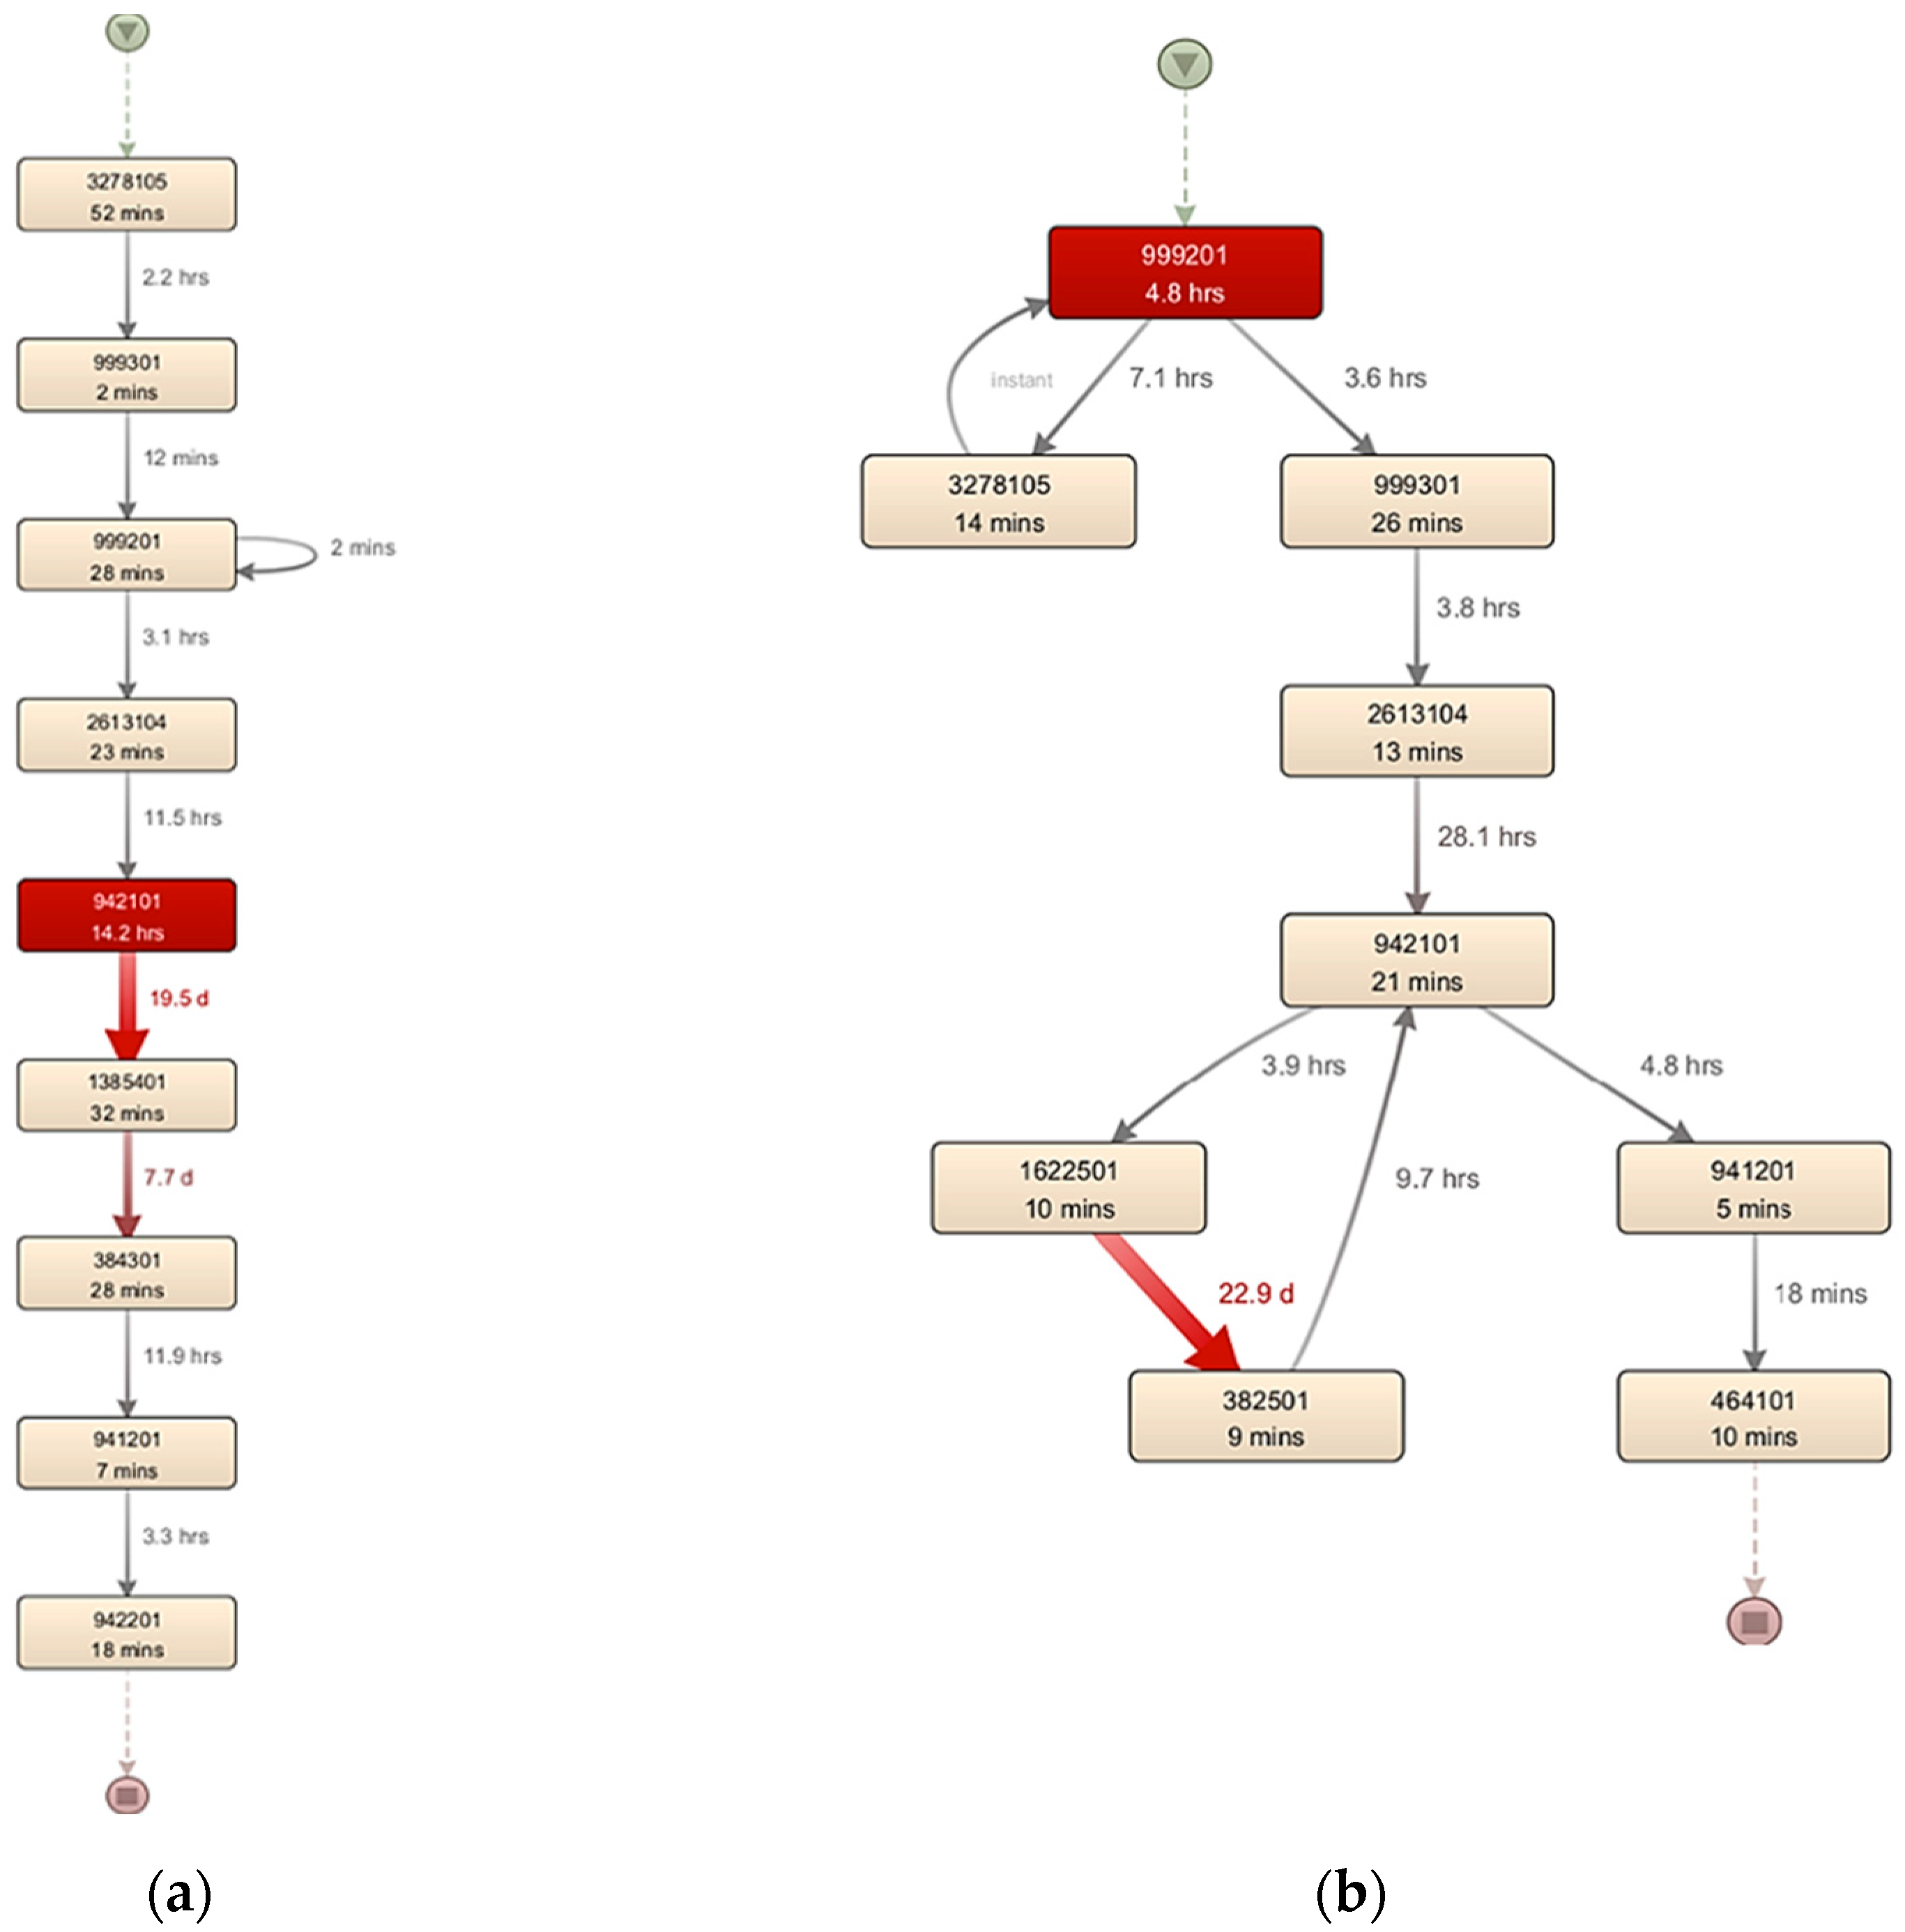
3.2. Analysis of the Process Map
- Long handling times. This could be caused by various types of waste: transport, inventory, waiting, overproduction, errors, and more.
- Long processing and retooling times within machinery equipment. In this case, the machines “942101” and “999201” were identified as the most utilized. Waste can come from a variety of sources, including transportation, inventory, waiting, overproduction, oversights, and more.
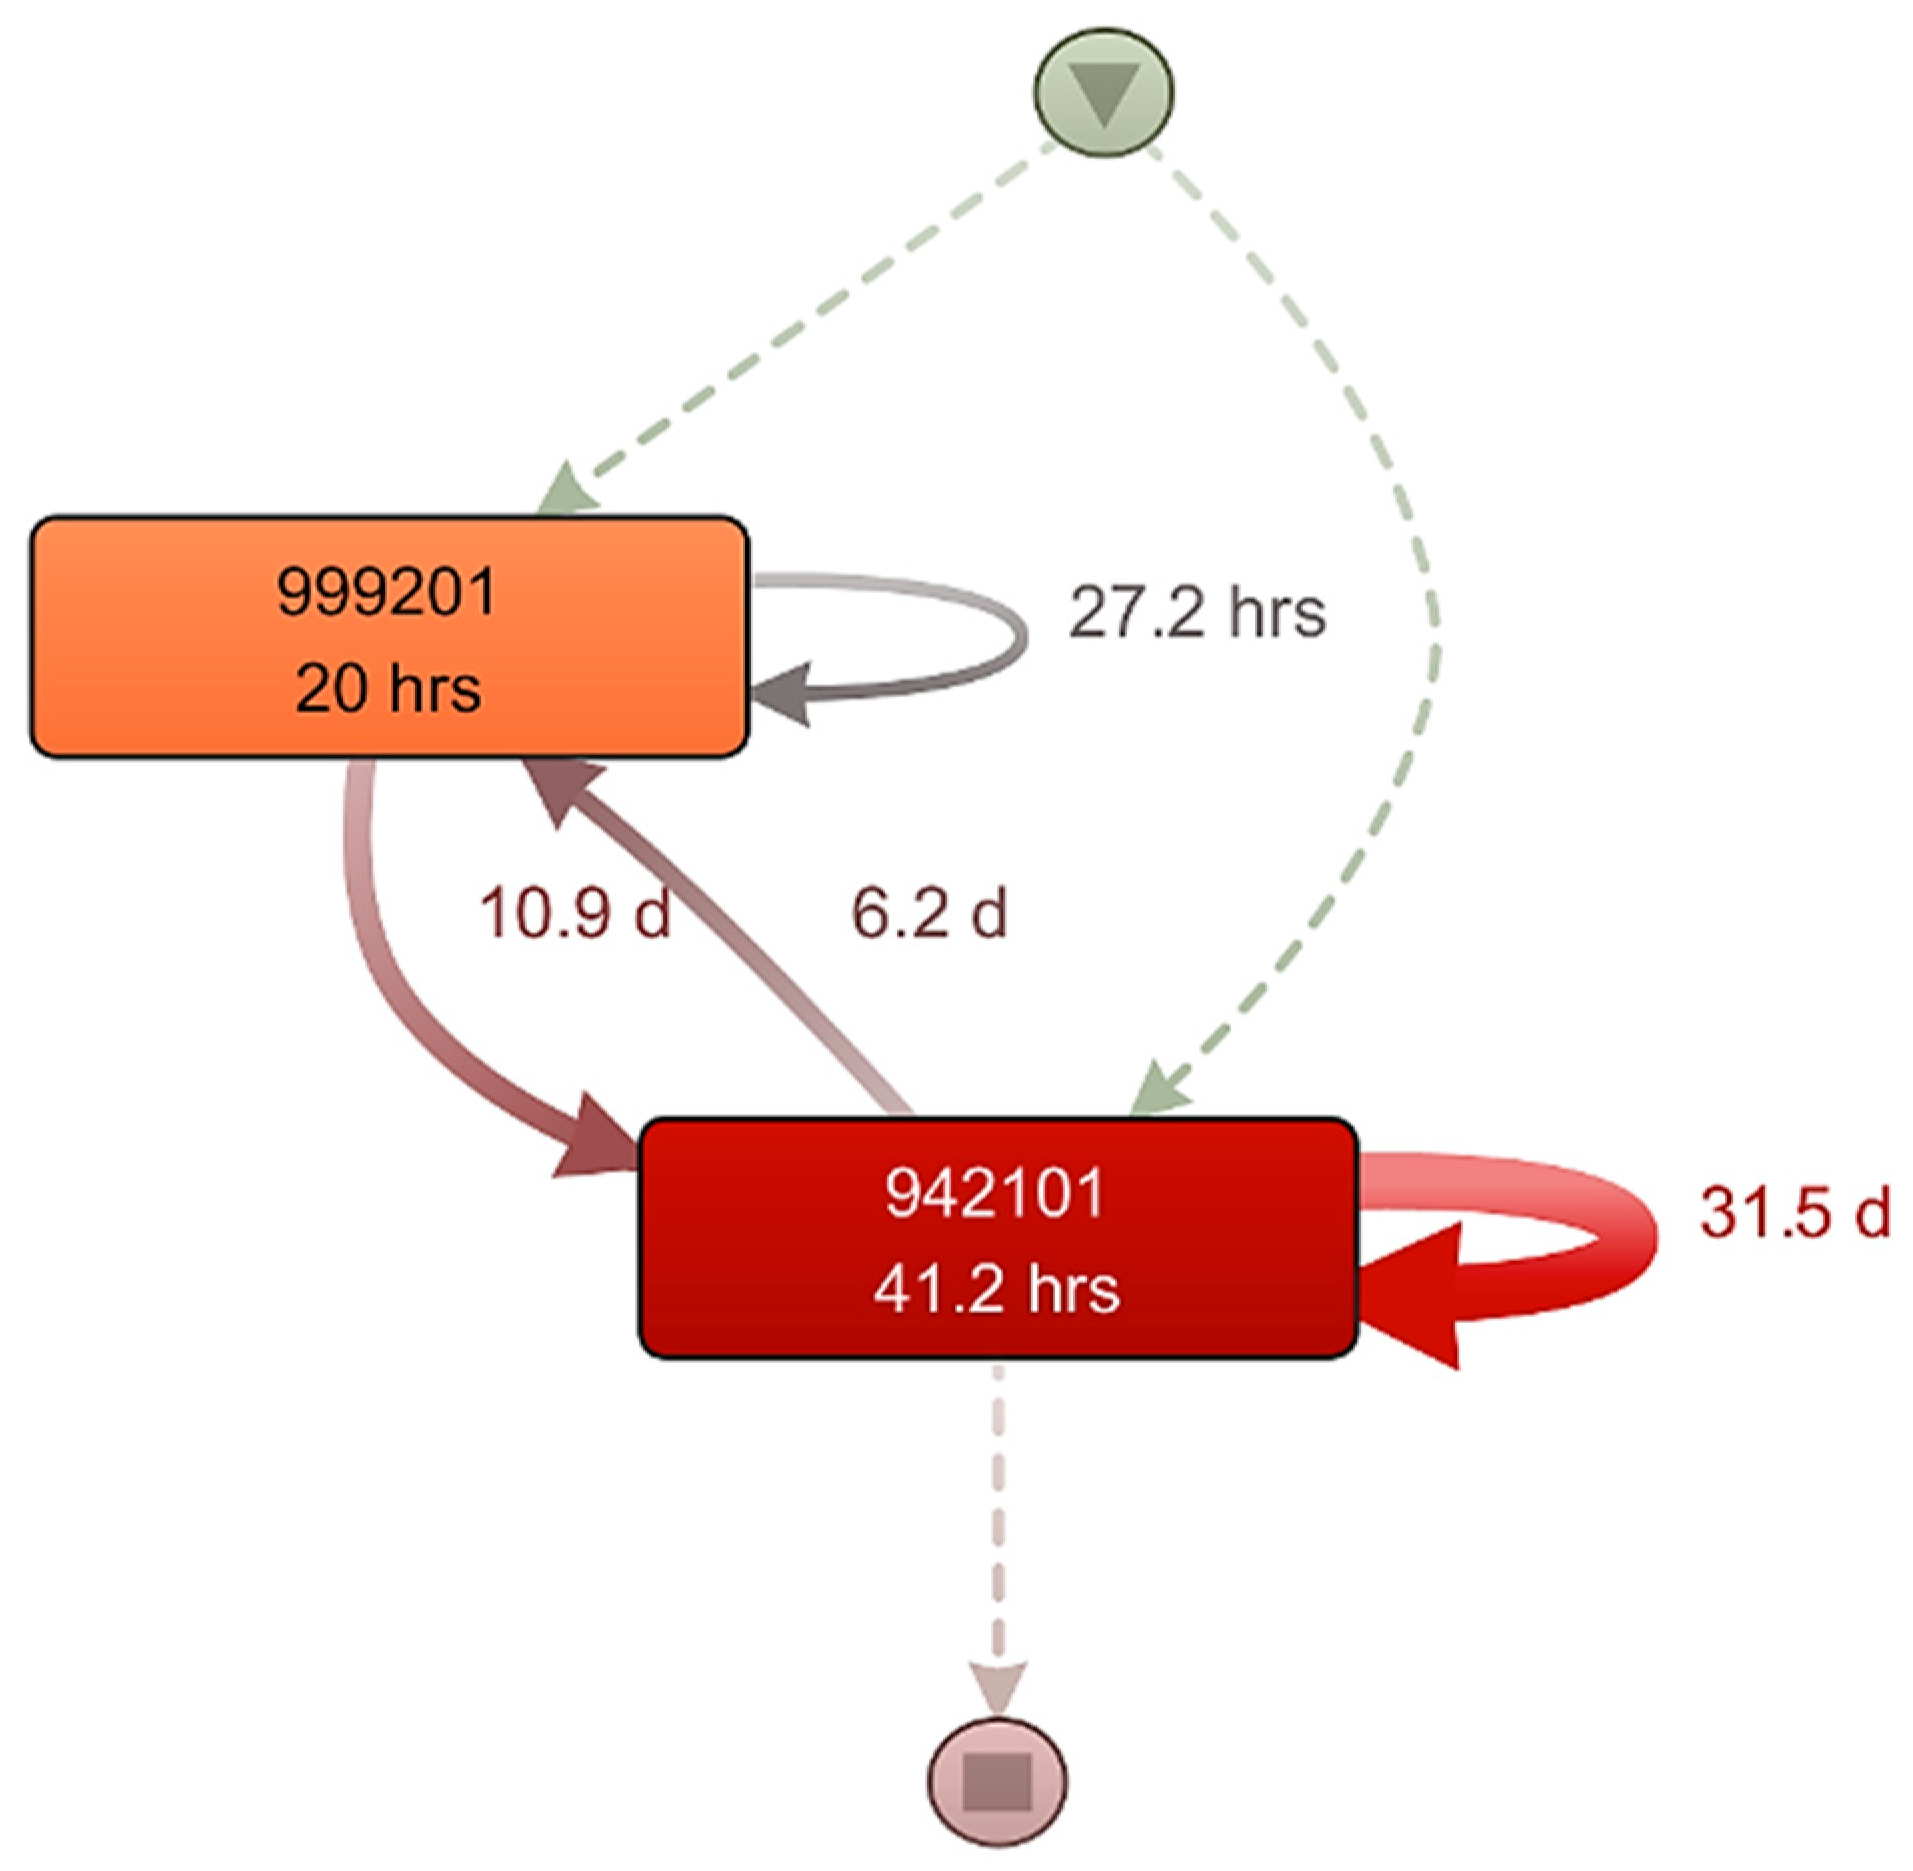
- Long rework time within machinery “942101”: 31.5 days (Figure 12). Such a problem can be caused by poorly performed operations, reduction in order prioritization, extension of the order lifecycle, waste within other workplaces, lack of material, and human error.
3.3. Outcomes of the Analysis
- A map of the sequence of the overall manufacturing process and individual orders;
- Time utilization of all or selected critical equipment;
- Rework analysis (quality indicator);
- Lead times;
- Number of work-in-progress manufacturing orders;
- Effective times;
- Lifecycle of the order.
- Order “A143503” with work order “1218326”, operation of technological procedure “30”, and machinery equipment “942101”. Identified problem:
- The processing time of the order itself is 29 days and 5 h;
- The machining time of processing machinery equipment is 14.2 h;
- Logistical time for material delivery from machine 942101 to machine 1385401: 19.5 days;
- Rework time on machinery equipment (999201): 17 min.
- Order “C402200” with work order “7155104”, operation of technological procedure “5”, and machinery equipment “999201”. Identified problem:
- The processing time of the order itself is 29 days and 5 h;
- The machining time of processing machinery equipment is 14.2 h;
- Logistical time for material delivery from machine 942101 to machine 1385401: 19.5 days;
- Rework time on machinery equipment (999201): 17 min.
4. Discussion
- Increased process transparency: Our model provides a deep insight into operational processes, enabling managers to identify key bottlenecks and effectively monitor process performance in real-time.
- Resource optimization: The analysis revealed opportunities for better utilization of resources and reduction of waste, leading to cost reductions and increased efficiency.
- Support for data-driven decision-making: With more accurate predictions of performance and potential risks, managers can make more informed decisions, enhancing the adaptability and competitiveness of the organization [34].
- Improvement in quality and customer satisfaction: The model allows for a better alignment of processes with customer needs and expectations, leading to a significant improvement in the quality of products and services.
- Quick analysis of massive statistical sets of all orders
- 2.
- Uncovering inefficiencies and opportunities for improvement
- 3.
- Understanding the true performance of processes
- 4.
- Predicting and preventing problems
- Dependency on input data
- 2.
- Time-consuming
- 3.
- Limited predictive capacity and analysis time period:
- 4.
- Alternative methods of analysis
5. Conclusions
Author Contributions
Funding
Data Availability Statement
Acknowledgments
Conflicts of Interest
References
- Gregor, M.; Hodon, R.; Binasova, V.; Dulina, L.; Gašo, M. Design of Simulation-Emulation Logistics System. MM Sci. J. 2018, 2018, 2498–2502. [Google Scholar] [CrossRef]
- Schuh, G.; Gützlaff, A.; Schmitz, S.; Kuhn, C.; Klapper, N. Process Mining as Alternative to Traditional Methods to Describe Process Performance in End-to-End Order Processing of Manufacturing Companies. J. Adv. Manag. Sci. 2022, 10, 1–8. [Google Scholar] [CrossRef]
- Stefanovic, D.; Dakic, D.; Stevanov, B.; Lolic, T. Process Mining in Manufacturing: Goals, Techniques and Applications. In Advances in Production Management Systems. The Path to Digital Transformation and Innovation of Production Management Systems; IFIP Advances in Information and Communication Technology; Springer International Publishing: Cham, Switzerland, 2020; pp. 54–62. [Google Scholar] [CrossRef]
- Luo, H.-J.; Wang, S.; Chen, C.; Tai, H.-E.; Chien, C.-F.; Chen, P.-N. Using Process Experienced Correlation Table to Improve the Accuracy and Reliability of Data Mining for Yield Improvement. In 2004 Semiconductor Manufacturing Technology Workshop Proceedings; IEEE: Hsinchu, Taiwan, 2004; pp. 127–130. [Google Scholar] [CrossRef]
- Susilawati, A.; Tasri, A.; Arief, D.S. Yohanes Wastes Analysis to Improve the Productivity and Sustainability in Manufacturing Industry. J. Phys.Conf. Ser. 2019, 1351, 012110. [Google Scholar] [CrossRef]
- Subhashish, S.; Lance, H. Waste Elimination: The Common Denominator for Improving Operations. Ind. Manag. Data Syst. 1993, 93, 13–19. [Google Scholar] [CrossRef]
- Dewi, S.; Utama, D.M.; Rohman, R.N. Minimize Waste on Production Process Using Lean Concept. J. Phys.Conf. Ser. 2021, 1764, 012201. [Google Scholar] [CrossRef]
- Kučerová, M.; Mĺkva, M.; Sablik, J.; Gejguš, M. Eliminating Waste in the Production Process Using Tools and Methods of Industrial Engineering. PEA 2015, 9, 30–34. [Google Scholar] [CrossRef]
- Dreher, S.; Reimann, P.; Gröger, C. Application Fields and Research Gaps of Process Mining in Manufacturing Companies. INFORMATIK 2021, 621–634. [Google Scholar] [CrossRef]
- Abonyi, J.; Dorgo, G. Process Mining in Production Systems. In Proceedings of the 2019 23rd International Conference on Intelligent Engineering Systems (INES), Gödöllő, Hungary, 25–27 April 2019; IEEE: Gödöllő, Hungary, 2019; pp. 000267–000270. [Google Scholar] [CrossRef]
- Chiu, T.; Jans, M. Process Mining of Event Logs: A Case Study Evaluating Internal Control Effectiveness. Account. Horiz. 2019, 33, 141–156. [Google Scholar] [CrossRef]
- Gola, A. Design and Management of Manufacturing Systems. Appl. Sci. 2021, 11, 2216. [Google Scholar] [CrossRef]
- Beric, D.; Havzi, S.; Lolic, T.; Simeunovic, N.; Stefanovic, D. Development of the MES Software and Integration with an Existing ERP Software in Industrial Enterprise. In Proceedings of the 2020 19th International Symposium INFOTEH-JAHORINA (INFOTEH), East Sarajevo, Bosnia and Herzegovina, 18–20 March 2020; IEEE: East Sarajevo, Bosnia and Herzegovina, 2020; pp. 1–6. [Google Scholar] [CrossRef]
- Więcek, D.; Więcek, D.; Dulina, L. Materials Requirement Planning with the Use of Activity Based Costing. Manag. Syst. Prod. Eng. 2020, 28, 3–8. [Google Scholar] [CrossRef]
- Crnjac, M.; Veža, I.; Banduka, N. From Concept to the Introduction of Industry 4.0. Int. J. Ind. Eng. Manag. 2017, 8, 21–30. [Google Scholar] [CrossRef]
- Lopes, I.; Figueiredo, M. Criticality Evaluation to Support Maintenance Management of Manufacturing Systems. Int. J. Ind. Eng. Manag. 2020, 11, 3–18. [Google Scholar] [CrossRef]
- Pekarčíková, M.; Trebuňa, P.; Markovič, J. Case Study of Modelling the Logistics Chain in Production. Procedia Eng. 2014, 96, 355–361. [Google Scholar] [CrossRef]
- Van Der Aalst, W.; Weijters, T.; Maruster, L. Workflow Mining: Discovering Process Models from Event Logs. IEEE Trans. Knowl. Data Eng. 2004, 16, 1128–1142. [Google Scholar] [CrossRef]
- Da Silva, L.F.N. Process Mining: Application to a Case Study. 2014. Available online: https://core.ac.uk/download/pdf/302923848.pdf (accessed on 21 November 2014).
- Van Der Aalst, W.M.P.; Reijers, H.A.; Weijters, A.J.M.M.; Van Dongen, B.F.; Alves De Medeiros, A.K.; Song, M.; Verbeek, H.M.W. Business Process Mining: An Industrial Application. Inf. Syst. 2007, 32, 713–732. [Google Scholar] [CrossRef]
- Pena, M.R.; Bayona-Ore, S. Process Mining and Automatic Process Discovery. In Proceedings of the 2018 7th International Conference on Software Process Improvement (CIMPS), Guadalajara, Mexico, 17–19 October 2018; IEEE: Guadalajara, Jalisco, Mexico, 2018; pp. 41–46. [Google Scholar] [CrossRef]
- Ďurica, L.; Gregor, M.; Vavrík, V.; Marschall, M.; Grznár, P.; Mozol, Š. A Route Planner Using a Delegate Multi-Agent System for a Modular Manufacturing Line: Proof of Concept. Appl. Sci. 2019, 9, 4515. [Google Scholar] [CrossRef]
- Van Der Aalst, W.M.P. Process Mining: Discovery, Conformance and Enhancement of Business Processes; Springer: Berlin/Heidelberg, Germany, 2011. [Google Scholar] [CrossRef]
- Van Der Aalst, W. Spreadsheets for Business Process Management: Using Process Mining to Deal with “Events” Rather than “Numbers”? BPMJ 2018, 24, 105–127. [Google Scholar] [CrossRef]
- Trebuna, P.; Straka, M.; Rosova, A.; Malindzakova, M. Petri nets as a tool for production streamlining in plastics processing. Przem. Chem. 2015, 94, 1605–1608. [Google Scholar]
- Kregel, I.; Stemann, D.; Koch, J.; Coners, A. Process Mining for Six Sigma: Utilising Digital Traces. Comput. Ind. Eng. 2021, 153, 107083. [Google Scholar] [CrossRef]
- Weerapong, S.; Porouhan, P.; Premchaiswadi, W. Process Mining Using Alpha-Algorithm as a Tool (A Case Study of Student Registration). In Proceedings of the 2012 Tenth International Conference on ICT and Knowledge Engineering, Bangkok, Thailand, 21–23 November 2012; IEEE: Bangkok, Thailand, 2012; pp. 213–220. [Google Scholar] [CrossRef]
- Van Der Aalst, W.M.P.; Van Dongen, B.F. Discovering Petri Nets from Event Logs. In Transactions on Petri Nets and Other Models of Concurrency VII; Jensen, K., Van Der Aalst, W.M.P., Balbo, G., Koutny, M., Wolf, K., Eds.; Lecture Notes in Computer Science; Springer: Berlin/Heidelberg, Germany, 2013; Volume 7480, pp. 372–422. [Google Scholar] [CrossRef]
- Van Der Aalst, W.M.P. A Practitioner’s Guide to Process Mining: Limitations of the Directly-Follows Graph. Procedia Comput. Sci. 2019, 164, 321–328. [Google Scholar] [CrossRef]
- Buijs, J.C.A.M.; van Dongen, B.F.; van der Aalst, W.M.P. On the Role of Fitness, Precision, Generalization and Simplicity in Process Discovery. In On the Move to Meaningful Internet Systems: OTM 2012; Meersman, R., Panetto, H., Dillon, T., Rinderle-Ma, S., Dadam, P., Zhou, X., Pearson, S., Ferscha, A., Bergamaschi, S., Cruz, I.F., Eds.; Lecture Notes in Computer Science; Springer: Berlin/Heidelberg, Germany, 2012; pp. 305–322. [Google Scholar] [CrossRef]
- Janík, S.; Szabó, P.; Mĺkva, M.; Mareček-Kolibiský, M. Effective Data Utilization in the Context of Industry 4.0 Technology Integration. Appl. Sci. 2022, 12, 10517. [Google Scholar] [CrossRef]
- Fluxicon. Technical Documentation of Disco Software—Import Data Sets. Disco User Guide. Available online: https://fluxicon.com/book/read/statisticsview/ (accessed on 1 July 2022).
- Fluxicon. Technical Documentation of Disco Software—Analyzing Statistics. Disco User Guide. Available online: https://fluxicon.com/book/read/import (accessed on 1 July 2022).
- Grznár, P.; Burganová, N.; Mozol, Š.; Mozolová, L. A Comprehensive Digital Model Approach for Adaptive Manufacturing Systems. Appl. Sci. 2023, 13, 10706. [Google Scholar] [CrossRef]


| Case ID | Activity | Timestamp |
|---|---|---|
| 1 | A | 5 December 2022 10:12:18.000 |
| 1 | B | 5 December 2022 11:30:18.000 |
| 1 | C | 5 December 2022 13:22:18.000 |
| 2 | A | 9 December 2022 12:11:18.000 |
| 2 | C | 9 December 2022 14:40:18.000 |
| 2 | A | 9 December 2022 16:16:18.000 |
| 2 | D | 9 December 2022 17:05:18.000 |
| 3 | A | 11 December 2022 08:02:18.000 |
| 3 | E | 11 December 2022 09:43:18.000 |
| 3 | D | 11 December 2022 11:37:18.000 |
| Name | Symbol | Function | Example |
|---|---|---|---|
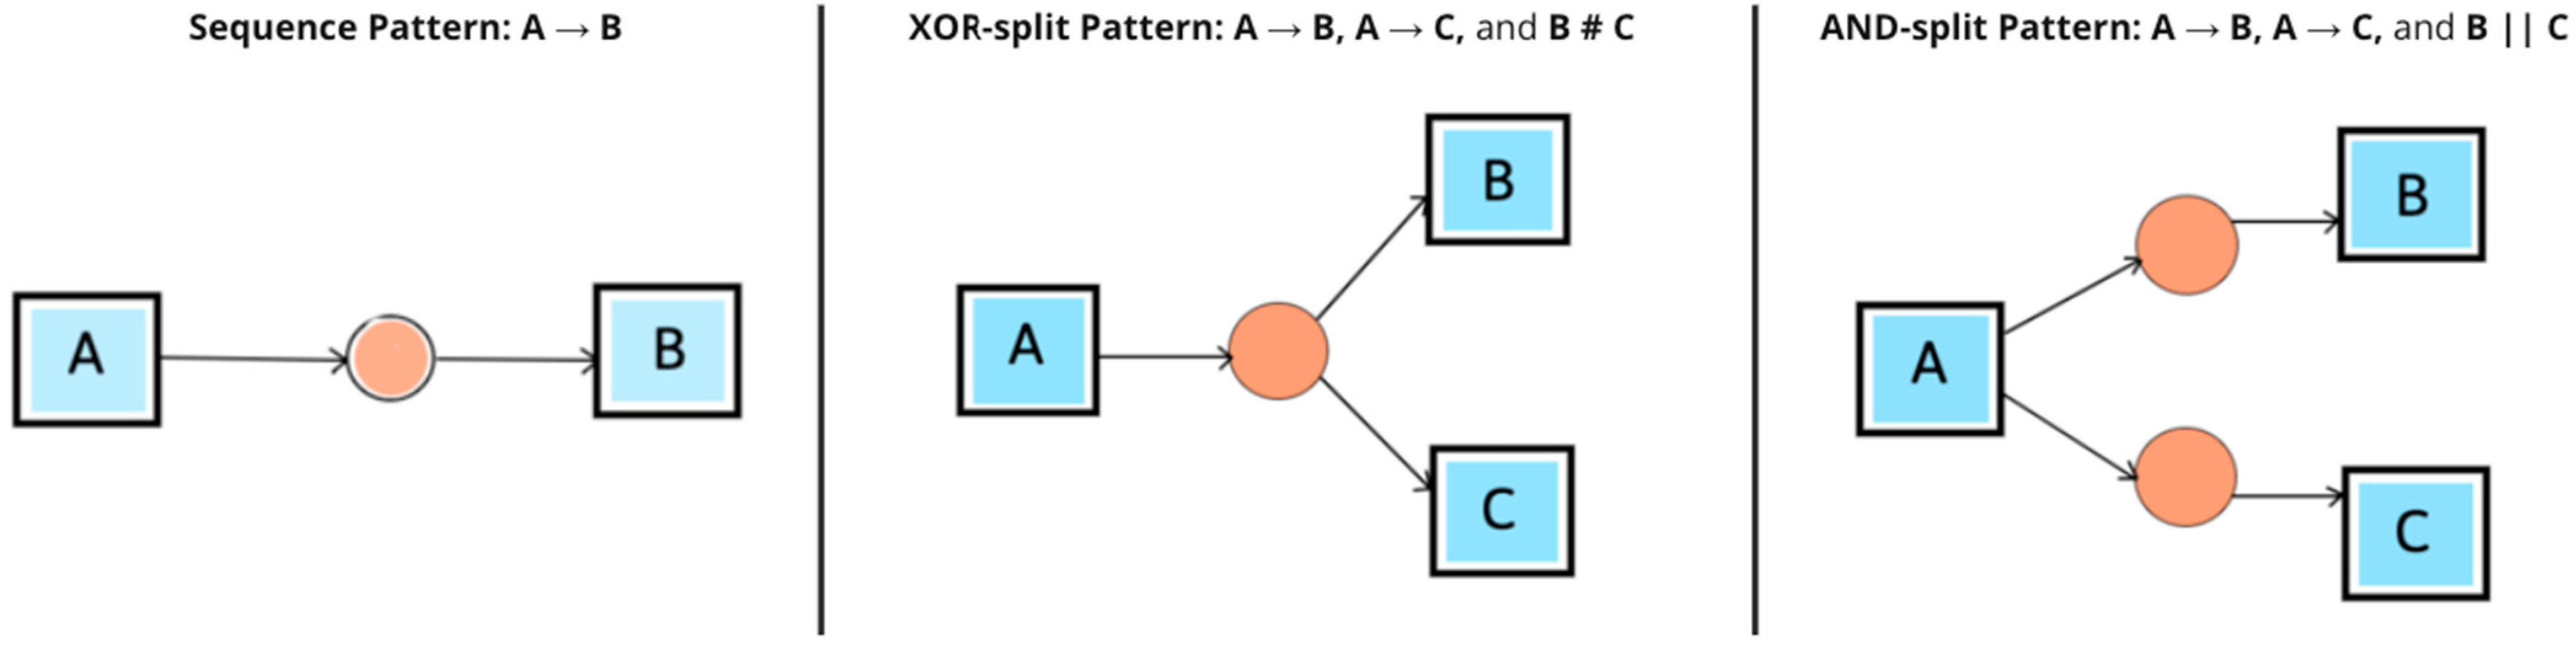
| Direct Succession | > | x > y if and only if some relation x is directly followed by y. | A > E, A > C |
| Causality | → | x → y if x > y and not y > x. | A → E |
| Parallel | || | x || y if x > y and y > x. | B || C |
| Choice | # | x #y if not (x > y) and not (y > x). | A # D |
| A | B | C | D | E | |
| A | # | → | → | # | → |
| B | ← | # | || | → | # |
| C | ← | || | # | → | # |
| D | # | ← | ← | # | ← |
| E | ← | # | # | → | # |
Disclaimer/Publisher’s Note: The statements, opinions and data contained in all publications are solely those of the individual author(s) and contributor(s) and not of MDPI and/or the editor(s). MDPI and/or the editor(s) disclaim responsibility for any injury to people or property resulting from any ideas, methods, instructions or products referred to in the content. |
© 2024 by the authors. Licensee MDPI, Basel, Switzerland. This article is an open access article distributed under the terms and conditions of the Creative Commons Attribution (CC BY) license (https://creativecommons.org/licenses/by/4.0/).
Share and Cite
Krajčovič, M.; Bastiuchenko, V.; Furmannová, B.; Botka, M.; Komačka, D. New Approach to the Analysis of Manufacturing Processes with the Support of Data Science. Processes 2024, 12, 449. https://doi.org/10.3390/pr12030449
Krajčovič M, Bastiuchenko V, Furmannová B, Botka M, Komačka D. New Approach to the Analysis of Manufacturing Processes with the Support of Data Science. Processes. 2024; 12(3):449. https://doi.org/10.3390/pr12030449
Chicago/Turabian StyleKrajčovič, Martin, Vsevolod Bastiuchenko, Beáta Furmannová, Milan Botka, and Dávid Komačka. 2024. "New Approach to the Analysis of Manufacturing Processes with the Support of Data Science" Processes 12, no. 3: 449. https://doi.org/10.3390/pr12030449