Article

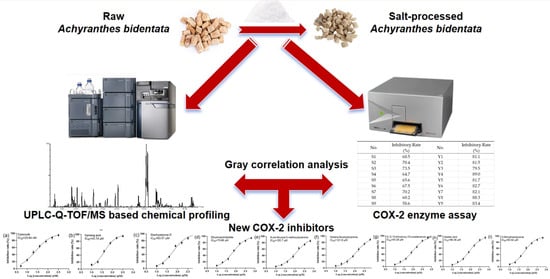
Optimizing the Salt-Processing Parameters of Achyranthes bidentata and Their Correlation with Anti-Osteoarthritis Effect

1
College of Pharmaceutical Science, Zhejiang University of Technology, Hangzhou 310014, China
2
Hangzhou Food and Drug Inspection and Research Institute, Hangzhou 310022, China
*
Author to whom correspondence should be addressed.
Processes 2024, 12(3), 434; https://doi.org/10.3390/pr12030434
Submission received: 24 January 2024 / Revised: 12 February 2024 / Accepted: 18 February 2024 / Published: 21 February 2024

Abstract

:
Achyranthes bidentata is always salt-processed before being prescribed for treating osteoarthritis. Yet the salt-processing parameters have not been optimized, and the specific bioactive constituents responsible for the osteoarthritis effect of salt-processed A. bidentata have not been fully elucidated. In this study, a Box–Behnken experimental design was chosen for the optimization of the salt-processing parameters of A. bidentata, including stir-frying time, concentration of brine, and soak time. Meanwhile, HPLC–Q-TOF-MS was utilized to analyze the chemical profiles of various batches of raw and salt-processed A. bidentata. The anti-inflammatory potential of nine batches of both raw and salt-processed A. bidentata was assessed via a cyclooxygenase-2 (COX-2) inhibitory assay. A gray correlation analysis was conducted to correlate the peak areas of the compounds in raw and salt-processed A. bidentata with their COX-2 inhibitory effects. Finally, the optimal salt-processing conditions are as follows: soak time: 29 min; concentration of brine: 1.8%; stir-frying time: 4.4 min. Twenty-nine compounds were identified. Eight compounds were found to have a strong positive correlation with anti-inflammatory activity, as confirmed by the COX-2 inhibitory assay. Notably, this is the first report of the COX-2 inhibitory effects of sanleng acid, stachysterone D, dihydroactinidiolide, N-cis-feruloyl-3-methoxytyramine, 9,12,13-trihydroxy-10-octadecenoic acid, azelaic acid, and dehydroecdysone.

Graphical Abstract

1. Introduction

Traditional methods for processing crude herbs distinctly differentiate traditional Chinese medicine from Western medicine. These methods encompass sauteing with rice wine [1,2] or brine, steaming with water or rice wine [3], frying with sand [4,5] or oil, and braising with rice wine or licorice liquids. The primary objective of processing is to eliminate or diminish toxicity and side effects, alter nature and actions, and enhance therapeutic effects. Simultaneously, to guarantee safety and efficacy, it is essential to rigorously control and regulate the quality of processed products.
Achyranthes bidentata, as one of the “four major Huai medicines,” is mainly cultivated in Henan province. The chemical constituents of A. bidentata include oleanolic acid glycosides, saponins, ecdysterone, ketosteroids, and flavonoids [6]. Although modern pharmacological studies have shown that A.bidentata has a plethora of bio-activities, including anti-osteoarthritis [7], improving memory [8], regulating blood sugar level [9], preventing apoptosis [10], promoting angiogenesis, UV protection [11], anti-convulsion [12], anti-osteoporosis [13], improving xerophthalmia [14], and alleviating acute kidney injury [15], this herb is commonly used in the clinical treatment of osteoarthritis. After being salt-processed, the effects will be dramatically enhanced. However, the salt-processing parameters for Achyranthes bidentata have not been optimized yet.
Quality by design (QbD) is a concept in the pharmaceutical and biopharmaceutical industries endorsed by regulatory agencies such as the U.S. Food and Drug Administration (FDA) [16]. The key principles of QbD involve the systematic identification of critical product attributes and process parameters and understanding how these factors influence product quality. Experimental design methods were always used. The salt-processing method for Achyranthes bidentata includes several process parameters, such as stir-frying time, concentration of brine, and soak time. How these process parameters affect the quality of salt-processed Achyranthes bidentata needs to be understood.
Salt-processed Achyranthes bidentata is prescribed for treating osteoarthritis. The anti-inflammatory effect is the critical product attribute of salt-processed Achyranthes bidentata. Cyclooxygenase-2 (COX-2), also known as prostaglandin oxidase synthase (PTGS-2), is a bifunctional enzyme with both cyclooxygenase and catalase activities. COX-2 inhibitors have played a significant anti-inflammatory role in vivo and in vitro [17]. A. bidentata can reduce the expression of COX-2 in the synovial tissue of joints through the arachidonic acid pathway and exert therapeutic effects on osteoarthritis [7]. The results suggested that the anti-osteoarthritis effect of A. bidentate is associated with COX-2; however, the compounds of A. bidentate that are attributed to the anti-inflammatory effects are poorly understood.
The aim of this work is to optimize the salt-processing parameters of A. bidentate by using a Box–Behnken experimental design, apply HPLC–Q-TOF-MS analysis in conjunction with orthogonal partial least squares discriminant analysis to identify the differential markers between raw and salt-processed A. bidentate, and obtain the quality markers for the anti-inflammatory activity of salt-processed A. bidentate by using COX-2 inhibition assay and gray correlation analysis.

2. Materials and Methods

2.1. Instruments and Chemicals

Agilent 1290 high-performance liquid chromatography (Agilent Technology Co., Santa Clara, CA, USA); PD-1D-50 freeze dryer (Beijing Boyikang Experimental Instrument Co., Beijing, China); UPLC-Triple TOF 5600+ high-resolution mass spectrometry system (Waters Corporation/AB Sciex Corporation, Framingham, MA, USA); Tecan sunrise multifunctional microplate reader (Diken Trading Co., Shanghai, China).
Acetonitrile was obtained from Tedia Company, Inc. (Fairfield, OH, USA); Methanol from Sinopharm Chemical Reagent Co., Shanghai, China; n-butanol from Sinopharm Chemical Reagent Co.; PBS buffer from Shanghai Yuanye Biotechnology Co., Shanghai, China; COX-2 inhibitor screening kit from Biyuntian Biotechnology Co., Shanghai, China; Nine batches of A. bidentata were collected from Wen County, Henan Province, and authenticated by Professor Wang Ping of Zhejiang University of Technology. Voucher specimens were deposited in the herbarium of the College of Pharmaceutical Science, Moganshan campus of Zhejiang University of Technology. Standard substances with purities > 98%, including ecdysterone, 25R-inokosterone, and 25S-inokosterone, were obtained from the China Institute for Food and Drug Control; Sanleng acid, 9,12,13-trihydroxy-10-octadecenoic acid, and azelaic acid were obtained from Chengdu Must Biological Technology Co., Chengdu, China (purities > 98%); Dihydroactinidiolide, N-cis-feruloyl-3-methoxytyramine, N-trans-feruloyltyramine, dehydroecdysone, and stachysterone D were obtained from Sichuan Weikeqi Biological Technology Co., Chengdu, China (purities > 98%). Maleic acid and fumaric acid were obtained from Sinopharm Chemical Reagent Co., Shanghai, China (purities > 98%).

2.2. Optimization of Salt-Processing Procedure for A. bidentata

Dried roots of A. bidentata were immersed in brine for a period. After that, the roots were transferred to the wok with gentle heat and stir-fried for a while. Finally, the salt-processed A. bidentata was allowed to cool.
Three parameters, including soak time, concentration of brine, and stir-frying time, were investigated in the present study to optimize the processing conditions. The software Design Expert (Trial Version 7.0.3, Stat-Ease Inc., Minneapolis, MN, USA) was employed for experimental design, data analysis, and model building. Box–Behnken designs with three variables were used to determine the response pattern and then to establish a model. Three variables with three levels of each variable were used for the optimization of magnetic solid-phase extraction: soak time (X1), concentration of brine (X2), and stir-frying time (X3). The 2020 edition of Chinese Pharmacopeia takes ecdysterone as a quality indicator of Achyranthes bidentata. In the optimization of processing conditions, the dependent variable (Y) was the concentration of ecdysterone.

2.3. HPLC–Q-TOF-MS Analysis

The conditions for HPLC chromatography were as follows: The chromatographic column was Agilent Kromasil C18 (4.6 mm × 250 mm, 5.0 μm). The injection volume was set to 20 μL. The mobile phase consisted of acetonitrile (A) and 0.1% formic acid water (B). The gradient elution program was as below: 0 min–3 min, 16–20% A; 3 min–10 min, 20–23% A; 10 min–20 min, 23–26% A; 20 min–35 min, 26–40% A; 35 min–45 min, 40–50% A; 45 min–50 min, 50–60% A; 50 min–51 min, 60% to 15% A; 51 min–60 min, 15% A. The flow rate was set to 1 mL·min−1. The column temperature was adjusted to 40 °C. The detection wavelength was 250 nm.
The samples were analyzed with Waters Synapt G2 Q-TOF (Milford, MA, USA) mass spectrometry, which was equipped with an electron spray ionization (ESI) source. The internal calibration for mass accuracy is sodium formate. The first step is an initial correction with sodium formate. After passing the test, the standard curve will be made. After passing the test, the real-time internal standard correction will be made. The MS conditions were as follows: the mass acquisition was performed under negative ionization mode; the scanning range was 100 Da to 1000 Da; the scanning time was 0.2 s; the capillary voltage was 3000 V; the cone voltage was 30 V; the ion source temperature was 120 °C; the desolvent-free flow rate was 800 L·h−1; and the desolvation temperature was 350 °C. The mass data were analyzed using Masslynxtv 4.2 software.

2.4. COX-2 Inhibitory Assay

The inhibitory assay of COX-2 was measured according to the method previously described with slight modifications [18]. A total of 75 μL aliquot of COX-2 buffer was added to a 96-well plate, and then 5 μL of COX-2 cofactor solution, 5 μL of COX-2 solution, and 5 μL of test solution of A. bidentata sample or single compound were added subsequently. The 96-well plate was incubated at 37 °C for 10 min. Then, a 5 μL aliquot of the COX-2 fluorescence probe was added. After that, a 5 μL aliquot of COX-2 substrate solution was added and mixed at 37 °C for 5 min constantly. The 96-well plate was put into the microplate reader. The excitation wavelength was set to 560 nm, and the emission wavelength was set to 590 nm. Celecoxib was selected as the positive control. A total of 5.0 mL of aqueous extract of raw and salt-processed A. bidentata was added to 5.0 mL phosphate-balanced saline (pH = 7.4) and thoroughly mixed. The mixture was centrifuged, and the supernatant was sent for a COX-2 inhibitory assay. A gradient concentration of standard substance solutions including sanleng acid, stachysterone D, dihydroactinidiolide, N-cis-feruloyl-3-methoxytyramine, N-trans-feruloyltyramine, 9,12,13-trihydroxy-10-octadecenoic acid, azelaic acid, and dehydroecdysone were prepared with phosphate-balanced saline (pH = 7.4). The inhibition rate of the sample solutions was calculated.

2.5. Gray Correlation Analysis

The peak area of each compound in nine batches of raw and salt-processed A. bidentata and the COX-2 inhibition rate were input into the gray modeling software (Version 7) to conduct the correlation analysis. The correlation coefficient r between each compound and COX-2 inhibitory activity was obtained. The correlation coefficient r > 0.85 can be considered a very strong positive correlation [19].

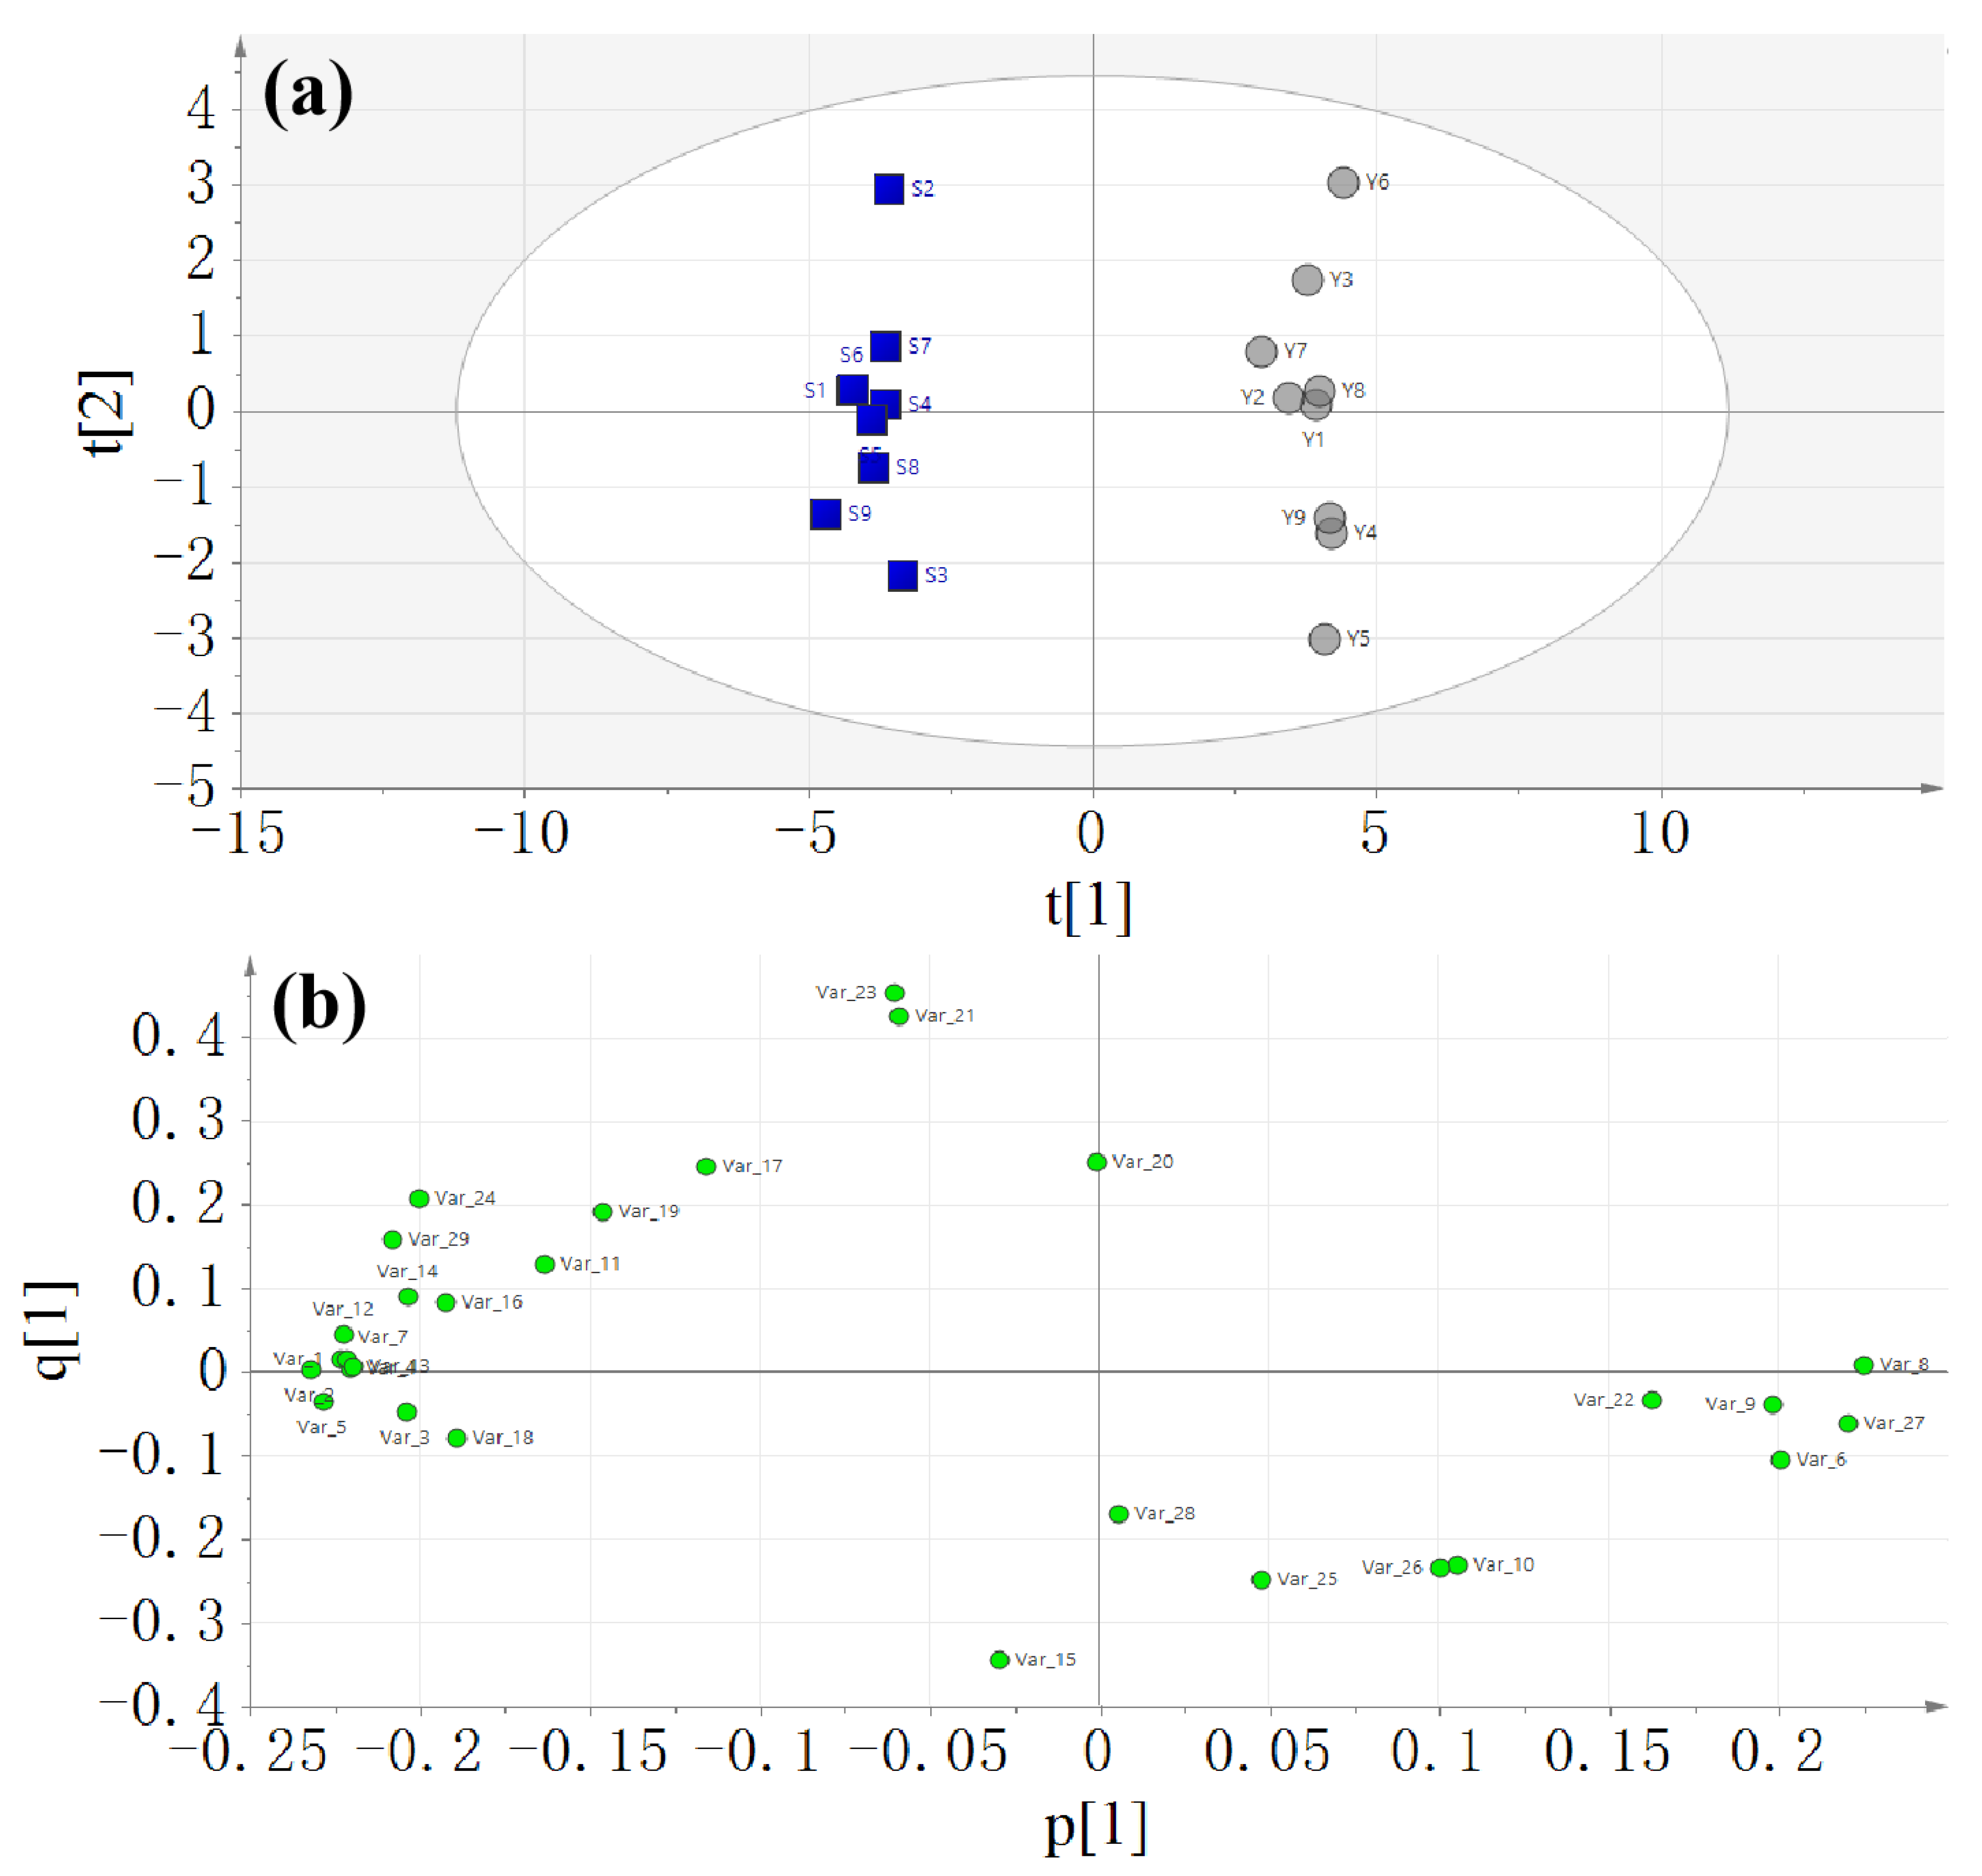
2.6. Chemometric Analysis

The peak area of each compound in the nine batches of raw and salt-processed A. bidentata was subjected to the software SIMCA-P (version 13) for pattern recognition. An unsupervised pattern recognition method, i.e., principal component analysis, was first used for modeling. After that, a supervised method, i.e., orthogonal partial least squares discriminant analysis, was used to identify the differential compounds between raw and salt-processed A. bidentata. Variable importance plots of PLS-DA models were used to find significantly altered compounds (VIP value ≥ 1.0) [20].

3. Results and Discussion

3.1. Optimization of the Salt-Processing Procedure for A. bidentata

The Box–Behnken response surface method is a multifactor nonlinear experimental optimization method. This method is continuous over a range of experimental conditions and can be analyzed for any of these test-point conditions. Therefore, the Box–Behnken response surface method was chosen to optimize the salt-processing procedure [21]. The experimental framework for the Box–Behnken design (BBD) of salt-processing parameters, encoded numerically, included 17 randomized permutations. The optimization of the salt-processing protocol was gauged by the concentration of ecdysterone as the dependent variable. The specific experimental configurations and their outcomes are enumerated in Table 1.
An Analysis of Variance (ANOVA) was utilized to evaluate the statistical significance and adequacy of the model, with findings delineated in Table 2. Significance testing of each factor was conducted using F-tests and p-values. The model’s F-value of 3.89 suggests statistical significance. Factors with p-values below the 0.05 threshold were considered significant. The ANOVA results indicated that the linear term for stir-frying time, as well as the quadratic terms for brine concentration and stir-frying time, had a significant impact on the concentration of ecdysterone.
As is shown in Table 2, the value of the determination coefficient R2 of 0.8334 indicated a good agreement between the observed and predicted values by the model. Response surface plots were employed for the visualization of the effect of two factors on the response. The interacting effect of soak time and concentration of brine is displayed in Figure 1A. A higher concentration of ecdysterone should be expected in the middle of the soak time, ranging from 10 to 50 min. This is because the brine regulates the osmotic pressure of the plant cells, which affects the texture of the hyssop after cooking. The interaction of stir-frying time with soak time is demonstrated in Figure 1B. The investigated system seems to perform better at the middle value of stir-frying time, ranging from 3 min to 7 min. High temperatures may destroy the chemical constituents. The effect of stir-frying time in relation to the concentration of brine is shown in Figure 1C. With the increase in brine concentration from 1% to 2.6%, the concentration of ecdysterone remains unchanged. The selected values of salt-processing conditions are presented in Table 3.
The real and predicted mean concentrations of ecdysterone under repeatability conditions are shown in Table 3. The experimental values of the concentration of ecdysterone were calculated at 491.79 μg/mL. No significant difference (p < 0.05) was observed between the theoretical and experimental responses. The optimal conditions are as follows: soak time: 29 min; concentration of brine: 1.8%; stir-frying time: 4.4 min.

3.2. Characterization of Chemical Constituents of Raw and Salt-Processed A. bidentata

The HPLC–Q-TOF-MS method was employed to analyze the chemical compounds of raw and salt-processed materials under negative ion mode, and the total ion chromatograms (TIC) are shown in Figure 2. Twenty-nine compounds were identified by comparing them with standard compounds and related works of literature. The identification of chemical compounds and the variation ratio of the compounds in Achyranthes bidentata after and before salt processing are displayed in Table 4. Of note, the peak area ratios of compounds 2, 4, 7, 12, 13, and 22 were all above 10 after salt processing. Their structures are shown in Figure S1.
Compounds 1, 2, and 3 showed the same [M−H]-ion at m/z 115, which corresponded to the formula of C4H4O4. In comparison with standard compounds, compounds 1 and 3 were ambiguously identified as maleic acid and fumaric acid. Compound 4 at the retention time of 4.47 min displayed [M−H]-ion at m/z 204. Fragment ion at m/z 186 in the MS2 spectrum was produced by losing one molecule of water. In comparison with the reference [22], compound 4 was unambiguously deduced as indolyllactic acid. Compound 5 showed the [M−H]-ion at m/z 235 and produced an ion at m/z 220 with the loss of the methyl group. By comparing with a related reference [23], compound 5 was deduced as methylflavone. Compound 6 at the retention time of 6.07 min showed [M + HCOO]-ion at m/z 541. Fragment ions at m/z 495 were produced by losing one molecule of HCOOH in the MS2 spectrum. Compound 6 was deduced as polypodine B by comparing it with the fragmentation pathway in the literature [24]. The precursor ion of compound 7 at m/z 210 produced a fragment ion at m/z 177, which was attributed to the loss of both the H2O and CH3 groups. In comparison with the reference [25], compound 7 was assigned as methoxytyrosine. With the retention times of 8.43 min, 9.18 min, and 9.53 min, compounds 8, 9, and 10 displayed the same [M + HCOO]-ion at m/z 525, as well as the characteristic neutral loss of 46 Da yielding the product ion at m/z 479, which was ascribed to the loss of the HCOOH group. Compared with the standard substances, compounds 8, 9, and 10 were unambiguously deduced as ecdysterone, 25R-inokosterone, and 25S-inokosterone, respectively [33]. In the same way, compounds 11, 12, 14, and 22 shared the same [M + HCOO]-ion at m/z 507. The fragmentation of compounds 11, 12, 14, and 22 produced an ion at m/z 461 with a neutral loss of HCOOH in the MS2 spectrum. Compared with the reference [26], compounds 11, 12, 14, and 22 were tentatively deduced as dehydroecdysone, deoxykaladasterone, dacryhainansterone, and stachysterone D, respectively. The molecular formula of compound 13 is 16 Da more than that of compound 12, whereas the retention time of compound 13 is a little later than that of compound 12. Compared with the literature, compound 13 was plausibly assigned as kaladasterone [27]. Compound 15 showed the [M−H]-ion at m/z 187, which corresponded to the formula of C9H16O4. Compound 15 was deduced to be azelaic acid by comparing it with the mass information in the literature [34]. Compound 16 showed the parent ion at m/z 547 and the daughter ion at m/z 255. Compared with the standard substance, compound 16 was unambiguously deduced as liquiritin apioside [35]. Compounds 17 and 19 shared the same [M−H]- ion at m/z 342 and yielded fragment ions at m/z 327, m/z 190, m/z 178, m/z 148, and m/z 135. The retention time of compound 19 was a little later than that of compound 17. Compared with the standard substances, compounds 17 and 19 were unambiguously deduced as N-cis-feruloyl-3-methoxytyramine and feruloylmethoxytyramine [28]. Compound 18 showed the [M−H]- ion at m/z 312 and produced fragment ions at m/z 190, m/z 178, m/z 148, and m/z 135, which was consistent with the fragmentation pathway of N-trans-feruloyltyramine [36]. Compound 21 showed [M−H]- ion at m/z 225 with a formula of C11H16O2. Compared with the literature [37], compound 21 was tentatively deduced as dihydroactinidiolide. Moreover, compounds 23 and 24 both shared the same [M−H]- ions at m/z 327, which corresponded to a formula of C18H32O5. Compared with the references, compounds 23 and 24 were tentatively assigned as corchorifatty acid F [29] and 9,12,13-trihydroxy-10,15-octadecadienoic acid [30], respectively. Compounds 25, 26, 27, and 28 were tentatively deduced as 9, 12, 13-trihydroxy-10-octadecenoic acid, 9,10,13-triHOME [31], pinellic acid [32], and sanleng acid [38], respectively.

3.3. Chemometric Analysis

Principal component analysis was first employed for the analysis of the data of the peak areas of 29 common peaks of nine batches of raw (S1, S2, S3, S4, S5, S6, S7, S8, S9) and salt-processed A. bidentata (Y1, Y2, Y3, Y4, Y5, Y6, Y7, Y8, Y9). The score and loading plots of the PCA model are displayed in Figure 3.
The samples of raw and salt-processed A. bidentata were well separated. Then, the supervised orthogonal partial least squares discriminant analysis method was used. The score and loading plots of the OPLS-DA model are shown in Figure 4. Q2 of the OPLS-DA model is 97.6%, which indicates good prediction capability.
The score plot showed that the batches of raw A. bidentata were distinctly separated from the salt-processed batches. The VIP plot is sorted from high to low and shows confidence intervals for the VIP values, normally at the 95% level. VIP values larger than 1 indicate “important” X-variables, and values lower than 0.5 indicate “unimportant” X-variables. The importance projection of variables (VIP > 1) was used as the criteria to screen out the compounds that caused the difference. As depicted in Figure 5, methylflavone, indolyllactic acid, maleic acid, methoxytyrosine, ecdysterone, 5-deoxy kaladasterone, pinellic acid, kaladasterone, fumaric acid, dacryhainansterone, polypodine B, 9, 12, 13-trihydroxy-10, 15-octadecadienoic acid, 25R-inokosterone, liquiritin apioside, and N-trans-feruloyltyramine were identified as compounds with VIP values greater than 1. The VIP (Variable Importance for the Projection) plot summarizes the importance of the variables both to explain X and to correlate to Y. These compounds were considered important X-variables.

3.4. Gray Correlation Analysis

The COX-2 inhibitory efficacy of nine batches of both raw and salt-processed A. bidentata samples was evaluated, with the findings presented in Table 5. Inhibition rates for raw A. bidentata spanned 58.6% to 73.5%, while those for salt-processed samples ranged from 79.5% to 88%. This implies that A. bidentata is strongly associated with COX-2 inhibition and has stronger osteoarthritis therapeutic activity. Correlation coefficients quantifying the relationship between individual compounds and COX-2 inhibition rates are detailed in Table 6. Eight compounds, including sanleng acid, stachysterone D, dihydroactinidiolide, N-cis-feruloyl-3-methoxytyramine, N-trans-feruloyltyramine, 9,12,13-trihydroxy-10-octadecenoic acid, azelaic acid, and dehydroecdysone, demonstrated a strong positive correlation with COX-2 inhibition. The data indicate a strong correlation between the components and the salt-processed A. bidentata in treating osteoarthritis. It is suggested that salt baking significantly contributes to the biological activity of A. bidentata. This finding also suggests that the therapeutic effects of salt-processed A. bidentata on osteoarthritis may be due to the combined action of multiple compounds.

3.5. COX-2 Inhibitory Assay

The COX-2 inhibitory effects of sanleng acid, stachysterone D, dihydroactinidiolide, N-cis-feruloyl-3-methoxytyramine, N-trans-feruloyltyramine, 9,12,13-trihydroxy-10-octadecenoic acid, azelaic acid, and dehydroecdysone were evaluated. These compounds are the aforementioned substances that have a strong positive correlation with the rate of COX-2 inhibition. As shown in Figure 6, the positive control celecoxib showed an IC50 (half maximal inhibitory concentration) value of 25.64 nM, which is in agreement with the literature [39]. Sanleng acid, 9,12,13-trihydroxy-10-octadecenoic acid, and azelaic acid exhibited COX-2 inhibitory activity with IC50 values of 40.74 μM, 93.28 μM, and 86.36 μM, respectively. Stachysterone D and dehydroecdysone showed similar COX-2 inhibitory effects with IC50 values of 63.57 μM and 63.92 μM, respectively. Dihydroactinidiolide had an IC50 value of 70.66 μM. N-cis-feruloyl-3-methoxytyramine and N-trans-feruloyltyramine displayed IC50 values of 120.7 and 121.9 μM, respectively. However, the correlation strength between these compounds and the rate of COX-2 inhibition is not directly related to the corresponding compounds’ IC50. Of note, only the COX-2 inhibitory effect of N-trans-feruloyltyramine was reported in the literature [40], while the COX-2 inhibitory effect of seven other compounds, including sanleng acid, stachysterone D, dihydroactinidiolide, N-cis-feruloyl-3-methoxytyramine, 9,12,13-trihydroxy-10-octadecenoic acid, azelaic acid, and dehydroecdysone, was reported for the first time. The above eight compounds can be used as quality markers to focus on during the quality control of salt-processed A. bidentata for the treatment of osteoarthritis. Future studies will further consider the specific mechanisms of these compounds that are strongly associated with anti-COX-2 inhibition in osteoarthritis therapy.

4. Conclusions

A QbD-guided approach was successfully used to optimize the salt-processing parameters of A. bidentata. HPLC–Q-TOF-MS analysis combined with orthogonal partial least squares discriminant analysis facilitated the identification of the differential markers between raw and salt-processed A. bidentate. Notably, the COX-2 inhibitory effects of seven compounds were identified for the first time, which enhanced our understanding of the anti-inflammatory effects of salt-processed A. bidentate. In the future, these compounds can be considered critical product attributes of salt-processed A. bidentate.

Supplementary Materials

The following supporting information can be downloaded at: https://www.mdpi.com/article/10.3390/pr12030434/s1. Figure S1. Chemical structures of the identified compounds.

Author Contributions

Conceptualization, Y.T. and G.S.; methodology, J.Z. and L.S.; software, J.Z. and L.S.; writing—original draft preparation, J.Z. and L.S.; writing—review and editing, Y.T. and G.S.; supervision, Y.T. and G.S.; and funding acquisition, Y.T. and G.S. All authors have read and agreed to the published version of the manuscript.

Funding

This research was funded by the Hangzhou Municipal Bureau of Science and Technology, grant number 20220919Y164, and the Zhejiang Provincial Natural Science Foundation, grant number LY21H280008.

Data Availability Statement

Data are contained within the article.

Acknowledgments

The authors would like to thank the anonymous reviewers for their invaluable suggestions that helped improve the manuscript.

Conflicts of Interest

The authors declare no conflicts of interest.

References

  1. Huang, P.; Tan, S.; Zhang, Y.X.; Li, J.S.; Chai, C.; Li, J.J.; Cai, B.C. The effects of wine-processing on ascending and descending: The distribution of flavonoids in rat tissues after oral administration of crude and wine-processed Radix scutellariae. J. Ethnopharmacol. 2014, 155, 649–664. [Google Scholar] [CrossRef]
  2. Tao, Y.; Du, Y.; Li, W.; Cai, B.; Di, L.; Shi, L.; Hu, L. Integrating UHPLC-MS/MS quantification and DAS analysis to investigate the effects of wine-processing on the tissue distributions of bioactive constituents of herbs in rats: Exemplarily shown for Dipsacus asper. J. Chromatogr. B 2017, 1055–1056, 135–143. [Google Scholar] [CrossRef]
  3. Zhu, T.; Liu, X.; Wang, X.; Cao, G.; Qin, K.; Pei, K.; Zhu, H.; Cai, H.; Niu, M.; Cai, B. Profiling and analysis of multiple compounds in rhubarb decoction after processing by wine steaming using UHPLC-Q-TOF-MS coupled with multiple statistical strategies. J. Sep. Sci. 2016, 39, 3081–3090. [Google Scholar] [CrossRef] [PubMed]
  4. Li, W.; Ren, C.; Fei, C.; Wang, Y.; Xue, Q.; Li, L.; Yin, F.; Li, W. Analysis of the chemical composition changes of Gardeniae Fructus before and after processing based on ultra-high-performance liquid chromatography quadrupole time-of-flight mass spectrometry. J. Sep. Sci. 2021, 44, 981–991. [Google Scholar] [CrossRef] [PubMed]
  5. Qin, K.; Wang, B.; Li, W.; Cai, H.; Chen, D.; Liu, X.; Yin, F.; Cai, B. Quality assessment of raw and processed Arctium lappa L. through multicomponent quantification, chromatographic fingerprint, and related chemometric analysis. J. Sep. Sci. 2015, 38, 1491–1498. [Google Scholar] [CrossRef] [PubMed]
  6. He, X.; Wang, X.; Fang, J.; Chang, Y.; Ning, N.; Guo, H.; Huang, L.; Huang, X. The genus Achyranthes: A review on traditional uses, phytochemistry, and pharmacological activities. J. Ethnopharmacol. 2017, 203, 260–278. [Google Scholar] [CrossRef] [PubMed]
  7. Li, Z.; Ma, D.; Peng, L.; Li, Y.; Liao, Z.; Yu, T. Compatibility of Achyranthes bidentata components in reducing inflammatory response through Arachidonic acid pathway for treatment of Osteoarthritis. Bioengineered 2022, 13, 1746–1757. [Google Scholar] [CrossRef] [PubMed]
  8. Gawande, D.Y.; Goel, R.K. Pharmacological validation of in-silico guided novel nootropic potential of Achyranthes aspera L. J. Ethnopharmacol. 2015, 175, 324–334. [Google Scholar] [CrossRef] [PubMed]
  9. Ishtiaq, A.; Muhammad, I.; Ullah, B.; Muhammad, N.; Muhammad, Z.; Ali, N. Pharmacognostic and hypoglycemic studies of Achyranthus aspera L. J. Pharmacognosy Phytother. 2013, 5, 127–131. [Google Scholar] [CrossRef]
  10. Pan, R.; Hu, W.; Pan, J.; Huang, L.; Luan, C.; Shen, H. Achyranthes bidentata polypeptides prevent apoptosis by inhibiting the glutamate current in cultured hippocampal neurons. Neural Regen. Res. 2020, 15, 1086–1093. [Google Scholar]
  11. Nazir, A.; Saleem, M.A.; Nazir, F.; Hussain, T.; Faizan, M.Q.; Usman, M. Comparison of UV Protection Properties of Cotton Fabrics Treated with Aqueous and Methanolic Extracts of Achyranthes aspera and Alhagi maurorum Plants. Photochem. Photobiol. 2016, 92, 343–347. [Google Scholar] [CrossRef]
  12. Gawande, D.Y.; Druzhilovsky, D.; Gupta, R.C.; Poroikov, V.; Goel, R.K. Anticonvulsant activity and acute neurotoxic profile of Achyranthes aspera Linn. J. Ethnopharmacol. 2017, 202, 97–102. [Google Scholar] [CrossRef]
  13. Zhang, S.; Zhang, Q.; Zhang, D.; Wang, C.; Yan, C. Anti-osteoporosis activity of a novel Achyranthes bidentata polysaccharide via stimulating bone formation. Carbohyd. Polym. 2018, 184, 288–298. [Google Scholar] [CrossRef]
  14. Lee, T.G.; Hyun, S.W.; Jo, K.; Park, B.; Lee, I.S.; Song, S.J.; Kim, C.S. Achyranthis radix Extract Improves Urban Particulate Matter-Induced Dry Eye Disease. Int. J. Environ. Res. Public Health 2019, 16, 3229. [Google Scholar] [CrossRef]
  15. Wang, S.; Zeng, M.; Li, B.; Kan, Y.; Zhang, B.; Zheng, X.; Feng, W. Raw and salt-processed Achyranthes bidentata attenuate LPS-induced acute kidney injury by inhibiting ROS and apoptosis via an estrogen-like pathway. Biomed. Pharmacother. 2020, 129, 110403. [Google Scholar] [CrossRef]
  16. Nunavath, R.S.; Singh, M.T.; Jain, A.; Chakma, M.; Arivuselvam, R.; Azeeze, M. Quality by Design in Pharmaceuticals: A Review of its Impact on Regulatory Compliance and Product Quality. Drug Res. 2024, 74, 18–23. [Google Scholar]
  17. Abramson, S.B. The role of COX-2 produced by cartilage in arthritis. Osteoarthr. Cartil. 1999, 7, 380–381. [Google Scholar] [CrossRef] [PubMed]
  18. El-Miligy MM, M.; Al-Kubeisi, A.K.; El-Zemity, S.R.; Nassra, R.A.; Abu-Serie, M.M.; Hazzaa, A.A. Discovery of small molecule acting as multitarget inhibitor of colorectal cancer by simultaneous blocking of the key COX-2, 5-LOX and PIM-1 kinase enzymes. Bioorg. Chem. 2021, 115, 105171. [Google Scholar] [CrossRef] [PubMed]
  19. Lv, Y.; Wu, H.; Hong, Z.; Wei, F.; Zhao, M.; Tang, R.; Li, Y.; Ge, W.; Li, C.; Du, W. Exploring active ingredients of anti-osteoarthritis in raw and wine-processed Dipsaci Radix based on spectrum-effect relationship combined with chemometrics. J. Ethnopharmacol. 2023, 309, 116281. [Google Scholar] [CrossRef] [PubMed]
  20. Li, S.; Sun, Y.; Gao, Y.; Yu, X.; Zhao, C.; Song, X.; Han, F.; Yu, J. Spectrum-effect relationship analysis based on HPLC-FT-ICR-MS and multivariate statistical analysis to reveal the pharmacodynamic substances of Ling-Gui-Zhu-Gan decoction on Alzheimer’s disease. J. Pharm. Biomed. Anal. 2024, 237, 115765. [Google Scholar] [CrossRef] [PubMed]
  21. Alam, P.; Siddiqui, N.A.; Rehman, M.T.; Hussain, A.; Akhtar, A.; Mir, S.R.; Alajmi, M.F. Box–Behnken Design (BBD)-Based Optimization of Microwave-Assisted Extraction of Parthenolide from the Stems of Tarconanthus camphoratus and Cytotoxic Analysis. Molecules 2021, 26, 1876. [Google Scholar] [CrossRef] [PubMed]
  22. Wen, S.; Tu, X.; Zang, Q.; Zhu, Y.; Li, L.; Zhang, R.; Abliz, Z. Liquid chromatography-mass spectrometry-based metabolomics and fluxomics reveals the metabolic alterations in glioma U87MG multicellular tumor spheroids versus two-dimensional cell cultures. Rapid Commun. Mass Spectrom. 2024, 38, e9670. [Google Scholar] [CrossRef]
  23. Sun, J.; Song, Y.; Sun, H.; Liu, W.; Zhang, Y.; Zheng, J.; Zhang, Q.; Zhao, Y.; Xiao, W.; Tu, P.; et al. Characterization and quantitative analysis of phenolic derivatives in Longxuetongluo Capsule by HPLC-DAD-IT-TOF-MS. J. Pharm. Biomed. Anal. 2017, 145, 462–472. [Google Scholar] [CrossRef]
  24. Yao, C.; Wang, Y.; Qu, H.; Li, J.; Hou, J.; Chen, X.; Zhang, J.; Wei, W.; Bi, Q.; Guo, D.A. Comparative identification of phytoecdysteroids in Achyranthes bidentata Blume and its three analogous species and application in differentiation between processing products from different species. J. Pharm. Biomed. Anal. 2023, 227, 115187. [Google Scholar] [CrossRef]
  25. Zhang, L.; Yang, J.Q.; Luo, Y.; Shang, J.C.; Jiang, X.H. Simultaneous determination of eleven compounds related to metabolism of bioamines in rat cortex and hippocampus by HPLC-ECD with boron-doped diamond working electrode. J. Pharm. Biomed. Anal. 2016, 118, 41–51. [Google Scholar] [CrossRef]
  26. Yadav, A.; Yadav, S.; Dabur, R. Higher plants exert interspecific effects on the phytoecdysteroids contents in Tinospora cordifolia. Chem. Bio. Lett. 2022, 9, 312. [Google Scholar]
  27. Bourne, P.C.; Whiting, P.; Dhadialla, T.S.; Hormann, R.E.; Girault, J.P.; Harmatha, J.; Lafont, R.; Dinan, L. Ecdysteroid 7,9(11)-dien-6-ones as potential photoaffinity labels for ecdysteroid binding proteins. J. Insect Sci. 2002, 2, 11. [Google Scholar] [CrossRef] [PubMed]
  28. Yang, L.; Jiang, H.; Wang, Q.H.; Yang, B.Y.; Kuang, H.X. A new feruloyl tyramine glycoside from the roots of Achyranthes bidentata. Chin. J. Nat. Med. 2012, 10, 16–19. [Google Scholar] [CrossRef]
  29. Souza, L.; Oliveira, J.; Fernandes AD, S.; Macedo, A.F.; Araujo-Lima, C.F.; Felzenszwalb, I. UHPLC-MS metabolomic profile and in silico pharmacokinetic approach of Kalanchoe daigremontiana Raym.-Hamet & H. Perrier aqueous extracts. J. Pharm. Biomed. Anal. 2024, 238, 115827. [Google Scholar]
  30. Hamberg, M.; Olsson, U. Efficient and specific conversion of 9-lipoxygenase hydroperoxides in the beetroot. Formation of pinellic acid. Lipids 2011, 46, 873–878. [Google Scholar] [CrossRef]
  31. Fuchs, D.; Tang, X.; Johnsson, A.K.; Dahlén, S.E.; Hamberg, M.; Wheelock, C.E. Eosinophils synthesize trihydroxyoctadecenoic acids (TriHOMEs) via a 15-lipoxygenase dependent process. Biochim. Et Biophys. Acta (BBA)-Mol. Cell Biol. Lipids 2020, 1865, 158611. [Google Scholar] [CrossRef]
  32. Khan, R.S.; Senthi, M.; Rao, P.C.; Basha, A.; Alvala, M.; Tummuri, D.; Masubuti, H.; Fujimoto, Y.; Begum, A.S. Cytotoxic constituents of Abutilon indicum leaves against U87MG human glioblastoma cells. Nat. Prod. Res. 2015, 29, 1069–1073. [Google Scholar] [CrossRef]
  33. Mei, Y.; Zhang, X.; Hu, Y.; Tong, X.; Liu, W.; Chen, X.; Cao, L.; Wang, Z.; Xiao, W. Screening and characterization of xenobiotics in rat bio-samples after oral administration of Shen-Wu-Yi-Shen tablet using UPLC-Q-TOF-MS/MS combined with a targeted and non-targeted strategy. J. Pharm. Biomed. Anal. 2023, 227, 115286. [Google Scholar] [CrossRef]
  34. Zhou, W.; Wang, P.G. Simultaneous determination of multi-class active pharmaceutical ingredients by UHPLC-HRMS. J. Pharm. Biomed. Anal. 2021, 202, 114160. [Google Scholar] [CrossRef]
  35. Aly, S.H.; Elissawy, A.M.; Mahmoud, A.M.A.; El-Tokhy, F.S.; Mageed, S.S.A.; Almahli, H.; Al-Rashood, S.T.; Binjubair, F.A.; Hassab, M.A.E.; Eldehna, W.M.; et al. Synergistic Effect of Sophora japonica and Glycyrrhiza glabra Flavonoid-Rich Fractions on Wound Healing: In Vivo and Molecular Docking Studies. Molecules 2023, 28, 2294. [Google Scholar] [CrossRef] [PubMed]
  36. Pan, L.; Li, L.; Xu, L.; Zhang, J.; Li, J.; Gao, M.; Yu, J.; Jin, L.; Lei, D. UHPLC-QTOF-MS/MS based characterization of anti-tumor constituents in Ceratocarpus arenarius L. and identification of EGFR-TK inhibitors by virtual screening. Nat. Prod. Res. 2022, 36, 6111–6115. [Google Scholar] [CrossRef] [PubMed]
  37. Chang, Q.; Lan, L.; Gong, D.; Guo, Y.; Sun, G. Evaluation of quality consistency of herbal preparations using five-wavelength fusion HPLC fingerprint combined with ATR-FT-IR spectral quantized fingerprint: Belamcandae rhizoma antiviral injection as an example. J. Pharm. Biomed. Anal. 2022, 214, 114733. [Google Scholar] [CrossRef] [PubMed]
  38. Yi-meng, Y.; Ke-xin, Y.; Yu-sheng, L.; Ge, C.; Han-wen, T.; Zhongying, L.; Zhiqiang, L.; Fengrui, S.; Zifeng, P. Characterization of Components in Huangying Kechuan Syrup by Ultra-high Liquid Chromatography Tandem Quadrupole-time-of-flight Mass Spectrometry. Chin. J. App. Chem. 2021, 38, 276. [Google Scholar]
  39. Fadaly, W.A.A.; Nemr, M.T.M.; Zidan, T.H.; Mohamed, F.E.A.; Abdelhakeem, M.M.; Abu Jayab, N.N.; Omar, H.A.; Abdellatif, K.R.A. New 1,2,3-triazole/1,2,4-triazole hybrids linked to oxime moiety as nitric oxide donor selective COX-2, aromatase, B-RAF(V600E) and EGFR inhibitors celecoxib analogs: Design, synthesis, anti-inflammatory/anti-proliferative activities, apoptosis and molecular modeling study. J. Enzym. Inhib. Med. Chem. 2023, 38, 2290461. [Google Scholar]
  40. Jiang, Y.; Yu, L.; Wang, M.H. N-trans-feruloyltyramine inhibits LPS-induced NO and PGE2 production in RAW 264.7 macrophages: Involvement of AP-1 and MAP kinase signalling pathways. Chem. Biol. Interact. 2015, 235, 56–62. [Google Scholar] [CrossRef] [PubMed]
Figure 1. Response surface plots of the three factors. (A) interaction between concentration of brine and soak time; (B) interaction between stir-frying time and soak time; (C) interaction between stir-frying time and concentration of brine.
Processes 12 00434 g001
Figure 2. HPLC–Q-TOF-MS total ion chromatograms of raw and salt-processed Achyranthes bidentata. (A) raw Achyranthes bidentata; (B) salt-processed Achyranthes bidentata.
Processes 12 00434 g002
Figure 3. Score plot (a) and loading plot (b) of the principal component analysis.
Processes 12 00434 g003
Figure 4. Score plot (a) and loading plot (b) of the OPLS-DA model.
Processes 12 00434 g004
Figure 5. VIP plot of the OPLS-DA model. red indicated VIP value > 1,green indicated VIP value < 1.
Processes 12 00434 g005
Figure 6. IC50 curves of celecoxib and other compounds. (a) celecoxib, (b) sanleng acid, (c) stachysterone, (d) dihydroactinidiolide, (e) N-cis-feruloyl-3-methoxytyramine, (f) N-trans-feruloyltyramine, (g) 9, 12, 13-trihydroxy-10-octadecenoic acid, (h) azelaic acid, and (i) dehydroecdysone.
Processes 12 00434 g006
Table 1. Box–Behnken design for optimization of the salt-processing procedure of A. bidentata.
RunIndependent VariableConc. of Ecdysterone (μg/mL)
X1
(Soak Time, min)
X2
(Concentration of Brine, %)
X3
(Stir-Frying Time, min)
13025485.571
23017305.3
31027395.933
43037395.356
55027391.509
65035389.812
73025488.776
81035421.638
93025484.89
101023410.132
113025486.46
123013446.888
131015436.884
145023457.694
153025480.762
165015438.679
173033463.877
Table 2. Estimated regression coefficients for the quadratic polynomial model.
FactorRegression CoefficientsStandard ErrorDFF ValueProb > F
B0485.2913.6013.890.0435
Linear
B11.6410.7510.02320.8831
B25.3710.7510.24930.6329
B3−36.3110.75111.410.0118
Interaction
β12−8.4115.2010.30580.5975
β13−13.015.2010.73110.4208
β2318.2715.2011.440.2685
Quadratic
β11−26.2914.8113.150.1193
β22−37.2514.8116.320.0401
β33−45.1914.8119.300.0186
Lack of fit 3250.38<0.0001
Pure error 4
R20.8334 Adjusted R20.6192
Table 3. Predicted and experimental response values under optimal conditions.
FactorValue
Soak time (min)29
Concentration of brine (%)1.8
Stir-frying time (min)4.4
Predicted values (μg/mL)490.1
Experimental values (μg/mL)491.79 ± 0.83
Table 4. Identification of chemical compounds in Achyranthes bidentata.
No.tR (min)Detected Mass (m/z)MS2Molecular FormulaMass Error
(ppm)
Compound (Name)IdentificationPeak
Area Ratio
12.50115.0036100.0234, 99.0085, 99.9332C4H4O44.3Maleic acidstandards1.91
22.81115.0032111.1115, 104.7421, 87.0104, 77.8366, 73.9177C4H4O40.9Unknown26.59
33.34115.0037111.0400, 108.0446, 105.0223, 97.0370, 89.0271, 87.0083, 59.0153C4H4O45.2Fumaric acidstandards2.04
44.47204.0664186.0639, 159.0353, 131.0420, 108.0486, 69.8676C11H11NO31.5Indolyllactic acid[22]12.55
55.1235.0757220.0741, 187.0871, 141.6590, 122.0250, 94.0303, 93.0204, 77.4244C16H12O2−0.9Methylflavone[23]6.97
66.07541.3029495.2991, 477.2920, 299.1640, 249.1525, 129.0598, 99.0488C27H44O83.0Polypodine B[24]4.93
77.32210.0773177.0686, 154.0703, 124.0408, 122.0292, 94.0312, 93.0255, 66.0354C10H13NO43.3Methoxytyrosine[25]10.63
88.43525.3055479.3034, 319.1958, 301.1819, 210.0828, 159.1058C27H44O7−1.7Ecdysteronestandards0.80
99.18525.3040479.3073, 443.1053, 377.1133, 346.1055, 319.1931, 301.1936, 282.1422, 261.1450, 217.1015, 186.0648, 159.1079, 141.0920, 124.0425C27H44O7−4.625R-inokosteronestandards0.90
109.51525.3048479.3033, 477.2902, 159.1055C27H44O7−3.025S-inokosteronestandards0.80
1113.4507.297461.2921, 301.1889, 277.1472, 249.1255, 201.1278, 159.1051C27H42O62.4Dehydroecdysonestandards7.28
1214.7507.296461.2861, 345.1842, 309.1479, 265.1693, 229.0488, 159.1066, 115.0768, 83.0535C27H42O61.0Deoxykaladasterone[26]19.43
1315.7523.3109477.3076, 459.2956, 361.2192, 317.1931, 159.1105C27H42O7−1.5Kaladasterone[27]15.25
1416.4507.2959461.2989, 403.2529, 301.1815, 249.1308, 209.1000, 159.1058, 83.0489C27H42O60.2Dacryhainansterone[26]0.58
1517.5187.0974159.1022, 141.1016, 139.0442, 111.0111C9H16O42.1Azelaic acidstandards4.38
1618.6549.1589341.1035, 311.0556, 295.0618, 268.0379, 255.0433, 252.0448C26H30O13−4.4Liquiritin apiosidestandards1.38
1721.5342.1357327.1139, 190.0521, 178.0531, 148.0552, 135.0417, 134.0422C19H21NO54.7N-cis-feruloyl-3-methoxytyraminestandards0.26
1824.4312.1246190.0584, 178.0544, 148.0556, 135.0491C18H19NO43.2N-trans-feruloyltyraminestandards0.81
1925.4342.1343327.1171, 190.0533, 178.0529, 148.0544, 135.0460C19H21NO51.2Feruloylmethoxytyramine[28]0.91
2029.0509.2856494.1100, 489.6156, 466.2194, 421.8323, 410.1779, 387.1925, 384.8494, 358.5213, 350.2032, 342.0960, 333.4114C32H46O5−1.8Unknown2.26
2130.5225.1124214.0546, 209.0778, 196.8297, 187.0986, 171.8831, 158, 1576, 144.2472, 130.0387, 116.0739, 98.9125, 96.5702C11H16O2−1.3Dihydroactinidiolidestandards0.65
2232.1507.2973461.2921, 368.0941, 342.1358, 312.1195, 268.0684, 242.0818, 221.7878, 171.0949, 139.1091, 86.8855, 56.2580C27H42O64.9Stachysterone Dstandards10.49
2332.9327.2175229.1391, 221.1249, 211.1358, 171.1032, 85.0286C18H32O51.2Corchorifatty acid F[29]0.87
2433.4327.2186323.1074, 242.4109, 235.1030, 211.1431, 171.1025, 146.9710, 137.1052, 97.0710, 85.0290C18H32O54.69,12,13-Trihydroxy-10,15-octadecadienoic acid[30]0.93
2535.8329.2340229.1482, 211.1358, 171.1053, 139.1160C18H34O53.69,12,13-Trihydroxy-10-octadecenoic acidstandards0.51
2636.3329.2337171.1043, 139.1148, 127.1147C18H34O52.79,10,13-TriHOME[31]0.61
2739.3329.2334211.2371, 199.1361, 197.1192, 181.1294, 169.1259, 129.0907, 99.0819C18H34O51.8Pinellic acid[32]0.71
2843.2329.2336303.0145, 255.2305, 204.8009, 211.1199, 201.1148, 199.1152, 171.1017, 152.9974, 146.9705, 96.9641, 80.8853C18H34O52.4Sanleng acidstandards0.55
2953.2643.3685610.5566, 588.5043, 569.3351, 531.3790, 512.9322C36H54O107.1Unknown0.80
Table 5. COX-2 inhibitory rate for nine batches of raw and salt-processed Achyranthes bidentata.
No.Inhibitory Rate (%)No.Inhibitory Rate (%)
S168.5Y181.1
S270.4Y281.5
S373.5Y379.5
S464.7Y489.0
S565.6Y581.7
S667.5Y682.7
S770.2Y782.1
S860.2Y888.3
S958.6Y983.4
Table 6. Correlation coefficient of compounds from raw and salt-processed Achyranthes bidentata.
No.CompoundsCorrelation Coefficient r
1Maleic acid0.7450
2Unknown0.7574
3Fumaric acid0.7326
4Indolyllactic acid0.8394
5Methylflavone0.8060
6Polypodine B0.8358
7Methoxytyrosine0.7346
8Ecdysterone0.8378
925R-inokosterone0.7544
1025S-inokosterone0.8381
11Dehydroecdysone0.8506
12Deoxykaladasterone0.7291
13Kaladasterone0.7156
14Dacryhainansterone0.7267
15Azelaic acid0.8925
16Liquiritin apioside0.7818
17N-cis-feruloyl-3-methoxytyramine0.9175
18N-trans-feruloyltyramine0.9118
19Feruloylmethoxytyramine0.8186
20Unknown0.6732
21Dihydroactinidiolide0.9186
22Stachysterone D0.9291
23Corchorifatty acid F0.7514
249,12,13-Trihydroxy-10,15-octadecadienoic acid0.8251
259,12,13-Trihydroxy-10-octadecenoic acid0.9107
269,10,13-triHOME0.7601
27Pinellic acid0.6485
28Sanleng acid0.9981
29Unknown0.7320
Disclaimer/Publisher’s Note: The statements, opinions and data contained in all publications are solely those of the individual author(s) and contributor(s) and not of MDPI and/or the editor(s). MDPI and/or the editor(s) disclaim responsibility for any injury to people or property resulting from any ideas, methods, instructions or products referred to in the content.

