Article

CFD–DEM Simulation of Heat Transfer and Reaction Characteristics of Pyrolysis Process of MSW Heated by High-Temperature Flue Gas

1
Thermal & Environmental Engineering Institute, Tongji University, Shanghai 200092, China
2
Shanghai Engineering Research Center of Multi–Source Solid Wastes Co–Processing and Energy Utilization, Shanghai 200092, China
*
Author to whom correspondence should be addressed.
Processes 2024, 12(2), 390; https://doi.org/10.3390/pr12020390
Submission received: 25 December 2023 / Revised: 8 February 2024 / Accepted: 12 February 2024 / Published: 15 February 2024

Abstract

:
Pyrolysis is a promising disposal method for municipal solid waste (MSW) due to the high-value utilization of the organic components of MSW. Traditional indirect heating has low heat transfer efficiency and requires an increase in the heat exchange area. In this study, a refined numerical simulation model for the pyrolysis of four typical MSW components with high-temperature flue gas was established to study the influence of flue gas on the heat transfer and reaction characteristics of MSW. The temperature distribution and particle size change in different components were obtained, and the effects of flue gas temperature and velocity on the pyrolysis process were analyzed. It was found that the temperature difference of the four components along the bed height direction was about 1.36–1.81 K/mm, and the energy efficiency was about 55–61%. When the four components were uniformly mixed, the temperature increase rates of each component were similar during the pyrolysis process. As the flue gas temperature increased, the amount of gas consumption decreased and the energy efficiency increased. When the flue gas velocity increased, the flue gas consumption increased and the energy efficiency decreased. The research results are of great significance for the promotion and application of pyrolysis technology to MSW with high-temperature flue gas.

1. Introduction

Rapid urbanization has increased municipal solid waste (MSW) generation [1]. In China, approximately 248.69 million tons of MSW was cleared and transported, with a harmless treatment rate of 99.9% in 2021 [2], which is expected to increase to 3.4 billion tons by 2050 [2]. Pyrolysis is one of the main methods of MSW resource utilization that can convert organic matter into small-molecule combustible gas and liquid oil in an inert environment while solidifying heavy metals into char [3]. Compared with incineration, pyrolysis is a relatively uncomplicated technology requiring no complex processing plant, it is quite environmentally friendly, and the process parameters are controlled according to the desired products [4,5,6].
One of the main characteristics of MSW is its complex components, and various component proportions are related to many factors, such as local economic development level and residents’ living habits [7]. Different components of MSW have different physical parameters such as density, conductivity, and specific heat capacity, and they also have different reaction characteristics such as the pyrolysis temperature and reaction rate. Usually, the pyrolysis temperature range of biomass is lower than 673 K, and the pyrolysis products are mainly CO, CO2, and CH4 [8,9,10]. The pyrolysis temperature of plastics is relatively high; for example, PET starts pyrolysis at 633 K, while the pyrolysis rate is fast [11,12,13]. The pyrolysis temperature range of paper is between 573 and 673 K [14]. The pyrolysis temperature range of textiles is between 573 and 873 K [15].
Considering that the interactions between the components cannot be ignored, So–phonrat et al. [16] studied the effect of pyrolysis temperature on products during the co–pyrolysis of plastics and paper; Chhabra et al. [17] studied the effect of mixing ratio on the kinetic characteristics and char yield during the co-pyrolysis of biomass, plastic, and rubber; Nguyen et al. [18] studied the effect of the mixing ratio on the syngas calorific value during the co-pyrolysis of pine sawdust and polystyrene, Hassan et al. [19] studied the effect of the mixing ratio on the yield of liquid oil and the calorific value of syngas during the co-pyrolysis of biomass and high-density polyethylene; and Zheng et al. [20] found a positive synergistic effect between biomass and plastic that can inhibit catalyst coking. These studies focused on the influence of the pyrolysis temperature, mixing ratio, catalysts, and other parameters on the pyrolysis mechanism and product distribution through thermogravimetry or indirect heating, finding that the distribution of pyrolysis products varies with the mixing ratio of materials with different components. However, the effect of the mixing ratio of materials with different components on the heat transfer process is not clear.
Fixed-bed reactors are comparatively easy to operate and suitable for the pyrolysis of MSW. The popular reactors of MSW pyrolysis nowadays are fixed bed, such as a rotary kiln and moving grate [5,21]. The traditional fixed-bed pyrolysis reactor adopts an indirect heating mode, where the heat source, such as an electric furnace or flue gas, heats the wall of the reactor, and then the heat transfers from the wall to the material through conduction. The internal heat transfer of the material is also mainly determined by conduction. However, there is the problem of low heat transfer efficiency, which requires a large heating surface area. When high-temperature gas directly contacts with the material, the conductive heating resistance of the surface material and the convective resistance between the heating medium and the surface are eliminated, which significantly improves the heat transfer efficiency. The commonly used and economical high-temperature medium is flue gas, which can be sourced from existing high-temperature flue gas or the online combustion of volatile products generated by pyrolysis in practical applications. But it will dilute the calorific value of the combustible gas when mixed with the volatile products generated by pyrolysis. The temperature and the velocity of the flue gas affect the heat transfer efficiency within the system. Therefore, it is necessary to study the heat transfer and reaction characteristics of the pyrolysis process of MSW heated by high-temperature flue gas.
Because the interactions and potential reinforcements of these processes are difficult to isolate and elucidate experimentally, the development of a predictive modeling tool, for example, based on the CFD–DEM (discrete element method) methodology, is attracting increasing attention [22]. The DEM point particles follow from single-particle mass to momentum to enthalpy balances, and the model can track the particle motion of each particle. Within the scope of the CFD–DEM approach, the dispersed particles are considered as separate individual entities, the change in a particle is determined by the particle–particle interactions, and mass, momentum, and heat are exchanged between a particle and the carrier medium. Based on the DEM, Lu et al. [23] studied the effect of biomass particle size on pyrolysis product distribution in a fluidized bed and detailed the specific process of biomass pyrolysis using 32 equations. Kong et al. [24,25] simulated the biomass particle pyrolysis process and analyzed the heat and mass transfer characteristics at different temperatures. Chandrasekaran et al. [26] studied the effects of the temperature and heating rate in a fixed bed on biomass pyrolysis products.
MSW, to simplify the computational model, is usually regarded as a homogeneous material according to the proportion of each component [27]. When using a homogeneous model for prediction, different components complete pyrolysis with the same pyrolysis rate at the same temperature, leading to a significant deviation from the actual situation. It is necessary to establish a more accurate model to predict the pyrolysis process of MSW in which the differences in the physicochemical and pyrolysis characteristics of different components should be fully considered.
Multiphase flow with interphase exchanges (MFix) is an open-source multiphase flow solver and is very good at studying gas–solid multiphase flow [28]. In this study, based on MFix, a refined numerical simulation model using the CFD–DEM was built to study the heat transfer and reaction characteristics of the pyrolysis process of MSW heated by high-temperature flue gas and to predict the influence of the flue gas temperature and velocity on the caloric value of the volatile products and flue gas consumption. During the calculation process, four typical components of MSW, namely biomass, plastic, paper, and textiles, were selected as materials. Each component was treated as a uniform spherical particle, different components followed their own heating and pyrolysis rates, and the changes in the mass and volume of particles caused by material decomposition were considered. The pyrolysis rate of different materials was calculated through thermogravimetric experiments, and the distribution of the pyrolysis products was tested based on experimental data. The research results will provide support for the promotion and application of pyrolysis technology.

2. Materials and Methods

2.1. Materials and Pyrolysis Equations

The experimental samples were taken from the dock of a waste incineration plant in Shanghai with a mass of about 1 ton. After drying in a sun room, the samples were analyzed using the quartering method. With the promotion of classified collection of MSW, wet waste such as kitchen waste was separated, and the remaining dry waste mainly includes biomass, fabrics, paper, and plastics. Plastics were mainly composed of PE, PP, and PS, with mass fractions of 48%, 18%, and 16%, respectively; the remaining 18% was mainly composed of PVC, PU, PVDF and so on. After screening and natural drying, each component sample was crushed using a small laboratory crusher. The particle size after crushing was about 5–15 mm. The proximate and ultimate analyses of the four components of MSW are shown in Table 1. According to proximate analysis, biomass has the highest ash content and plastic has the highest volatile content. The calorific value of plastic is more than three times that of paper.
Figure 1 shows the results of the four components’ thermogravimetric experiments within a N2 atmosphere using TG 209 F3 Tarsus (Netzsch, Selb, Germany). The sample mass was 0.5 g, the heating rate was 200 K/min, and the temperature rose from 300 to 1173 K. Biomass decomposed mainly in the range of 480–655 K. The initial temperatures for the decomposition of paper and textile were close with the main reaction ranging from 520 to 660 K and from 520 to 755 K, respectively. The start time of the plastics decomposition was the latest, with a main reaction range of 585–790 K.
A single-step, first-order Arrhenius reaction rate was used to describe the pyrolysis process, and the particle devolatilization rate is kinetically calculated with:
d m v o l a t i l e s d t = A exp ( E R T p ) m v o l a t i l e s
The pre-exponential factor, A, and activation energy, E, of the four materials were as shown in Table 2, which were within the normal range of values [29]. In the pyrolysis process, plastic undergoes two stages. Firstly, it absorbs heat and melts into a liquid, which is then decomposed to produce volatile products. Therefore, the pyrolysis of plastic was divided into two stages.
To determine the product distribution during the pyrolysis process, a two-section experimental platform was built, as shown in Figure 2. The lower section was used to preheat the flue gas (80% N2 and 20% CO2), and the upper part was used for material preheating and pyrolysis reactions. The inner diameter of the reactor was 6 cm. The material used in each experiment was 200 g, with a preheating temperature of 473 K and a heating flue gas temperature of 1073 K. During the experiment, the material was first placed in the reactor and purged with flue gas at 300 K for approximately 15 min. Then, Heating Furnace 1 was activated to preheat the material, which could shorten the reaction time and improve the temperature. After the thermocouple at the outlet reached 473 K, Furnace 2 was started to heat the material at 1073 K, and the control valve for the flue gas was opened. Thermocouple a was used to test the temperature in the middle of the material, and Thermocouple b was used to test the flue gas temperature at the outlet of Furnace 1. The volatiles ware quenched, and the non-condensable gas was collected in a gas bag. Their chemical compositions were analyzed using GC–MS(QP2010 SE, Shimadzu, Kyoto, Japan) and GC (7820A, Agilent, Santa Clara, CA, America), respectively. The composition of the pyrolysis gas collected was determined by GC. The carrier gas was argon gas, and thermal conductivity detection was used to analyze the gas components and their relative content. GC–MS was used to analysis the tar components. The split ratio of tar samples was 1:10, and detection was carried out through split injection. The heating procedure of the column temperature box was as follows: raise from 35 to 120 °C within 4 min, then raise to 300 °C within 10 min, and keep at 300 °C for 5 min. Test with a length of 30 m and a film thickness of 0.25 μm. The RTX-5MS capillary chromatography column with an inner diameter of 0.25 mm was a GC chromatography column. The ion source temperature of the MS part was 230 °C, and the scanning width was 350–500 amu with full scanning. More detailed information can be found in Reference [30].
According to the experimental results, the chemical reaction equations of the four components are shown as (R1)–(R4), where the tar was obtained by weighted average based on the products measured by GC-MS.
Biomass 0.067 CO 2 + 0 . 43 H 2 + 0 . 088 CO + 0 . 076 CH 4 + 0 . 0098 C 2 H 4 + 0 . 00521 C 2 H 6 + 0 . 00135 C 3 H 8 + 0 . 095 tar + 0 . 23 char
Plastic 0 . 50 H 2 + 0 . 27462 CH 4 + 0 . 0738 C 2 H 4 + 0 . 03721 C 2 H 6 + 0 . 0044 C 3 H 8 + 0 . 0459 tar + 0 . 067 char
Paper 0.12 CO 2 + 0 . 63 H 2 + 0 . 071 CO + 0 . 041 CH 4 + 0 . 0056 C 2 H 4 + 0 . 0063 C 2 H 6 + 0 . 0022 C 3 H 8 + 0 . 0088 tar + 0 . 12 char
Textile 0.14 CO 2 + 0 . 26 H 2 + 0 . 11 CO + 0 . 30 CH 4 + 0 . 053 C 2 H 4 + 0 . 015 C 2 H 6 + 0 . 0023 C 3 H 8 + 0 . 035 tar + 0 . 083 char

2.2. Numerical Methods

During the pyrolysis, the discrete phase is composed of four types of particles, each of which includes three components: volatile, volatile, fixed carbon and ash. The density of the particles remains constant; as volatile precipitates, the mass of the particles decreases while the volume of the particles decreases. The gas phase is composed of flue gas and volatile products generated by pyrolysis, where the composition of the volatile components is determined based on Reactions (R1)–(R4).

2.2.1. Governing Equations

In the process of directly heating materials with high-temperature flue gas, the heat transfer between the gas and particles is mainly convection heat transfer, and the wall of the reactor is an adiabatic boundary condition; thus, the influence of radiation heat transfer is not considered. The governing equations for an incompressible viscous Newtonian fluid and the discrete jth phase are shown in Table 3.

2.2.2. Model Setup

The simulation model was an 0.08 × 0.08 × 0.5 m cuboid. There was 200 g of material in the reactor with a 0.06 m stacking height and a preheating temperature of 473 K. Flue gas entered the reactor from the bottom. The flue gas and volatile products generated by pyrolysis moved upward through the gaps between the particles and flowed out from the top outlet. The pressure at the outlet was set as 101,325 Pa, and the walls were assigned as a no-slip wall. The main parameters used in the simulation are summarized in Table 4. A flue gas temperature of 1173 K and flue gas velocity of 0.25 m/s were employed as the base case. The temperature of the flue gas was referenced to the flue gas temperature at the outlet of the waste incineration furnace. In practical applications, it can come from the online combustion of pyrolysis volatiles or from existing flue gas. Five sets of flue gas temperature (873, 973, 1073, 1173, and 1273 K) and five sets of velocity (0.15, 0.2, 0.25, 0.3 and 0.35 m/s) based on experiments were set to study the effects of flue gas temperature and velocity on heat transfer characteristics and MSW pyrolysis performance. According to the experimental materials, the particle size was taken as 10 mm without considering the influence of internal thermal resistance.
The proportions of biomass, plastic, paper, and textiles were 14.29%, 48.21%, 32.14%, and 5.36%, respectively. During the pyrolysis process, every component followed its own reaction equation and pyrolysis rate. Because the evaporation of moisture in the material requires a large amount of heat, the main purpose of preheating is drying, and the preheating temperature was set at 473 K. Due to the complex composition of MSW, the physical parameters of different components were obtained through consulting the material manual during the simulation process without considering the variation of physical parameters with temperature.
During the simulation, the time step, the particle phase and the gas phase were coupled explicitly by the interphase source term, and the particle properties were updated at each fluid. For the gas phase, the governing equations were discretized based on the finite volume method (FVM). The SIMPLE algorithm was employed to model the coupling between the gas velocity and the gas pressure. A flow chart depicting the reactive chemistry interface implemented in MFix–DEM is presented in Figure 3. The processes added to the DEM algorithm for reactive chemistry are indicated by dashed lines. For each case, the physical time for each case was 600 s, which takes about 8 h to complete on a personal computer with 14 cores.

3. Results and Discussion

3.1. Model Validation

A preliminary study was performed to facilitate the choice of the appropriate grid resolution. Figure 4 shows the average temperature of the particles and the gas phase at different grid sizes. The grid sizes for resolutions 20, 16, and 10 mm are very similar. The simulations show the process of the average temperature of the particles and gas phase gradually increasing with time. As the grid size needs to be larger than the particle size, we chose the average grid resolution of grid size 20 mm for the present simulations.
Figure 5a shows the comparison of gas phase temperature between the simulation and the experiment. Due to heat dissipation loss, the temperature drop at the connection between the upper and lower furnaces was approximately 200 K. The timer started when the temperature of Thermocouple a in the middle of the material was 473 K. The simulated temperature change was consistent with the temperature change trend measured in the experiment. The temperature rise rate slowed down between 770 and 800 K, corresponding to the temperature range of the pyrolysis reaction. At the end of the reaction, the temperature was close to the temperature of the flue gas. Figure 5b,c show the comparison of product distributions between the simulation and experiment, where in Figure 5c, the proportions of biomass, plastic, paper, textiles, and kitchen materials were 43.91%, 18.62%, 18.08%, 10.29%, and 9.11%, respectively [31]. The CO prediction value was relatively high, whereas the C2H4 prediction value was low. This is because the influence of stable levoglucosan radicals generated by biomass pyrolysis was not considered in the simulation, which inhibited product decomposition into smaller molecules, such as CO, CO2, and CH4 [32]. The predicted yields of char in Figure 5b,c agreed with the experiment. The MSW pyrolysis process can be predicted using a simulation model of the typical components.

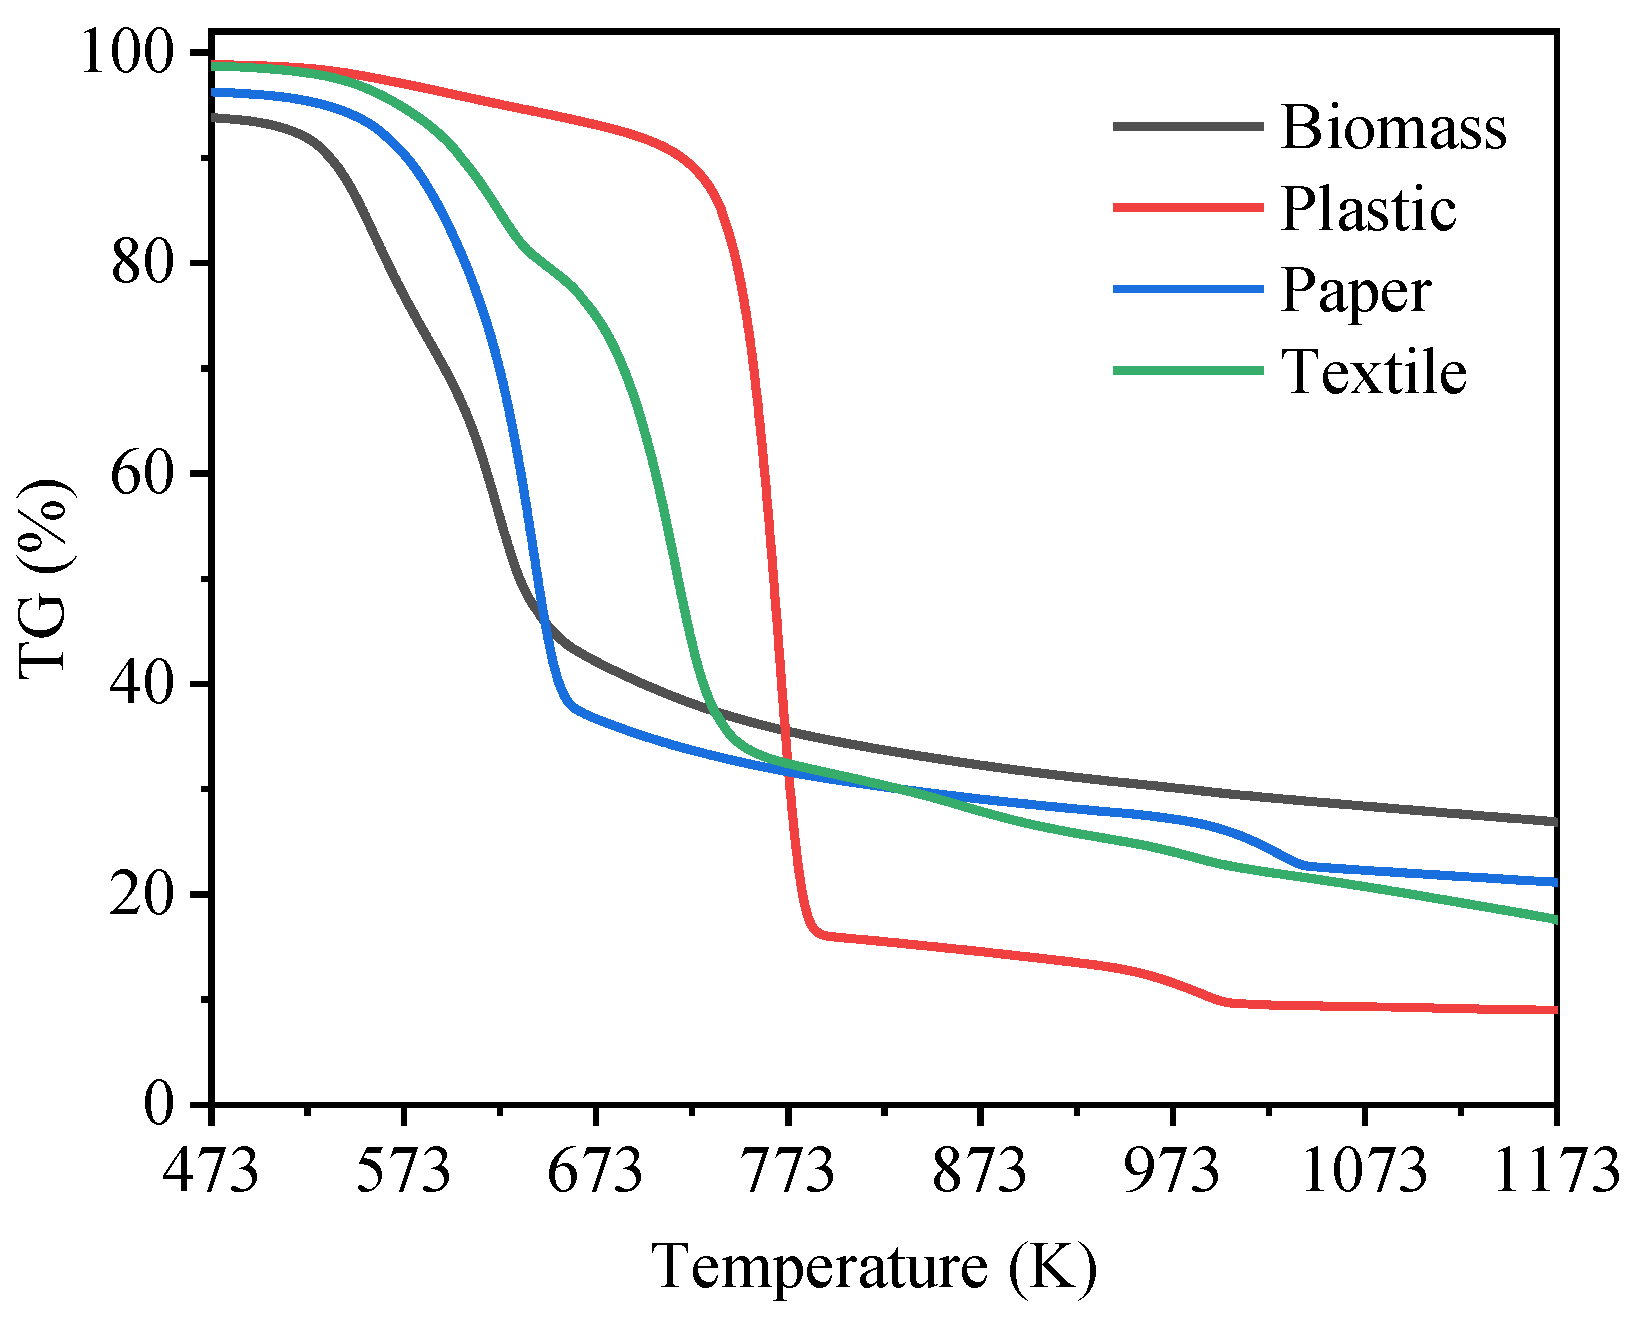
3.2. Individual Pyrolysis of Each Component

To study the temperature distribution and pyrolysis characteristics of materials with different components during pyrolysis, the individual pyrolysis process of each component was simulated first. Figure 6 shows the changes in material temperature and stacking height inside the reactor. Due to the different physical properties such as the specific heat capacity, thermal conductivity, pyrolysis rate, and pyrolysis heat absorption of different components, the heating rate and the pyrolysis start and end times of different components are different. Due to the different densities of different components, the starting stacking height of materials of the same quality also varies. Due to the different volatiles released by different components of materials, the height of residue after pyrolysis is also different. However, the overall trend is consistent; as time goes on, the particle temperature gradually increases. Due to the gas entering from the bottom of the reactor, the temperature of the bottom layer particles is higher than that of the top layer particles, and the pyrolysis reaction occurs early with a particle size smaller than that of the upper-layer particles. Due to the heat absorption of the pyrolysis reaction, the temperature of the bottom particles rises slowly with the top particles not yet reaching the initial reaction temperature. The temperature continues to rise, and the temperature of the particles at different heights in the reactor tends to be consistent. The bottom particles complete the pyrolysis reaction earlier, and their temperature approaches the temperature of the heating gas before the top particles.
Figure 7 shows the temperature distributions of particles at different times. As the flue gas was fed from the bottom, the particle temperatures at the bottom increased rapidly, and the temperature difference between the particles along the height direction was relatively large. At 50 s, the maximum temperature differences of materials in the bed were 107.77 K for biomass, 141.57 K for paper, and 184.33 K for textiles. The average temperature gradient along the height direction was 2.16, 3.14, and 3.18 K/mm, respectively. The temperature increase rate of plastic was the slowest with a maximum temperature difference of 240.03 K at 100 s and an average temperature gradient of 4.36 K/mm along the height direction. As the temperature increased, the particles began to decompose, resulting in a decrease in particle size and stacking height. As the reaction progressed, the particles in the bottom entered the endothermal pyrolysis stage, leading to a decrease in the material temperature difference. The biomass average temperature gradient was 1.81 K/mm at 80 s, and those of plastic, paper and textile were 1.36 K/mm at 300 s, 1.67 K/mm at 180 s, and 1.79 K/mm at 160 s, respectively, which is consistent with the results of Reference [33]. When the pyrolysis of the particles at the bottom was complete, the temperature of the remaining char increased rapidly [34]. However, the particles at the top were still in the pyrolysis process, so the temperature difference increased.
The average temperature and mass variations over time during the individual pyrolysis of the four components are shown in Figure 8a,b. In the heating stage before the pyrolysis reaction, the textile temperature increased rapidly owing to its higher thermal conductivity and lower specific heat capacity. During the pyrolysis stage, the average temperature of the materials increased slowly. The time for biomass to complete pyrolysis was the shortest, while the time for plastic to complete pyrolysis was the longest. When the pyrolysis was completed, the particle sizes of the two components were about 63.5% and 46.0% of the original, respectively.
Figure 8c shows the instantaneous mass flow rate of volatile products at the outlet. Biomass was the earliest to produce volatile products, and the pyrolysis times for textiles, paper, and plastics were about 1.37, 1.26, and 1.96 times that of biomass, respectively. The curves of plastic and paper show a fluctuating state, mainly because lower-layer particle pyrolysis had been completed, whereas the upper-layer particles had not yet reached the temperature for pyrolysis. The total mass flow rate of the volatile was obtained by integrating the curves. The volatile production per gram of materials was 0.72 g/g biomass, 0.87 g/g plastic, 0.71 g/g paper, and 0.78 g/g textile corresponding to the degree of pyrolysis of each component.
During the pyrolysis process, the heat absorbed by the material mainly originates from the flue gas by convective heat transfer. In this study, the walls were adiabatic, and the heat absorbed by the pyrolysis system was:
Q = c ¯ p g i n m · g i n ( T i n T o u t )
where c ¯ p g i n is the flue gas average specific heat capacity, which is determined by flue gas temperature; m ˙ g i n is the flue gas mass flow rate at the inlet, which is determined by flue gas temperature and velocity, and T i n and T o u t are the gas temperatures at the inlet and outlet, respectively. The heat absorptions required for the pyrolysis of each component are shown in Figure 9a. At the beginning, the pyrolysis system heat absorption rate was 390 W. As the material temperature increased, the temperature difference decreased, and the heat absorption rate gradually decreased. When pyrolysis began, the heat absorption rate decreased slowly, because the absorbed heat was partly used for heating up the materials and volatile products generated during the pyrolysis process, and it was partly used to provide reaction heat. The heat required for biomass pyrolysis was the lowest, followed by paper and textiles, with plastic the highest, which is consistent with the results of References [35,36]. During the pyrolysis process, the heat required for material heating and reaction comes from high-temperature flue gas. The energy efficiency, η , can be expressed as the ratio of the heat absorbed by the system to the heat provided by the high-temperature flue gas [37]:
η = heat   absorbed   by   pyrolysis   system heat   supplied   by   flue   gas × 100 %
where the heat absorbed by the pyrolysis system was obtained by integrating the heat absorption rate. It can be seen from Figure 9b that the energy efficiencies of biomass and paper were approximately 61% for their less specific heat capacity and thermal conductivity, while the plastics and textiles energy efficiencies η were approximately 55%. The energy efficiency was higher than that of Reference [38] for the material being preheated in advance. The effective heat transfer coefficient (W/(m2K)) during the pyrolysis process was obtained from the heat absorbed by the pyrolysis system:
h e = Q A s ( T g b e d T s )
where A s and T s are the surface area and average temperature of the total particles, respectively, and T g b e d is the average temperature of the gas phase. As shown in Figure 9c, at the beginning of the heating stage, h e was approximately 15 W/(m2K). As pyrolysis occurred, h e gradually increased. This is the result of the reaction heat absorption, reduction in particle size, and generation of volatiles. The generation of volatiles can also accelerate the gas flow rate over the particle surface. The average effective heat transfer coefficients of the four components were about 38.18 W/(m2K) for biomass, 42.34 W/(m2K) for plastic, 39.20 W/(m2K) for paper and 36.55 W/(m2K) for textiles.
When flue gas comes into direct contact with materials, the amount of flue gas consumed during the pyrolysis process affects the pyrolysis gas calorific value. The dilution degree, α , was defined as:
a = mass   of   volatile   generated + mass   of   flue   gas   supplied mass   of   volatile   generated
The flue gas consumption, β , was defined as:
β = mass   of   flue   gas   supplied mass   of   material
Figure 9d shows the dilution degree of the volatile, α, and flue gas consumption, β , of the four components. The flow gas consumption, β , of plastic and biomass was 1.09 and 0.42, respectively, and the dilution degree, α, was 2.23 and 1.58, respectively. This means that the calorific values of the volatile obtained from pyrolysis was about 44.84% and 63.29%, respectively, of that obtained from indirect heating. Both α and β were in the order of biomass > textiles > paper > plastic. Due to the dilution of the flue gas, the calorific value of the product was reduced. In order to ensure the calorific value of the products during actual operation, the amount of flue gas can be reduced by increasing the flue gas temperature or reducing the particle size of the material, or by coupling high-temperature flue gas heating with other heating methods (such as microwave heating) to improve the heat transfer efficiency.

3.3. Influence of Material Mixing Methods

Because of the different physical properties and pyrolysis temperatures, the mixing method affects the temperature increase rate and pyrolysis completion time of each component. Mixing methods mainly include layer, column, and uniform stacks [39]. Considering that most MSW incinerators are grate furnaces, column and uniform stacks were examined in this study, with each component weighing 50 g. When setting up a four-grid stacking case, the reactor was divided into four grid areas, and corresponding materials were placed in each grid area, as shown in Figure 10a. The four-column stacking is similar, dividing the area into four vertical columns, and filling the corresponding materials in each area, such as in Figure 10b. Uniformly mixed stacking is the process of blowing a gas with a temperature of 473 K at a high gas velocity into a four-column stack, allowing the particles to move freely in a fluidized state. After blowing for 5 s, the blowing stops, causing the particles to fall naturally due to gravity, resulting in uniformly mixed stacking, such as in Figure 10c. Among them, gray particles represent biomass, red particles represent plastic, blue particles represent paper, and green particles represent fabric. It can be seen that as time goes on, the material gradually heats up and undergoes pyrolysis, the particle size decreases, and the stacking height decreases until the reaction stops, after which the stacking height remains unchanged. Similar to the conclusion of individual pyrolysis, the biomass particles react faster under each stacking method. The plastic starts to react last, but the particle size is the smallest after the reaction is completed.
Figure 11 shows the variations in the average particle temperature and particle size of each component with different mixing methods. Compared with the individual pyrolysis of each component in Figure 8a, different stacking methods had little effect on the pyrolysis of biomass particles. However, after 200 s, the temperature increase rate of the coke decreased due to the influence of the pyrolysis of other components. The temperature increase rate of plastics under different stacking methods was higher than that of individual pyrolysis. When the plastic had not yet started to decompose, the temperature increase rate was the fastest when uniformly stacked. Later, it was affected by the pyrolysis of other components, and the temperature increase rate was the fastest when there was a four-cell stack. When there was a uniform stack, the completion time of pyrolysis was 325 s, which was approximately 92.85% of the pyrolysis time when there was a four-cell stack. A uniform stack can shorten the pyrolysis completion time.

3.4. Influence of Flue Gas Temperature

The flue gas temperature is one of the key factors affecting the pyrolysis process of the material. The heat carried by flue gas varies with temperature, which in turn affects the heat absorbed by particles per unit time. Figure 12a,b show the variations of the average particle temperature and particle diameter with time at different flue gas temperatures when there was a uniform stack. The average temperature was the mass-weighted temperature of the four components. The higher the flue gas temperature, the faster the particle temperature increased, resulting in a decrease in the pyrolysis time, but the magnitude of the decrease was smaller and smaller, which was in accordance with the results of Reference [40]. The time required for pyrolysis at a flue gas temperature of 1273 K was about 0.65 times that at a flue gas temperature of 973 K.
There were three small peaks in the temperature increase rate during the pyrolysis process, as shown in Figure 12c. These peaks were related to the pyrolysis of each component. The first decrease corresponded to biomass pyrolysis, the second corresponded to paper and textile pyrolysis, and the third corresponded to plastic pyrolysis. When the pyrolysis reaction occurred, the heat absorbed by the material was used to provide the reaction heat, which reduced the temperature increase rate of the material. After pyrolysis was completed, the temperature of the remaining char with a smaller diameter increased rapidly.
Figure 13a shows the heat absorbed by materials at different flue gas temperatures. At the beginning of the heating stage, the heat absorption was 433.77 W at 1273 K, which was greater than that of 347.34 W at 973 K. As the material temperature increased, the temperature difference between the flue gas and the materials decreased, and the heat absorbed by the materials gradually decreased. The influence of flue gas temperature on energy efficiency is shown in Figure 13b. The energy efficiency was about 61.69% at 1273 K, which was 1.38 times that at 973 K. The influence of flue gas temperature on h e is shown in Figure 13c. A higher temperature can enhance the heat transfer efficiency between the gas and the particle surface. At 200 s, the heat transfer coefficient can reach approximately 28.05 W/(m2K) at 973 K and 46.67 W/(m2K) at 1273 K. The averaged heat transfer coefficients at the different flue gas temperatures of 973, 1073, 1173, and 1273 K during the pyrolysis process were 40.62, 42.46, 43.13 and 44.45 W/(m2K), respectively.
Figure 13d shows the effects of flue gas temperature on the dilution degree, α, and flue gas consumption, β. Higher flue gas temperatures can strengthen the heat transfer efficiency and shorten the pyrolysis reaction time, resulting in lower flue gas consumption, which is consistent with the result of Reference [41]. As the flue gas temperature increased from 973 to 1273 K, the gas consumption per unit mass of material decreased from 1.58 to 0.78 g/g material, and the dilution degree decreased from 2.68 to 1.84 g/g.

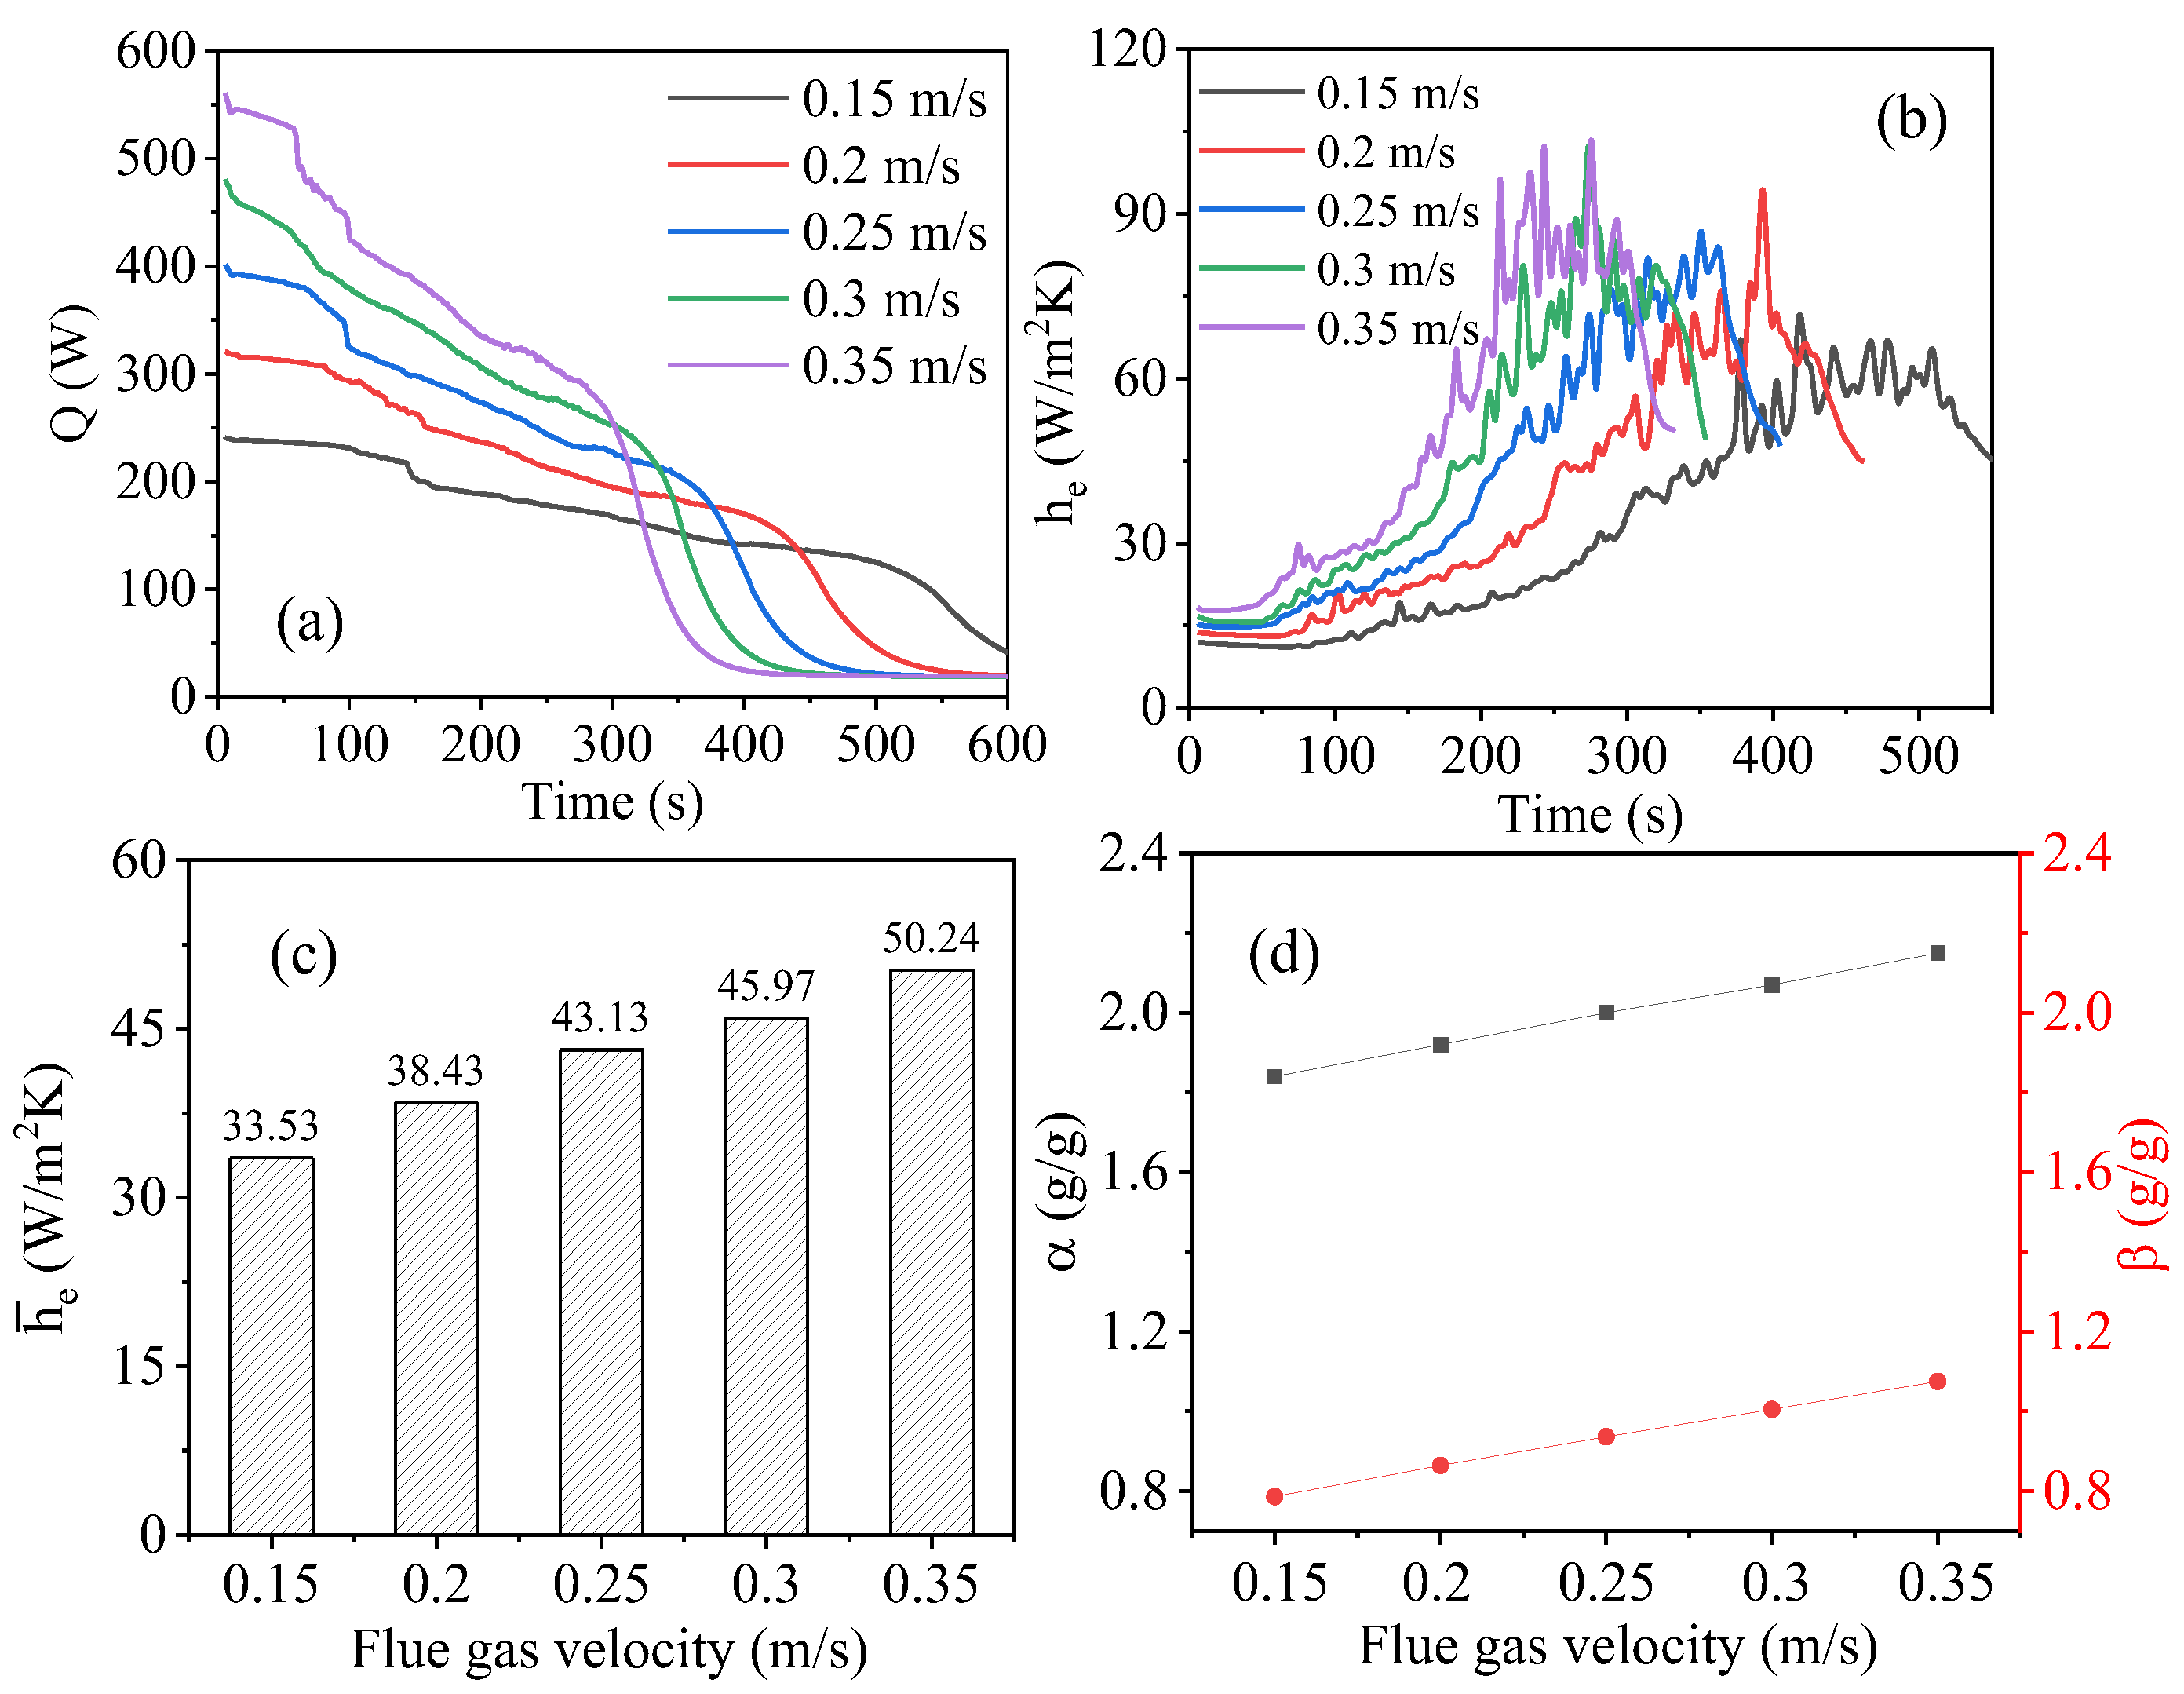
3.5. Influence of Flue Gas Velocity

The flue gas velocity is a key factor affecting the heat transfer coefficient of the material surface. With an increase in the flue gas velocity, the average particle temperature increased rapidly, but the magnitude of the increase gradually decreased, as shown in Figure 14. At 200 s, when the flue gas velocity increased from 0.15 to 0.2 m/s, the average particle temperature increased from 626.8 to 663.9 K with a difference of 37.1 K. When the flue gas velocity increased from 0.3 to 0.35 m/s, the average particle temperature increased from 717.6 to 733.3 K with a difference of 15.7 K. As time progressed, when pyrolysis was completed, the average temperature of particles at different flue gas velocities tended toward the flue gas temperature. With an increase in the flue gas velocity, the average particle diameter decreased rapidly, too. When the flue gas velocity increased from 0.15 to 0.35 m/s, the pyrolysis completion time was shortened by 41.39%. Figure 14c shows the influence of the flue gas velocity on the temperature increase rate of materials. When the flue gas velocity was 0.35 m/s, the temperature increase rate of the material was the fastest, reaching 1.33 K/s. The material first reached the pyrolysis temperature and began to decompose. At this time, a portion of the absorbed heat was used to provide pyrolysis, and the temperature increase rate decreased. At 240 s, the lowest heating rate was about 0.15 K/s. As the flue gas velocity decreased, the temperature increase rate decreased. When the flue gas velocity was 0.15 m/s, the temperature increase rate was 0.55 K/s. At 425 s, the heating rate dropped to the lowest, about 0.04 K/s.
The amount of heat absorbed by the pyrolysis system at different flue gas velocities is shown in Figure 15a. The heat absorbed by pyrolysis at 0.35 m/s was 2.33 times that of 0.15 m/s at the initial time. After the pyrolysis was complete, the heat absorbed by the remaining char with a smaller diameter decreased rapidly.
The influence of flue gas velocity on h e is shown in Figure 15b. As the reaction began, h e gradually increased, and the larger the flue gas velocity, the greater the h e . The main reason was that as the particle temperature increased and the pyrolysis progressed, the surface area and temperature difference between the particles and gas decreased. At 200 s, the heat transfer coefficient can reach approximately 18.93 W/(m2K) at 0.15 m/s and 64.42 W/(m2K) at 0.35 m/s. And the averaged heat transfer coefficients at different flue gas velocities during the pyrolysis process are shown in Figure 15c. The average surface heat transfer coefficient at a flue gas velocity of 0.35 m/s was about 1.5 times that of 0.15 m/s.
Figure 15d shows the influence of flue gas velocity on the dilution degree, α, and flue gas consumption, β. High velocity can enhance the heat transfer between the flue gas and the material surface but shorten the residence time of the flue gas in the bed [42]. As the flue gas velocity increased from 0.15 to 0.35 m/s, the gas consumption per unit mass of material increased from 0.79 to 1.08 g/g material, and the dilution degree increased from 1.84 to 2.15 g/g material. The flue gas consumption amount at 0.35 m/s was 1.37 times of that at 0.15 m/s. This means that the calorific value of the volatiles obtained from the pyrolysis process heated by the flue gas at 0.35 m/s was about 46.51% of that obtained from indirect heating.

4. Conclusions

Numerical simulation is an important method for studying the heat and mass transfer characteristics of a solid waste pyrolysis process. The current homogeneous model assumes that different components of MSW start pyrolysis with the same rate at the same temperature and end the reaction at the same time. In this study, a refined numerical simulation model for the pyrolysis of four typical MSW components directly heated by high-temperature flue gas was established. The heat transfer characteristics of MSW pyrolysis were studied, and the effects of the mixing method of material, flue gas temperature, and flue gas velocity on the particle temperature increase rate, heat transfer efficiency, energy efficiency, and gas consumption were analyzed. The numerical simulation model established in this study can be used to predict the pyrolysis process of different material components, and the research results are of great significance for the promotion and application of pyrolysis technology for MSW with high-temperature flue gas. The main conclusions are as follows.
The temperature difference of the four components along the bed height direction was 1.36–1.81 K/mm, and the energy efficiency was 55–61%.
When the materials were uniformly mixed, the temperature rise rates of different components were similar, while the pyrolysis time varied. A uniform stack can shorten the pyrolysis completion time.
When the flue gas temperature increased, the energy efficiency increased and the amount of gas consumption and the dilution degree of volatile decreased. When the flue gas temperature increased from 973 to 1273 K, the pyrolysis time decreased by 34.37%. When the flue gas velocity increased, the energy efficiency decreased slightly, and the flue gas consumption increased.
The numerical simulation model established in this study can be used to predict the heat transfer characteristics and flue gas consumption of the pyrolysis process of different raw material components, and it can be used for the design and optimization of actual pyrolysis reactors. Additionally, in the simulation process, all components of MSW were simplified as spherical shapes. In fact, the various components of MSW have different shapes; for example, plastic may be in the form of sheets or strips, and biomass may be in the form of columns or sheets. In later research, it is also necessary to consider the influence of shape on heat transfer and reaction characteristics.

Author Contributions

Methodology, D.C.; Validation, K.Q.; Investigation, T.J. and X.S.; Writing—original draft, M.W.; Writing—review and editing, L.Y. All authors have read and agreed to the published version of the manuscript.

Funding

The research was funded by the Natural Science Foundation of Shanghai (Grant Nos. 22ZR1465900), the Science and Technology Innovation Plan of Shanghai Science and Technology Commission (Grant Nos. 22DZ1208200) and the Key Technologies Research and Development Program of China (Grant Nos. 2020YFC1910100).

Informed Consent Statement

Informed consent was obtained from all subjects involved in the study.

Data Availability Statement

All the results are included and presented in the work.

Conflicts of Interest

The authors declare no conflicts of interest.

Abbreviations

Nomenclature T g Temperature of gas phase, K
A p , i Surface area of particles  i , m2 T g , Ω Temperature of gas phase in the domain Ω , K
C D Drag coefficient T p , i , T p , j Temperatures of particles i and j , K
C p , g Specific heat capacity of gas phase, J·kg−1·K−1 T R g Radiation temperature of gas phase, K
C p , j Specific heat capacity of particles  i , J·kg−1·K−1 u g Velocity vector of gas phase, m·s−1
d Thickness of gas layer, m v p Velocity vector of particles j , m·s−1
d p Particles diameter, m V c Volume of computational cell, m3
F c Contact force exerting on a specific particles, N X n Mass fraction of nth species
F d Gas force exerting on a specific particles, N
F i j n , F i j t Normal and tangential contact forces between particles i and j, NGreek symbols
g Gravitational acceleration, m·s−2 α (Mass of volatile generated + mass of flue gas supplied)/mass of volatile generated, g/g
h p g , j Convective heat transfer coefficient, W·m−2·K−1 β Mass of flue gas supplied/mass of material, g/g
h t o t a l Pyrolysis effective heat transfer coefficient, W·m−2·K−1 β g Inter-phase momentum exchange coefficient, kg·m−3·s−1
I g p , j Momentum exchange between the gas and jth phase particles, N·m−3 ε g Void fraction
I p , j Moment of inertia of a specific particles, kg·m2 e p , j Emissivity of particles j
k n , i j , k t , i j Normal and tangential spring coefficients, N·m−1 η Energy efficiency, %
l i j Distance between particles i and j, m Δ H r g Heat source of gas phase due to chemical reaction, W·m−3
n i j Normal unit vector between particles i and j Δ H r s , j Heat source of particles j due to chemical reaction, w·m−3
N p Particles number κ g Gas thermal conductivity, W·m−1·K−1
N p , Ω Particles number in the domain Ω κ p , i , κ p , j Thermal conductivity of particles i and j , W·m−1·k−1
N u p , j Nusselt number of particles j γ R g Radiative heat transfer coefficient of gas phase, W·m−2·K−4
P g Gas pressure, Pa η n , i j , η t , i j Normal and tangential damping coefficients, kg·s
Pr Prandtl number δ n , i j , δ t , i j Normal and tangential overlap displacements, m
Q Heat absorbed by the material in pyrolysis μ Friction coefficient
Q p g , j Gas particles convective heat transfer rate, W·m−3 μ g Gas viscosity, kg·m−1·s−1
Q p f p , j Particles–gas particles conductive heat transfer rate, W·m−3 ρ g , ρ p Gas and particles density, kg·m−3
Q p p , j Particles–particles conductive heat transfer rate, W·m−3 ω p , j Particles angular velocity, s−1
Q r a d , j Radiative heat transfer rate, W·m−3
R Gas constant, J·mol−1·K−1 Subscripts
Re p , j Particles Reynold number g Gas phase
R p , i , R p , j Diameters of particles i and j, m i Particles i
t Time instants i j Interactions between particles i  and j
T e n v Temperature of environment, K j Particles j

References

  1. Nanda, S.; Berruti, F. A technical review of bioenergy and resource recovery from municipal solid waste. J. Hazard. Mater. 2021, 403, 123970. [Google Scholar] [CrossRef] [PubMed]
  2. National Bureau of Statistics. Available online: http://www.stats.gov.cn/ (accessed on 11 May 2022).
  3. Mahari, W.A.W.; Azwar, E.; Foong, S.Y.; Ahmed, A.; Peng, W.X.; Tabatabaei, M.; Aghbashlo, M.; Park, Y.K.; Sonne, C.; Lam, S.S. Valorization of municipal wastes using co-pyrolysis for green energy production, energy security, and environmental sustainability: A review. Chem. Eng. J. 2021, 421, 129749. [Google Scholar] [CrossRef]
  4. Elkhalifa, S.; Mackey, H.R.; Al-Ansari, T.; McKay, G. Pyrolysis of Biosolids to Produce Biochars: A Review. Sustainability 2022, 14, 9626. [Google Scholar] [CrossRef]
  5. De Conto, D.; Silvestre, W.P.; Baldasso, C.; Godinho, M. Performance of rotary kiln reactor for the elephant grass pyrolysis. Bioresour. Technol. 2016, 218, 153–160. [Google Scholar] [CrossRef] [PubMed]
  6. Olam, M.; Karaca, H. Characterization of products obtained of waste polyethylene terephthalate by pyrolysis. Environ. Prog. Sustain. Energy 2022, 41, 13835. [Google Scholar] [CrossRef]
  7. Ding, Y.; Zhao, J.; Liu, J.W.; Zhou, J.Z.; Cheng, L.; Zhao, J.; Shao, Z.; Iris, C.; Pan, B.J.; Li, X.N.; et al. A review of China’s municipal solid waste (MSW) and comparison with international regions: Management and technologies in treatment and resource utilization. J. Clean Prod. 2021, 293, 126144. [Google Scholar] [CrossRef]
  8. Setter, C.; Silva, F.T.M.; Assis, M.R.; Ataide, C.H.; Trugilho, P.F.; Oliveira, T.J.P. Slow pyrolysis of coffee husk briquettes: Characterization of the solid and liquid fractions. Fuel 2020, 261, 116420. [Google Scholar] [CrossRef]
  9. Mlonka-Medrala, A.; Evangelopoulos, P.; Sieradzka, M.; Zajemska, M.; Magdziarz, A. Pyrolysis of agricultural waste biomass towards production of gas fuel and high-quality char: Experimental and numerical investigations. Fuel 2021, 296, 120611. [Google Scholar] [CrossRef]
  10. Jankovic, B.; Manic, N.; Stojiljkovic, D. The gaseous products characterization of the pyrolysis process of various agricultural residues using TGA-DSC-MS techniques. J. Therm. Anal. Calorim. 2020, 139, 3091–3106. [Google Scholar] [CrossRef]
  11. Quesada, L.; Calero, M.; Martin-Lara, M.A.; Perez, A.; Blazquez, G. Characterization of fuel produced by pyrolysis of plastic film obtained of municipal solid waste. Energy 2019, 186, 115874. [Google Scholar] [CrossRef]
  12. Ali, G.; Nisar, J.; Iqbal, M.; Shah, A.; Abbas, M.; Shah, M.R.; Rashid, U.; Bhatti, I.A.; Khan, R.A.; Shah, F. Thermo-catalytic decomposition of polystyrene waste: Comparative analysis using different kinetic models. Waste Manag. Res. 2020, 38, 202–212. [Google Scholar] [CrossRef] [PubMed]
  13. Genuino, H.C.; Ruiz, M.P.; Heeres, H.J.; Kersten, S.R.A. Pyrolysis of mixed plastic waste (DKR-350): Effect of washing pre-treatment and fate of chlorine. Fuel Process. Technol. 2022, 233, 107304. [Google Scholar] [CrossRef]
  14. Lin, X.; Yang, G.; Wang, F.; He, H.; Chi, Y.; Yan, J. Thermogravimetric Study on the Interactive Effect of Co-Pyrolysis of Paper and Plastic Solid Wastes. Environ. Eng. 2016, 34, 95–99. [Google Scholar]
  15. Wen, C.; Wu, Y.; Chen, X.P.; Jiang, G.D.; Liu, D. The pyrolysis and gasification performances of waste textile under carbon dioxide atmosphere. J. Therm. Anal. Calorim. 2017, 128, 581–591. [Google Scholar] [CrossRef]
  16. Sophonrat, N.; Sandstrom, L.; Zaini, I.N.; Yang, W.H. Stepwise pyrolysis of mixed plastics and paper for separation of oxygenated and hydrocarbon condensates. Appl. Energy 2018, 229, 314–325. [Google Scholar] [CrossRef]
  17. Chhabra, V.; Bhattachary, S.; Shastri, Y. Pyrolysis of mixed municipal solid waste: Characterisation, interaction effect and kinetic modelling using the thermogravimetric approach. Waste Manag. 2019, 90, 152–167. [Google Scholar] [CrossRef] [PubMed]
  18. Nguyen, Q.V.; Choi, Y.S.; Choe, S.K.; Jeong, Y.W.; Kwon, Y.S. Improvement of bio-crude oil properties via co-pyrolysis of pine sawdust and waste polystyrene foam. J. Environ. Manag. 2019, 237, 24–29. [Google Scholar] [CrossRef] [PubMed]
  19. Hassan, H.; Hameed, B.H.; Lim, J.K. Co-pyrolysis of sugarcane bagasse and waste high-density polyethylene: Synergistic effect and product distributions. Energy 2020, 191, 116545. [Google Scholar] [CrossRef]
  20. Zheng, Y.W.; Tao, L.; Yang, X.Q.; Huang, Y.B.; Liu, C.; Zheng, Z.F. Study of the thermal behavior, kinetics, and product characterization of biomass and low-density polyethylene co-pyrolysis by thermogravimetric analysis and pyrolysis-GC/MS. J. Anal. Appl. Pyrolysis 2018, 133, 185–197. [Google Scholar] [CrossRef]
  21. Cai, J.J.; Zheng, W.H.; Luo, M.; Tang, X.Y. Gasification of biomass waste in the moving-grate gasifier with the addition of all air into the oxidizing stage: Experimental and numerical investigation. Process Saf. Environ. Protect. 2021, 147, 985–992. [Google Scholar] [CrossRef]
  22. Attanayake, D.D.; Sewerin, F.; Kulkarni, S.; Dernbecher, A.; Dieguez-Alonso, A.; van Wachem, B. Review of Modelling of Pyrolysis Processes with CFD-DEM. Flow Turbul. Combust. 2023, 111, 355–408. [Google Scholar] [CrossRef]
  23. Lu, L.Q.; Gao, X.; Gel, A.; Wiggins, G.M.; Crowley, M.; Pecha, B.; Shahnam, M.; Rogers, W.A.; Parks, J.; Ciesielski, P.N. Investigating biomass composition and size effects on fast pyrolysis using global sensitivity analysis and CFD simulations. Chem. Eng. J. 2021, 421, 127789. [Google Scholar] [CrossRef]
  24. Kong, D.L.; Luo, K.; Wang, S.; Yu, J.H.; Fan, J.N. Particle behaviours of biomass gasification in a bubbling fluidized bed. Chem. Eng. J. 2022, 428, 131847. [Google Scholar] [CrossRef]
  25. Kong, D.L.; Wang, S.; Luo, K.; Hu, C.S.; Li, D.B.; Fan, J.R. Three-dimensional simulation of biomass gasification in a full-loop pilot-scale dual fluidized bed with complex geometric structure. Renew. Energy 2020, 157, 466–481. [Google Scholar] [CrossRef]
  26. Chandrasekaran, A.; Ramachandran, S.; Subbiah, S. Modeling, experimental validation and optimization of Prosopis juliflora fuelwood pyrolysis in fixed-bed tubular reactor. Bioresour. Technol. 2018, 264, 66–77. [Google Scholar] [CrossRef] [PubMed]
  27. Zhang, H.; Okuyama, K.; Higuchi, S.; Soon, G.; Lisak, G.; Law, A.W.K. CFD-DEM simulations of municipal solid waste gasification in a pilot-scale direct-melting furnace. Waste Manag. 2023, 162, 43–54. [Google Scholar] [CrossRef] [PubMed]
  28. Lu, L.Q.; Gao, X.; Dietiker, J.F.; Shahnam, M.; Rogers, W.A. MFiX based multi-scale CFD simulations of biomass fast pyrolysis: A review. Chem. Eng. Sci. 2022, 248, 117131. [Google Scholar] [CrossRef]
  29. Shen, X.; Yan, J.; Bai, C.; Li, X.; Chi, Y.; Ni, M.; Cen, K. Optimization and comparison of pyrolysis kinetic model for typical MSW components. J. Chem. Ind. Eng. 2006, 57, 2433–2438. [Google Scholar]
  30. Wang, M.; Lu, M.Q.; Jia, T.Y.; Chen, D.Z.; Ma, X.B.; Yin, Y.J. Influence of CO2 Content in Flue Gas on Pyrolysis/ Gasification Process of Municipal Solid Waste. Environ. Sanit. Eng. 2023, 31, 45–50. [Google Scholar] [CrossRef]
  31. Yue, C.Y.; Gao, P.P.; Tang, L.F.; Chen, X.L. Effects of N-2/CO2 atmosphere on the pyrolysis characteristics for municipal solid waste pellets. Fuel 2022, 315, 123233. [Google Scholar] [CrossRef]
  32. Kumagai, S.; Fujita, K.; Kameda, T.; Yoshioka, T. Interactions of beech wood-polyethylene mixtures during co-pyrolysis. J. Anal. Appl. Pyrolysis 2016, 122, 531–540. [Google Scholar] [CrossRef]
  33. Boriouchkine, A.; Sharifi, V.; Swithenbank, J.; Jamsa-Jounela, S.L. Experiments and modeling of fixed-bed debarking residue pyrolysis: The effect of fuel bed properties on product yields. Chem. Eng. Sci. 2015, 138, 581–591. [Google Scholar] [CrossRef]
  34. Zhong, H.B.; Xiong, Q.G.; Zhu, Y.Q.; Liang, S.R.; Zhang, J.T.; Niu, B.; Zhang, X.Y. CFD modeling of the effects of particle shrinkage and intra-particle heat conduction on biomass fast pyrolysis. Renew. Energy 2019, 141, 236–245. [Google Scholar] [CrossRef]
  35. Sygula, E.; Swiechowski, K.; Hejna, M.; Kunaszyk, I.; Bialowiec, A. Municipal Solid Waste Thermal Analysis-Pyrolysis Kinetics and Decomposition Reactions. Energies 2021, 14, 4510. [Google Scholar] [CrossRef]
  36. Hosokai, S.; Matsuoka, K.; Kuramoto, K.; Suzuki, Y. Practical estimation of reaction heat during the pyrolysis of cedar wood. Fuel Process. Technol. 2016, 154, 156–162. [Google Scholar] [CrossRef]
  37. Vieira, M.G.A.; Estrella, L.; Rocha, S.C.S. Energy efficiency and drying kinetics of recycled paper pulp. Dry. Technol. 2007, 25, 1639–1648. [Google Scholar] [CrossRef]
  38. Perazzini, H.; Perazzini, M.T.B.; Meili, L.; Freire, F.B.; Freire, J.T. Artificial neural networks to model kinetics and energy efficiency in fixed, fluidized and vibro-fluidized bed dryers towards process optimization. Chem. Eng. Process. 2020, 156, 108089. [Google Scholar] [CrossRef]
  39. Luo, K.; Wu, F.; Yang, S.L.; Fan, J.R. CFD-DEM study of mixing and dispersion behaviors of solid phase in a bubbling fluidized bed. Powder Technol. 2015, 274, 482–493. [Google Scholar] [CrossRef]
  40. Wang, K.; Zhang, H.Y.; Chu, S.; Zha, Z.T. Pyrolysis of single large biomass particle: Simulation and experiments. Chin. J. Chem. Eng. 2021, 29, 375–382. [Google Scholar] [CrossRef]
  41. Kan, T.; Strezov, V.; Evans, T.J. Lignocellulosic biomass pyrolysis: A review of product properties and effects of pyrolysis parameters. Renew. Sust. Energ. Rev. 2016, 57, 1126–1140. [Google Scholar] [CrossRef]
  42. Tripathi, M.; Sahu, J.N.; Ganesan, P. Effect of process parameters on production of biochar from biomass waste through pyrolysis: A review. Renew. Sust. Energ. Rev. 2016, 55, 467–481. [Google Scholar] [CrossRef]
Figure 1. Thermogravimetric experiments.
Processes 12 00390 g001
Figure 2. Diagram of pyrolysis experimental apparatus.
Processes 12 00390 g002
Figure 3. Flow chart of MFix–DEM.
Processes 12 00390 g003
Figure 4. Average temperature at different grid sizes. (a) Average temperature of particles; (b) average temperature of gas.
Processes 12 00390 g004
Figure 5. Comparison between simulation results and experimental data. (a) Comparison of gas phase temperature between the simulation and the experiment; (b) comparison of pyrolysis gas mass content between the simulation and the experiment; (c) comparison of pyrolysis gas mass content between the simulation and the reference [31].
Processes 12 00390 g005
Figure 6. Reaction process diagram of different materials.
Processes 12 00390 g006
Figure 7. Temperature distribution of particles along the height direction at different times.
Processes 12 00390 g007
Figure 8. Changes during pyrolysis process of different components. (a) Average particle temperature; (b) average particle diameter; (c) volatile mass flow rate.
Processes 12 00390 g008
Figure 9. Changes during pyrolysis of different components. (a) Heat absorptions; (b) energy efficiency; (c) heat transfer coefficient; (d) dilution degree and flue gas consumption.
Processes 12 00390 g009
Figure 10. Reaction process diagram of different mixing methods. (a) four-grid stacking; (b) four-column stacking; (c) uniformly mixed stacking.
Processes 12 00390 g010
Figure 11. Influence of different mixing methods. (a) Average particle diameter; (b) average particle temperature.
Processes 12 00390 g011
Figure 12. Influence of flue gas temperature. (a) Average particle temperature; (b) average particle diameter; (c) average temperature increase rate.
Processes 12 00390 g012
Figure 13. Influence of flue gas temperature. (a) Heat absorptions; (b) energy efficiency; (c) heat transfer coefficient; (d) dilution degree and flue gas consumption.
Processes 12 00390 g013
Figure 14. Influence of flue gas velocity. (a) Average particle temperature; (b) average particle diameter; (c) average temperature increase rate.
Processes 12 00390 g014
Figure 15. Influence of flue gas velocity. (a) Heat absorptions; (b) energy efficiency; (c) heat transfer coefficient; (d) dilution degree and flue gas consumption.
Processes 12 00390 g015
Table 1. MSW proximate and ultimate analysis.
Ultimate Analysis/wt.% Proximate Analysis/wt.%Calorific Values/MJ/kg
NadCadHadSadOadCladAadVadFCad
Biomass1.78 41.57 5.86 0.01 50.62 0.15 19.30 64.89 15.81 19.21
Textile1.01 62.19 7.02 0.00 28.91 0.86 10.10 71.21 18.70 18.18
Paper0.29 43.72 6.30 0.00 49.17 0.52 13.30 74.40 12.30 11.35
Plastic1.16 56.58 7.89 0.02 29.85 4.50 9.10 82.40 8.50 36.84
Table 2. Pre-exponential factors and activation energies.
Temperature (K)A (s–1)E (kJ/mol)
Biomass510–6525.09 × 10578.12
Plastic519–6681.3541.6
725–7786.88 × 1015221.88
Paper533–6565.15 × 108109.07
Textile506–7172.23 × 10588.41
Table 3. Governing equations [24].
Governing equations of gas phase
ε g ρ g t + ε g ρ g u g = δ m ˙ p (2)
ε g = 1 i = 1 N p V d , i V c (3)
ε g ρ g u g t + ε g ρ g u g u g = ε g τ g ε g p g + ρ g ε g g j = 1 4 I g p , j (4)
I g p , j = 1 V c i = 1 N p F d = 1 V c i = 1 N p P g x i V i + β g V i 1 ε g u g x i v p (5)
ε g ρ g X i t + ε g ρ g u g X i = ε g ρ g D n X i + R g i (6)
ε g ρ g C p g T g t + ε g ρ g u g C p g T g = ε g κ g T g + j = 1 4 Q p g , j Δ H r g (7)
Q p g = i = 1 N p Q g p , i V c (8)
Governing equations of particles
d m p , j d t = n = 1 N S i R s n , j i (9)
m p , j d v p , j d t = m p , j g + F d , j + F c , j (10)
I p , j d ω p , j d t = j = 1 , j i k L n × F i j t (11)
F d , j = v p p g + β g v p ε s , j v g v j (12)
F c , j = j = 1 , j i k F i j n + F i j t (13)
F i j n = k n , i j δ n , i j η n , i j δ ˙ n , i j n i j (14)
F i j t = ( k t , i j δ t , i j η t , i j δ ˙ t , i j ) t i j , F i j t μ F i j t μ F i j n t i j , F i j t > μ F i j n (15)
m p , j C p , j d T p , j d t = Q p g , j + Q p p , j + Q p f p , j Δ H r s , j (16)
Q g p , j = h p g , j A p , j T g T p , j (17)
h p g , j = N u p , j d p , j κ g (18)
N u p , j = 2.0 + 0.6 Re p , j 1 2 Pr 1 3 (19)
Q p p , i j = 4 κ p , i κ p , j κ p , i + κ p , j R p , j 2 R p , j 2 R p , i 2 + l i j 2 2 l i j 2 T p , j T p , i (20)
Table 4. Main parameters used in the simulation.
ParametersValueUnit
Time step1e–3s
Outlet pressure101,325Pa
Particle diameter10 mm
Flue gas temperature873, 973, 1073, 1173, 1273K
Preheating temperature473K
Flue gas velocity0.15, 0.2, 0.25, 0.3, 0.35m/s
Flue gas components N2 (80%), CO2 (20%)%
BiomassPlasticPaperTextile
Mass fraction14.2948.2132.145.36%
Particle density8509601100800kg/m3
Specific heat1600270022001300J/(kg·K)
Thermal conductivity0.040.10.060.073W/(m·K)
Disclaimer/Publisher’s Note: The statements, opinions and data contained in all publications are solely those of the individual author(s) and contributor(s) and not of MDPI and/or the editor(s). MDPI and/or the editor(s) disclaim responsibility for any injury to people or property resulting from any ideas, methods, instructions or products referred to in the content.

