
Lipid Fractionation and Physicochemical Characterization of Carapa guianensis Seed Oil from Guyana


Abstract
:1. Introduction
2. Materials and Analytical Methods
2.1. Materials
2.2. Crabwood Oil Fractionation
2.2.1. Dry Fractionation
2.2.2. Solvent Fractionation
2.3. Methods
2.3.1. Electrospray Ionization Mass Spectrometry
2.3.2. Differential Scanning Calorimetry (DSC)
2.3.3. Solid Fat Content Measurements
2.3.4. Polarized Light Microscopy
2.3.5. X-ray Diffraction
2.3.6. Thermogravimetric Analysis
2.4. Statistical Analysis
3. Results and Discussion
3.1. Fractionation Results
Mass Balance and Yield
3.2. Chemical Analysis—Assessment of the Lipids of CWO and Its Fractions
3.2.1. Assessment of the Lipids
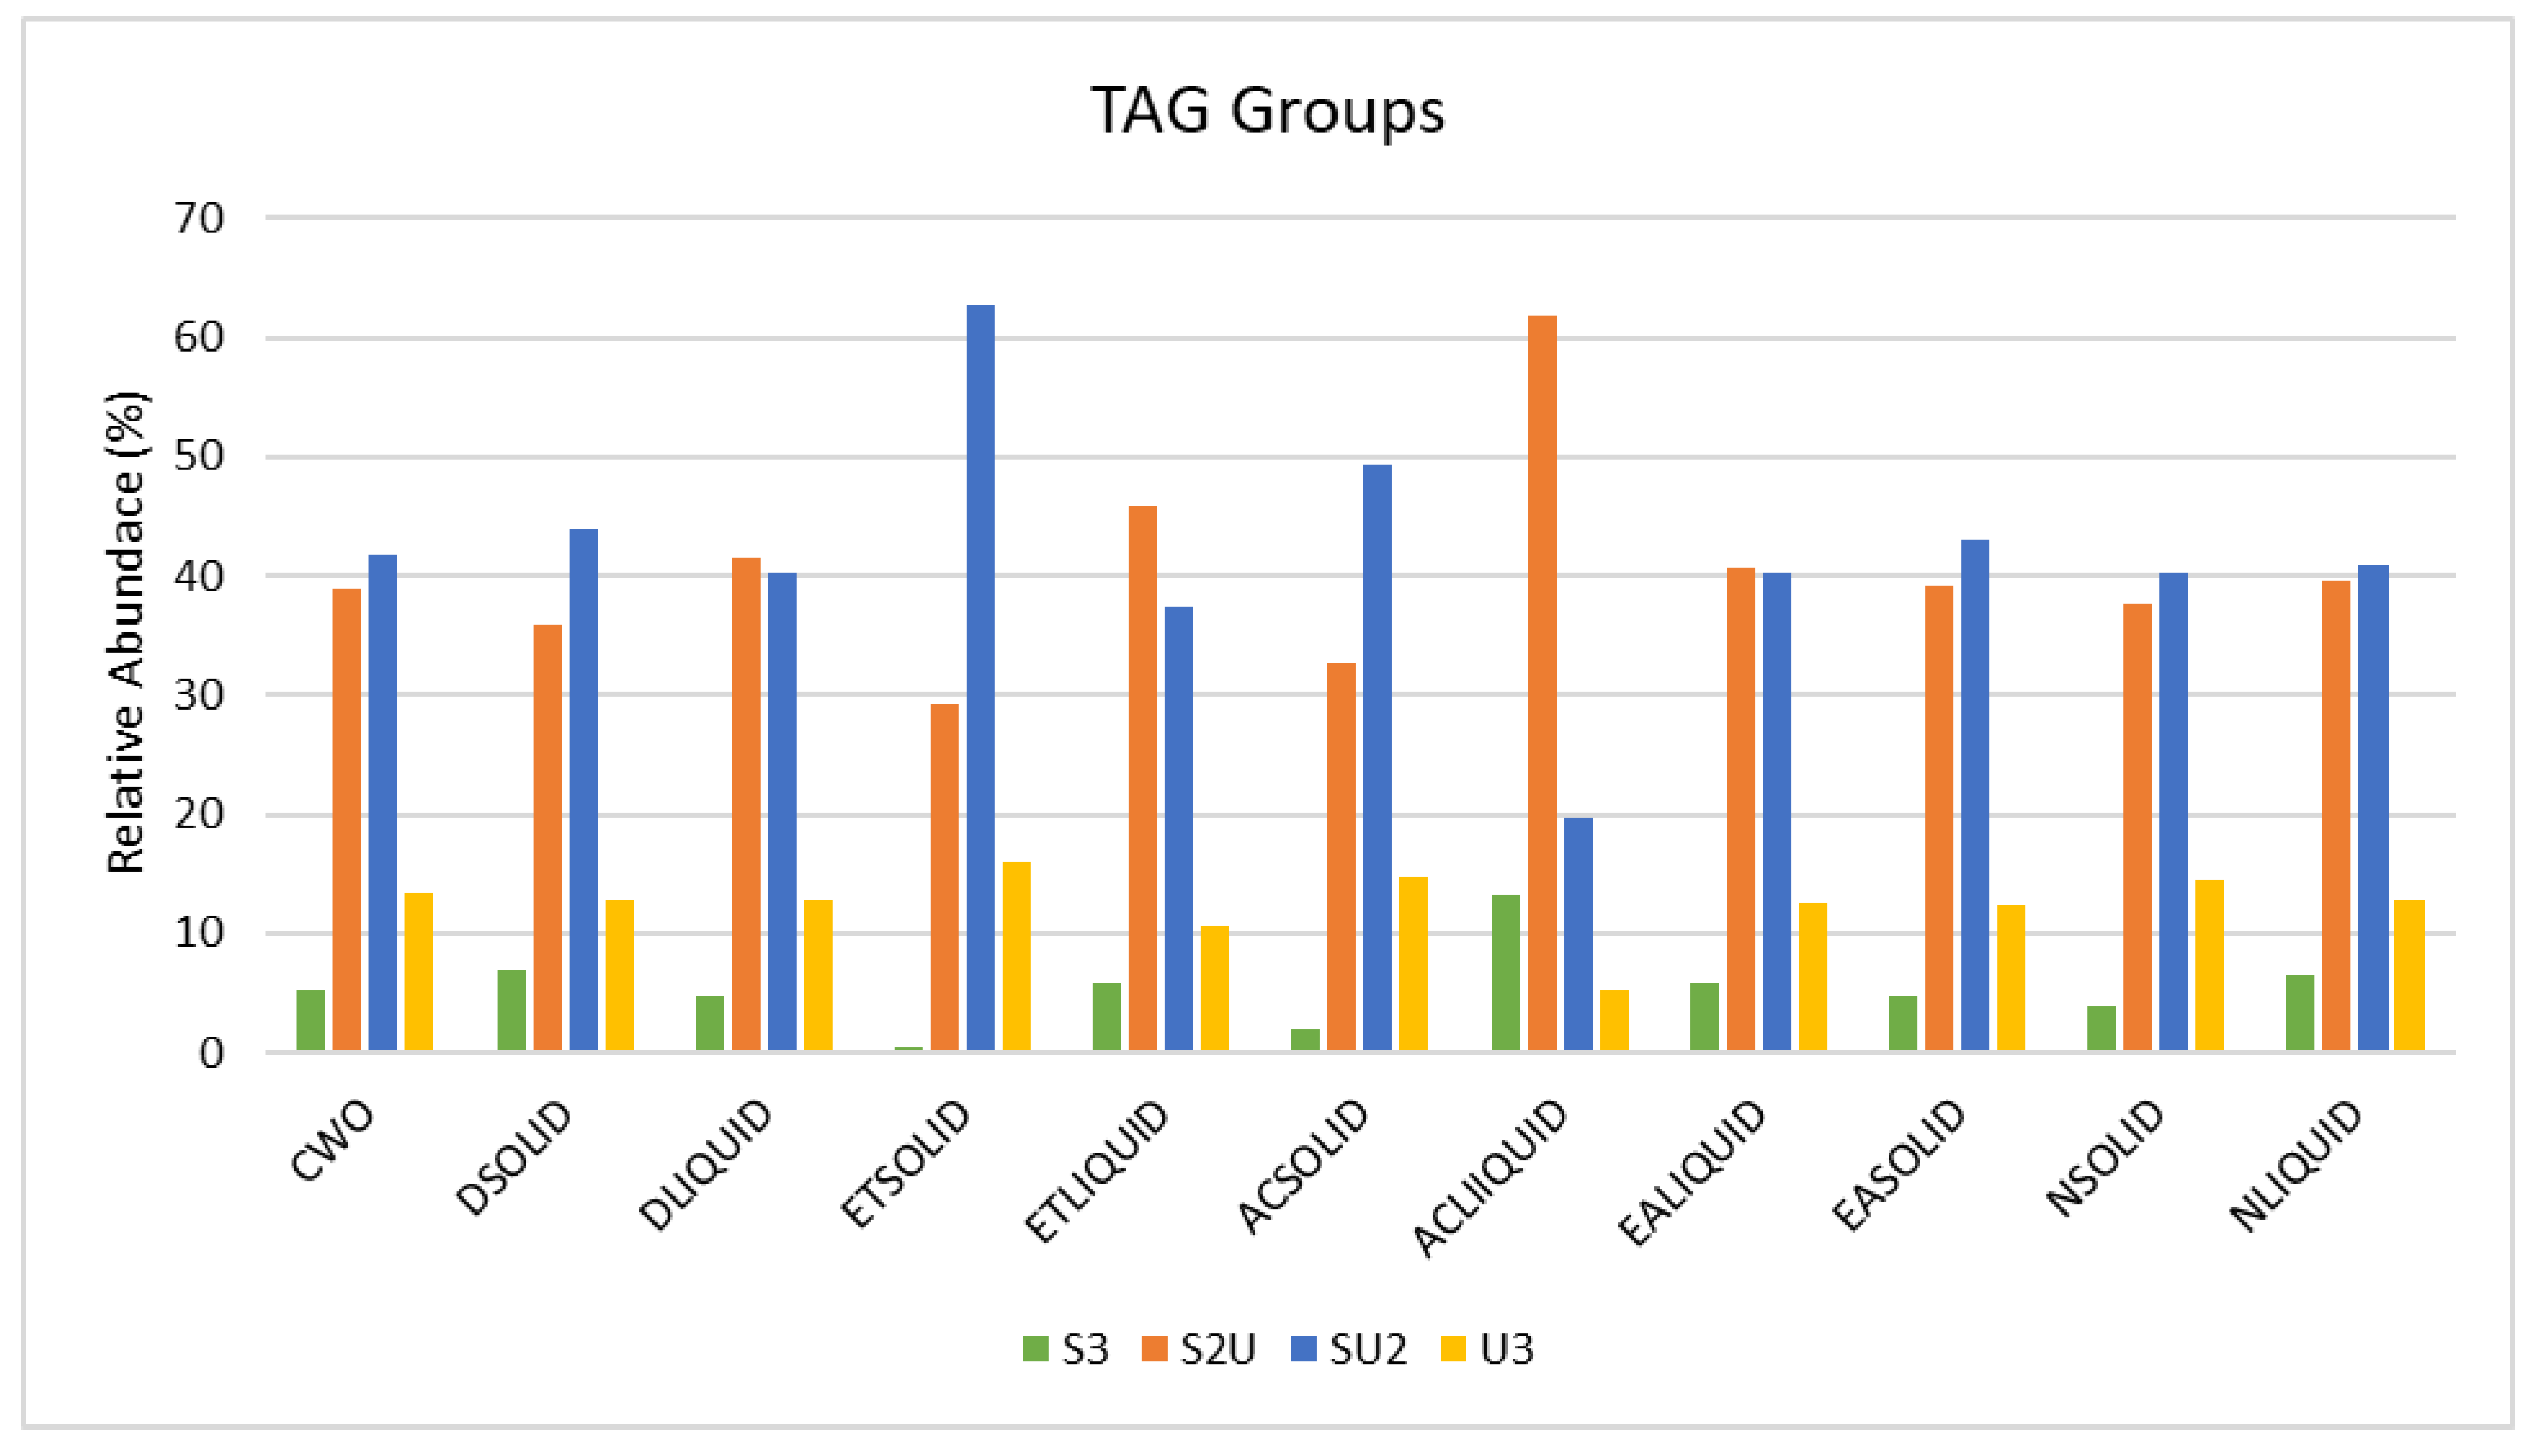
Assessment of the Triacylglycerols
Assessment of the Diacylglycerols and Monoacylglycerols
Assessment of the Free Fatty Acids
3.2.2. Assessment of the Unsaponifiable Compounds
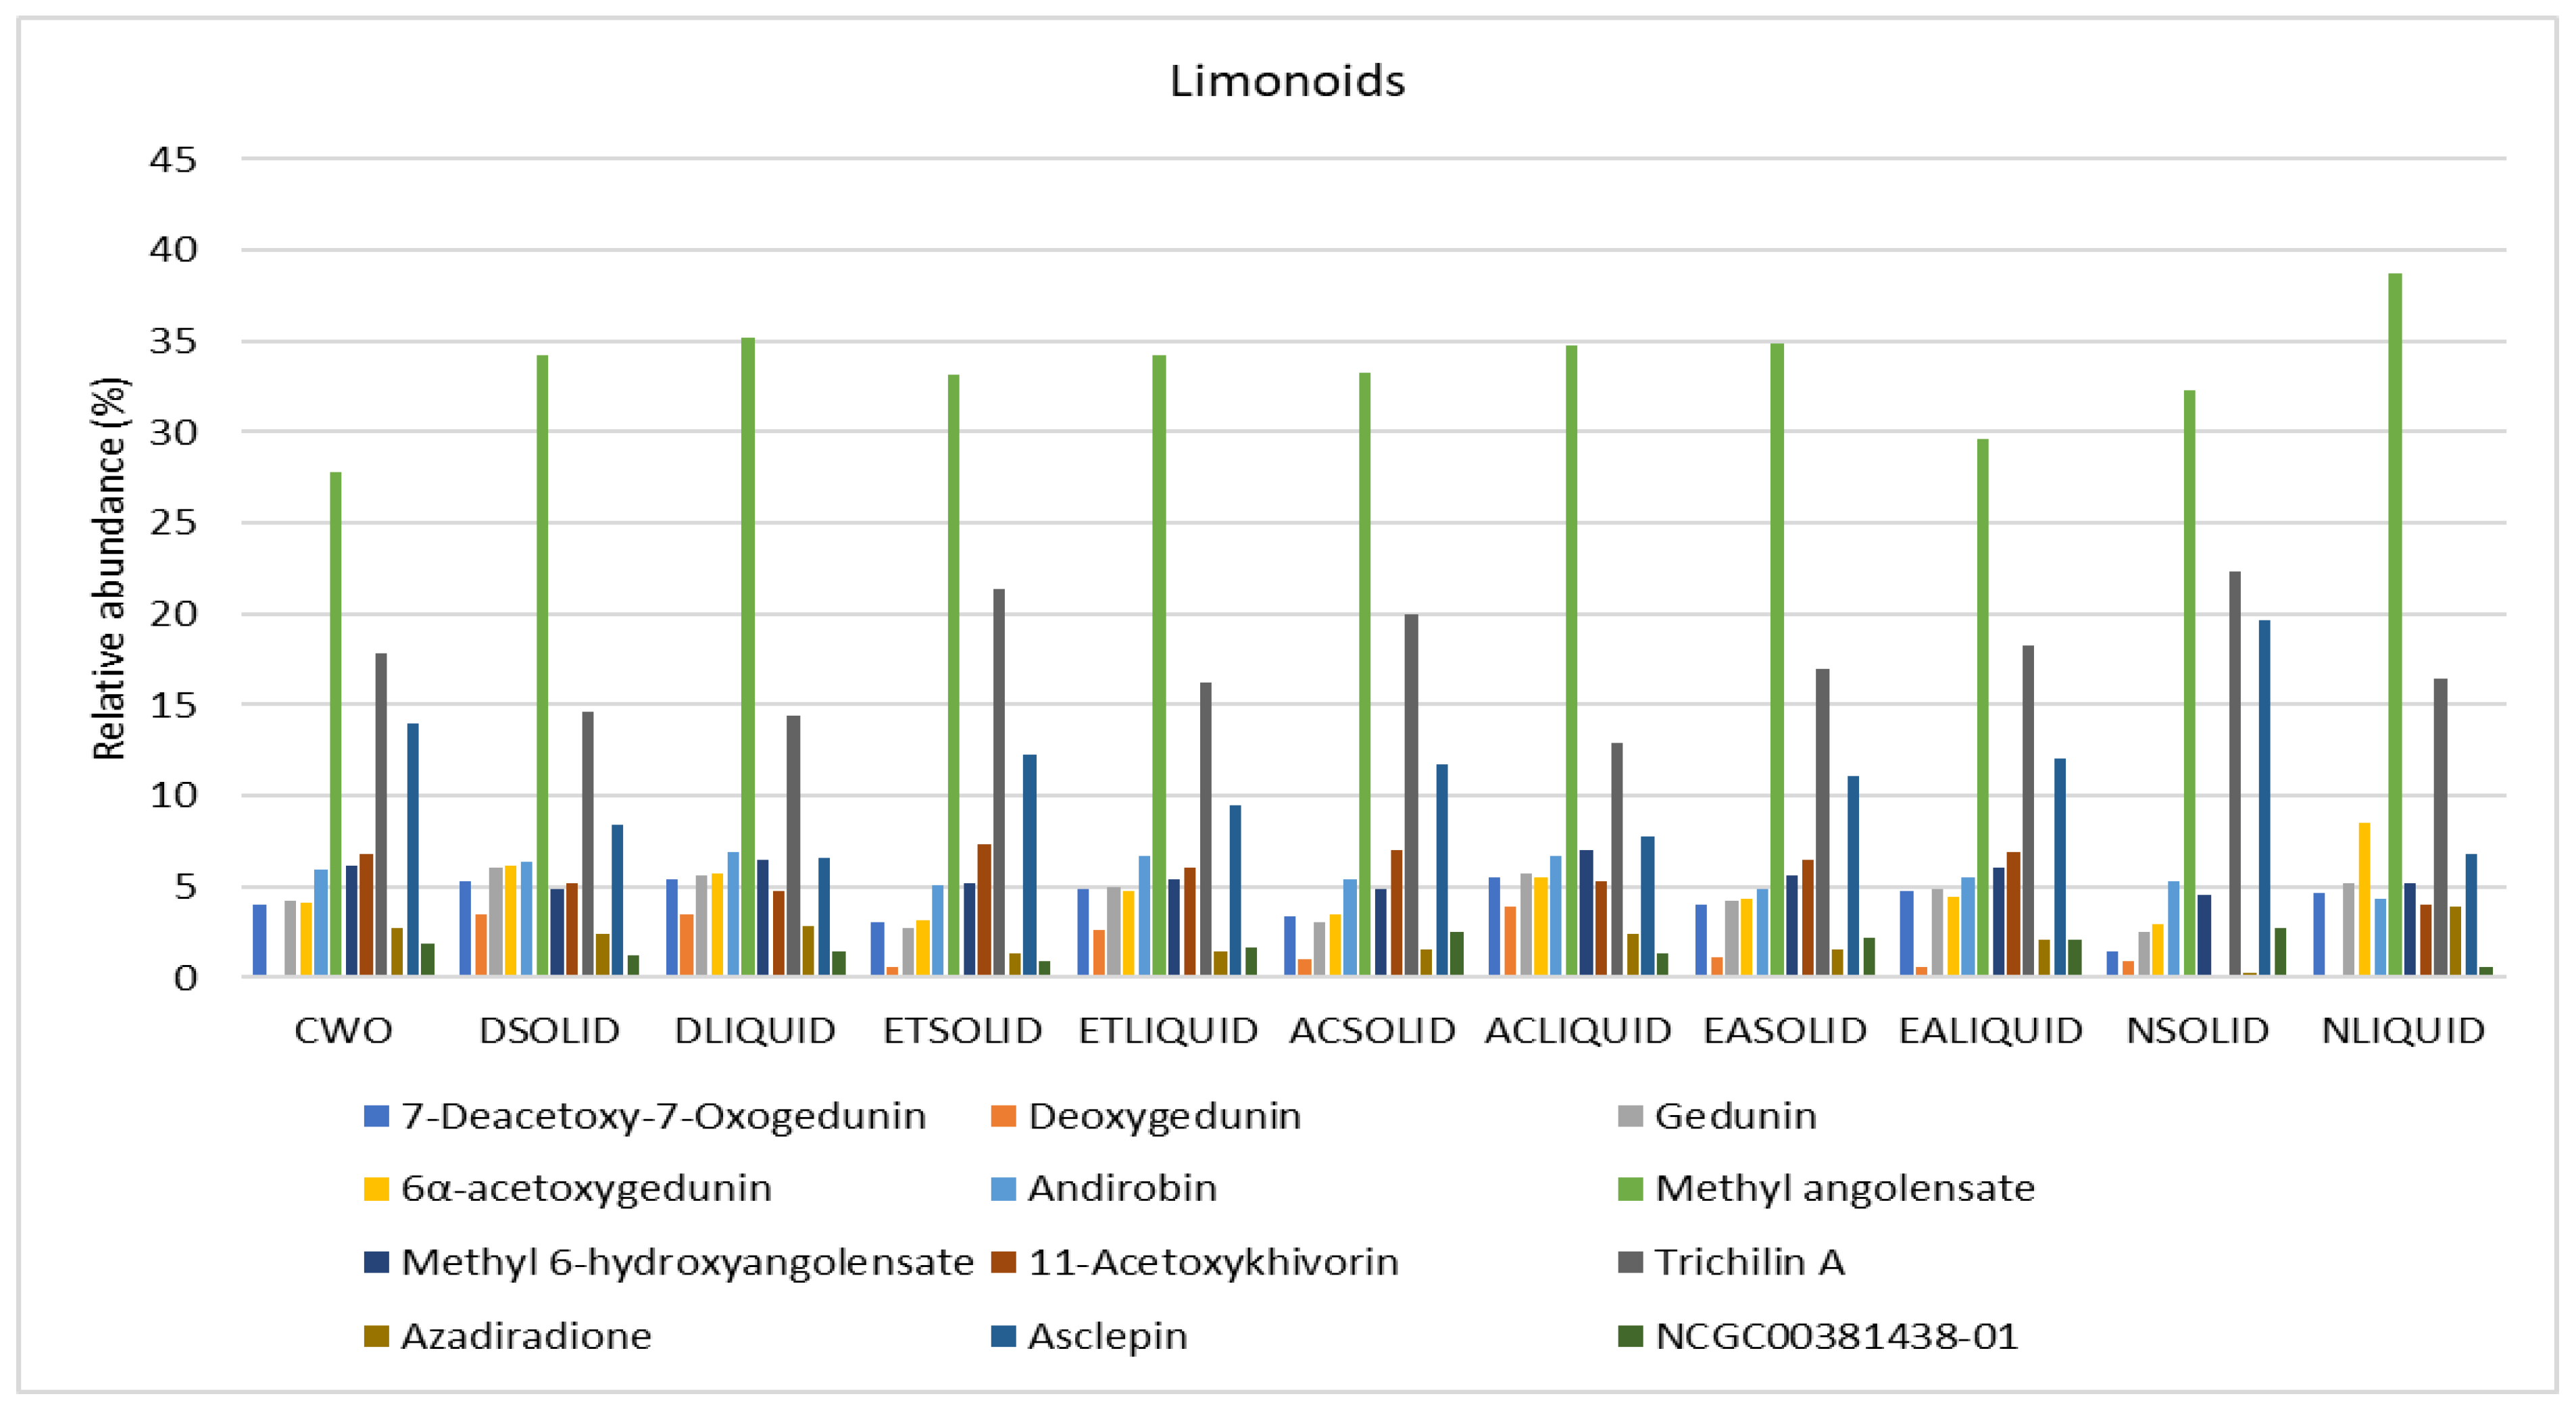
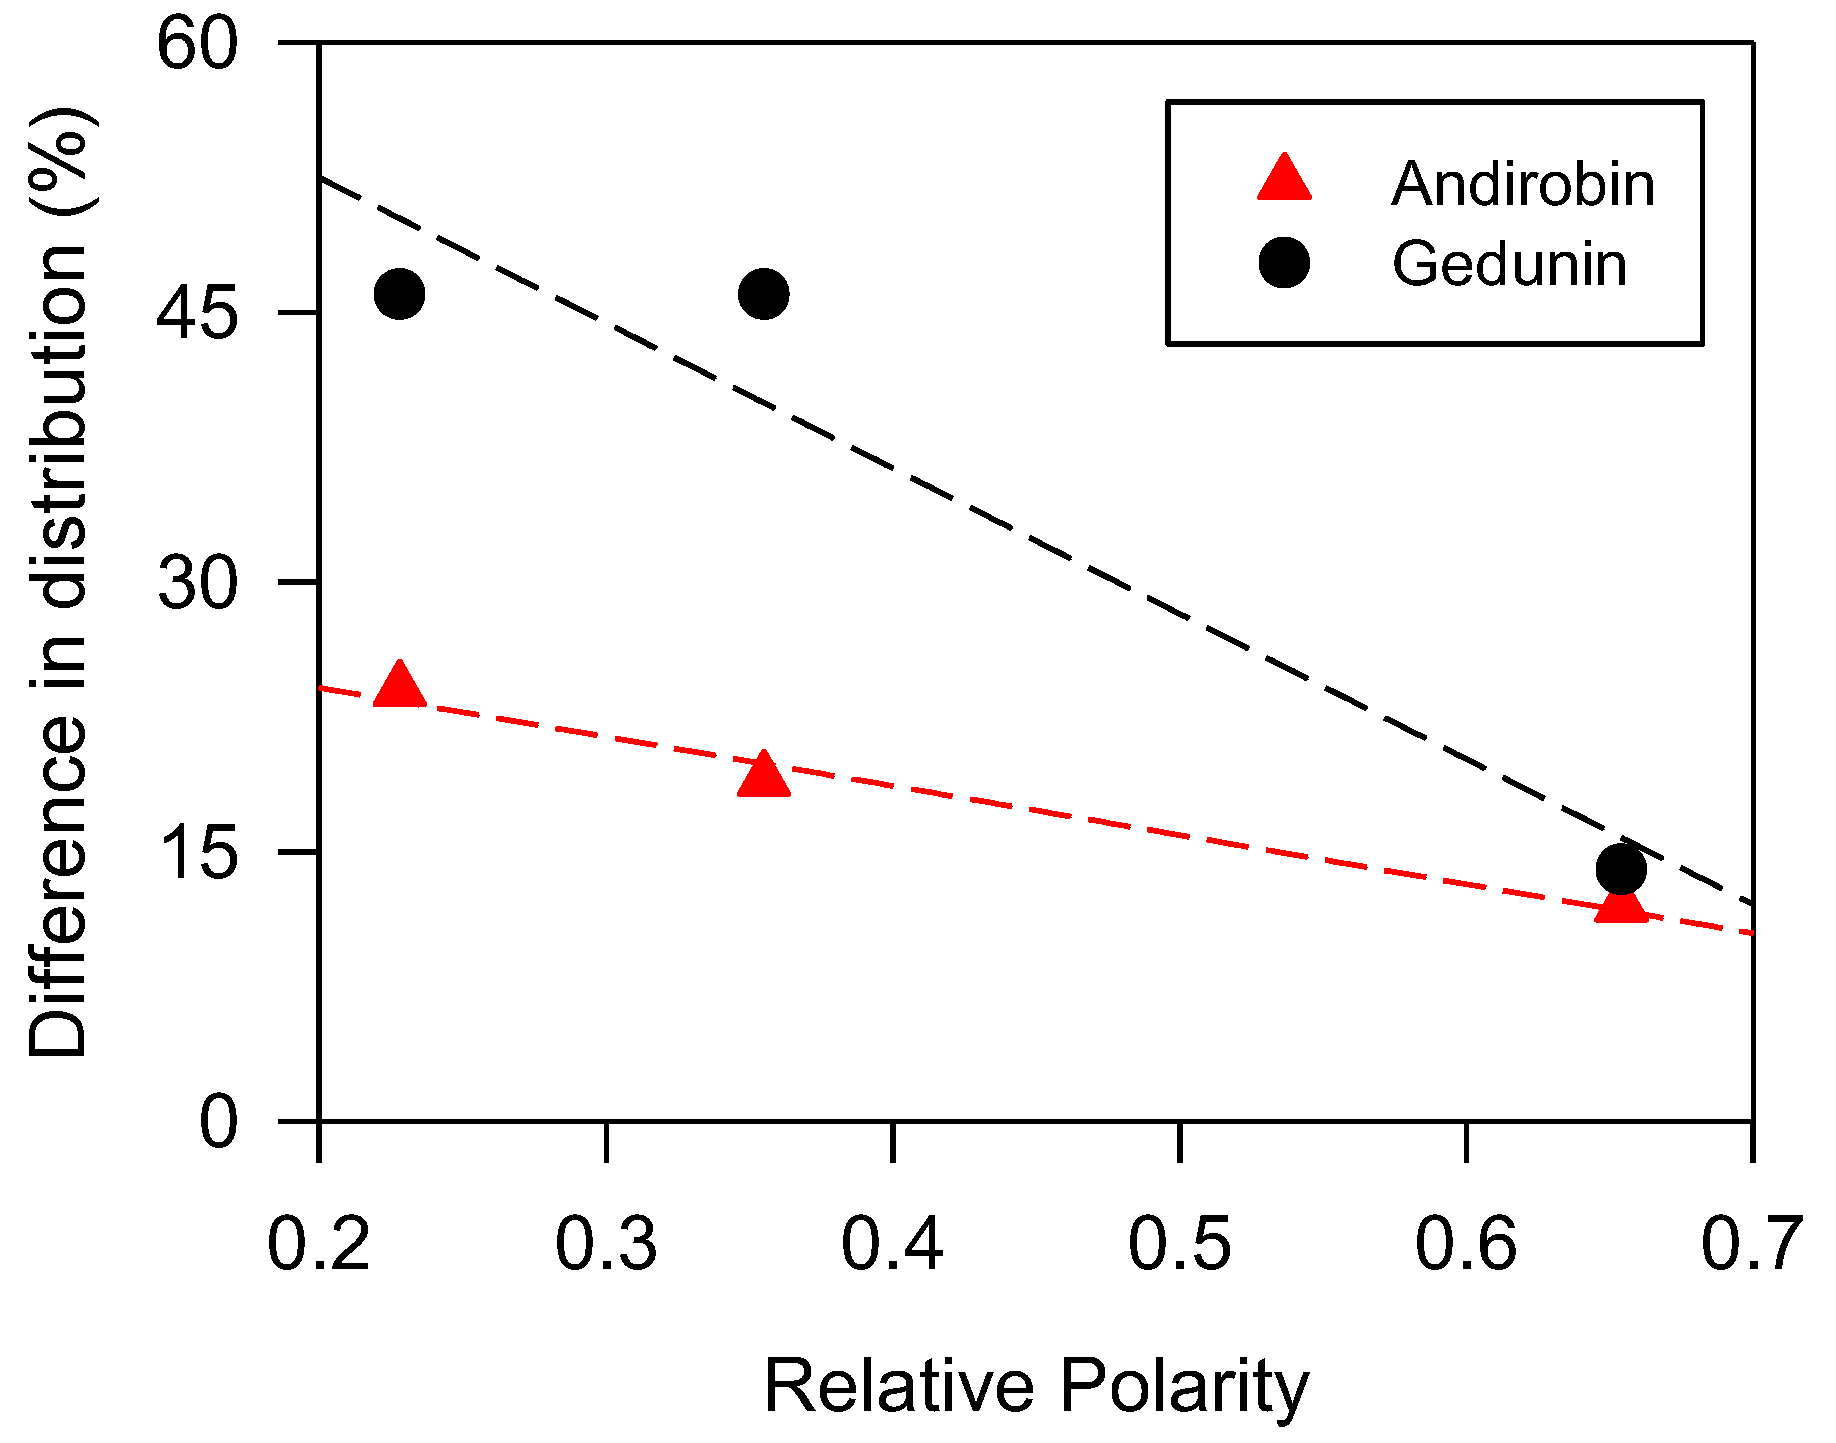
Assessment of the Limonoids
Assessment of the Sterols
Assessment of the Other Unsaponifiable Compounds
3.3. Thermal Transition Behavior
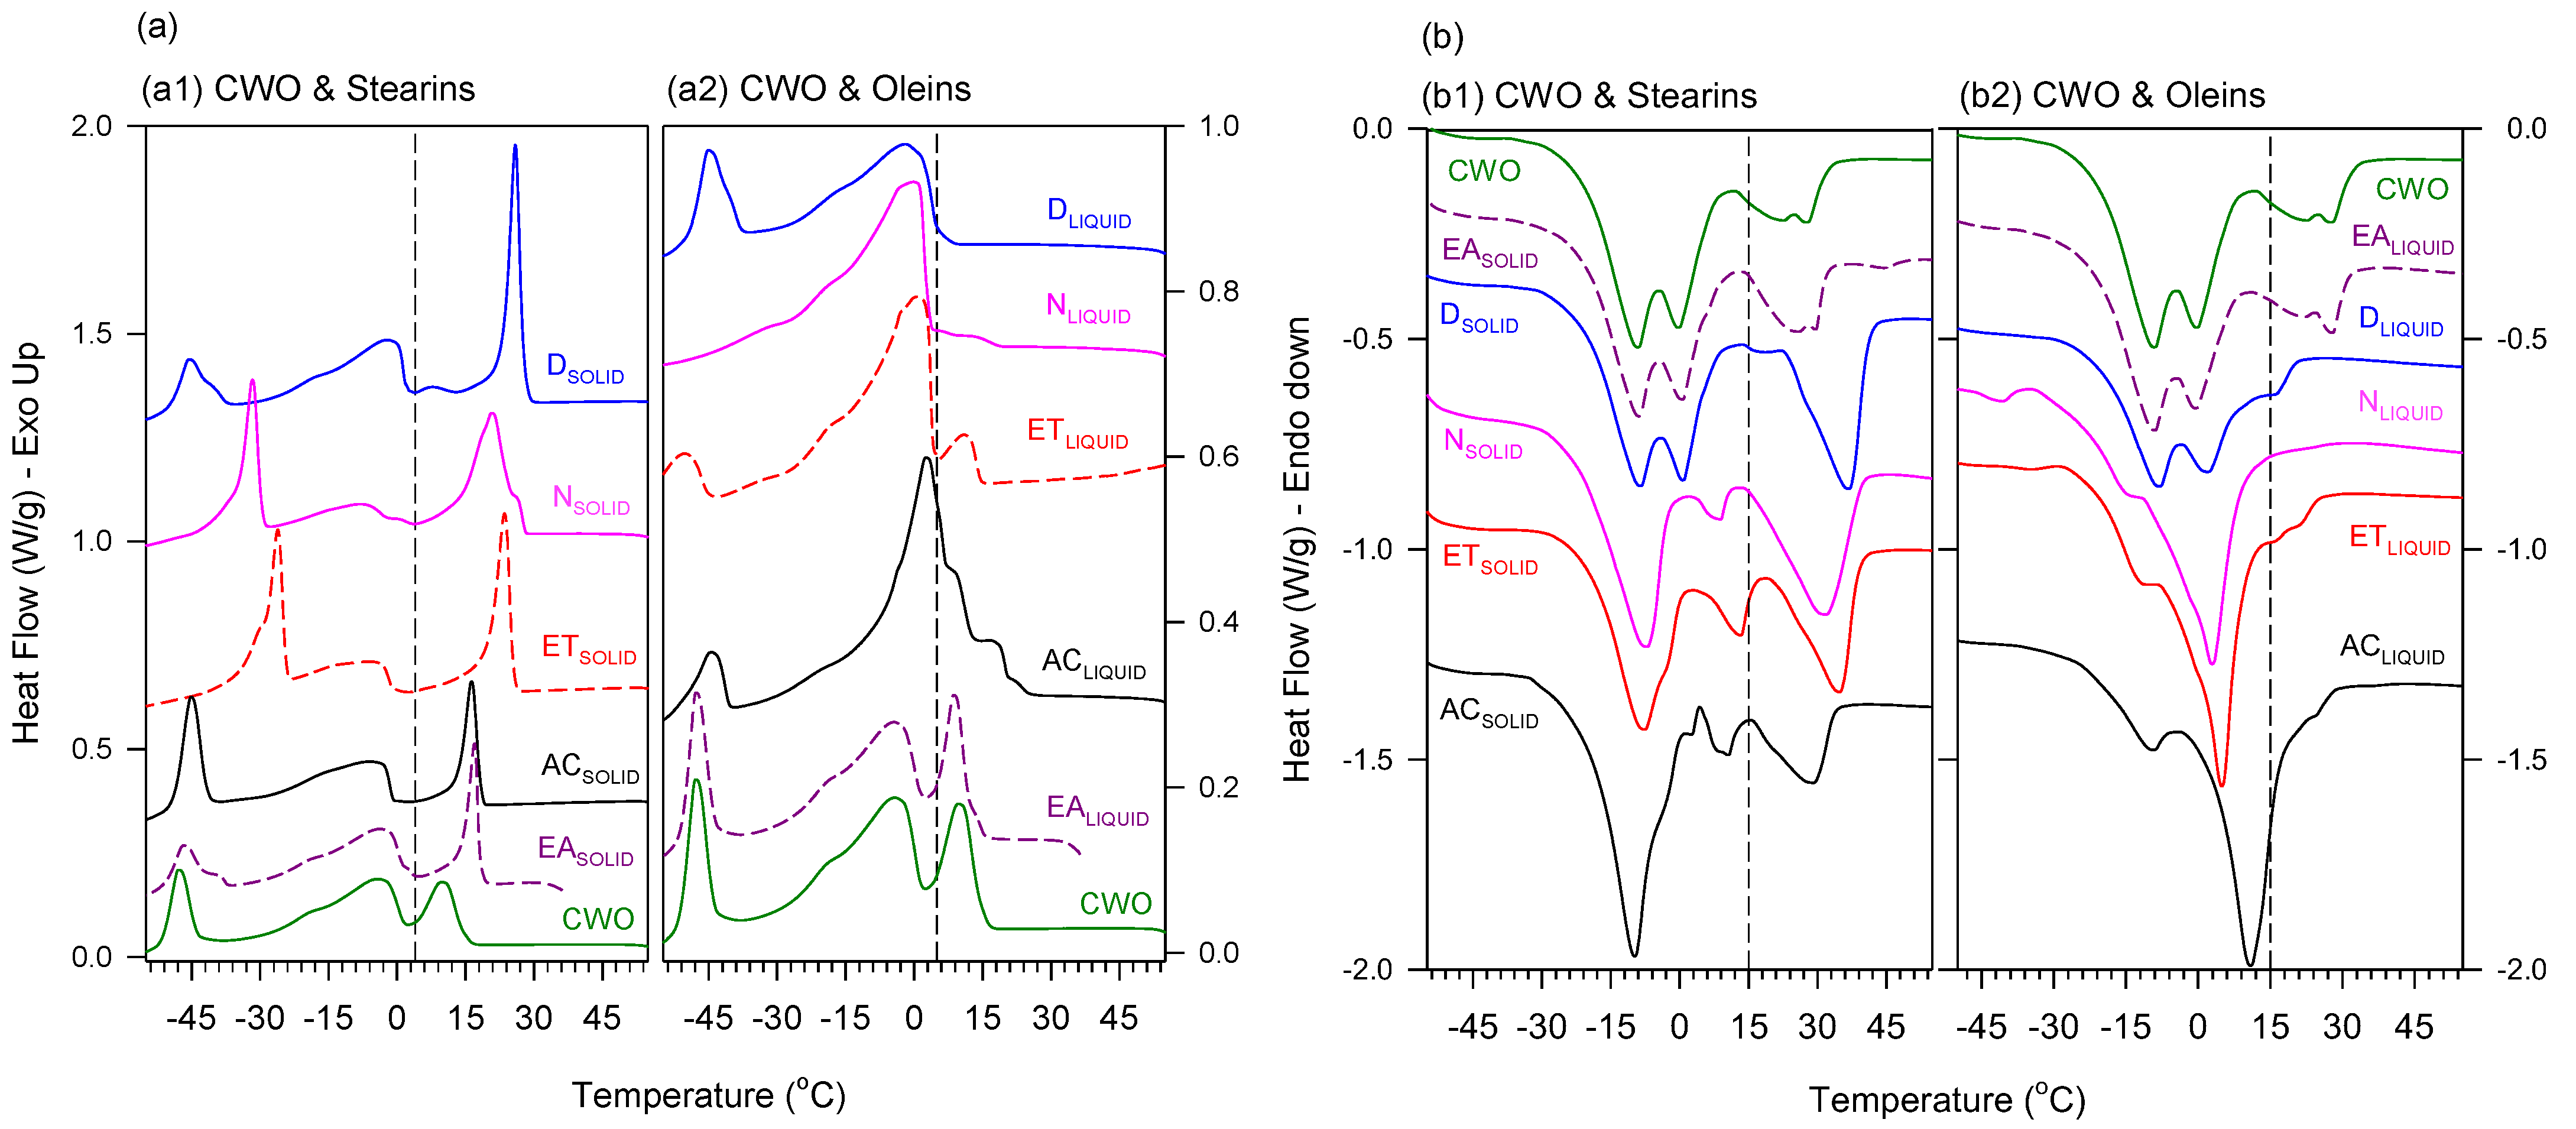
3.3.1. Crystallization Behavior
3.3.2. Melting Behavior
3.3.3. Thermal Transition Behavior and Lipid Profile
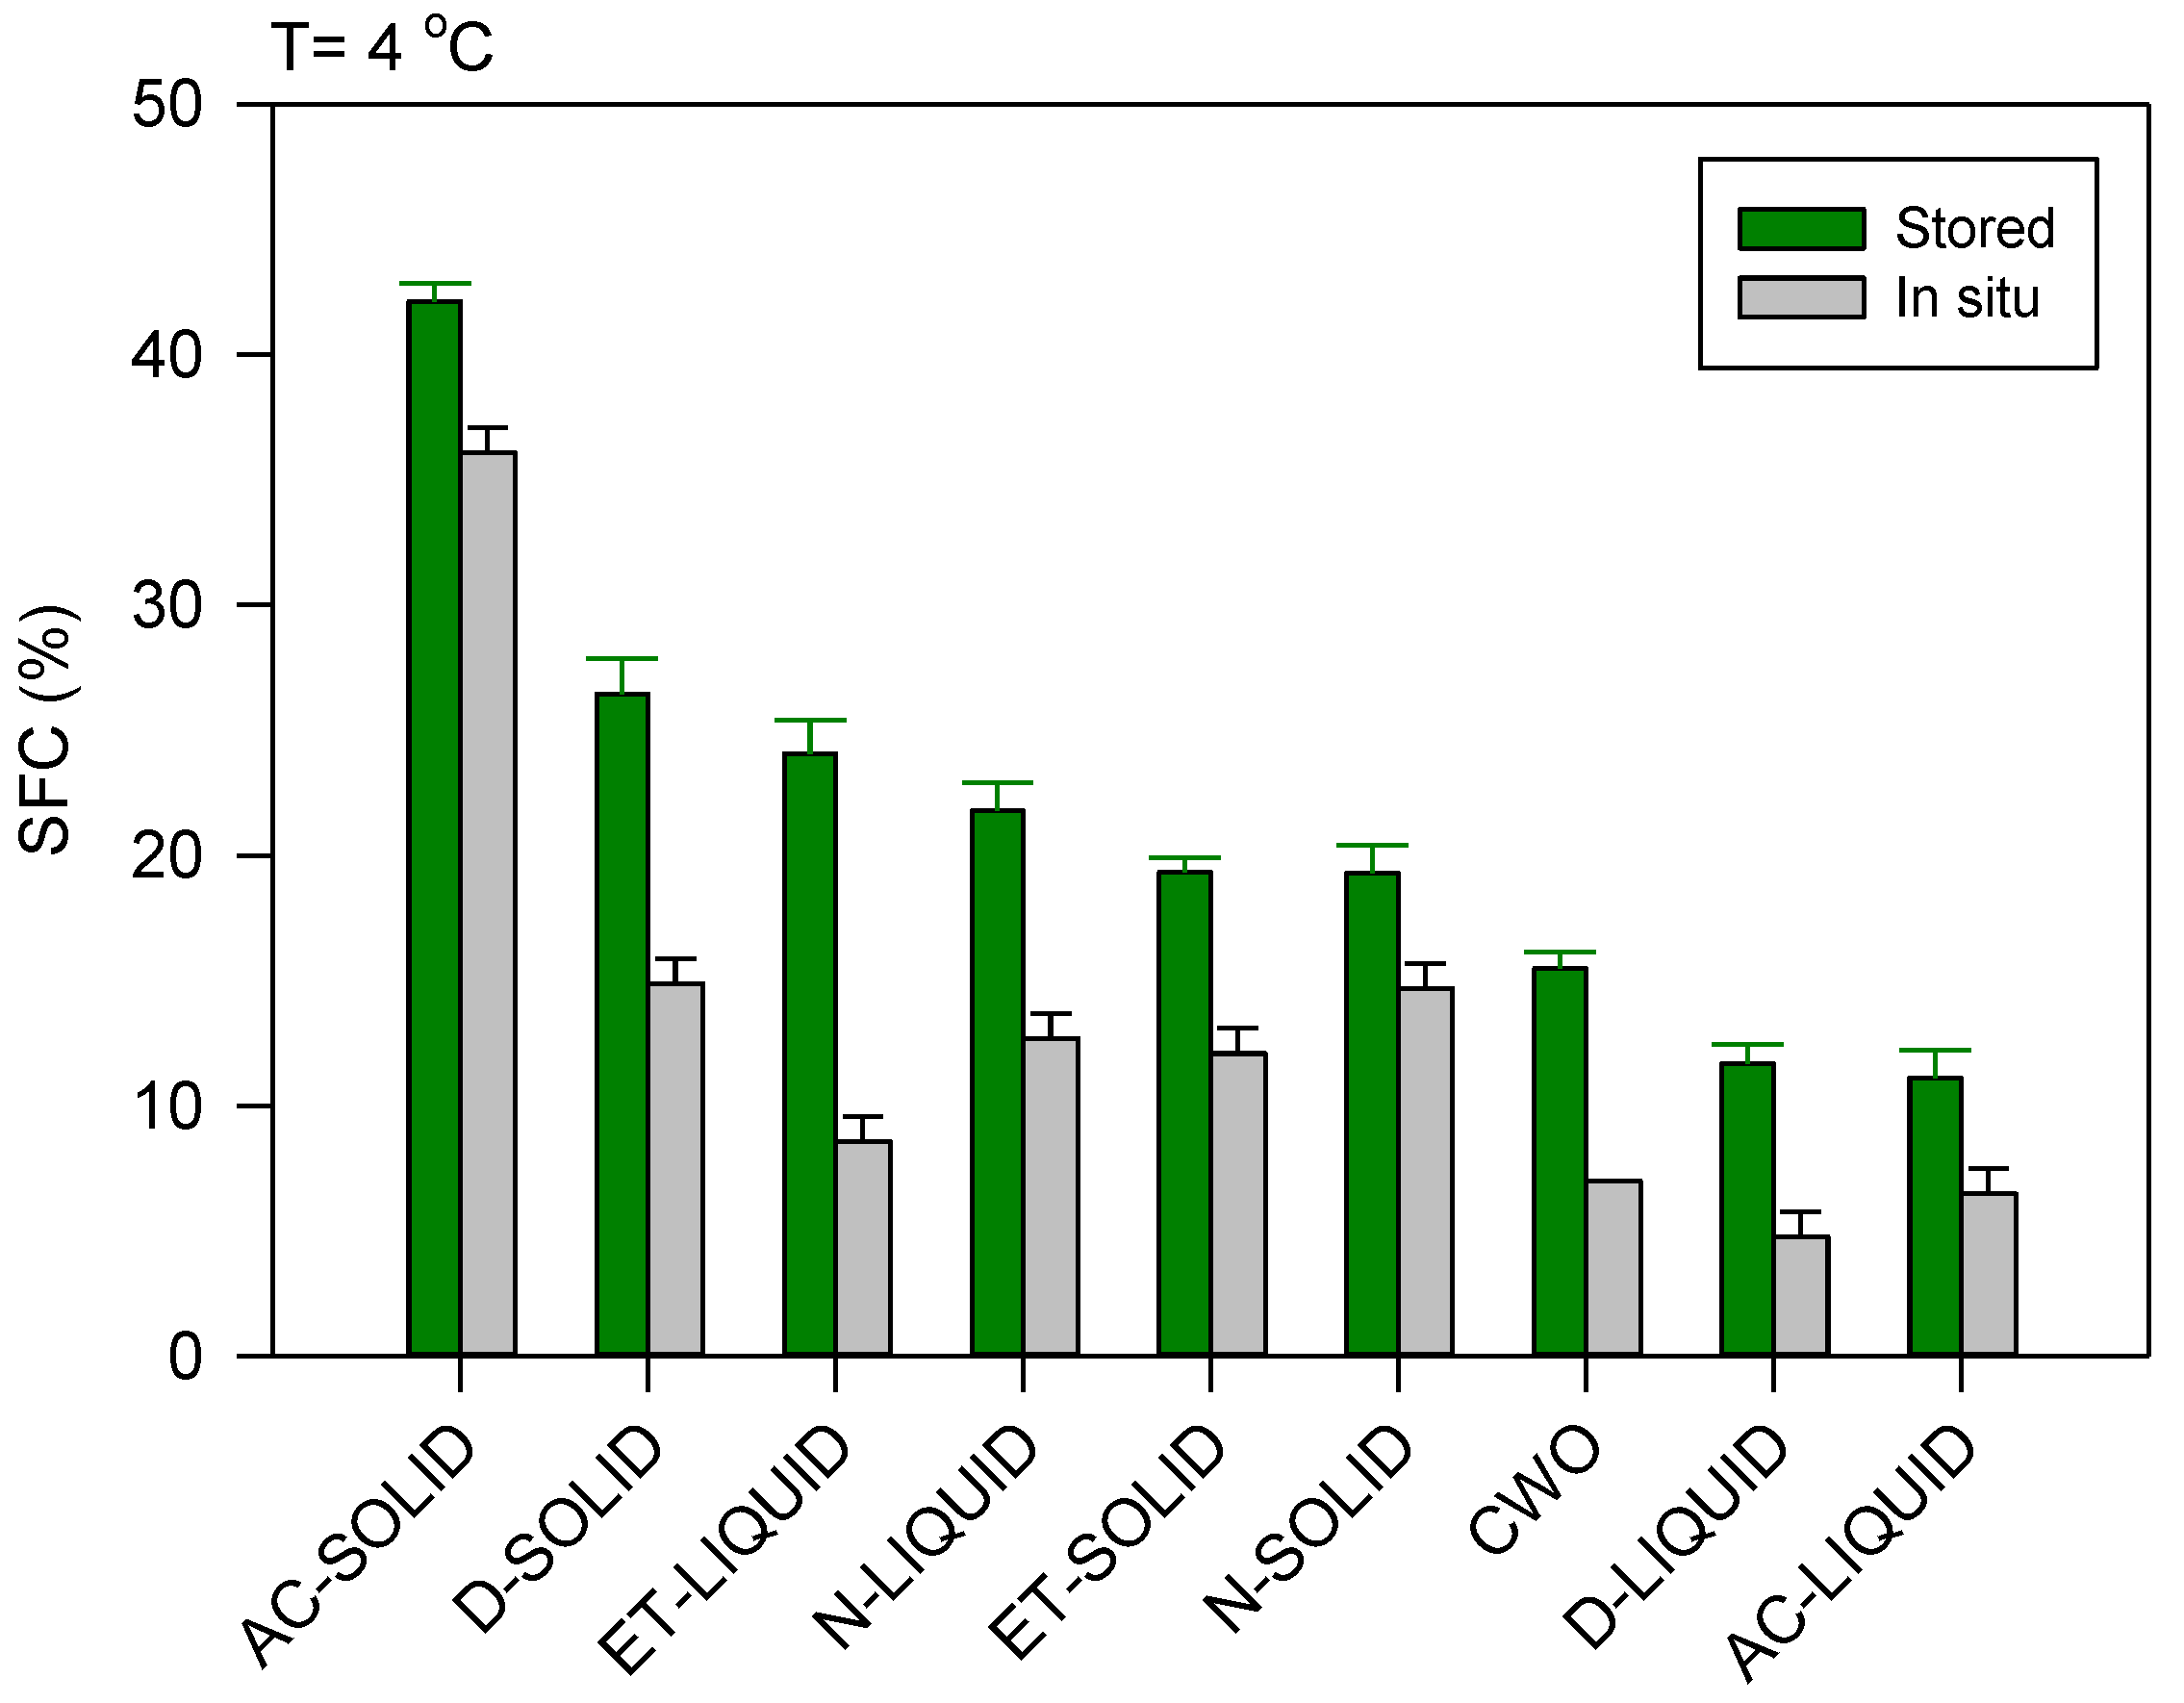
3.4. Solid Fat Content
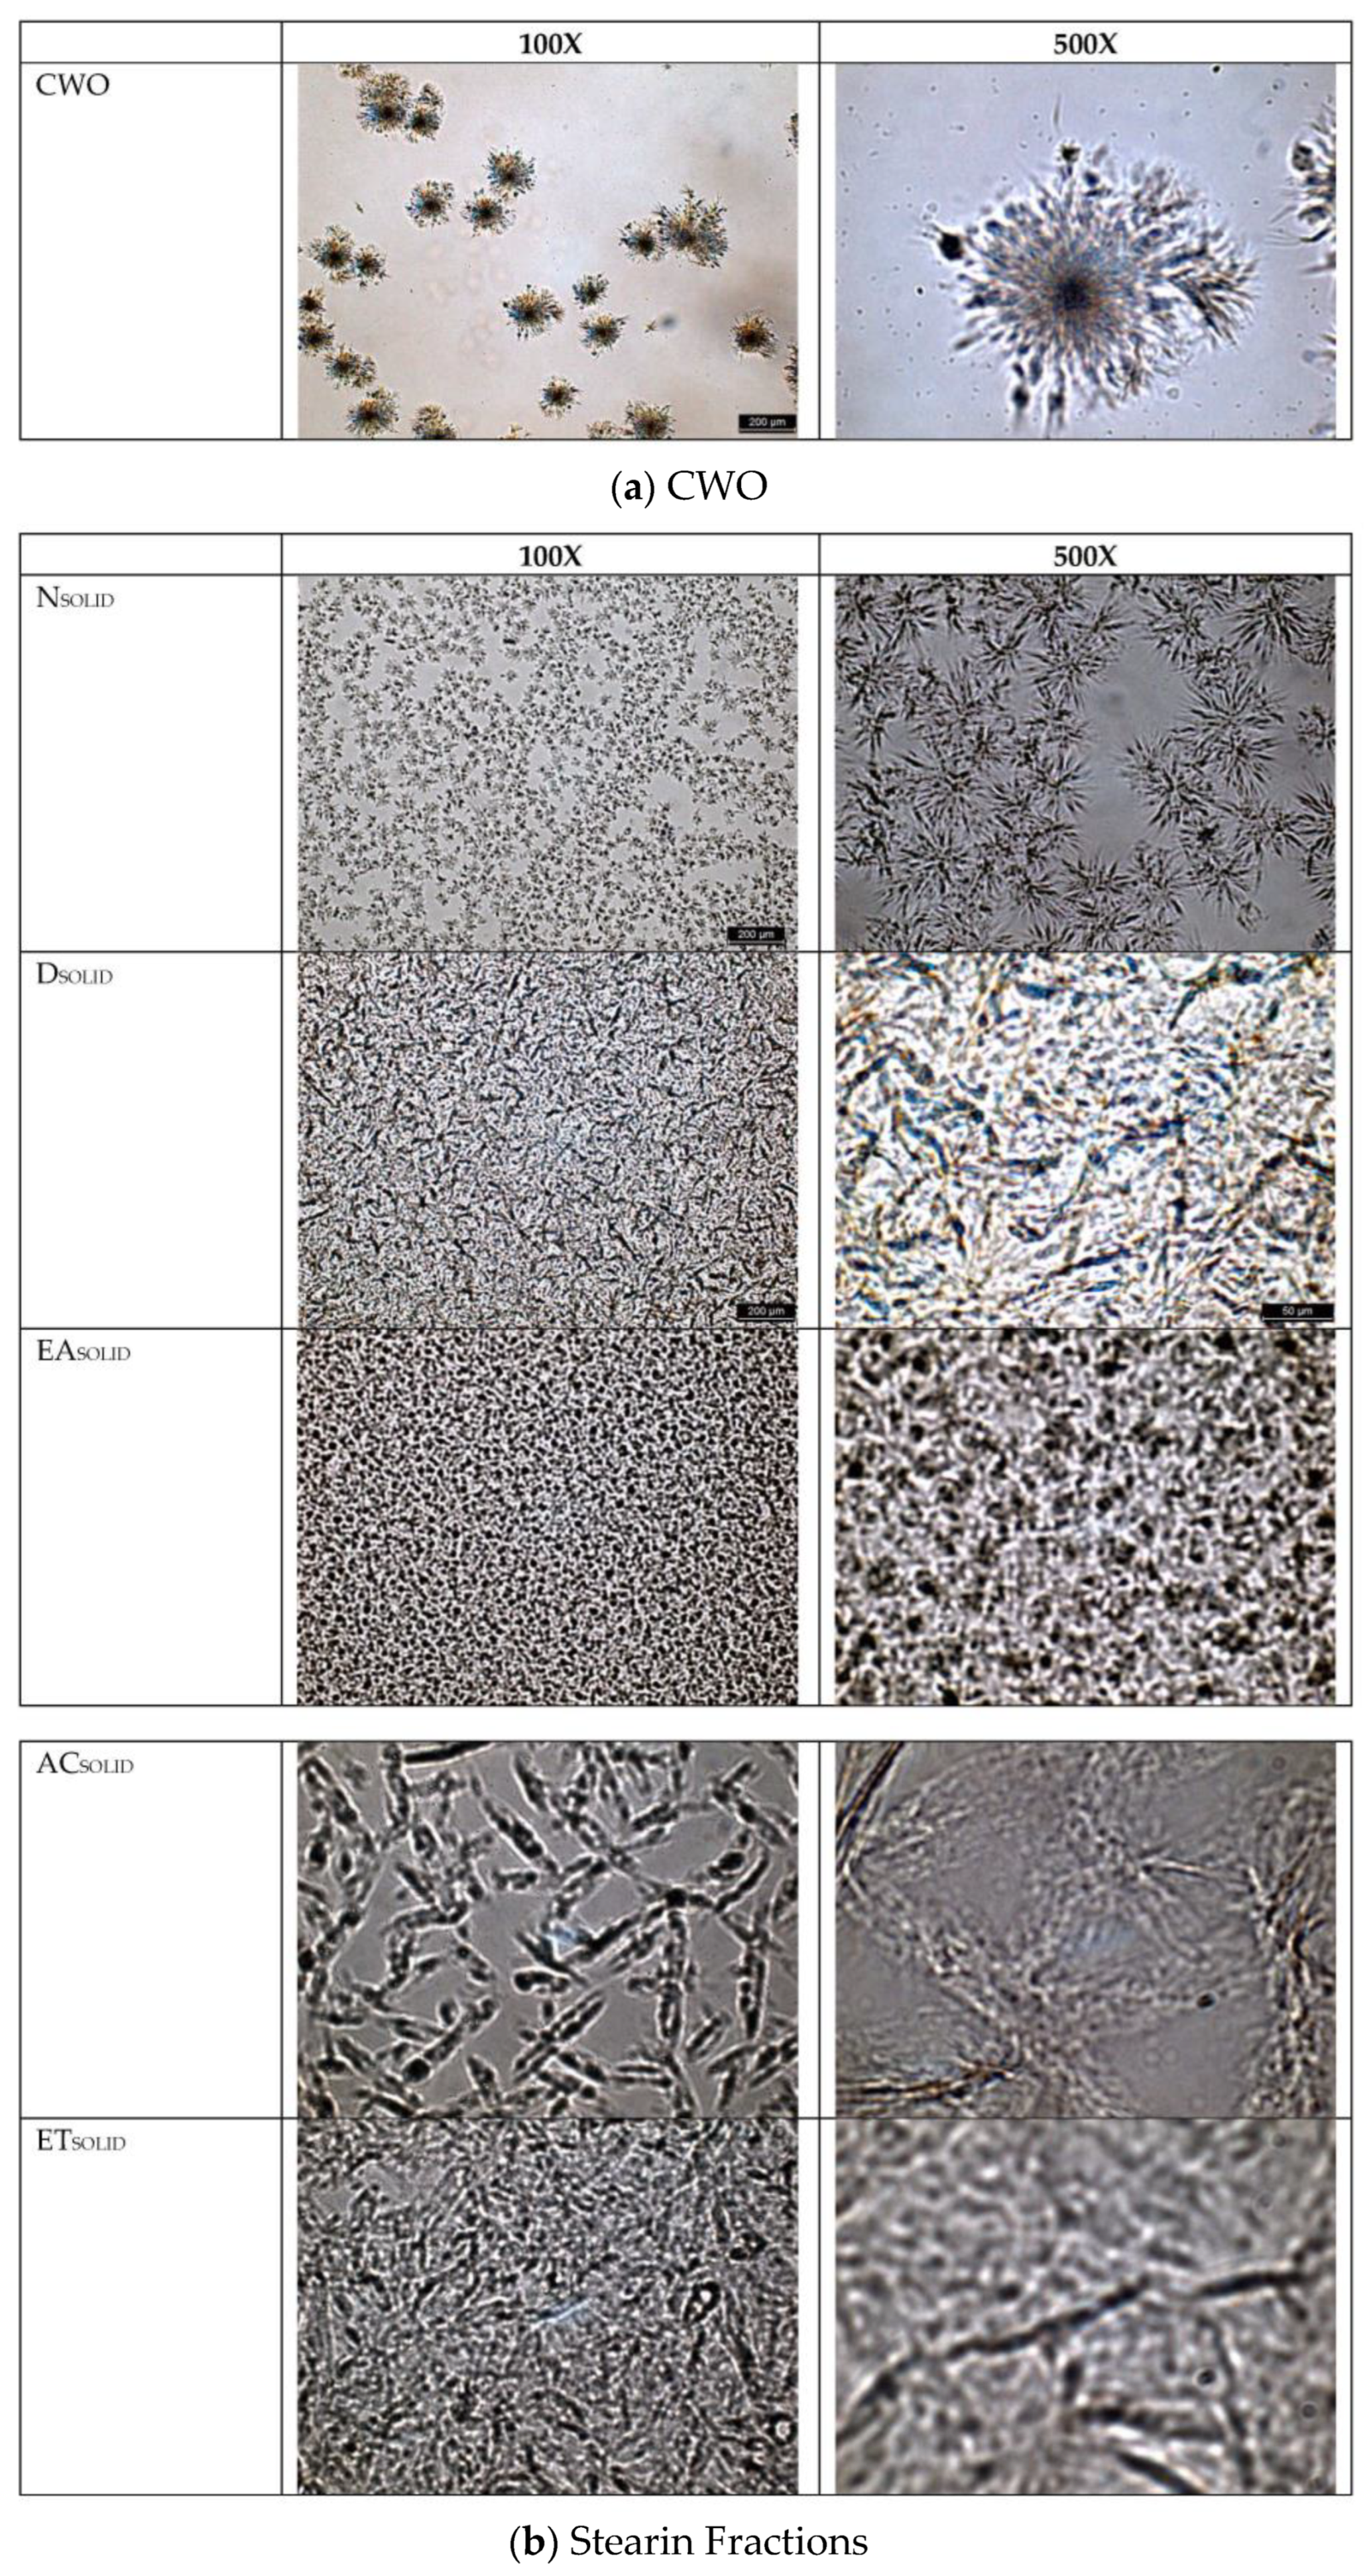
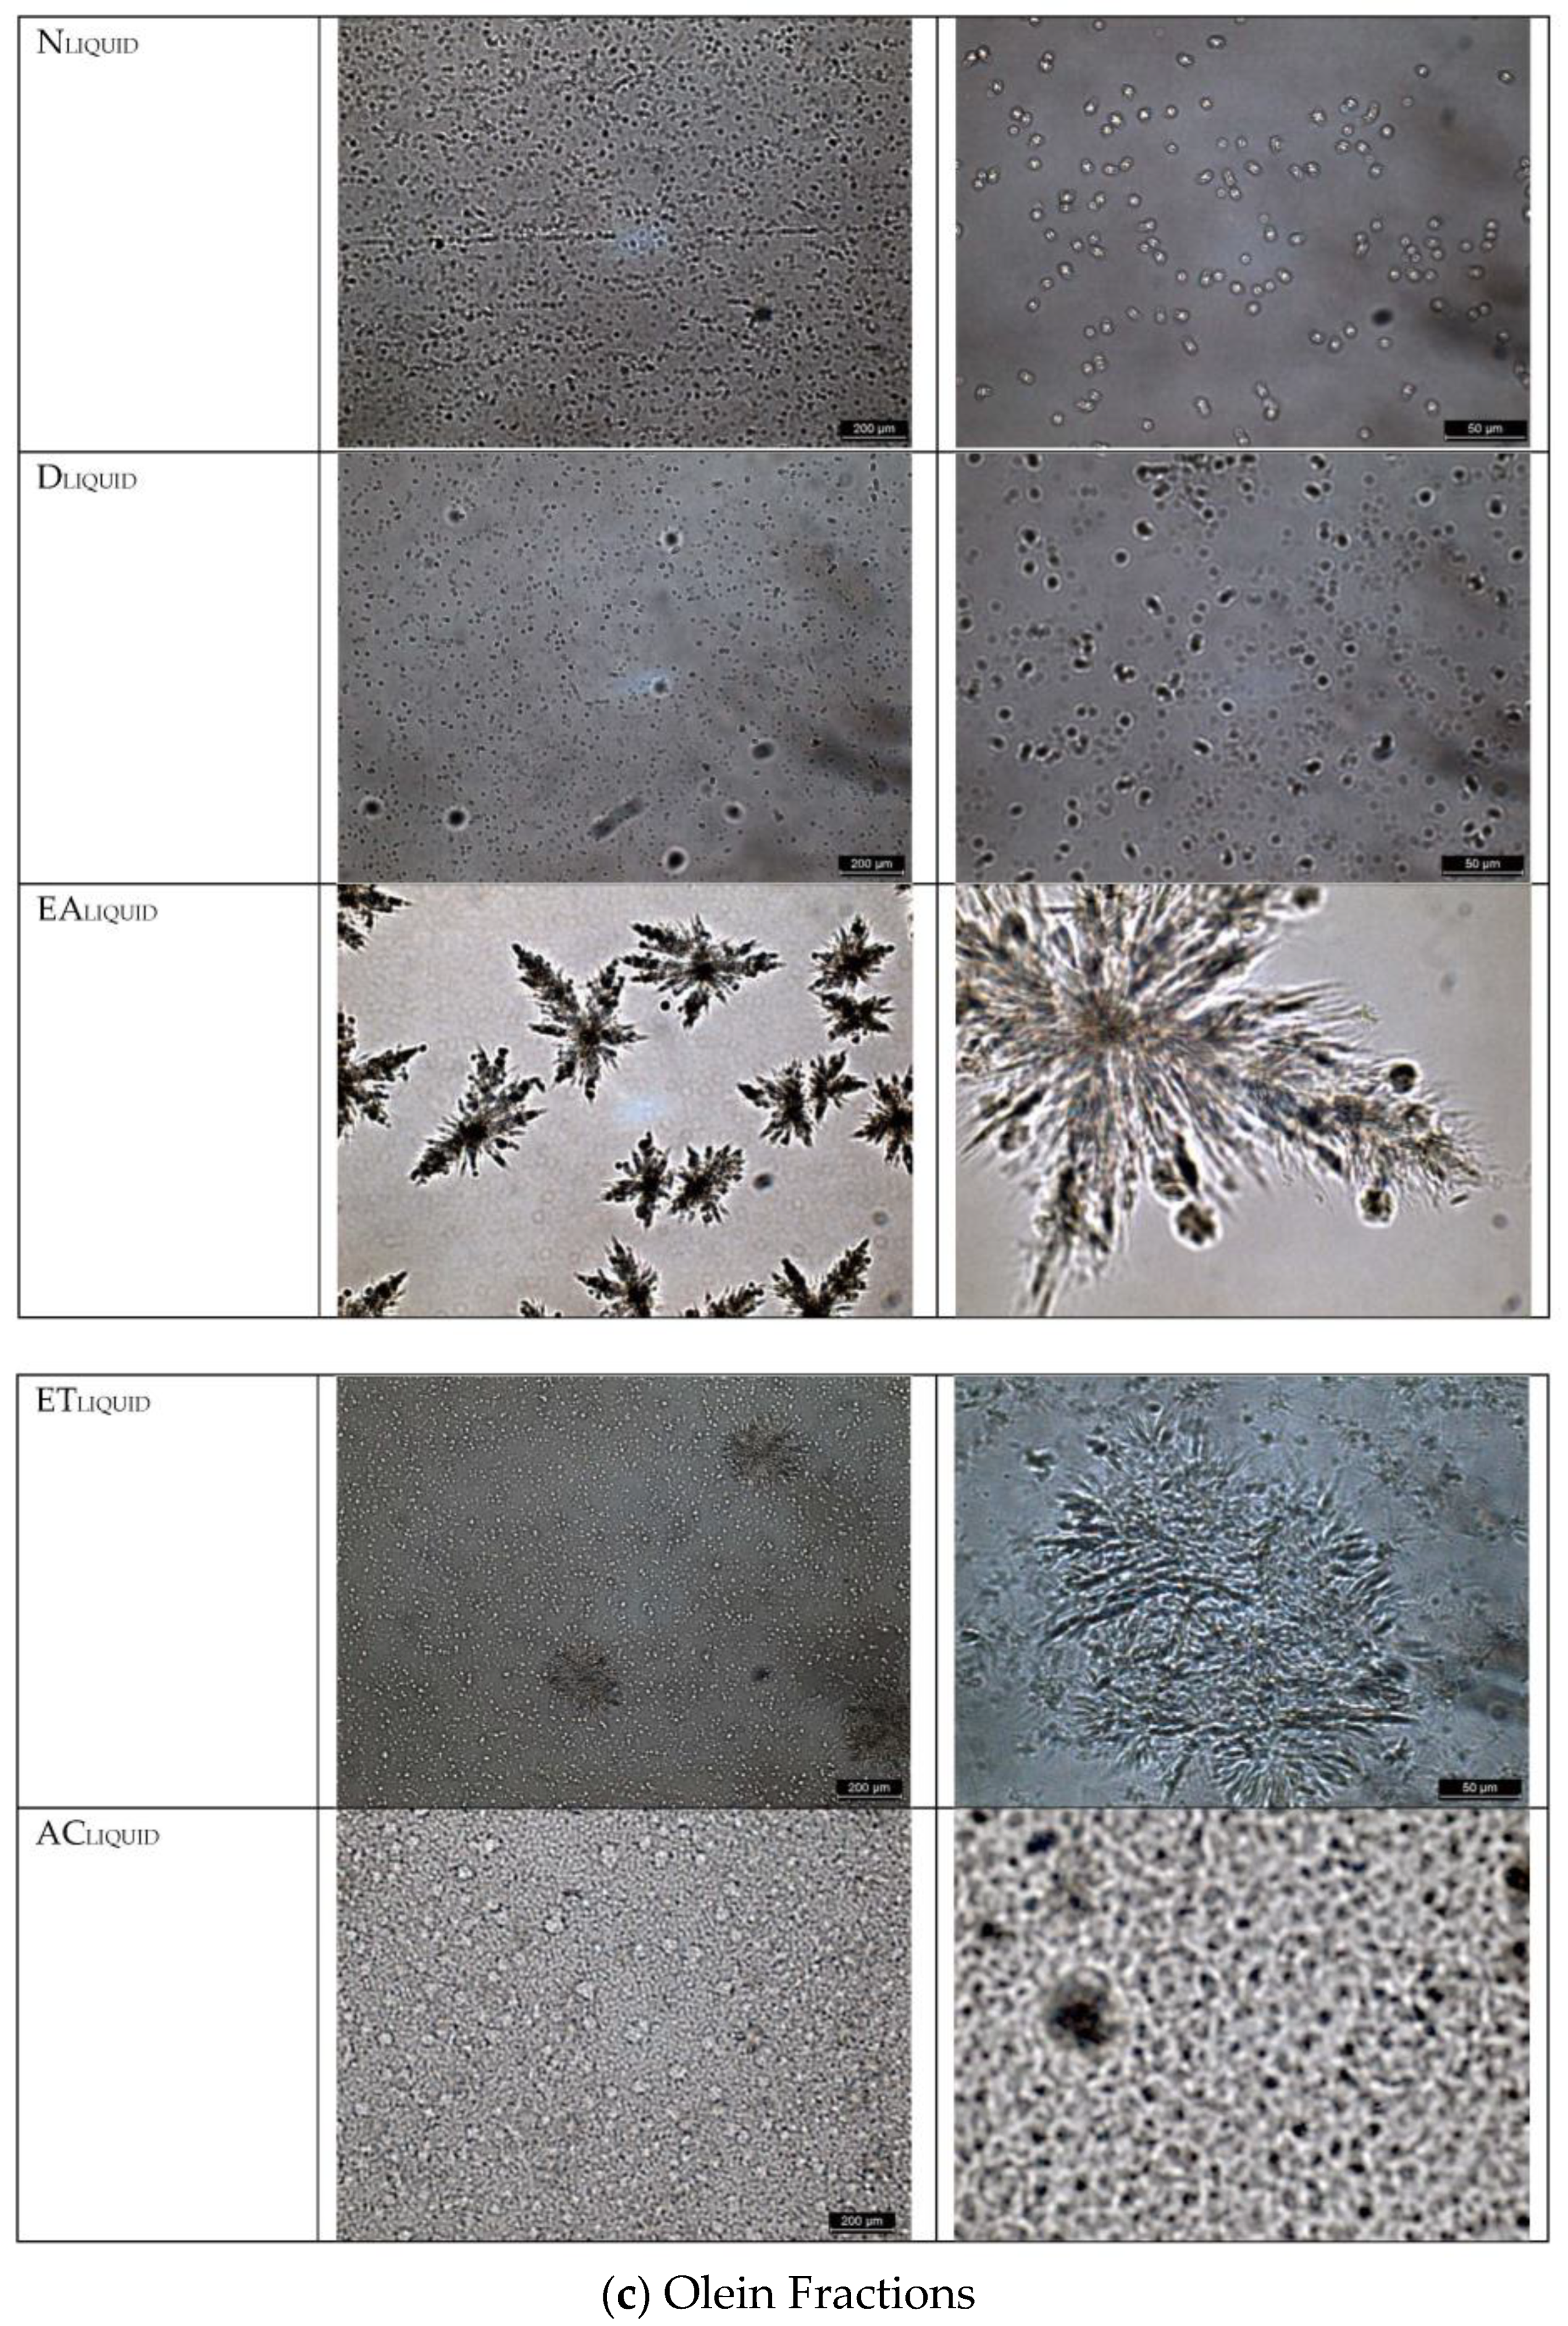
3.5. Microstructure of Crabwood Oil and Its Fractions
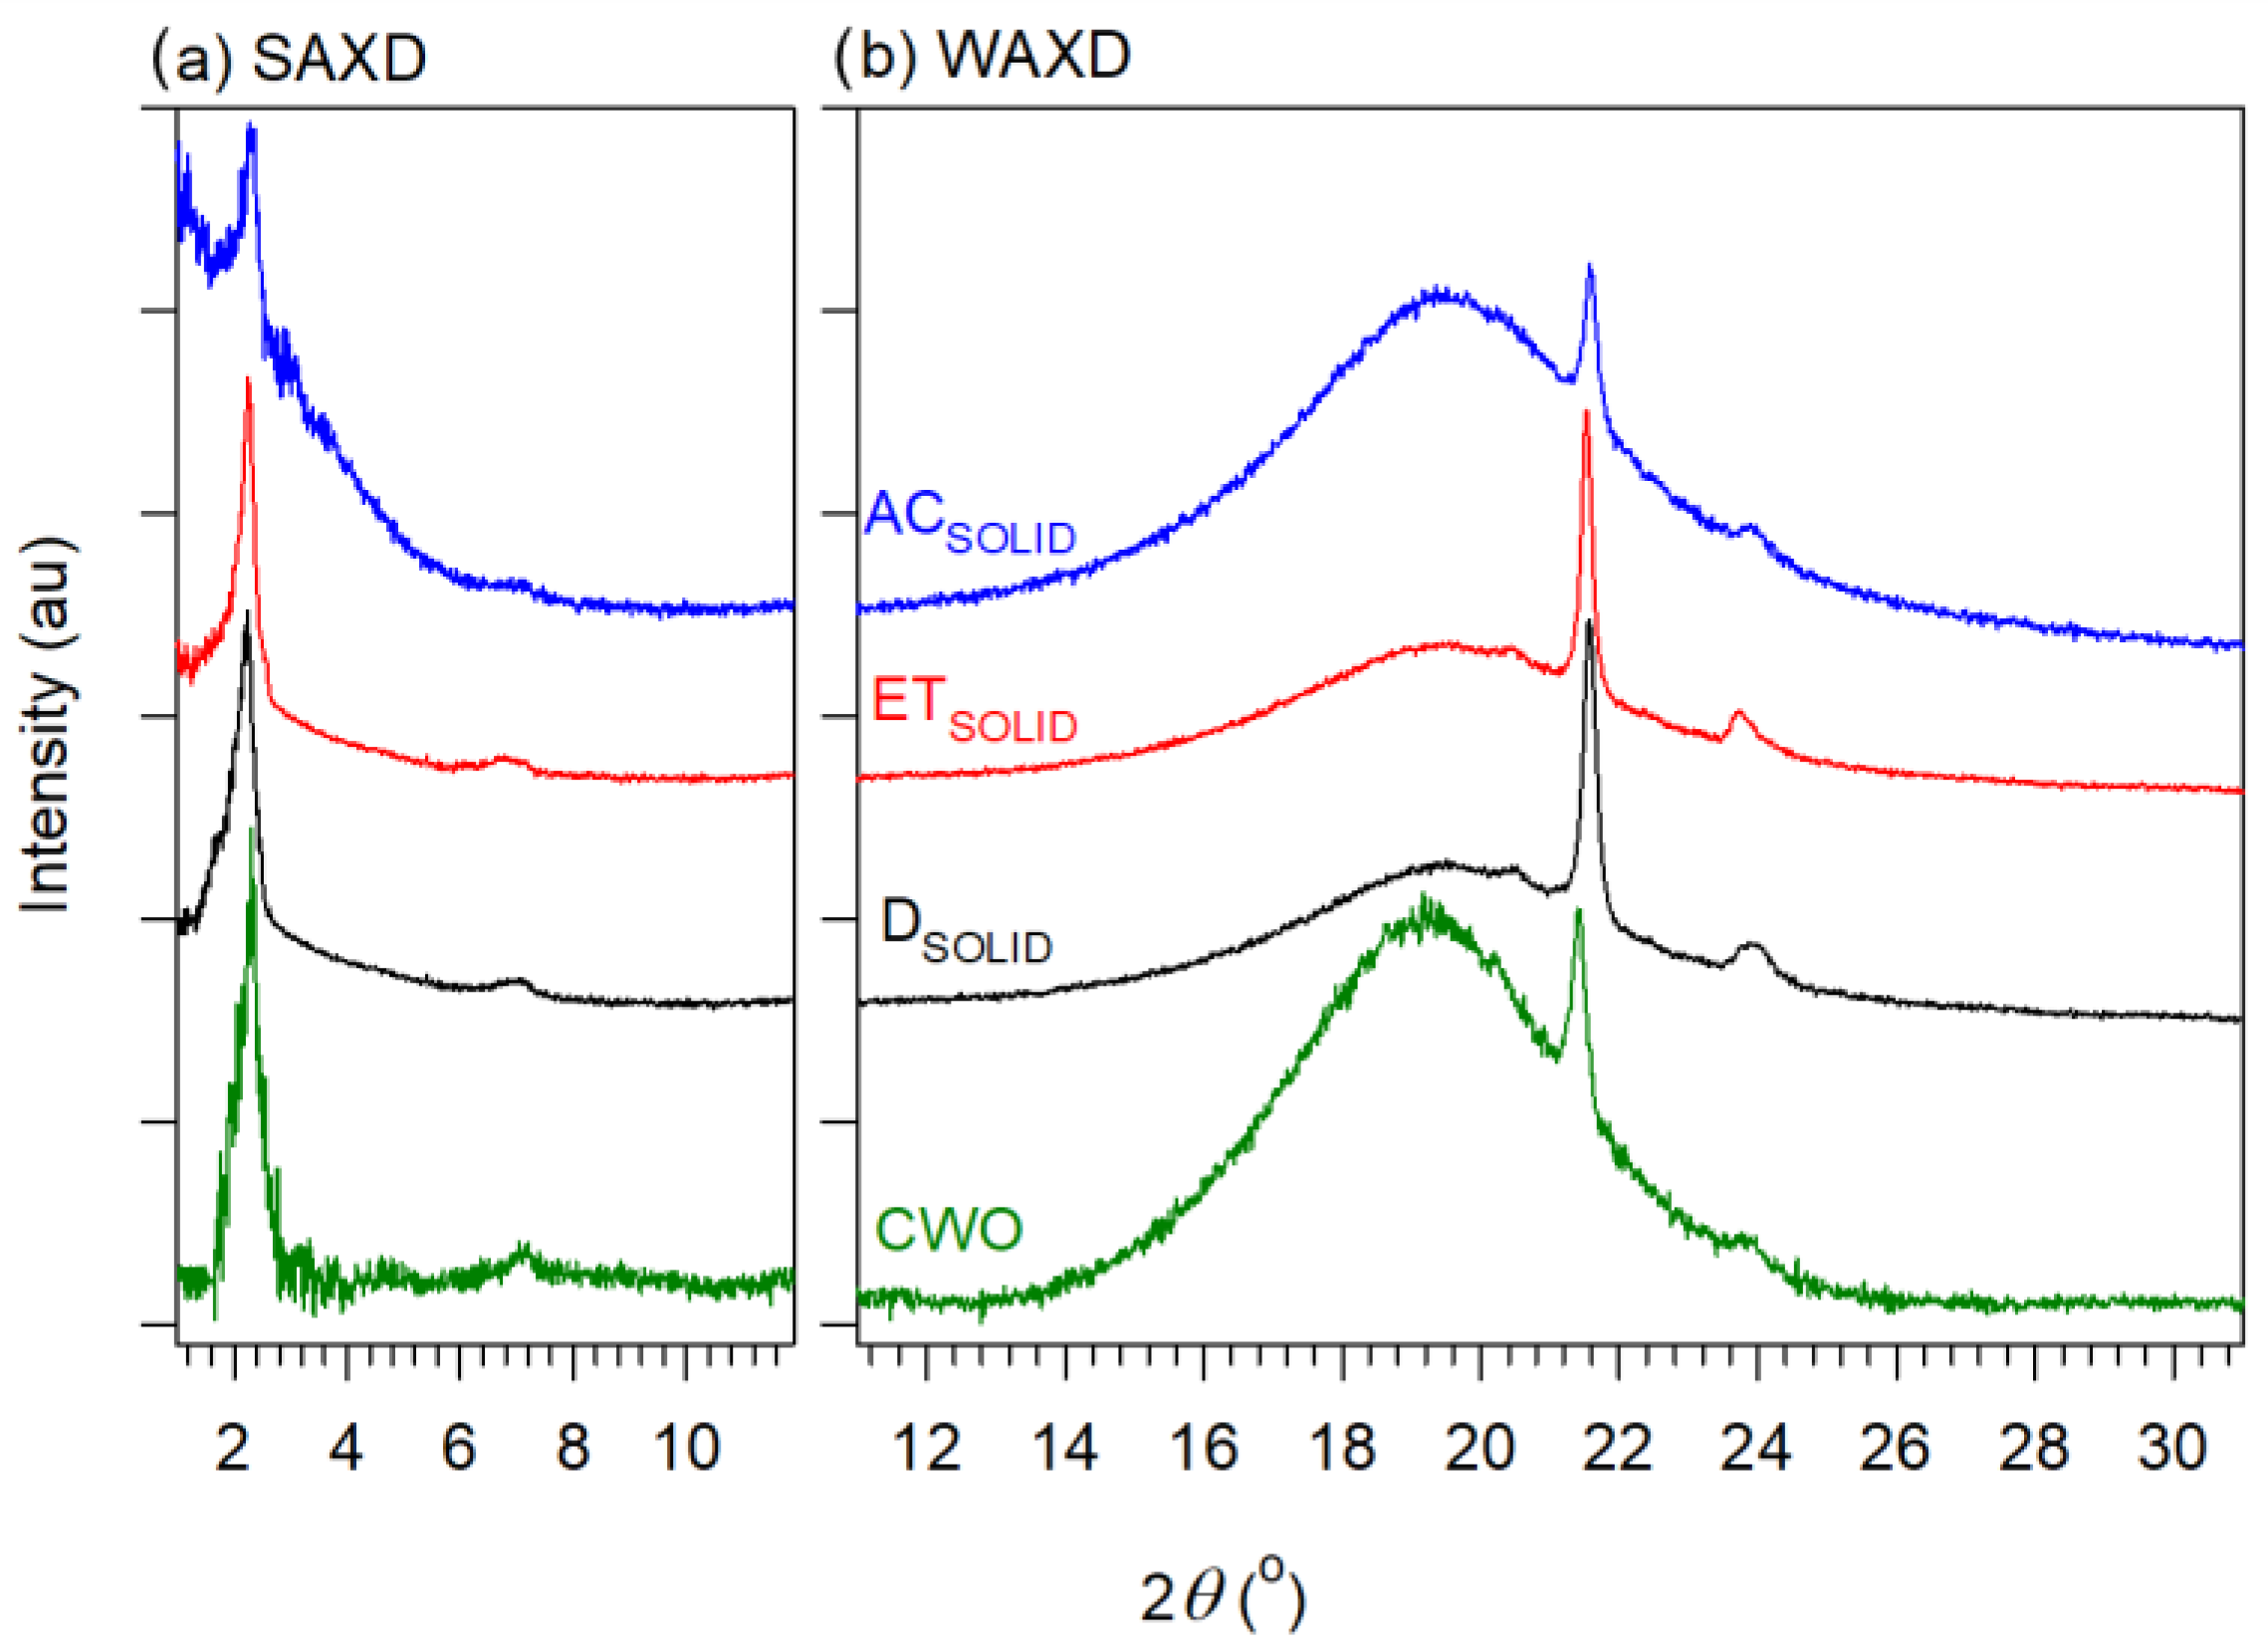
3.6. Crystal Structure of CWO, CWO Fractions
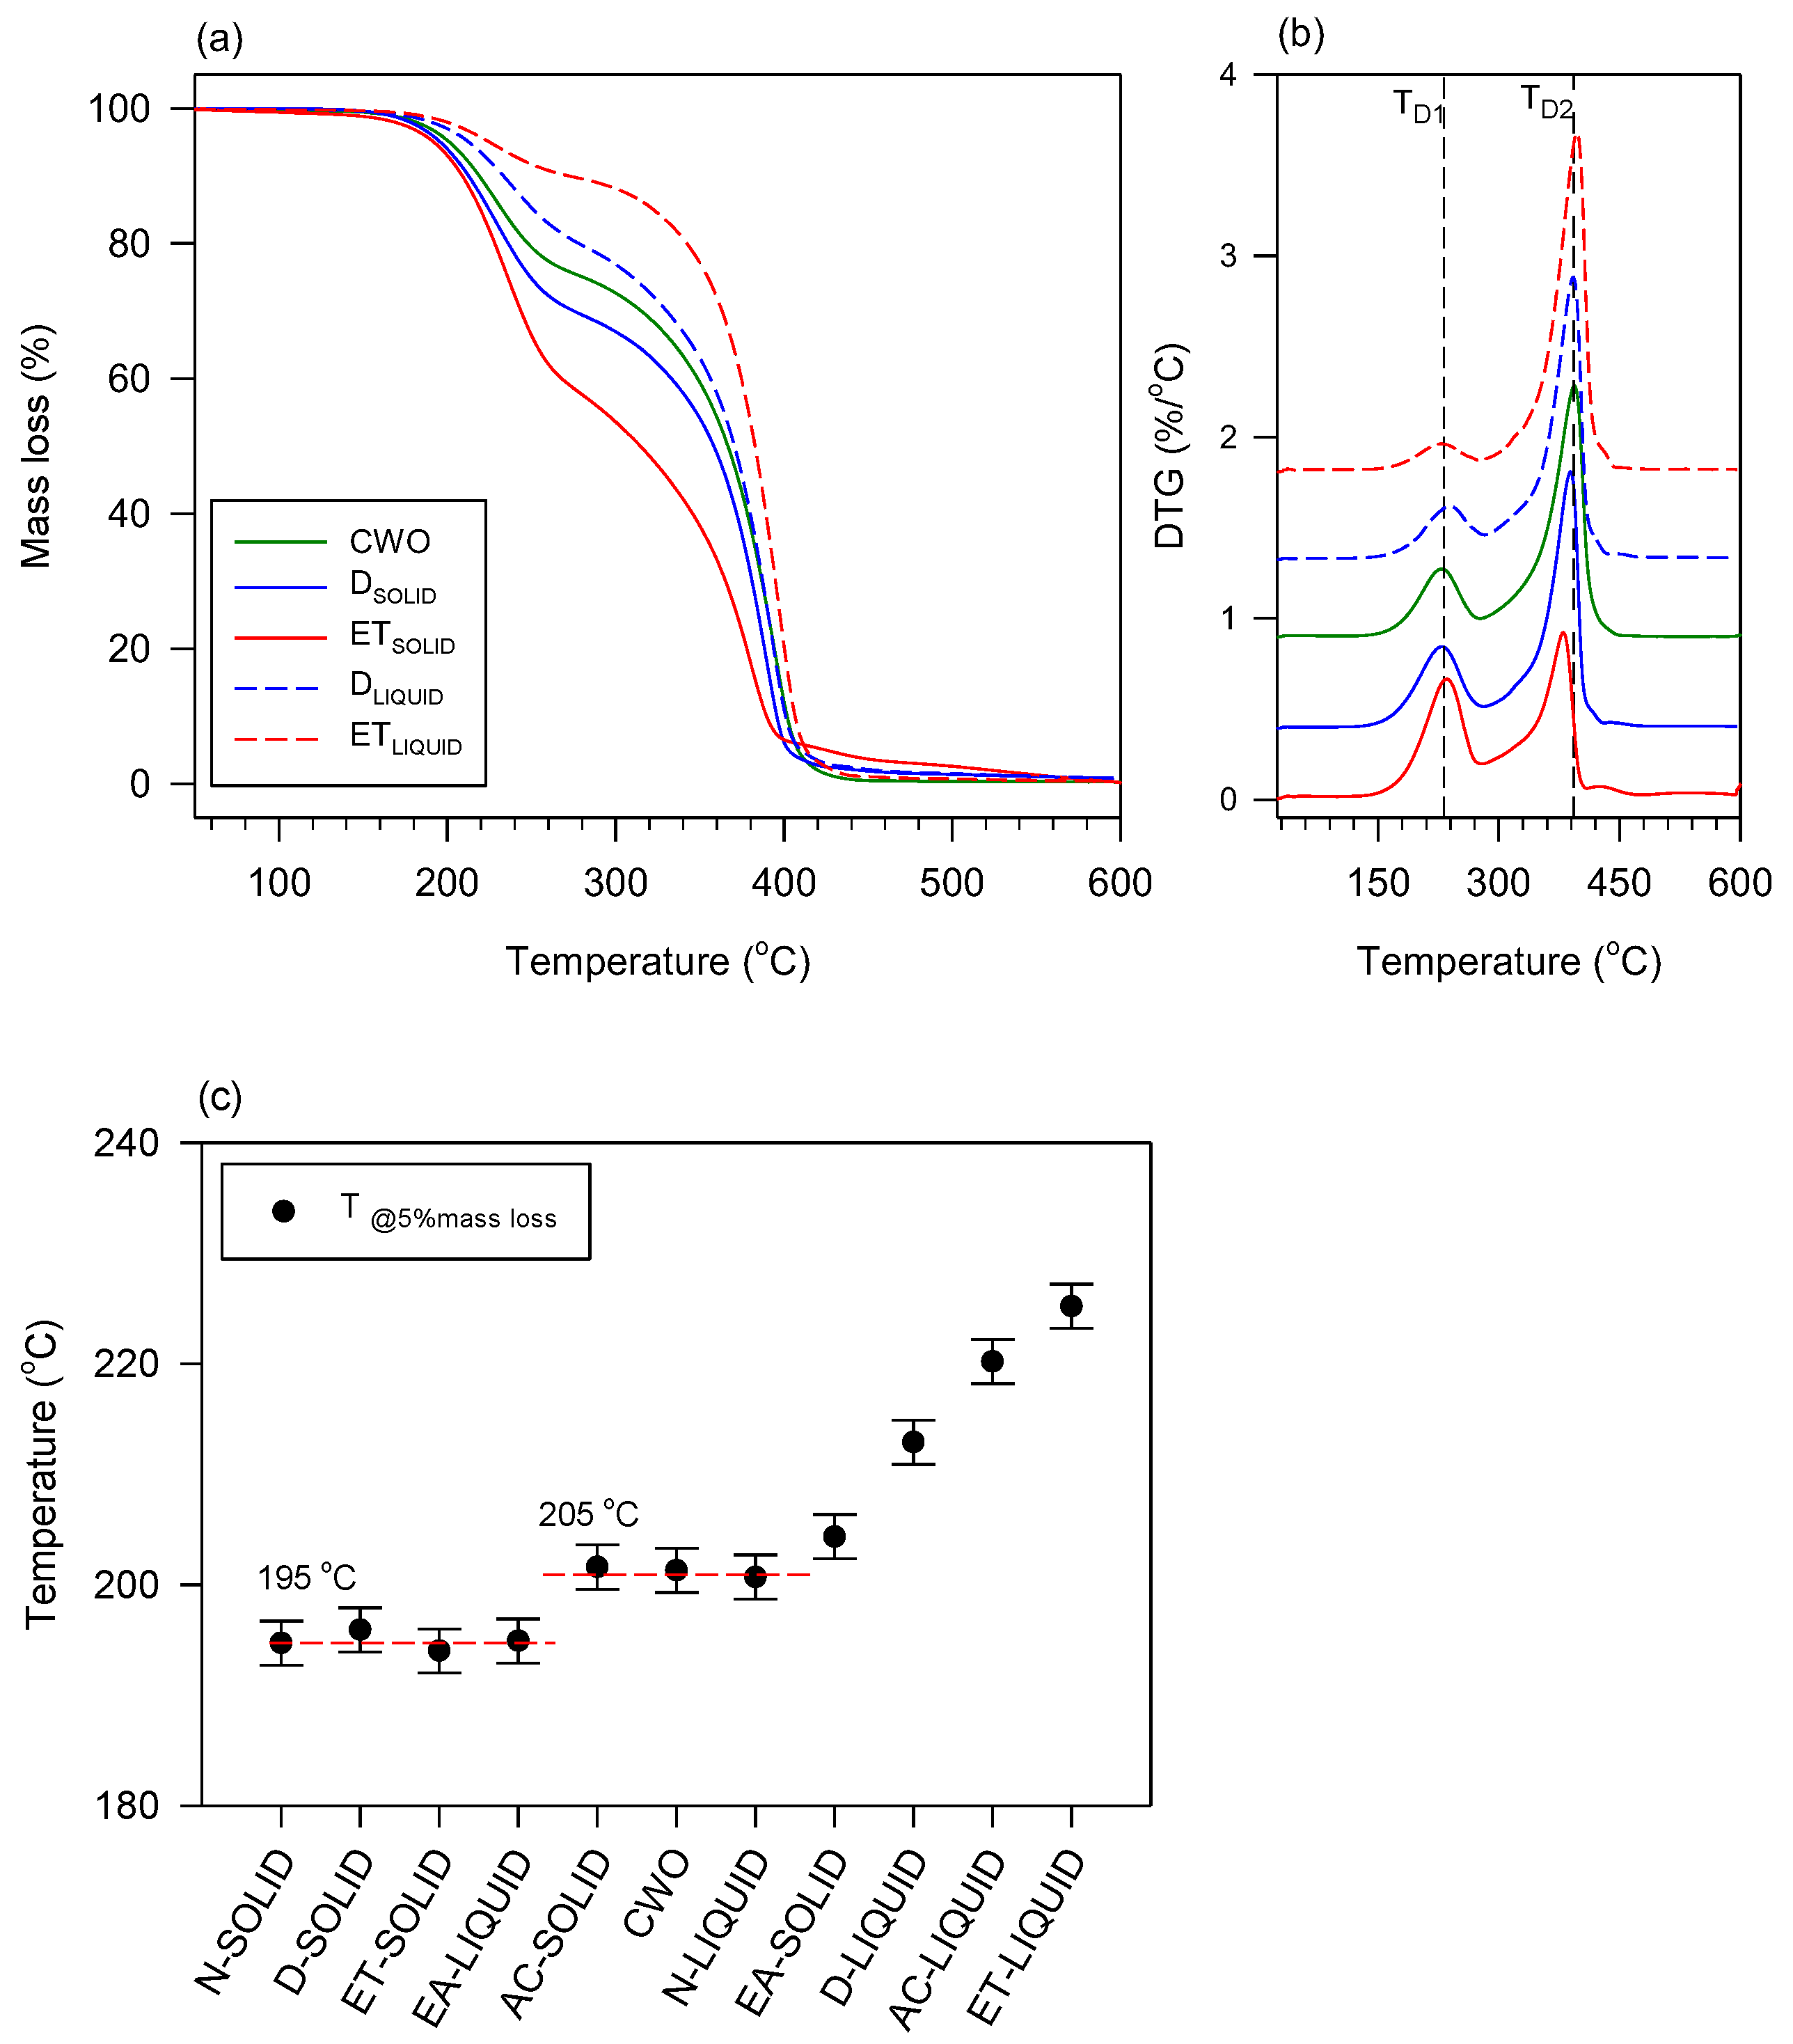
3.7. Thermal Gravimetric Analysis
4. Conclusions and Perspectives
- Fractionation resulted in a changed microstructure: the fractions displayed smaller crystals than CWO, which were distinguishable in shape, size and density of the crystal networks;
- Fractionation changed the crystallization and melting temperatures: The partitioning of the lipids is significant enough to drive measurable and predictable crystallization and melting behaviors. The solid fractions transition parameters were particularly very strongly correlated to the fractionation method and polarity of the solvents;
- Fractionation changed the solid fat content (SFC) profile of CWO fractions: CWO fractions are shown to form semi-solid fats. The role of kinetics is significant and manifests differently depending on the fractionation method and solvent polarity. The data suggest that it is possible to improve the SFC of the fractions by changing the processing methods;
- One can tailor physical properties, such as crystallization, melt and solid fat content and possibly texture (through drastic modification of microstructure), through fractionation, using polarity as a predictive tool.
Supplementary Materials
Author Contributions
Funding
Data Availability Statement
Conflicts of Interest
References
- Convention on Biological Diversity. Available online: https://www.cbd.int/countries/profile/?country=gy#:~:text=Forests%20in%20Guyana%20can%20be,most%20part%2C%20intact%20but%20understudied (accessed on 31 May 2023).
- Firmino, A.V.; Vidaurre, G.B.; Oliveira, J.T.D.S.; Guedes, M.; Almeida, M.N.F.D.; Silva, J.G.M.D.; Latorraca, J.V.D.F.; Zanuncio, J.C. Wood properties of Carapa guianensis from floodplain and upland forests in Eastern Amazonia, Brazil. Sci. Rep. 2019, 9, 10641. [Google Scholar] [CrossRef] [PubMed]
- van Andel, T.; Reinders, M. Non-Timber Forest Products of the North-West District of Guyana. Part 1. 2000. Available online: https://www.tropenbos.org/resources/publications/non-timber+forest+products+of+the+north-west+district+of+guyana+part+i (accessed on 31 May 2023).
- Plowden, C. The Ecology and Harvest of Andiroba Seeds for Oil Production in the Brazilian Amazon. Conserv. Soc. 2004, 2, 251–272. [Google Scholar]
- Silva, B.A.; Scussel, V.M. Characteristics and Effects of the Amazonian Andiroba (Carapa guianensis Aubl.) Oil Against Living Organisms—A Review. IOSR J. Biotechnol. Biochem. (IOSR-JBB) 2020, 6, 31–47. [Google Scholar]
- Taylor, L. Technical Data Report for Andiroba. Herb. Secrets Rainfor. 2002, 1–27. Available online: https://rain-tree.com/reports/andiroba-tech.pdf (accessed on 31 May 2023).
- Forget, P.-M.; Poncy, O.; Thomas, R.; Hammond, D.; Kenfack, D. A new species of Carapa (Meliaceae) from Central Guyana. Brittonia 2009, 61, 366–374. [Google Scholar] [CrossRef]
- Bruna, A.; Neyeli, C.; Cristina, L.; De, C.M.; Vildes, M. Effect of Andiroba (Carapa guianensis Aubl.) Oil for Fungi Control in Maize (Zea mays L.) Grains. J. Agric. Vet. Sci. 2019, 12, 26–32. [Google Scholar]
- Pereira, T.B.; Rocha E Silva, L.F.; Amorim, R.C.; Melo, M.R.; Zacardi De Souza, R.C.; Eberlin, M.N.; Lima, E.S.; Vasconcellos, M.C.; Pohlit, A.M. In vitro and in vivo anti-malarial activity of limonoids isolated from the residual seed biomass from Carapa guianensis (andiroba) oil production. Malar. J. 2014, 13, 4–11. [Google Scholar] [CrossRef]
- Nayak, B.S.; Kanhai, J.; Milne, D.M.; Pereira, L.P.; Swanston, W.H. Experimental evaluation of ethanolic extract of Carapa guianensis L. leaf for its wound healing activity using three wound models. Evid.-Based Complement. Altern. Med. 2011, 2011, 419612. [Google Scholar] [CrossRef]
- Klauck, V.; Pazinato, L.; Stefani, L.M.; Santos, R.C.; Vaucher, R.A.; Baldiserra, M.D.; Raffin, R.; Boligon, A.; Athayde, M.; Baretta, D.; et al. Insecticidal and repellent effects of tea tree and andiroba oils on flies associated with livestock. Med. Vet. Entomol. 2014, 28, 33–39. [Google Scholar] [CrossRef]
- Araujo-Lima, C.F.; Fernandes, A.S.; Gomes, E.M.; Oliveira, L.L.; Macedo, A.F.; Antoniassi, R.; Wilhelm, A.E.; Aiub, C.A.F.; Felzenszwalb, I. Antioxidant activity and genotoxic assessment of crabwood (andiroba, Carapa guianensis Aublet) seed oils. Oxidative Med. Cell. Longev. 2018, 2018, 3246719. [Google Scholar] [CrossRef]
- Dantas, A.R.; Lira-Guedes, A.C.; Mustin, K.; Aparicio, W.C.S.; Guedes, M.C. Phenology of the multi-use tree species Carapa guianensis in a floodplain forest of the Amazon Estuary. Acta Bot. Bras. 2016, 30, 618–627. [Google Scholar] [CrossRef]
- Burlando, B.; Cornara, L. Revisiting amazonian plants for skin care and disease. Cosmetics 2017, 4, 25. [Google Scholar] [CrossRef]
- Balbani, A.P.S.; Silva, D.H.S.; Montovani, J.C. Patents of drugs extracted from Brazilian medicinal plants. Expert Opin. Ther. Pat. 2009, 19, 461–473. [Google Scholar] [CrossRef]
- Kennedy, L. Skin Conditioning Compositions Comprising Plant Products. WO2013155527, 7 October 2013. [Google Scholar]
- IAST Natural Soaps—The Rupununi Essence Project. Available online: https://iast.gov.gy/?page_id=872 (accessed on 29 May 2023).
- Lüdtke, F.L.; Grimaldi, L.M.; Silva, T.J.; Ramponi, K.; de Godoi, R.; Silva, M.G.; Grimaldi, R.; Ribeiro, A.P.B. Physicochemical properties of Andiroba (Carapa guianensis) and Pracaxi (Pentaclethra macroloba) oils. Inform 2021, 2021, 30–33. [Google Scholar] [CrossRef]
- Oliveira, I.D.S.D.S.; Moragas Tellis, C.J.; Chagas, M.D.S.D.S.; Behrens, M.D.; Calabrese, K.D.S.; Abreu-Silva, A.L.; Almeida-Souza, F. Carapa guianensis Aublet (Andiroba) Seed Oil: Chemical Composition and Antileishmanial Activity of Limonoid-Rich Fractions. BioMed Res. Int. 2018, 2018, 5032816. [Google Scholar] [CrossRef] [PubMed]
- Nascimento, G.O.; Souza, D.P.; Santos, A.S.; Batista, J.F.; Rathinasabapathi, B.; Gagliardi, P.R.; Goncalves, J.F.C. Lipidomic profiles from seed oil of Carapa guianensis Aubl. and Carapa vasquezii Kenfack and implications for the control of phytopathogenic fungi. Ind. Crops Prod. 2019, 129, 67–73. [Google Scholar] [CrossRef]
- Bataglion, G.A.; da Silva, F.M.A.; Santos, J.M.; dos Santos, F.N.; Barcia, M.T.; de Lourenço, C.C.; Salvador, M.J.; Godoy, H.T.; Eberlin, M.N.; Koolen, H.H.F. Comprehensive characterization of lipids from Amazonian vegetable oils by mass spectrometry techniques. Food Res. Int. 2014, 64, 472–481. [Google Scholar] [CrossRef]
- De Sousa, R.L.; Silva, S.G.; Costa, J.M.; Da Costa, W.A.; Maia, A.A.B.; De Oliveira, M.S.; Andrade, E.H.D.A. Chemical profile of manually extracted andiroba oil (Carapa guianensis Aubl. Meliaceae) from Mamangal community, located in Igarapé-Miri, Pará, Brazil. Sci. Plena 2022, 17. [Google Scholar] [CrossRef]
- Dias, K.K.B.; Cardoso, A.L.; da Costa, A.A.F.; Passos, M.F.; da Costa, C.E.F.; da Rocha Filho, G.N.; de Aguiar Andrade, E.H.; Luque, R.; do Nascimento, L.A.S.; Noronha, R.C.R. Biological activities from andiroba (Carapa guianensis Aublet.) and its biotechnological applications: A systematic review. Arab. J. Chem. 2023, 16, 104629. [Google Scholar]
- Ferreira, A.M.; da S Sena, I.; Magalhaes, K.F.; Oliveira, S.L.; Ferreira, I.M.; Porto, A.L.M. Amazon Oils from Andiroba (Carapa sp.) and Babassu (Orbignya sp.) for Preparation Biodiesel by Enzymatic Catalysis. Curr. Biotechnol. 2018, 7, 428–437. [Google Scholar] [CrossRef]
- Rodrigues de Oliveira, F.; Eleuterio Rodrigues, K.; Hamoy, M.; Rodrigues Sarquis, Í.; Otake Hamoy, A.; Elena Crespo Lopez, M.; Maciel Ferreira, I.; de Matos Macchi, B.; Luiz Martins do Nascimento, J. Fatty Acid Amides Synthesized from Andiroba Oil (Carapa guianensis Aublet.) Exhibit Anticonvulsant Action with Modulation on GABA-A Receptor in Mice: A Putative Therapeutic Option. Pharmaceuticals 2020, 13, 43. [Google Scholar] [CrossRef] [PubMed]
- Marinho, V.H.S.; Holanda, F.H.; Araújo, I.F.; Jimenez, D.E.Q.; Pereira, R.R.; Porto, A.L.M.; Ferreira, A.M.; Carvalho, J.C.T.; Albuquerque de Freitas, A.C.G.; Fernandes, C.P.; et al. Nanoparticles from silk fibroin and Amazon oils: Potential larvicidal activity and oviposition deterrence against Aedes aegypti. Ind. Crops Prod. 2023, 203, 117133. [Google Scholar] [CrossRef]
- Cusioli, L.F.; Mantovani, D.; Bergamasco, R.; Tusset, A.M.; Lenzi, G.G. Preparation of a New Adsorbent Material from Agro-Industrial Waste and Comparison with Commercial Adsorbent for Emerging Contaminant Removal. Processes 2023, 11, 2478. [Google Scholar] [CrossRef]
- Serafin, J.; Ouzzine, M.; Cruz, O.F., Jr.; Srenscek-Nazzal, J.; Campello Gomez, I.; Azar, F.-Z.; Rey Mafull, C.A.; Hotza, D.; Rambo, C.R. Conversion of fruit waste-derived biomass to highly microporous activated carbon for enhanced CO2 capture. Waste Manag. 2021, 136, 273–282. [Google Scholar] [CrossRef] [PubMed]
- Lira, G.B.; Lopes, A.; Nascimento, F.; Conceição, G.; Brasil, D. Extraction processes and industrial uses of andiroba and açaí oils: A review. Res. Soc. Dev. 2021, 10, e229101220227. [Google Scholar] [CrossRef]
- Sarquis, I.R.; Sarquis, R.S.F.R.; Marinho, V.H.S.; Neves, F.B.; Araujo, I.F.; Damasceno, L.F.; Ferreira, R.M.A.; Souto, R.N.P.; Carvalho, J.C.T.; Ferreira, I.M. Carapa guianensis Aubl. (Meliaceae) oil associated with silk fibroin, as alternative to traditional surfactants, and active against larvae of the vector Aedes aegypti. Ind. Crops Prod. 2020, 157, 112931. [Google Scholar] [CrossRef]
- Iha, O.K.; Alves, F.C.; Suarez, P.A.; Silva, C.R.; Meneghetti, M.R.; Meneghetti, S.M. Potential application of Terminalia catappa L. and Carapa guianensis oils for biofuel production: Physical-chemical properties of neat vegetable oils, their methyl-esters and bio-oils (hydrocarbons). Ind. Crops Prod. 2014, 52, 95–98. [Google Scholar] [CrossRef]
- Tong, S.-C.; Tang, T.-K.; Lee, Y.-Y. A Review on the Fundamentals of Palm Oil Fractionation: Processing Conditions and Seeding Agents. Eur. J. Lipid Sci. Technol. 2021, 123, 2100132. [Google Scholar] [CrossRef]
- Zhang, Z.; Ma, X.; Huang, H.; Wang, Y. Shea olein based specialty fats: Preparation, characterization and potential application. LWT 2017, 86, 492–500. [Google Scholar] [CrossRef]
- Perederic, O.A.; Mansouri, S.S.; Appel, S.; Sarup, B.; Gani, R.; Woodley, J.M.; Kontogeorgis, G.M. Process Analysis of Shea Butter Solvent Fractionation Using a Generic Systematic Approach. Ind. Eng. Chem. Res. 2020, 59, 9152–9164. [Google Scholar] [CrossRef]
- Minzangi, K.; Kadima, J.N.; Kaaya, A.N.; Matthäus, B.; Van Damme, P.; Samvura, B.; Mosibono, D.E.; Belesi, K.; Mpiana, P.T. Fatty acids and tocopherols content in fractionated oils from five wild oilseed plants Native to Kahuzi-Biega National Park, Kivu-DR Congo. Eur. J. Med. Plants 2015, 10, 1–9. [Google Scholar] [CrossRef]
- Kazadi, M.; Bokota, M.T.; Mpiana, P.T. Potential New Sources of Oleic Acids from Wild Plants from Kivu, D. R. Congo. J. Phys. Chem. Sci. 2014, 1, 1–4. [Google Scholar]
- National Center for Biotechnology Information. PubChem Compound Summary for CID 8857, Ethyl Acetate. Available online: https://pubchem.ncbi.nlm.nih.gov/compound/8857 (accessed on 18 August 2023).
- Health, C.P. (Ed.) Reference Manual—Consumer Chemicals and Containers Regulations, 2001. 2007. Available online: https://www.canada.ca/content/dam/hc-sc/migration/hc-sc/cps-spc/alt_formats/hecs-sesc/pdf/pubs/indust/cccr-2001-rpccc/ref_man/cccr-rpccc3-eng.pdf (accessed on 18 August 2023).
- National Center for Biotechnology Information. PubChem Compound Summary for CID 180, Acetone. Available online: https://pubchem.ncbi.nlm.nih.gov/compound/180 (accessed on 18 August 2023).
- National Center for Biotechnology Information. PubChem Compound Summary for CID 702, Ethanol. Available online: https://pubchem.ncbi.nlm.nih.gov/compound/Ethanol (accessed on 18 August 2023).
- Cheng, X.; Hochlowski, J. Current application of mass spectrometry to combinatorial chemistry. Anal. Chem. 2002, 74, 2679–2690. [Google Scholar] [CrossRef]
- Milward, S. Greasing the Wheels for Conservation and Development: Can Crabwood Oil Enterprises Contribute to Sustaiable Develop-ment of the Riverine Communities in North Rupununi, Central Guyana? A Study of Enterprise Development. Ph.D. Thesis, University of Leeds, Leeds, UK, 2002. (Unpublished work). [Google Scholar]
- Pillai, P.K.S.; Li, S.; Bouzidi, L.; Narine, S.S. Metathesized palm oil: Fractionation strategies for improving functional properties of lipid-based polyols and derived polyurethane foams. Ind. Crops Prod. 2016, 84, 273–283. [Google Scholar] [CrossRef]
- Abubakar, A.R.; Haque, M. Preparation of Medicinal Plants: Basic Extraction and Fractionation Procedures for Experimental Purposes. J. Pharm. Bioallied Sci. 2020, 12, 1–10. [Google Scholar] [CrossRef] [PubMed]
- Ghotra, B.S.; Dyal, S.D.; Narine, S.S. Lipid shortenings: A review. Food Res. Int. 2002, 35, 1015–1048. [Google Scholar] [CrossRef]
- Marangoni, A.G.; Wesdorp, L.H. Structure and Properties of Fat Crystal Networks, Second Edition, 2nd ed.; Taylor & Francis: New York, NY, USA, 2012. [Google Scholar]
- Raghunanan, L.; Floros, M.C.; Narine, S.S. Thermal stability of renewable diesters as phase change materials. Thermochim. Acta 2016, 644, 61–68. [Google Scholar] [CrossRef]
- National Center for Biotechnology Information. PubChem. Available online: https://pubchem.ncbi.nlm.nih.gov/ (accessed on 20 February 2023).
- Goncalves Bonassoli, A.B.; Oliveira, G.; Bordon Sosa, F.H.; Rolemberg, M.P.; Mota, M.A.; Basso, R.C.A.; Igarashi-Mafra, L.; Mafra, M.R. Solubility measurement of lauric, palmitic, and stearic acids in ethanol, n-propanol, and 2-propanol using differential scanning calorimetry. J. Chem. Eng. Data 2019, 64, 2084–2092. [Google Scholar] [CrossRef]
- MetaboQuest, omicraft: Washington, DC, USA, 2023. Available online: http://tools.omicscraft.com/MetaboQuest/ (accessed on 20 February 2023).
- LIPIDMAPS. Available online: https://lipidmaps.org/ (accessed on 20 February 2023).
- Saraiva, S.A.; Cabral, E.C.; Eberlin, M.N.; Catharino, R.R. Amazonian vegetable oils and fats: Fast typification and quality control via triacylglycerol (TAG) profiles from dry matrix-assisted laser desorption/ionization time-of-flight (MALDI-TOF) mass spectrometry fingerprinting. J. Agric. Food Chem. 2009, 57, 4030–4034. [Google Scholar] [CrossRef]
- Cabral, E.C.; da Cruz, G.F.; Simas, R.C.; Sanvido, G.B.; Goncalves, L.D.V.; Leal, R.V.P.; da Silva, R.C.F.; da Silva, J.C.T.; Barata, L.E.S.; da Cunha, V.S.; et al. Typification and quality control of the Andiroba (Carapa guianensis) oil via mass spectrometry fingerprinting. Anal. Methods 2013, 5, 1385–1391. [Google Scholar] [CrossRef]
- Gibon, V.; De Greyt, W.; Kellens, M. Palm oil refining. Eur. J. Lipid Sci. Technol. 2007, 109, 315–335. [Google Scholar] [CrossRef]
- Nakamura, M.T.; Yudell, B.E.; Loor, J.J. Regulation of energy metabolism by long-chain fatty acids. Prog. Lipid Res. 2014, 53, 124–144. [Google Scholar] [CrossRef] [PubMed]
- Kametani, S.; Kojima-Yuasa, A.; Kikuzaki, H.; Kennedy, D.O.; Honzawa, M.; Matsui-Yuasa, I. Chemical Constituents of Cape Aloe and Their Synergistic Growth-Inhibiting Effect on Ehrlich Ascites Tumor Cells. Biosci. Biotechnol. Biochem. 2007, 71, 1220–1229. [Google Scholar] [CrossRef]
- PubChem, Compound Summary for CID 5312773, 18-Hydroxyoleic acid. National Center for Biotechnology Information. 2023. Available online: https://pubchem.ncbi.nlm.nih.gov/compound/18-Hydroxyoleic-acid (accessed on 31 May 2023).
- Kishino, S.; Takeuchi, M.; Park, S.-B.; Hirata, A.; Kitamura, N.; Kunisawa, J.; Kiyono, H.; Iwamoto, R.; Isobe, Y.; Arita, M. Polyunsaturated fatty acid saturation by gut lactic acid bacteria affecting host lipid composition. Proc. Natl. Acad. Sci. USA 2013, 110, 17808–17813. [Google Scholar] [CrossRef] [PubMed]
- Whelan, J.; Fritsche, K. Linoleic acid. Adv. Nutr. 2013, 4, 311–312. [Google Scholar] [CrossRef]
- Adarme-Vega, T.C.; Thomas-Hall, S.R.; Schenk, P.M. Towards sustainable sources for omega-3 fatty acids production. Curr. Opin. Biotechnol. 2014, 26, 14–18. [Google Scholar] [CrossRef]
- Stoveken, H.M.; Larsen, S.D.; Smrcka, A.V.; Tall, G.G. Gedunin- and Khivorin-Derivatives Are Small-Molecule Partial Agonists for Adhesion G Protein-Coupled Receptors GPR56/ADGRG1 and GPR114/ADGRG5. Mol. Pharmacol. 2018, 93, 477–488. [Google Scholar] [CrossRef]
- Abdelgaleil, S.A.; Hashinaga, F.; Nakatani, M. Antifungal activity of limonoids from Khaya ivorensis. Pest Manag. Sci. 2005, 61, 186–190. [Google Scholar] [CrossRef] [PubMed]
- Chiruvella, K.K.; Kari, V.; Choudhary, B.; Nambiar, M.; Ghanta, R.G.; Raghavan, S.C. Methyl angolensate, a natural tetranortriterpenoid induces intrinsic apoptotic pathway in leukemic cells. FEBS Lett. 2008, 582, 4066–4076. [Google Scholar] [CrossRef]
- Chiruvella, K.K.; Panjamurthy, K.; Choudhary, B.; Joy, O.; Raghavan, S.C. Methyl angolensate from callus of Indian redwood induces cytotoxicity in human breast cancer cells. Int. J. Biomed. Sci. IJBS 2010, 6, 182–194. [Google Scholar]
- Chiruvella, K.K.; Mohammed, A.; Dampuri, G.; Ghanta, R.G.; Raghavan, S.C. Phytochemical and Antimicrobial Studies of Methyl Angolensate and Luteolin-7-O-glucoside Isolated from Callus Cultures of Soymida febrifuga. Int. J. Biomed. Sci. IJBS 2007, 3, 269–278. [Google Scholar]
- Nakatani, M.; James, J.C.; Nakanishi, K. Isolation and structures of trichilins, antifeedants against the Southern army worm. J. Am. Chem. Soc. 1981, 103, 1228–1230. [Google Scholar] [CrossRef]
- Vieira, I.; Terra, W.; Gonçalves, M.; Braz-Filho, R. Secondary Metabolites of the Genus Trichilia: Contribution to the Chemistry of Meliaceae Family. Am. J. Anal. Chem. 2014, 5, 91–121. [Google Scholar] [CrossRef]
- Fokam, M.A.M.; Mfifen, A.M.; Nkengfack, A.E. Isolation, characterization and cytotoxic activity of isolated compounds from seed of Carapa angustifolia (Meliaceae). J. Chem. Pharm. Res. 2019, 11, 7–10. [Google Scholar]
- Gonzalez-Ramirez, M.; Limachi, I.; Manner, S.; Ticona, J.C.; Salamanca, E.; Gimenez, A.; Sterner, O. Trichilones A–E: New Limonoids from Trichilia adolfi. Molecules 2021, 26, 3070. [Google Scholar] [CrossRef] [PubMed]
- Braga, T.M.; Rocha, L.; Chung, T.Y.; Oliveira, R.F.; Pinho, C.; Oliveira, A.I.; Morgado, J.; Cruz, A. Biological Activities of Gedunin-A Limonoid from the Meliaceae Family. Molecules 2020, 25, 493. [Google Scholar] [CrossRef]
- Sakamoto, A.; Tanaka, Y.; Inoue, T.; Kikuchi, T.; Kajimoto, T.; Muraoka, O.; Yamada, T.; Tanaka, R. Andirolides Q–V from the flower of andiroba (Carapa guianensis, Meliaceae). Fitoterapia 2013, 90, 20–29. [Google Scholar] [CrossRef] [PubMed]
- Bortolozzi, R.; Luraghi, A.; Mattiuzzo, E.; Sacchetti, A.; Silvani, A.; Viola, G. Ecdysteroid Derivatives that Reverse P-Glycoprotein-Mediated Drug Resistance. J. Nat. Prod. 2020, 83, 2434–2446. [Google Scholar] [CrossRef] [PubMed]
- Metin, S.; Hartel, R.W. Fundamentals of Lipid Crystallization. In Bailey’s Industrial Oil and Fat Products; Wiley: Hoboken, NJ, USA, 2020; pp. 1–31. [Google Scholar] [CrossRef]
- Minato, A.; Ueno, S.; Smith, K.; Amemiya, Y.; Sato, K. Thermodynamic and kinetic study on phase behavior of binary mixtures of POP and PPO forming molecular compound systems. J. Phys. Chem. B 1997, 101, 3498–3505. [Google Scholar] [CrossRef]
- Bayes-Garcia, L.; Calvet, T.; Cuevas-Diarte, M.À.; Ueno, S.; Sato, K. Phase behavior of binary mixture systems of saturated-unsaturated mixed-acid triacylglycerols: Effects of glycerol structures and chain–chain interactions. J. Phys. Chem. B 2015, 119, 4417–4427. [Google Scholar] [CrossRef] [PubMed]
- Gibon, V.; Danthine, S. Systematic Investigation of Co-Crystallization Properties in Binary and Ternary Mixtures of Triacylglycerols Containing Palmitic and Oleic Acids in Relation with Palm Oil Dry Fractionation. Foods 2020, 9, 1891. [Google Scholar] [CrossRef]
- Patel, S.; Nelson, D.R.; Gibbs, A.G. Chemical and physical analyses of wax ester properties. J. Insect Sci. 2001, 1, 4. [Google Scholar] [CrossRef] [PubMed]
- Mullin, J.W. Crystallization, 4th ed.; Butterworth-Heinemann: Oxford, UK, 2001; p. 600. [Google Scholar]
- Bouzidi, L.; Narine, S.S. Evidence of Critical Cooling Rates in the Nonisothermal Crystallization of Triacylglycerols: A Case for the Existence and Selection of Growth Modes of a Lipid Crystal Network. Langmuir 2010, 26, 4311–4319. [Google Scholar] [CrossRef]
- Rousseau, D.; Marangoni, A.G.; Jeffrey, K.R. The influence of chemical interesterification on the physicochemical properties of complex fat systems. 2. Morphology and polymorphism. J. Am. Oil Chem. Soc. 1998, 75, 1833–1839. [Google Scholar] [CrossRef]
- Narine, S.S.; Marangoni, A.G. Fractal nature of fat crystal networks. Phys. Rev. E 1999, 59, 1908–1920. [Google Scholar] [CrossRef]
- Marangoni, A.G.; Narine, S.S. Identifying key structural indicators of mechanical strength in networks of fat crystals. Food Res. Int. 2002, 35, 957–969. [Google Scholar] [CrossRef]
- Gosselink, R.W.; Hollak, S.A.W.; Chang, S.-W.; van Haveren, J.; de Jong, K.P.; Bitter, J.H.; van Es, D.S. Reaction Pathways for the Deoxygenation of Vegetable Oils and Related Model Compounds. ChemSusChem 2013, 6, 1576–1594. [Google Scholar] [CrossRef] [PubMed]
- Vonghia, E.; Boocock, D.G.; Konar, S.K.; Leung, A. Pathways for the deoxygenation of triglycerides to aliphatic hydrocarbons over activated alumina. Energy Fuels 1995, 9, 1090–1096. [Google Scholar] [CrossRef]
- Wilson, B. Lubricants and functional fluids from renewable sources. Ind. Lubr. Tribol. 1998, 50, 6–15. [Google Scholar] [CrossRef]
- Niu, S.; Zhou, Y.; Yu, H.; Lu, C.; Han, K. Investigation on thermal degradation properties of oleic acid and its methyl and ethyl esters through TG-FTIR. Energy Convers. Manag. 2017, 149, 495–504. [Google Scholar] [CrossRef]
- Alves, C.T.; Peters, M.A.; Onwudili, J.A. Application of thermogravimetric analysis method for the characterisation of products from triglycerides during biodiesel production. J. Anal. Appl. Pyrolysis 2022, 168, 105766. [Google Scholar]
- Vecchio, S.; Campanella, L.; Nuccilli, A.; Tomassetti, M. Kinetic study of thermal breakdown of triglycerides contained in extra-virgin olive oil. J. Therm. Anal. Calorim. 2008, 91, 51–55. [Google Scholar] [CrossRef]


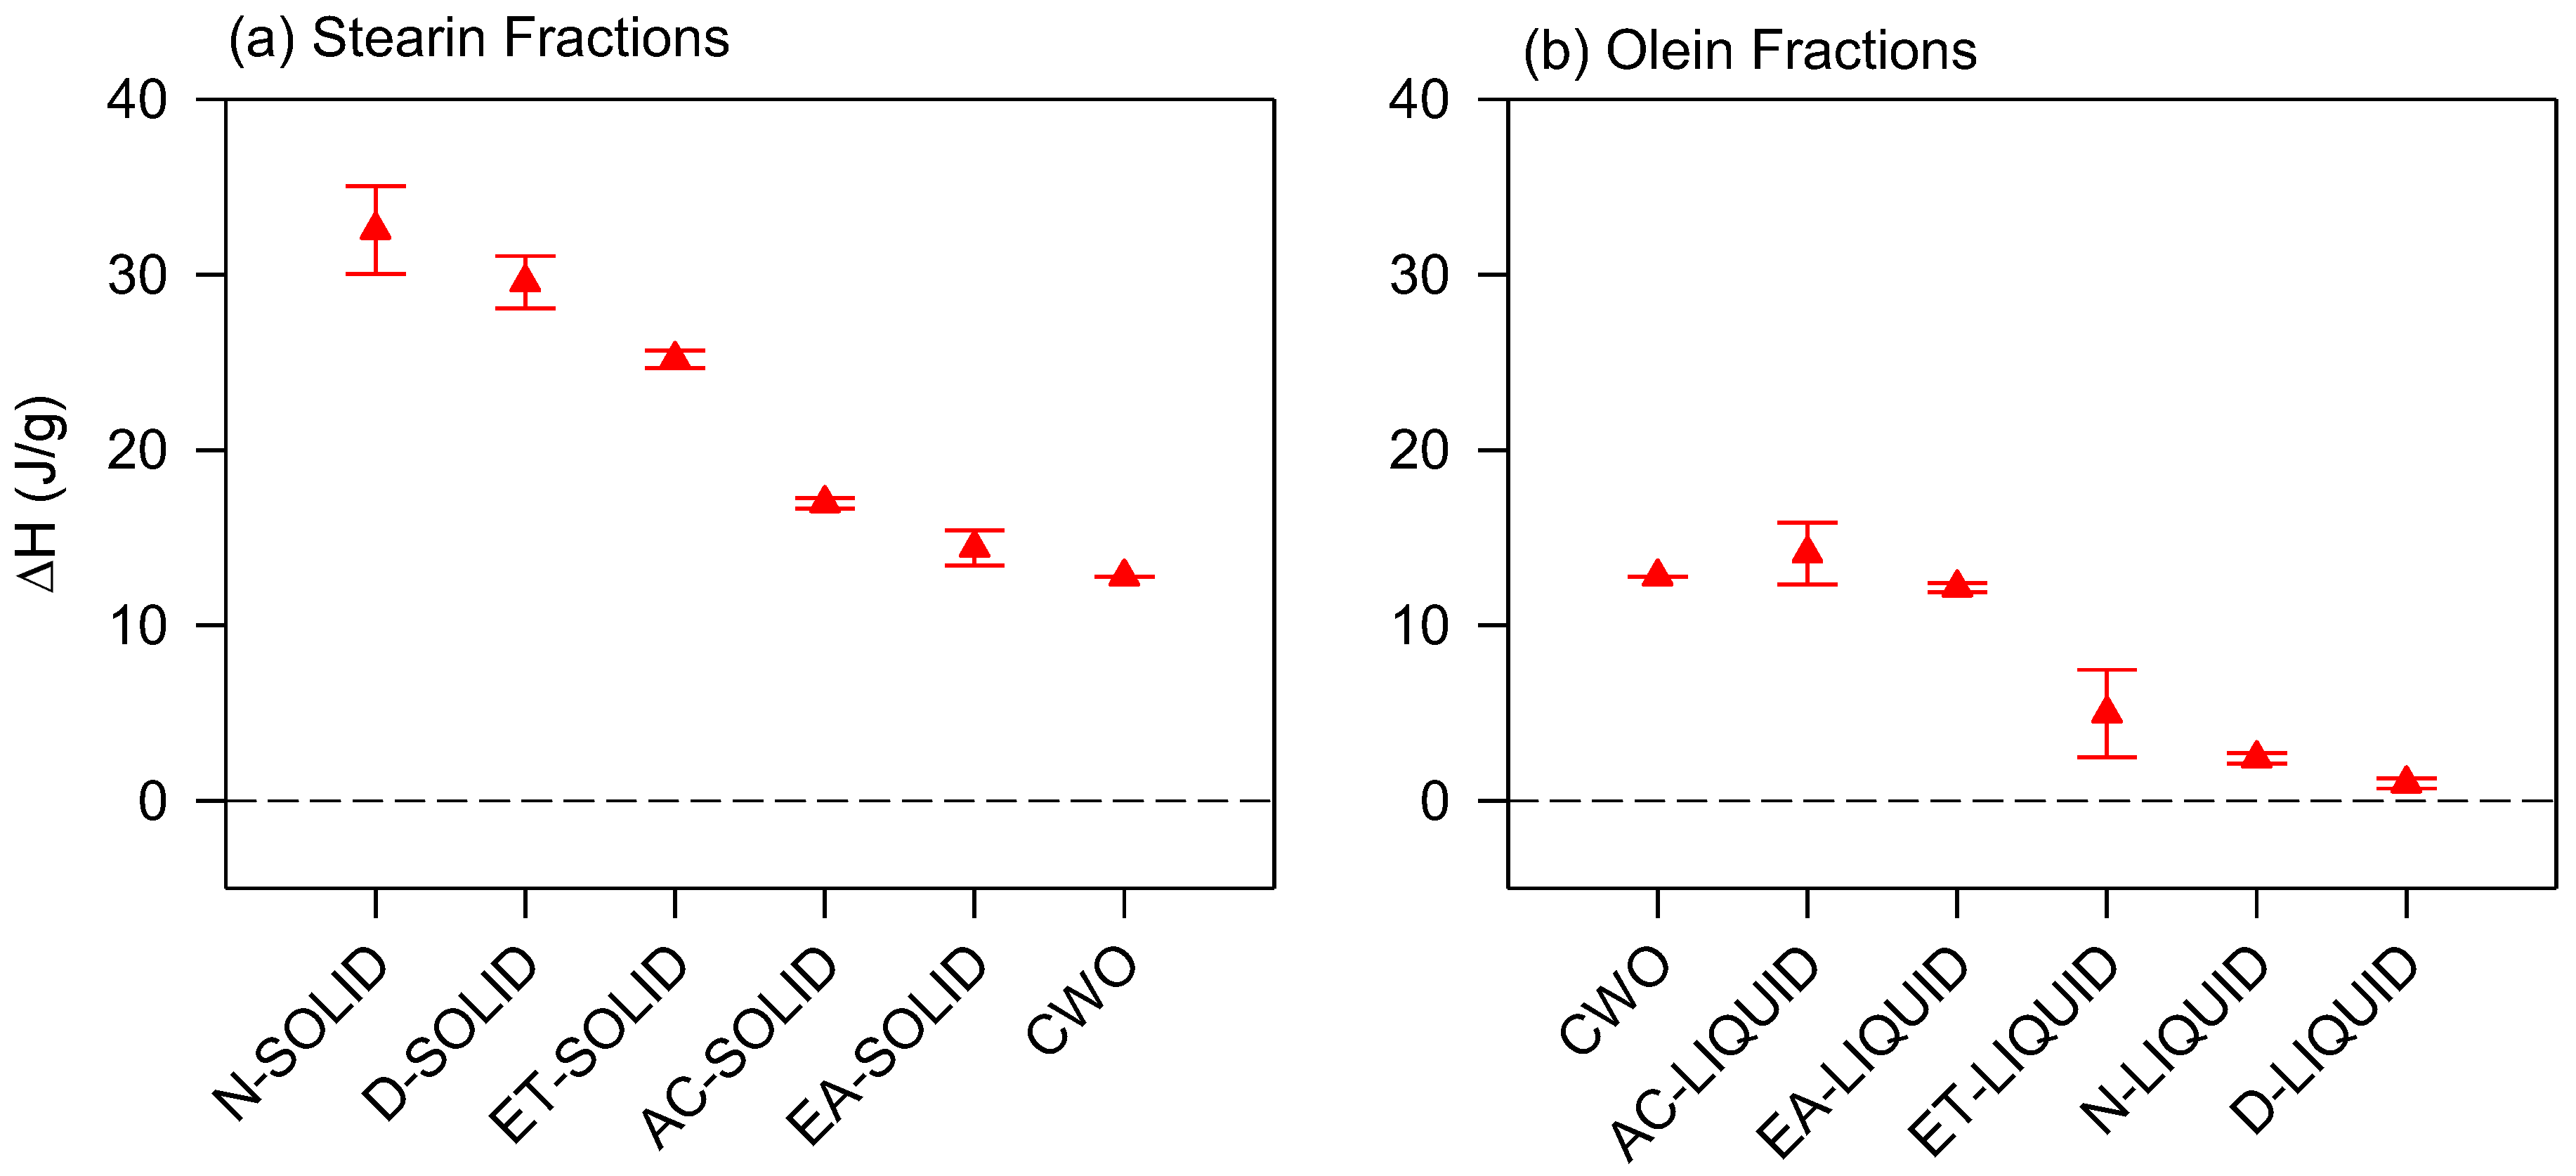
 ) of the (a) stearin and (b) olein fractions of CWO.
) of the (a) stearin and (b) olein fractions of CWO.
) of the (a) stearin and (b) olein fractions of CWO.


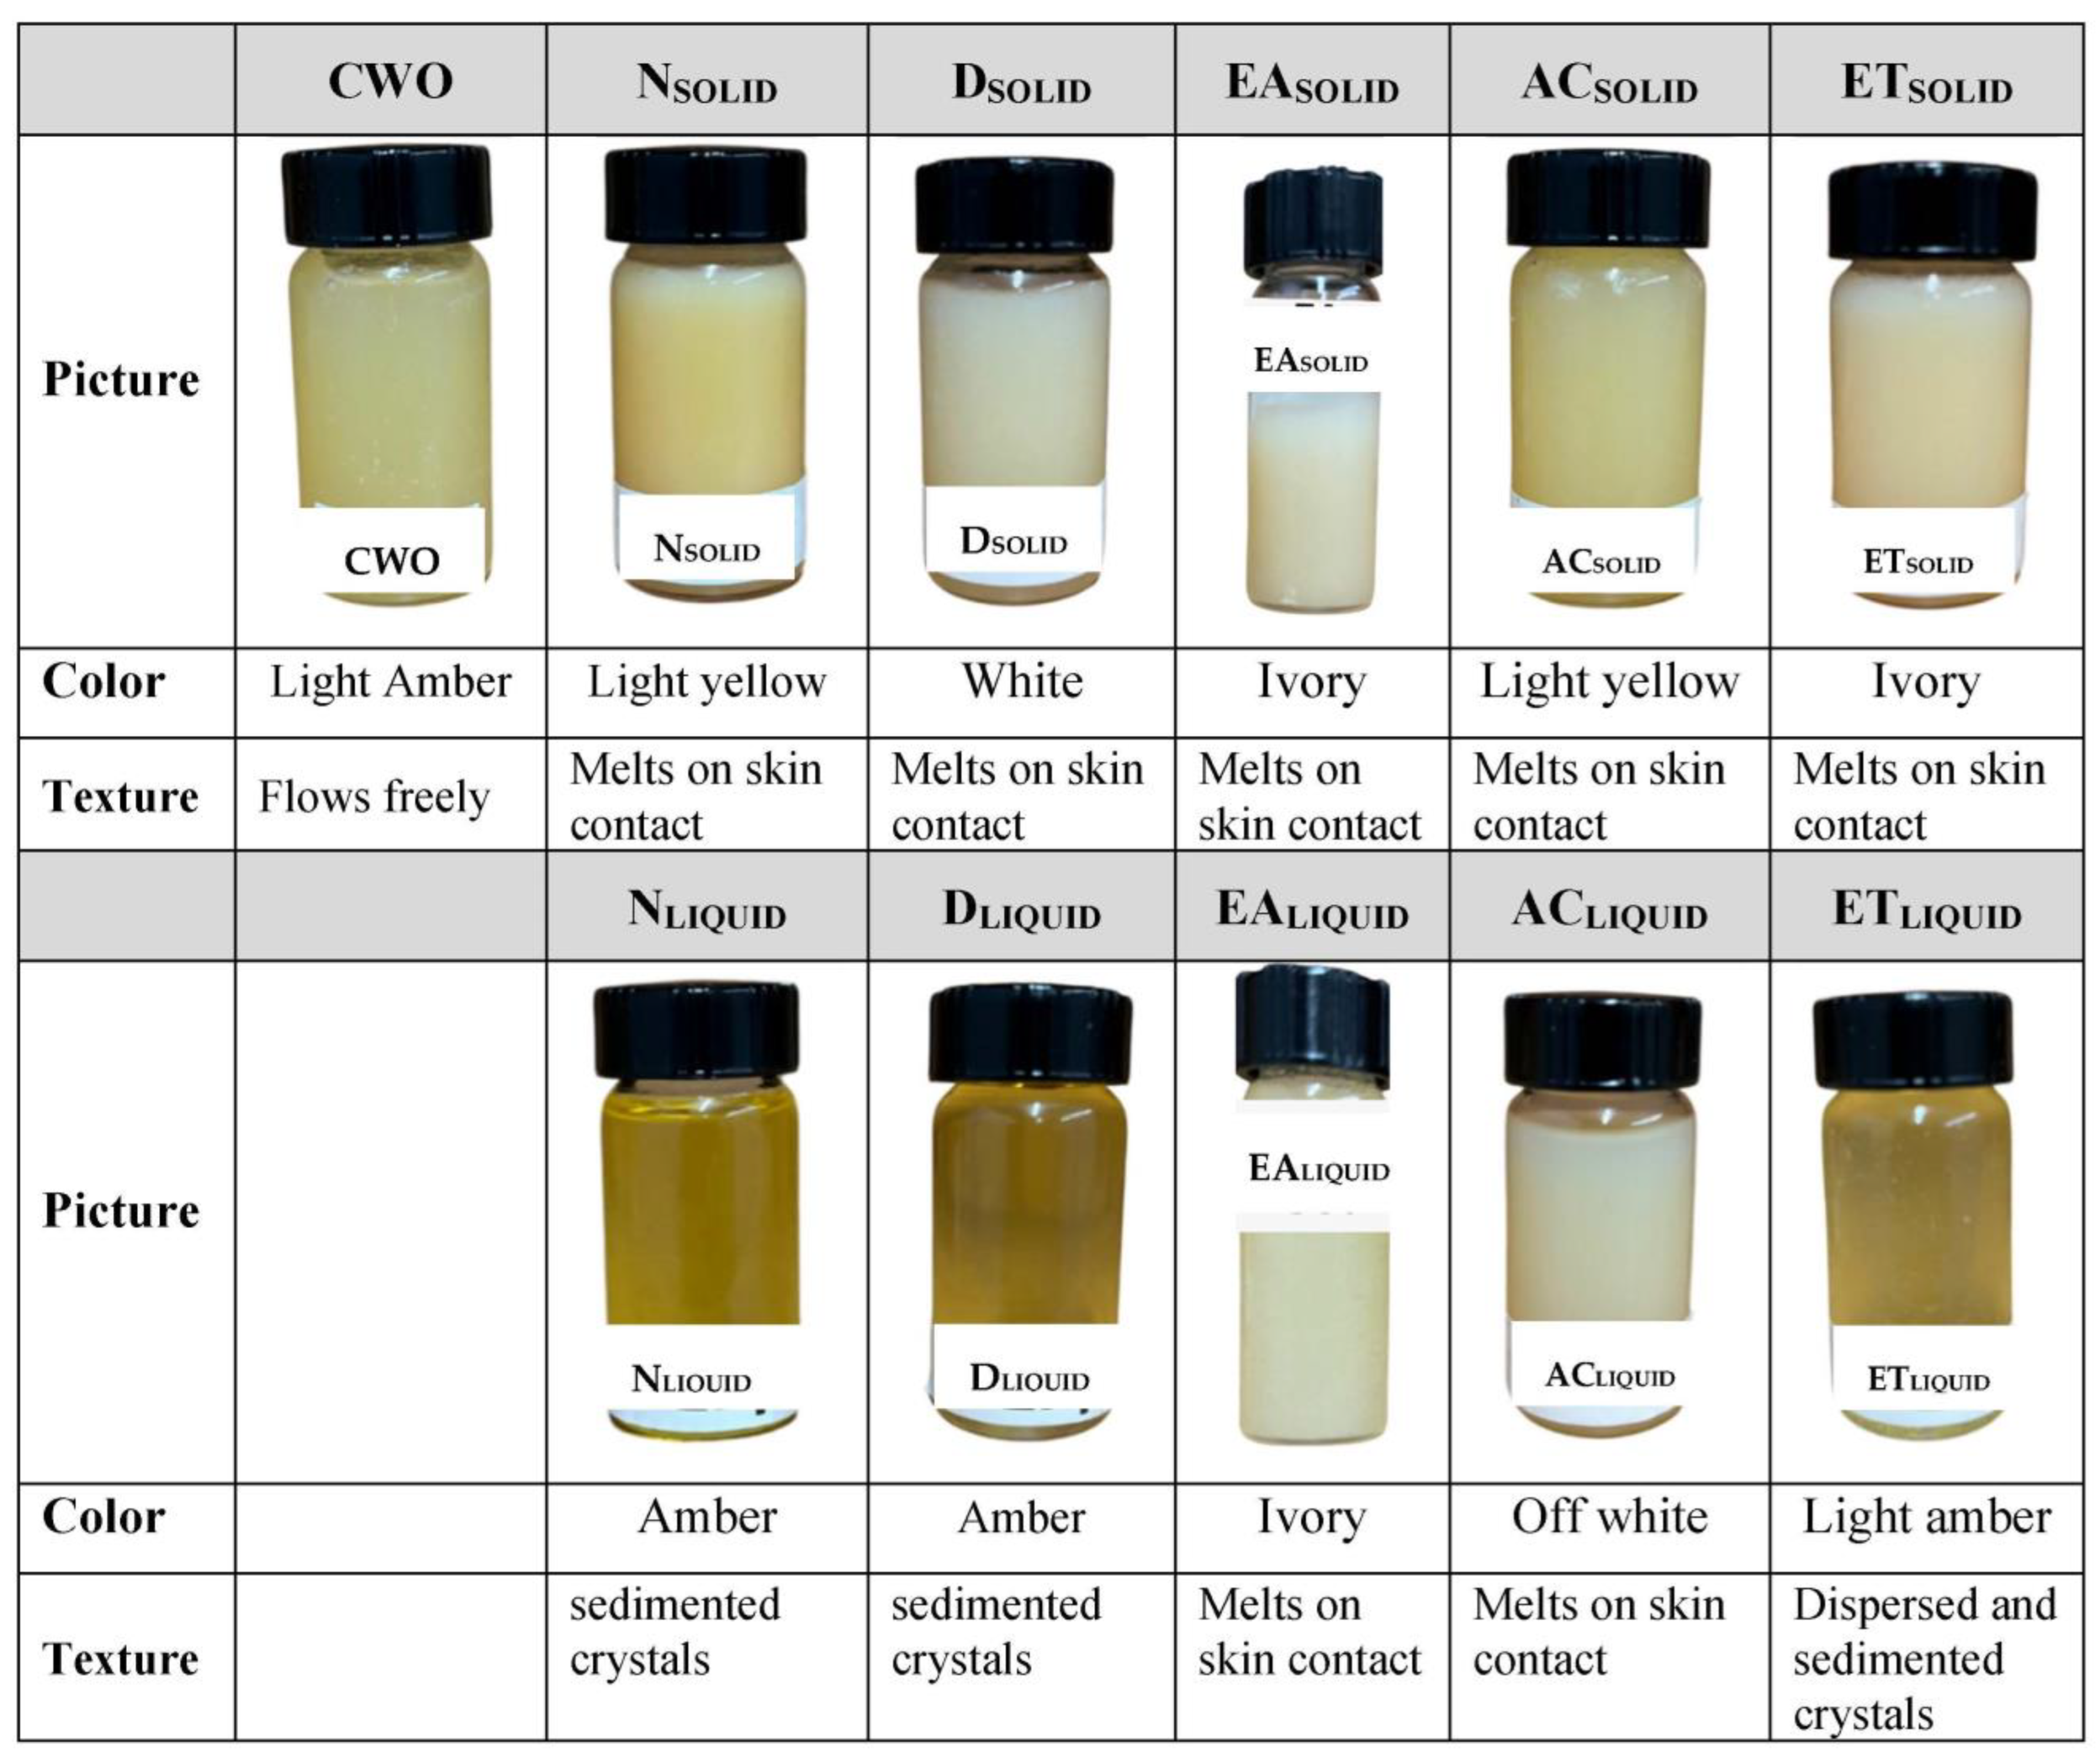
| Name | Abbreviation | |
|---|---|---|
| As purchased | Native Solid CWO | NSOLID |
| Native Liquid CWO | NLIQUID | |
| Unseparated Crabwood Oil | CWO | |
| Fractions | ||
| Dry Fractionation | Dry Solid | DSOLID |
| Dry Liquid | DLIQUID | |
| With Ethanol (Et) | Soluble in Et | ETSOLID |
| Insoluble in Et | ETLIQUID | |
| With Acetone (Ac) | Soluble in Ac | ACSOLID |
| Insoluble in Ac | ACLIQUID | |
| With Ethyl Acetate (EA) | Soluble in EA | EALIQUID |
| Insoluble in EA | EASOLID | |
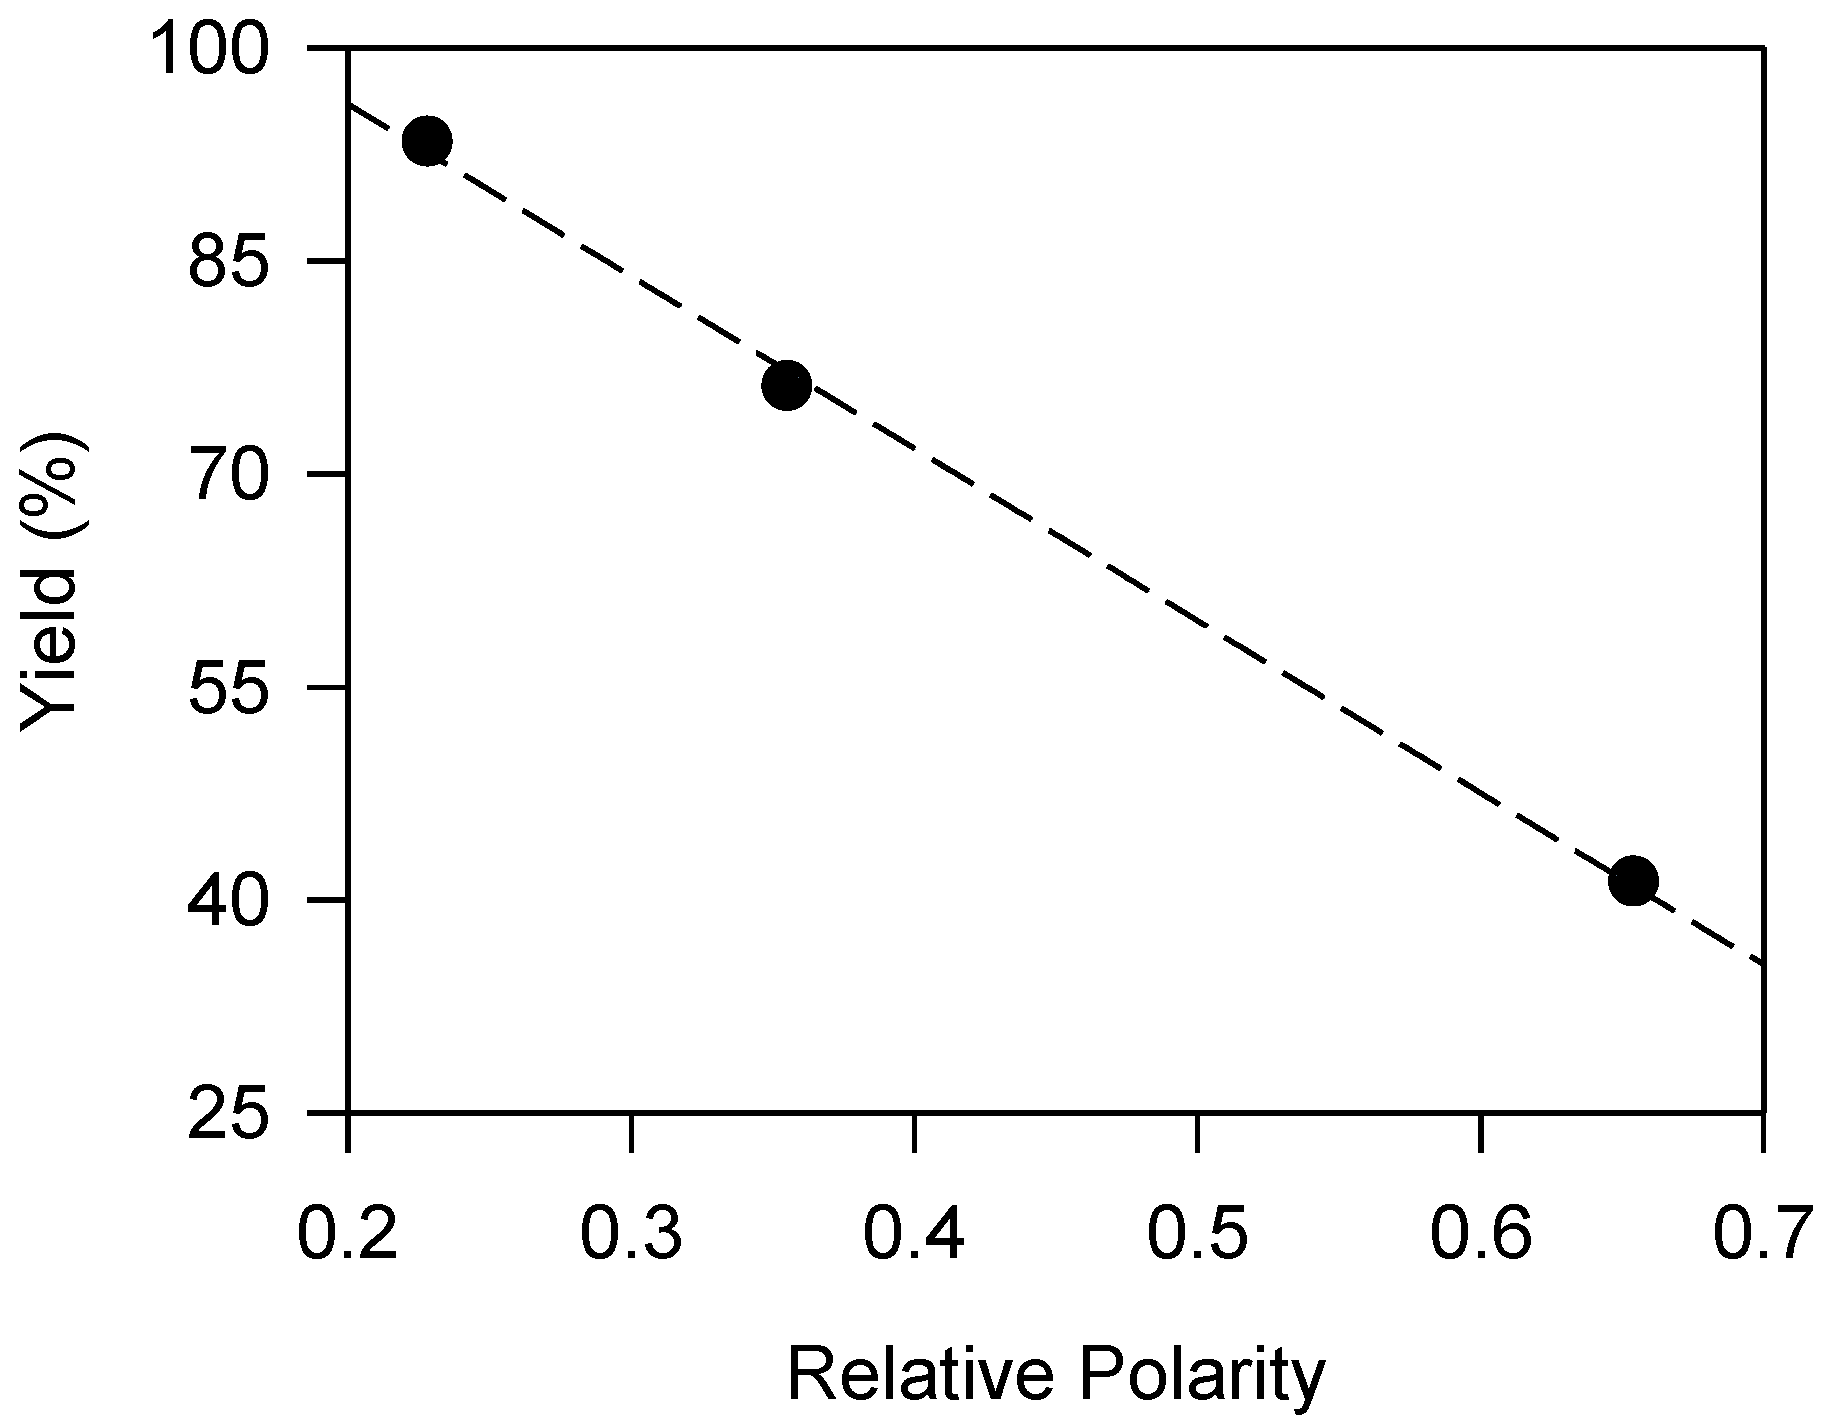
| Method | Relative Polarity | pKa | CWO Mass (g) | Mass Loss (g) | Mass Loss (%) | Mass Result (g) | Solid Fraction Yield (%) | ||
|---|---|---|---|---|---|---|---|---|---|
| Solid | Liquid | Total | |||||||
| Dry | NA | NA | 258 | 3.4 | 1.3 | 74.8 | 177.5 | 252.3 | 29.3 |
| Ethyl Acetate | 0.228 | 25 | 50 | 3.5 | 7.0 | 3.1 | 43.5 | 46.6 | 6.2 |
| Acetone | 0.355 | 20 | 200 | 5.5 | 2.7 | 148.3 | 46.3 | 194.6 | 74.1 |
| Ethanol | 0.654 | 15.9 | 200 | 4.7 | 2.4 | 80.6 | 114.7 | 195.3 | 40.3 |
| Sample | MW (g/mol) |
|---|---|
| CWO | 858.8 |
| DSOLID | 862.1 |
| DLIQUID | 859.1 |
| ETSOLID | 863.7 |
| ETLIQUID | 857.1 |
| ACSOLID | 862.5 |
| ACLIQUID | 850.0 |
| EA LIQUID | 858.4 |
| EA SOLID | 858.5 |
| NSOLID | 863.0 |
| NLIQUID | 858.2 |
Disclaimer/Publisher’s Note: The statements, opinions and data contained in all publications are solely those of the individual author(s) and contributor(s) and not of MDPI and/or the editor(s). MDPI and/or the editor(s) disclaim responsibility for any injury to people or property resulting from any ideas, methods, instructions or products referred to in the content. |
© 2023 by the authors. Licensee MDPI, Basel, Switzerland. This article is an open access article distributed under the terms and conditions of the Creative Commons Attribution (CC BY) license (https://creativecommons.org/licenses/by/4.0/).
Share and Cite
James, S.O.; Bouzidi, L.; Emery, R.J.N.; Narine, S.S. Lipid Fractionation and Physicochemical Characterization of Carapa guianensis Seed Oil from Guyana. Processes 2023, 11, 2565. https://doi.org/10.3390/pr11092565
James SO, Bouzidi L, Emery RJN, Narine SS. Lipid Fractionation and Physicochemical Characterization of Carapa guianensis Seed Oil from Guyana. Processes. 2023; 11(9):2565. https://doi.org/10.3390/pr11092565
Chicago/Turabian StyleJames, Stacy O., Laziz Bouzidi, R. J. Neil Emery, and Suresh S. Narine. 2023. "Lipid Fractionation and Physicochemical Characterization of Carapa guianensis Seed Oil from Guyana" Processes 11, no. 9: 2565. https://doi.org/10.3390/pr11092565