Article

Study of the Effect of Eudragit RSPO on the Photostability of Venlafaxine in a Physical Mixture and in a Melt Form

by
Anna Maślanka
1,
Marek Szlósarczyk
1,*,
Przemysław Talik
1,
Joanna Szafraniec-Szczęsny
2,
Krzysztof Woyna-Orlewicz
3,
Paweł Żmudzki
4 and
Urszula Hubicka
1,*
1
Department of Inorganic and Analytical Chemistry, Faculty of Pharmacy, Jagiellonian University Medical College, Medyczna 9, 30-688 Kraków, Poland
2
CHDE Polska S.A., Biesiadna 7, 35-304 Rzeszów, Poland
3
Department of Pharmaceutical Technology and Biopharmaceutics, Faculty of Pharmacy, Jagiellonian University Medical College, Medyczna 9, 30-688 Kraków, Poland
4
Department of Medicinal Chemistry, Faculty of Pharmacy, Jagiellonian University Medical College, Medyczna 9, 30-688 Kraków, Poland
*
Authors to whom correspondence should be addressed.
Processes 2023, 11(8), 2479; https://doi.org/10.3390/pr11082479
Submission received: 22 July 2023 / Revised: 10 August 2023 / Accepted: 16 August 2023 / Published: 18 August 2023
(This article belongs to the Special Issue Pharmaceutical Development and Bioavailability Analysis (Volume II))

Abstract

:
The effect of Eudragit RSPO on the photostability of venlafaxine in a physical mixture and as a melt was studied. A validated ultra-high-performance liquid chromatography mass spectrometry method was used to determine the content of venlafaxine alongside degradation products. The most likely structures of the degradation products were determined by mass spectrometry. The samples were evaluated before and after exposure to ultraviolet A by differential scanning calorimetry and scanning electron microscopy. The kinetic parameters of the decomposition of venlafaxine in the physical mixture and melt form were calculated and comparable to those of venlafaxine as an active pharmaceutical ingredient. The results indicate that the process of venlafaxine decomposition is more than three times slower in the venlafaxine–eudragit melt than in its physical mixture with eudragit and its pure form. The strong photoprotective nature of the tested polymer against venlafaxine in the melt form was also confirmed by differential scanning calorimetry and scanning electron microscopy.

1. Introduction

One of the many factors influencing the stability of the drug is electromagnetic radiation, which initiates the photochemical transformation process and causes changes in the chemical structure of the exposed compound. Electromagnetic radiation is characterised by different wavelengths, which are associated with different energies, which in turn affect the photodegradation process. The influence of light on pharmaceutical products is important in pharmaceutical technology, both during manufacturing processes and during storage. Irradiation can result in a reduction or loss of drug activity as well as the formation of toxic photodegradation products. Therefore, the photostability study is an integral part of the evaluation of drug stability, which is crucial in each stage of the drug development process as well as in its registration to ensure drug safety and efficacy [1,2,3,4,5]. The photostability testing of the drug should prove that the active substance exposed to light will not proceed with the degradation process that leads to the formation of products with an activity profile different from that of the active pharmaceutical ingredient (API) [6]. The increased consumption of psychotropic medications is associated with the risk of their occurrence in the environment in different ways, e.g., patient excretion (excrements), municipal or hospital wastewater, as well as medical waste [7]. Photodegradation is considered one of the most effective methods of wastewater treatment [8].
Venlafaxine (VEN) is a third-generation antidepressant belonging to the serotonin-norradrenaline reuptake inhibitor (SNRI) class. It is used to treat generalised and social anxiety disorder, paroxysmal anxiety, and severe depressive disorder [9,10,11].
In the available literature, there are several papers that describe VEN’s photostability. Yin et al. [12] reported the long-term effect of visible and fluorescent radiation on VEN stability investigated by high-performance liquid chromatography tandem mass spectrometry (HPLC/MS/MS) depending on pH [12]. In other research, the effects of UV radiation were combined with an oxidant (H2O2) [13] and the addition of Fenton’s reagent [14]. Some authors also proposed a photocatalytic study on the stability of VEN under UV/TiO2 conditions [15]. The study of the impact of ultraviolet (UV) radiation on the degradation process of VENs is described in the following papers [16,17,18].
The excipients found in pharmaceuticals can be photochemical reaction inhibitors, being vulnerable to the effects of free radicals and inhibiting the degradation process of API. However, the excipients can undergo the photodegradation process, be a source of peroxides, or participate in free radical reactions [19,20]. Furthermore, pharmaceutical excipients are usually incorporated into dosage forms in a larger quantity than the API, making up approximately 90% of the total mass/volume of drugs [21]. One of such excipients is Eudragit®, or rather, a family of polymers—polymethacrylates—widely used to develop modified-release drug delivery systems in pharmaceutics. They are well known for their versatility in terms of solubility, swelling properties, and [22]. Among them, Eudragit RSPO (EUD) is a copolymer made of methyl methacrylate and ethyl acrylate with a small amount of methacrylic acid ester containing quaternary ammonium groups. It is insoluble in water and has a low permeability, with swelling independent of pH. EUD is used to create water-insoluble film coats and to obtain a delayed and controlled release profile of the active substance, most often from tablets [23]. There are several articles that indicate its protective role against UV–VIS radiation based on studies on pantoprazole [24,25], ranitidine [26], clotrimazole [27], and desonide [28]. However, the mentioned studies were limited to micro- and nanocapsulation processes. The results obtained for conventional dosage forms indicate that Eudragit reduces the destructive effect of near ultraviolet radiation and affects VEN stability [18].
This work examines the influence of EUD on the photostability of VEN in a physical mixture and melt form. For this purpose, UHPLC/MS/MS was used for the determination of VEN and its degradation products. The mentioned method was validated, and the results were described in our previous publication [18]. In this work, the kinetic evaluation of the photodegradation process and the identification of the degradation products obtained were performed using mass spectrometry. Scanning electron microscopy (SEM) was proposed for the physical characterization of solid samples (morphology and structure) before and after the UV irradiation process. Analogously, differential scanning calorimetry (DSC) was used to determine the transition temperatures and enthalpy changes of the solid samples studied. There is no information in the available literature about the effect of EUD on VEN stability.

2. Materials and Methods

2.1. Chemicals and Reagents

Venlafaxine hydrochloride assay: 99.8% (LGC Promochem Ltd., Poznań, Poland). Eudragit RSPO (pulverised Eudragit RS 100, Evonik, Darmstadt, Germany). Metanol p.a., acetonitryl p.a. (Chempur, Piekary Śląskie, Poland). Acetonitryl (for LC-MS) and formic acid (98%) (Sigma Aldrich, Steinheim, Germany) and HPLC water obtained from HLP 5 generator (Hydrolab, Straszyn, Poland).

2.2. Physical Mixture and Melt form of VEN and EUD Preparation

A physical mixture of VEN and EUD was prepared in a mass ratio of 1:5, accurately weighing on an analytical balance (WWA 100/C/1, Radwag, Radom, Poland): 0.1018 g and 0.5028 g of VEN and EUD, respectively. The whole mixture was then thoroughly mixed.
In the same way, the VEN–EUD melt was prepared using weights of 0.5001 g and 2.5032 g of VEN and EUD, respectively. The obtained sample was placed in an evaporation dish and heated at 150 °C for 30 min. After the solidification process, the sample was ground using an agate mortar.

2.3. Sample Preparation and Irradiation Conditions

The amount of 75.0 mg of pure VEN, the physical mixture of VEN–EUD, and the VEN–EUD melt (both containing 75.0 mg of VEN) were weighed using Petri dishes (dia. 5.7 cm). A dark control sample was prepared analogously for each sample and enclosed by four layers of aluminium foil to protect it from radiation.
The samples were exposed to UVA irradiation for 78 days and conditioned in the KBF-ICH 240 climatic chamber (Binder GmbH, Tuttlingen, Germany). The contents of the sample dishes were thoroughly mixed every few days. After a certain number of days of irradiation, according to the research protocol, the substances were weighed and dissolved in methanol, obtaining solutions with concentrations of approximately 1.00 mg mL−1.
The following conditions were used throughout the irradiation process: temperature of 20 °C, relative humidity of 60%, and radiation range of 320 to 400 nm (maximum emission at λ = 365 nm). A distance of 13 cm between the samples and the radiation source was used. A VLX-3W microprocessor-controlled radiometer with a sensor (CX-365) was used to measure the radiation dosage that was emitted (Vilber Lourmat, Marne-la-Vallée, France), and the mean value was 5.09 × 10⁻³ J cm min−1 for each irradiation time.

2.4. UHPLC-MS/MS Analysis

Analyses were carried out using a UHPLC-MS/MS system composed of a Waters Acquity® UPLC® (Waters Corporation, Milford, MA, USA) coupled with a Waters TQD mass spectrometer (electrospray ionisation mode ESI-tandem quadrupole). Chromatographic separations were performed using the Acquity UPLC BEH™ C18 column (2.1 × 100 mm, 1.7 µm particle size), equipped with the Acquity UPLC BEH C18 VanGuard pre-column (2.1 × 5 mm, 1.7 µm particle size). The column was maintained at 40 °C, and elution took place in gradient mode using from 95% to 0% of eluent A for 10 min (flow rate of 0.3 mL min−1). Eluent A: 0.1% (v/v) formic acid in water; eluent B: 0.1% (v/v) formic acid in acetonitrile.
Chromatograms were acquired using eλ PDA detector from Waters. Spectra with a resolution of 1.2 nm and a sampling rate of 20 points/s were analysed in the 200–700 nm range.
The settings for MS detection on the Waters TQD mass spectrometer were as follows: source temperature 150 °C, desolvation temperature 350 °C, desolvation gas flow rate 600 L h−1, cone gas flow 100 L h−1, capillary voltage 3.00 kV, cone voltage 20 V. Nitrogen was used for both nebulizing and drying gas. Data were acquired in a scan mode ranging from 50 to 1000 m/z at 0.5 s intervals; 8 scans were summed to obtain the final spectrum.
Collision-activated dissociation (CAD) analyses were performed with an energy of 30 eV, and all fragmentations were observed in the source. Consequently, the ion spectra were obtained by scanning in the 50–500 m/z range. MassLynx V 4.1 from Waters Corporation was used as the data acquisition software.

2.5. Kinetic Studies

The following kinetic parameters were also calculated: photodegradation reaction rate constant k and the degradation half-times t0.1 and t0.5, after which 10% and 50% of the initial substances degraded, respectively. Changes in the concentration of VEN that occur during UVA irradiation were determined, and the log c = f (t) relationships were calculated.

2.6. Scanning Electron Microscopy (SEM) Imaging

The morphology of the particles was determined by means of a Phenom Pro desktop electron microscope (Thermo Fisher Scientific, Waltham, MA, USA) equipped with a CeB6 electron source and a detector for the backscattered electron. Each sample was placed on a specimen mount with conductive double-sided adhesive tape and measured using a nonconductive sample holder at an acceleration voltage of 10 kV. The excess of the sample (loosely bound to the tape) was removed by the use of a stream of argon. Micrographs were taken at a magnification of 300×.

2.7. Differential Scanning Calorimetry

The DSC thermograms of the compounds under study were obtained using an Exstar DSC7020 (Hitachi Group) module equipped with DSC7020 electric cooling unit. Calibration was carried out with pure indium and tin standards (T = 156.6 °C, ΔH = 28.6 J g−1, and T = 231.9 °C, ΔH = 60.6 J g−1). Samples of approximately 5 mg in solid form were placed in an aluminium pan (40 μL), accurately weighted, sealed, and heated at a scan rate of 10 °C min−1 under a nitrogen flow of 50 mL min-1. The melting behaviour was analysed using an empty pan as a reference. The maximum temperatures Tmax were used for further analyses.

3. Results

3.1. Study of the Photostability of VEN in Substance, Physical Mixture with EUD, and Melt Form

The degree of VEN degradation in the samples before UVA irradiation and during the process was assessed by UHPLC. Before UVA exposure, only peaks corresponding to VEN (tR ≈ 3.70 ± 0.02 min) were recorded in the chromatograms obtained for VEN in the substance and its physical mixture with EUD (Figure 1 and Figure 2). In the chromatograms of the VEN melt with EUD before UVA exposure, an additional peak (tR ≈ 4.02 ± 0.04 min) was recorded next to the VEN peak, the size of which did not change during irradiation (Figure 3). This is likely to be a product of the thermal decomposition of VEN formed during melt preparation. After UVA exposure, the peaks of the VEN photodegradation products were recorded in all samples (Figure 4, Figure 5 and Figure 6). Peaks of five photoproducts with retention times of 1.37 ± 0.01 min, 2.04 ± 0.01 min, 2.12 ± 0.01 min, 2.22 ± 0.04 min, and 3.98 ± 0.03 min were recorded on the VEN in substance and VEN–EUD physical mixture chromatograms after 64 days of exposure to UVA (Figure 4 and Figure 5). Only three peaks of photodegradation products (2.04 min, 2.22 min, and 3.98 min) were recorded in the VEN–EUD melt chromatograms after 78 days of exposure to UVA (Figure 6).
In contrast, no changes were observed when dark control and EUD were exposed to UVA light (Figure 7, Figure 8 and Figure 9).

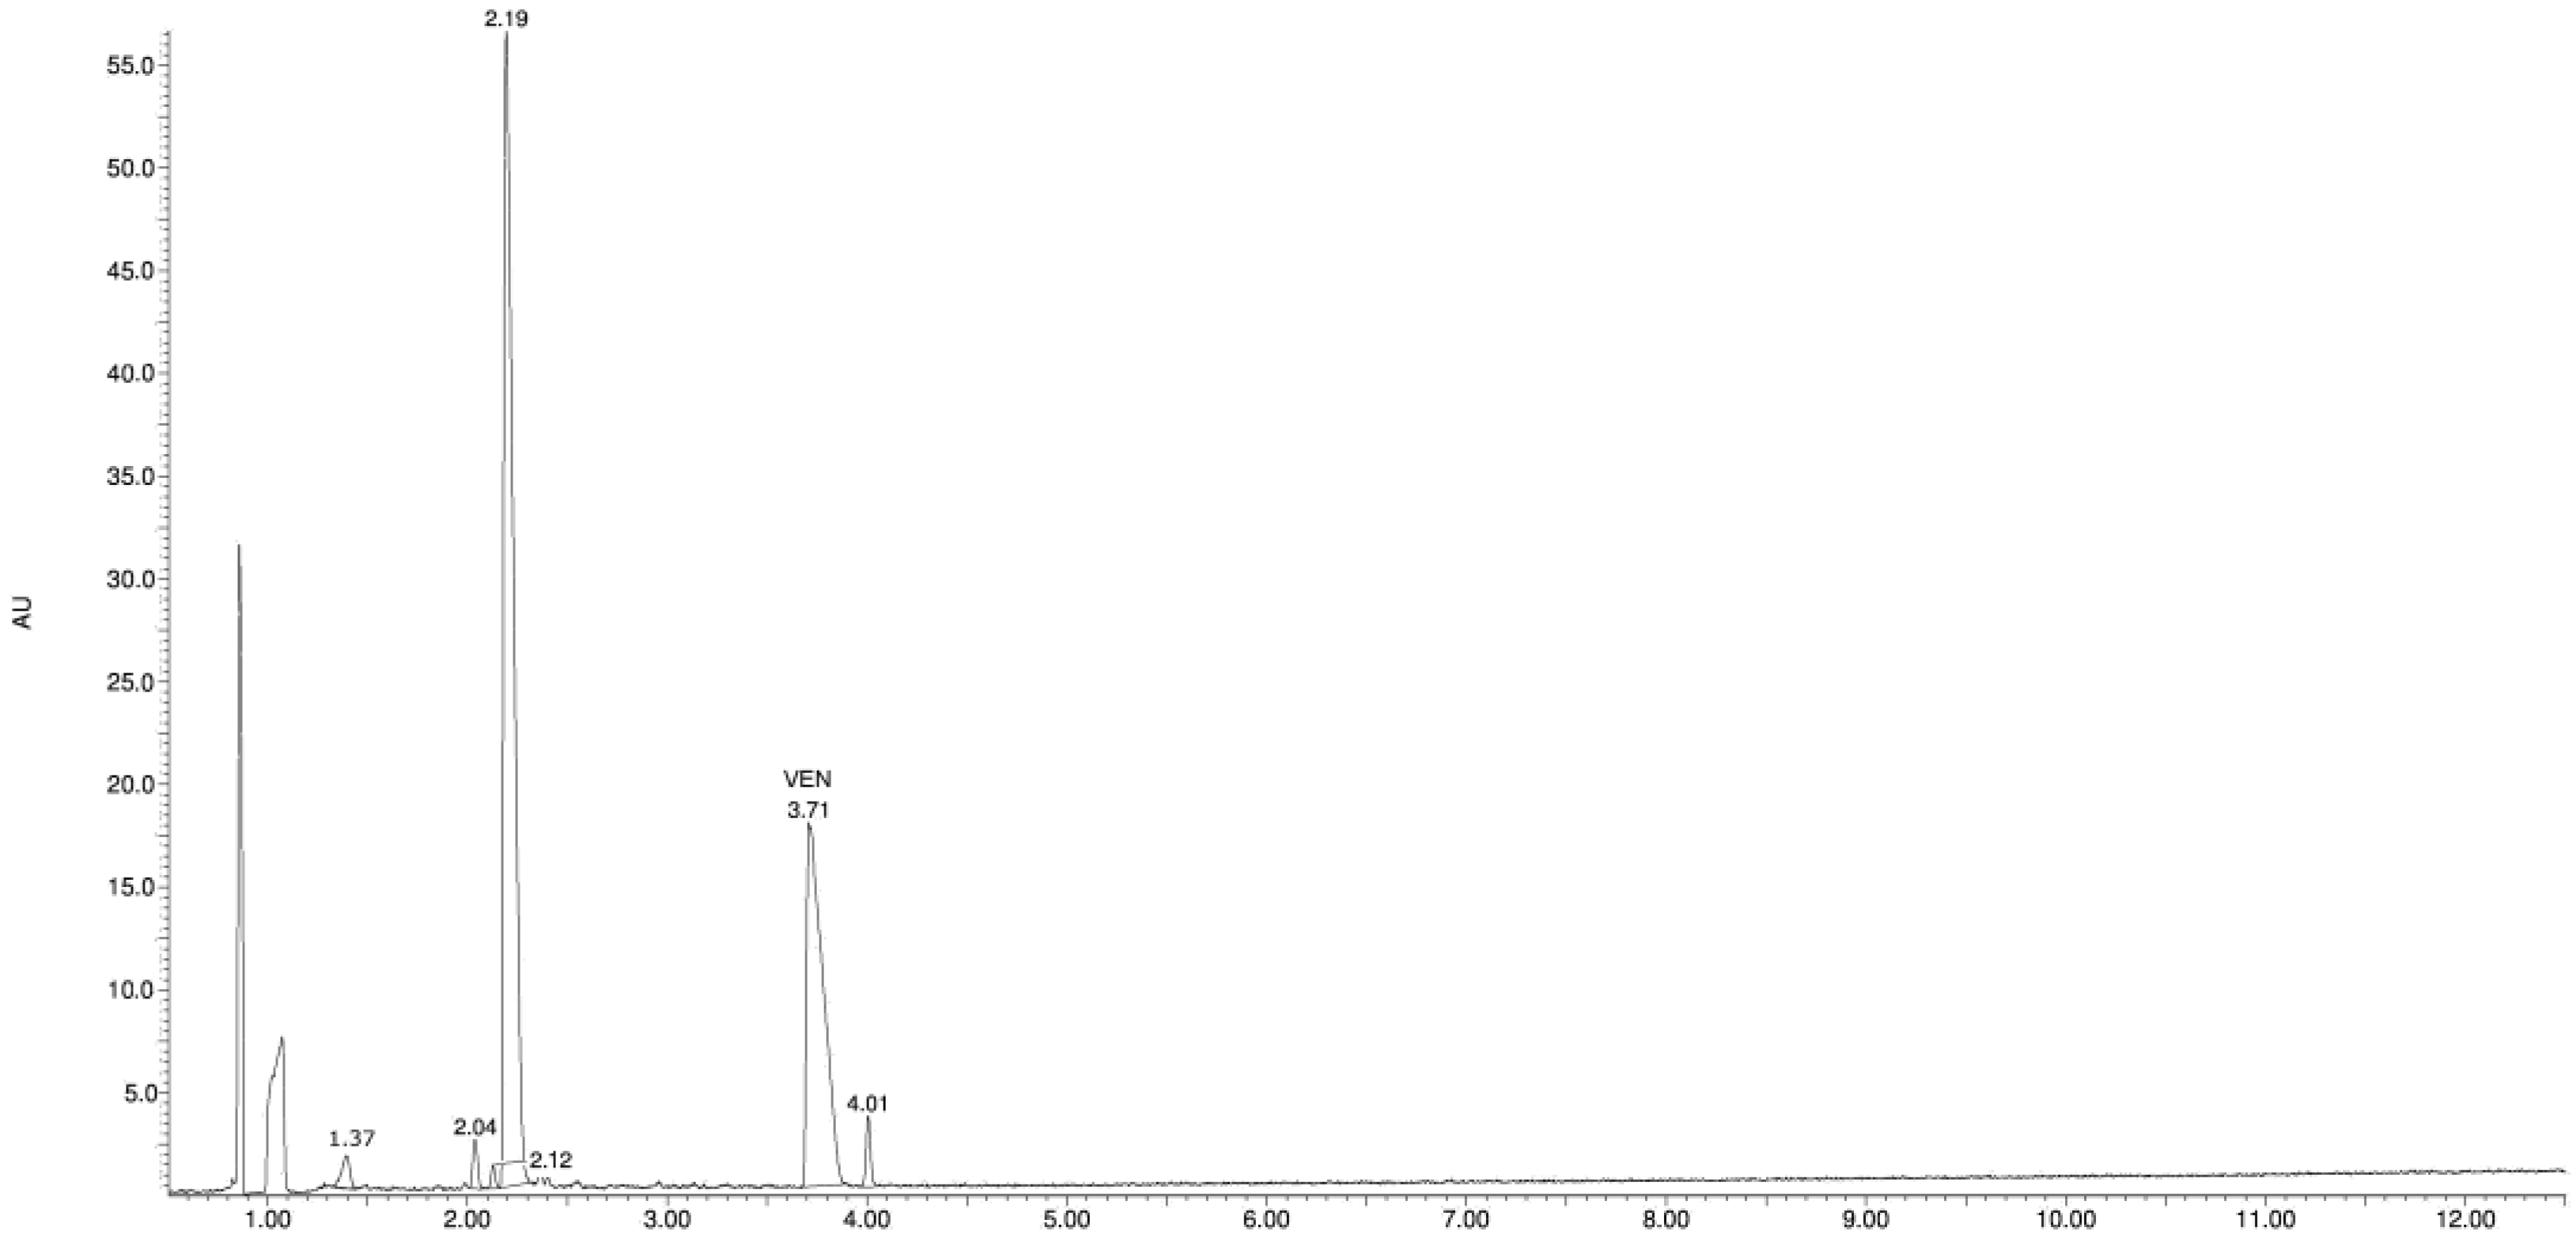
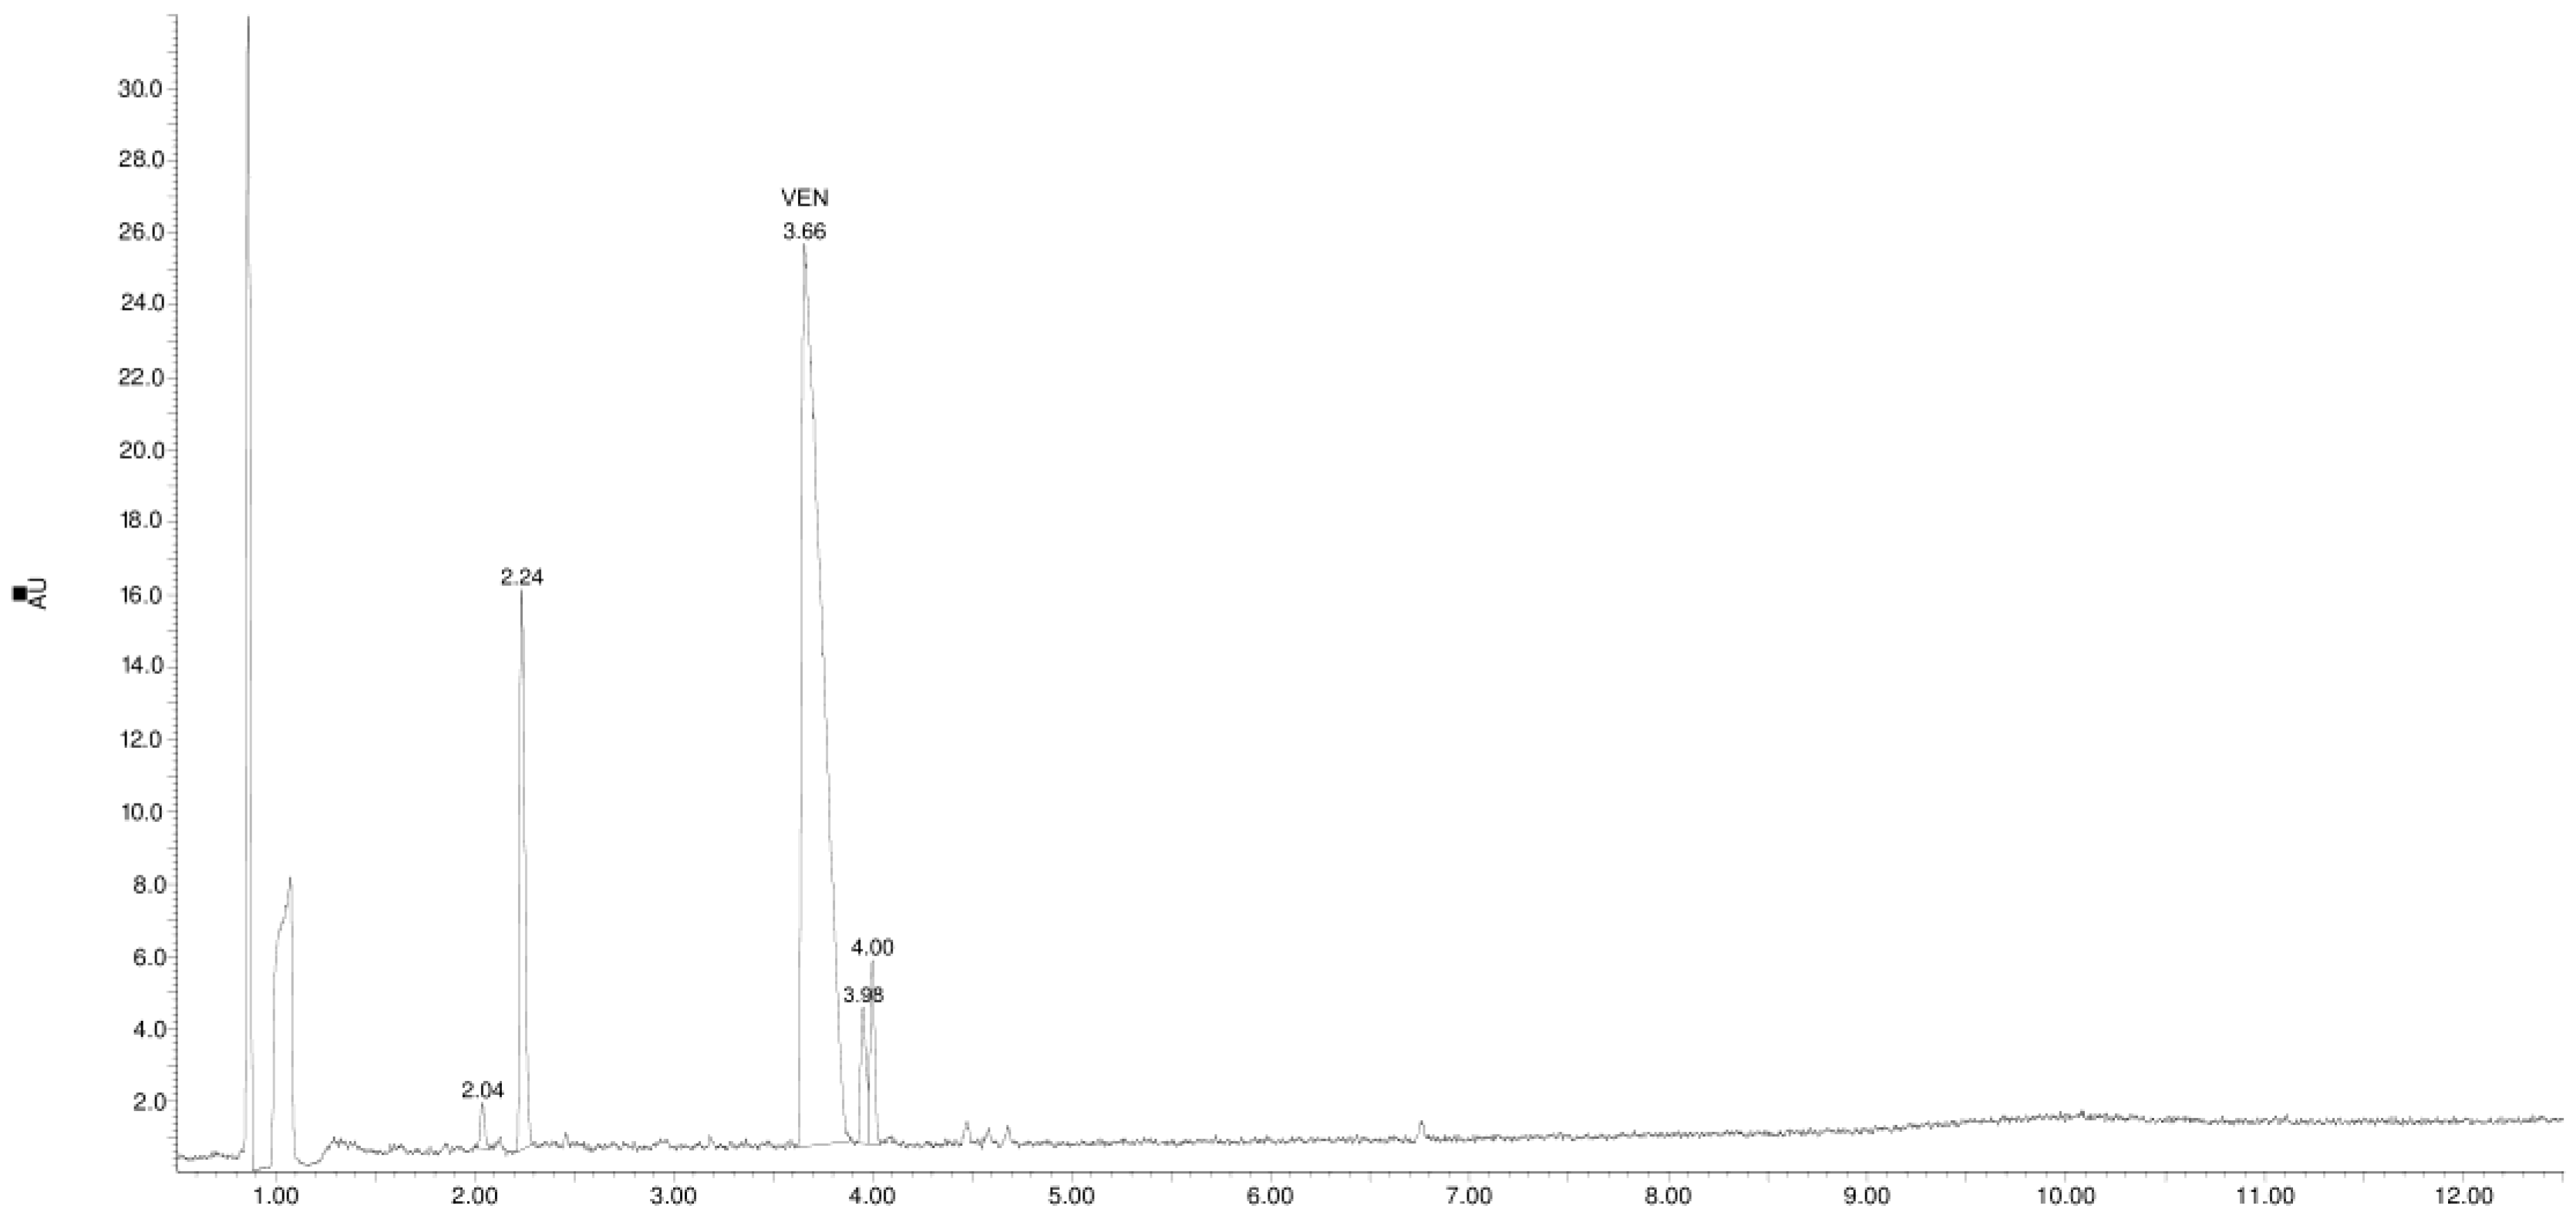
3.2. Identification of Degradation Products

The structures of newly formed photodegradation products of VEN were proposed based on UHPLC/MS analysis supported by MS/MS fragmentation patterns. VEN’s long-term photodegradation in the solid state seems to cause the oxidation of the methylene group near the nitrogen atom (products, VP-1–VP-4) and the breaking of the C-C bond between the cyclohexyl moiety and the ethylene chain (products, VP-1–VP-5). Furthermore, for the product VP-2, further oxidation of the ethylene chain was observed, and for products VP-1 and VP-3, the demethylation of oxygen atoms (VP-1) or nitrogen atoms (VP-3) occurred. The breaking of the C-N bond between the dimethylamino group and the ethylene chain and the formation of the hydroxyl derivative (product VP-5) were also observed. Table 1 summarises the proposed structures of degradation products with their specifications.

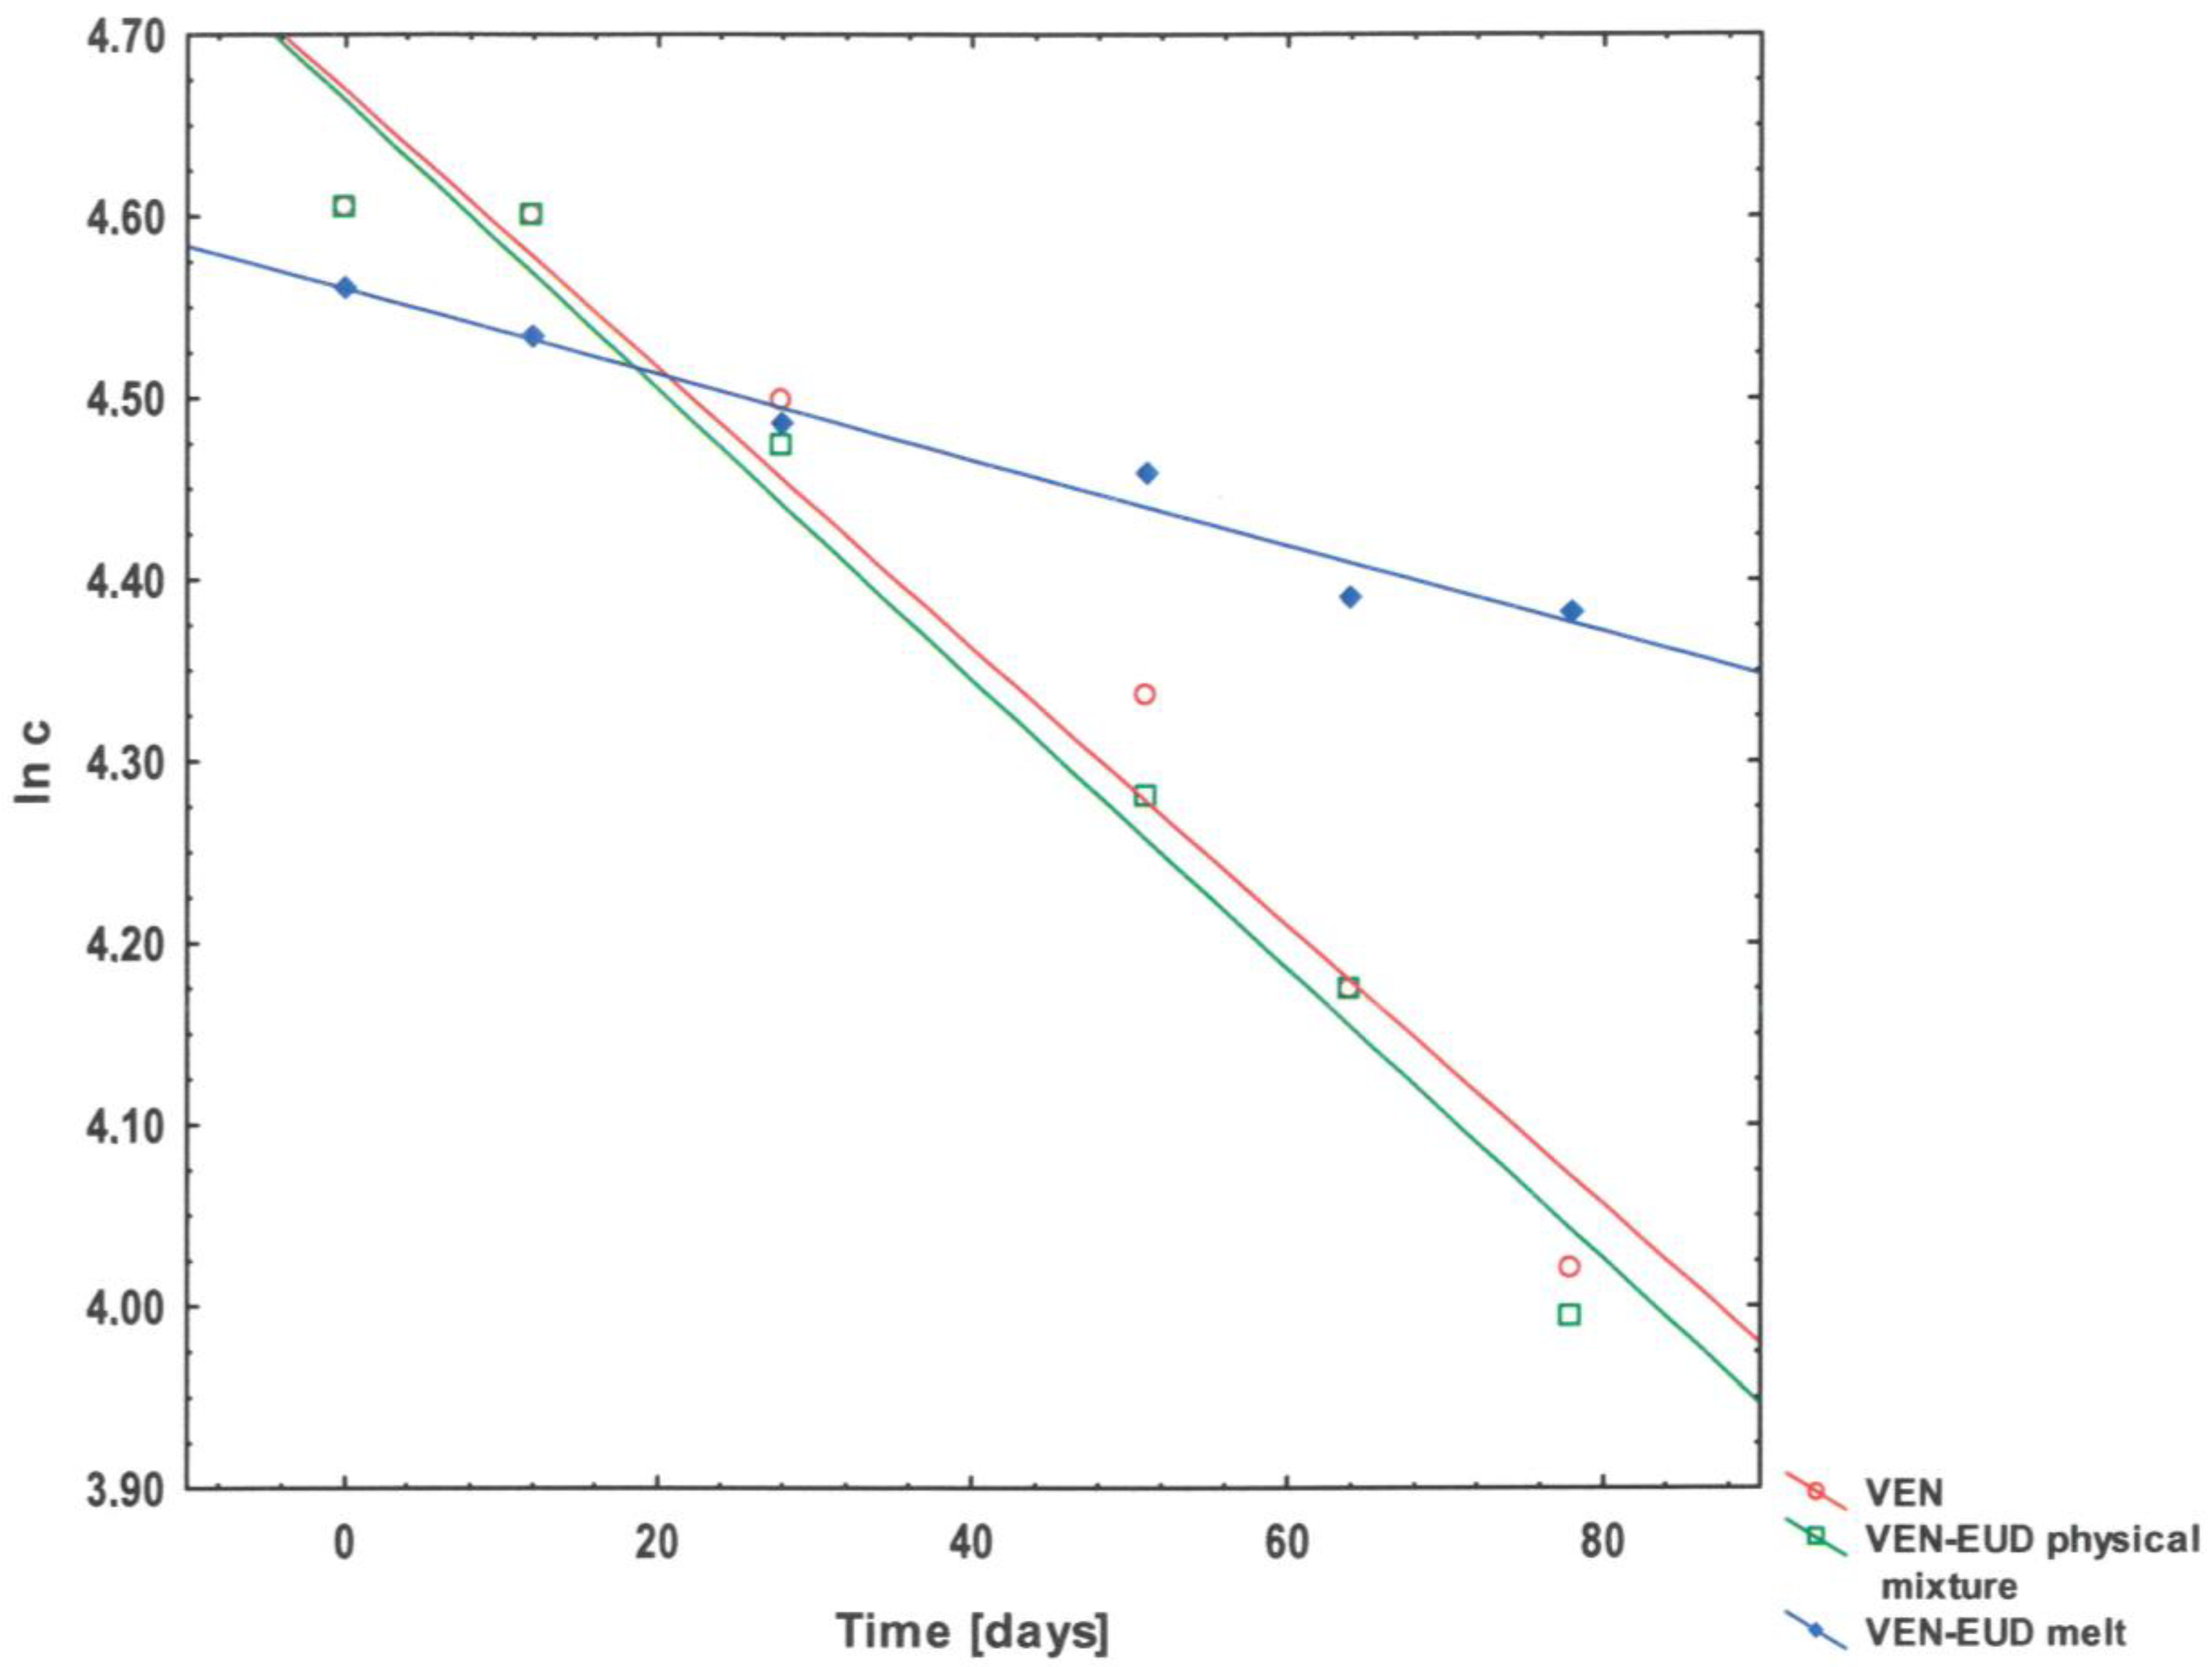
3.3. Kinetic Studies

Changes in the concentration of VEN that occur during UVA irradiation were determined to follow first-order reaction kinetics (Figure 10).
The degradation rate constants and times t0.1 and t0.5 of the VEN photodegradation process in the substance and in the physical mixture with EUD do not differ much from each other, indicating a similar rate of this process. Whereas the kinetic parameters determined for the VEN–EUD melt indicate more than 3-fold slower decomposition of VEN in relation to other forms (Table 2).

3.4. Scanning Electron Microscopy Imaging

The analysis of SEM images revealed that before UVA irradiation, Eudragit® RSPO (Figure 11, sample A, upper panel) exhibited sharp-edged irregular particles on a smooth surface. The majority of particles had a diameter between 120 µm and 180 µm. There was also a fraction of smaller particles, having diameters between 20 µm and 50 µm. After irradiation, no significant changes in either particle morphology or size were noticed, which indicates that the excipient is not sensitive to applied UVA radiation (Figure 11, sample A, lower panel).
In the case of pure VEN (Figure 11, sample D, upper panel), before UVA exposure, the sample contained rod-like particles, many of which were combined in bunches or agglomerated, as seen in the middle of Figure 11, sample D, upper panel. The particle size along the long axis varied between 20 µm and 320 µm. After irradiation (Figure 11, sample D, lower panel), all the structural features changed; instead of rod-like particles, spherical aggregates of diameter varying from 200 µm to 400 µm appeared. It indicates the drug substance degraded upon exposure to UVA radiation. To check whether the addition of a polymer excipient inhibits the photodegradation of the drug, a physical mixture and melt of the two substances were obtained and studied using an SEM technique. In the case of a non-irradiated physical mixture (Figure 11, sample B, upper panel), one can distinguish the particles characteristic of the individual components of the sample; irregular particles of EUD and rod-like particles of VEN are well visible. Interestingly, after irradiation (Figure 11, sample B, lower panel), the particles of the polymer stayed intact, while those of the drug substance aggregated, forming a shell around the EUD particles. However, the initial elongated shape of VEN particles can still be observed (please refer to the insert in the image of sample B). It indicates that the addition of the polymer affects, to some extent, the degradation of VEN, even if the components were only physically mixed. In the case of the VEN—EUD melt, no significant differences were noticed between samples before and after UV exposure (Figure 11, sample C). However, the particle morphology differed from that of raw, non-irradiated substances. After melting, the sample exhibited irregular particles with a rough surface with visible pores and a diameter not exceeding 280 µm.

3.5. Differential Scanning Calorimetry (DSC)

DSC analysis provides information on the physical stability of the formulation ingredients after processing technology as well as the state of the drug. In Figure 12, the DSC thermograms of raw VEN, raw EUD, the VEN–EUD physical mixture, and their melt, not exposed to UVA light, are presented. The thermogram of EUD (curve A) shows two fusion peaks at 52.0 °C and 58.5 °C, which were very close to each other and partially overlapped. The DSC trace of raw VEN (curve D) shows a melting endotherm at 210.2 °C [29] with further decomposition. The physical mixture of drug and polymer (curve C) shows two endothermic peaks at Tmax of 57.5 °C and 200.7 °C. The first peak comes from excess amounts of polymer in the matrix, and the second was identified as a new chemical individual as a result of weak interactions between EUD and VEN crystals. Almost similar to curve C is curve B, showing EUD–VEN melt. While the EUD melting peak is at 53.0 °C, the new chemical individual is moved to 182.7 °C, which indicates much stronger interactions between drug and polymer than found in physical mixtures, related to the low drug content in the matrix and its complete dissolution in the polymer (i.e., the presence of VEN in an amorphous state).
In Figure 13, the thermograms of the UVA-irradiated samples are presented. The raw, unprotected VEN is strongly photodegradated, as can be seen on curve D. Similarly, slight but clear photodegradation can be seen for raw EUD, as evidenced by the peaks at 126 °C and 135.1 °C. The VEN covered with EUD (VEN–EUD melt curve B) has an endothermic peak associated with excess amounts of polymer (57.4 °C) and one further broad peak with a Tmax of 125.1 °C. There are no other peaks that could indicate photodegradation, which indicates a strong protective effect of the polymer.
On the DSC curve of the irradiated physical mixture (Figure 13 curve C), a series of small, dimly visible peaks in the temperature range from about 80 °C to 150 °C can be found, which indicates a photodegradation process previously confirmed by UHPLC analysis. A similar meaning is associated with the part of the C curve above 160 °C.
To show this effect, curves A, B, and C are shown in Figure 14 again, this time on a scale that allows better observation of the mentioned small photodegradation peaks. When analysing the pink rectangle associated with the 126.0 °C and 135.1 °C peaks, it should be recalled that the VEN–EUD binary mixture was prepared in a 1:5 ratio. Thus, the peak at 125.1 °C in curve B should be associated with the photodegradation of the EUD. Both grey rectangles (Figure 14, curve C) represent areas of physicochemical change of the analyte caused by photodegradation of VEN in the physical mixture, which are not present in curve B. This confirms that drug-polymer interactions were weak, and VEN in the physical mixture may decompose more than in the melt with EUD.

4. Discussion

When developing the composition and finished form of medicinal products, in addition to therapeutic efficacy, it is necessary to ensure the safety of their use. Both the effectiveness and safety of drugs are closely related to their quality, which is why drug quality control is one of the most important issues in the field of pharmaceutical science. Guidelines for the assessment of the quality of substances for pharmaceutical purposes and thus also medicinal products, developed by recognised organisations such as ICH, FDA, or EMA, focus on the assessment of API stability and on the quantitative and qualitative determination of impurities [1,30]. The factors that can cause API degradation are humidity, temperature, pH, presence of oxidants, and presence of light, the impact of which is checked in the recommended stability tests [1]. The importance of photostability studies is emphasised by the fact that a separate ICH Q1B guideline is dedicated to this topic [2]. It should be emphasised that photodegradation does not only concern changes in the chemical structure of API under the influence of light. Also, the occurrence of radical processes or energy transfer, e.g., related to the presence of excipients, can lead to unexpected effects, especially in the solid phase [31]. The literature on pharmaceuticals emphasises the need to conduct stability studies not only for new medicinal substances but also for older-generation products because their studies were carried out according to older guidelines using outdated methods [32].
VEN is an antidepressant administered i.a. in the form of sustained-release solid dosage forms, like capsules or tablets. There are numerous prolonged-release drug products containing polymethacrylate polymers that are insoluble, have pH-independent swelling, and have low permeability. They release the drug substances by diffusion. EUD is composed of methacrylic acid esters with a small proportion of trimethylammonioethyl methacrylate chloride (Eudragit® Application Guidelines). The molar ratio of the quaternary ammonium groups to the neutral ester groups is 1:40, which results in a low permeability of the material for diffusion. The controlled release effect can be achieved by coating the pellets or small particles as well as by mixing and creating matrix structures during granulation and/or tableting. EUD is also suitable for the preparation of sustained-release forms of VEN by using hot-melt extrusion [33]. Melting techniques result in maximum retardation of the dissolution because the highest material density is combined with the maximum distribution.
In this paper, the effect of EUD on the photostability of VEN was studied in both the physical mixture and the melt. In the peer-reviewed literature, reports of a UV-protective result of EUD have been found; however, pure APIs (pantoprazole, ranitidine, clotrimazole, or desonide) with EUD in the form of micro or nanocapsules have been studied [25,26,27,28]. In this work, a different sample preparation method was used. The VEN–EUD melt sample was prepared in a mass ratio of 1:5, then heated at 150 °C for 30 min, and after the solidification, the sample was grinded. In order to assess the impact of EUD on the VEN photodegradation process, a physical mixture of VEN–EUD was also prepared in a mass ratio of 1:5. The VEN–EUD mixture in a 1:5 ratio is an exemplary combination for achieving the sustained release effect.
The photodegradation process of VEN was assessed using the reverse-phase UHPLC method with gradient elution and registration of chromatograms with a spectrophotometric PDA detector. The method has been validated previously, and a detailed description was provided in our earlier paper [18].
The degradation process of VEN after exposure to UVA radiation in a physical mixture with EUD shows little difference compared with that of pure VEN. The calculated half-lives for VEN and the physical mixture VEN–EUD are t0.5 = 90.0 days and t0.5 = 86.60 days, respectively. In contrast to pure VEN and the form of a physical mixture, the VEN–EUD melt form decomposes to a much lesser extent, and the process is slower (t0.5 = 288.5 days).
The image taken with an electron microscope shows that in the case of the VEN–EUD physical mixture (Figure 11B, upper panel), particles characteristic of the individual components of the sample can be distinguished. Therefore, it can be concluded that the presence of EUD does not limit the direct access of UVA radiation to VEN particles. However, in the case of the VEN–EUD melt, its components are closely connected, which is visible in the micrograph (Figure 11C) in the form of irregular particles with a morphology different from that of the VEN and EUD particles. Therefore, it can be assumed that in the melt, due to this tight combination of both components, EUD may form a coating that overlaps the VEN and has a shield effect on it, consequently decreasing the impact of UVA radiation and significantly slowing down VEN photodegradation. Especially in the melt, there is five times more EUD than VEN. The strong protective nature of the polymer has also been proven in the DSC studies, which indicate that the decomposition observed for the pure VEN and physical mixture EUD–VEN is not observed in the analogous temperature range for the melt under study. Some authors have already demonstrated the protective role of polymethacrylates against UV–VIS radiation [24,25,26,27,28,34]. Pignatello et al. [34] showed the photoprotection effect of Eudragit RS100 and RL100 on diflunisal in the form of solid dispersions in these polymers and proposed a mechanism for their protection activity. They suggested that electrostatic interaction between the drug and the polymer influenced the electron-trapping reaction essential for photodegradation. Moreover, they postulated that the polymer organic functional groups had a scavenging effect on the free radicals generated during the drug degradation process [34].
The chromatograms obtained for VEN and the physical mixture VEN–EUD showed the presence of five degradation products (VP-1–VP-5), in contrast to the VEN–EUD melt, for which only three photoproducts were registered (VP-2, VP-4, and VP-5). The most likely structures (Table 1) for the degradation products of VEN were proposed based on UHPLC/MS analysis, supported by fragmentation patterns obtained from MS/MS experiments. The photoproducts VP-1, VP-2, VP-3, and VP-4 with the proposed structures were described in our previous article on the photodegradation of pure VEN and powdered tablets during exposure to UVA irradiation [18]. To the best of our knowledge, the VP-5 photoproduct (m/z = 153.1 amu) with the proposed structure was described for the first time in this publication. Furthermore, only in the chromatograms recorded for the VEN–EUD melt was a peak with a constant area (tR ≈ 4.02 ± 0.04 min) observed. This peak was probably formed by the thermal decomposition of VEN during melt preparation, and its percentage was about 2%. Unfortunately, the structure of this product has not been established.
We proposed the structures of VEN (m/z = 278.2 amu) degradation products, formed in the solid phase after a long 78-day exposure to UVA, which have a relatively low molecular weight (from m/z = 153.1 amu to m/z = 196.1 amu) and indicate a far-reaching degradation of the compound tested. The proposed structures differ from those described by Lambropoulou et al., which is probably due to the use of different conditions and especially the time of exposure of the VEN to UVA radiation. The photodegradation studies described by Lambropoulou et al. [15] were carried out for VEN in solutions of different pH, in the presence of TiO2 as a catalyst, and using short UVA irradiation times (up to 60 min). They identified a great number of hydroxylated, demethylated, dehydrated, and further oxidised VEN photoproducts. The dehydrated product (m/z = 274 amu), the monohydroxy (m/z = 294 amu), and keto-derivatives (m/z = 292 amu), as well as N-demethylated VEN (m/z = 264 amu), were identified as the main photoproducts [15]. The fact that molecular movements in the solid state are restricted and that the sample’s permeability to oxygen and moisture may be low can lead to differences in the photoproducts formed compared with drug photodegradation occurring in solution [31].

5. Conclusions

Using the UHPLC method, it was found that pure VEN in the solid phase, a physical mixture of VEN with EUD, and VEN–EUD melt are photodegraded during long-term exposure to UVA radiation. It was found that the solid-phase photodegradation process of VEN gives rise to 3–5 photodegradation products. Using tandem mass spectrometry, probable chemical structures of the photoproducts were proposed.
The VEN photodegradation process follows the kinetics of the first-order reaction. The calculated kinetic parameters indicate that the process of VEN decomposition is more than three times slower for VEN–EUD melt than for pure VEN and a physical mixture of VEN and EUD. However, the decomposition rate of VEN in the physical mixture with EUD is comparable to that of pure VEN. The strong photoprotective nature of the tested polymer against VEN in the form of a melt was also confirmed by the DSC method and electron microscope images. Excipients have a wide range of functions in pharmaceutical preparations and impact the quality, safety, and efficacy of medicinal products. It was proven that in the case of VEN, the presence of Eudragit RSPO in the formulation may affect not only the control of API release but also have an impact on its photostability, which should be considered in planning the final formulation form.

Author Contributions

Conceptualization, A.M.; methodology, A.M., P.Ż., P.T., J.S.-S. and K.W.-O.; Software, M.S. and A.M.; validation, A.M.; formal analysis, A.M., P.Ż., P.T. and J.S.-S.; investigation, A.M. and K.W.-O.; writing—original draft, A.M., P.T., M.S. and U.H.; writing—review and editing U.H. and M.S.; supervision, U.H. All authors have read and agreed to the published version of the manuscript.

Funding

The study was partially financed by the Polish Ministry of Science and Education as an R&D project allocated for the years 2022–2023 (N42/DBS/000269).

Data Availability Statement

The data are available from the authors upon reasonable request.

Conflicts of Interest

The authors declare no conflict of interest.

References

  1. ICH. Stability Testing of New Drug Substances and Products, Q1A (R2); ICH: Gunpo-si, Republic of Korea, 2003. [Google Scholar]
  2. ICH. Stability Testing: Photostability Testing of New Drug Substances and Products, Q1B; ICH: Gunpo-si, Republic of Korea, 2003. [Google Scholar]
  3. Baertschi, S.W.; Clapham, D.; Foti, C.; Jansen, P.J.; Kristensen, S.; Reed, R.A.; Templeton, A.C.; Tønnesen, H.H. Implications of In-Use Photostability: Proposed Guidance for Photostability Testing and Labeling to Support the Administration of Photosensitive Pharmaceutical Products, Part 1: Drug Products Administered by Injection. J. Pharm. Sci. 2013, 102, 3888–3899. [Google Scholar] [CrossRef] [PubMed]
  4. Henry, B.; Foti, C.; Alsante, K. Can Light Absorption and Photostability Data Be Used to Assess the Photosafety Risks in Patients for a New Drug Molecule? J. Photochem. Photobiol. B 2009, 96, 57–62. [Google Scholar] [CrossRef] [PubMed]
  5. Baertschi, S.W.; Alsante, K.M.; Tønnesen, H.H. A Critical Assessment of the ICH Guideline on Photostability Testing of New Drug Substances and Products (Q1B): Recommendation for Revision. J. Pharm. Sci. 2010, 99, 2934–2940. [Google Scholar] [CrossRef]
  6. Tønnesen, H.H.; Hanne, H. Photostability of Drugs and Drug Formulations, 2nd ed.; CRC Press: Boca Raton, FL, USA, 2004; ISBN 9780415303231. [Google Scholar]
  7. Evgenidou, E.N.; Konstantinou, I.K.; Lambropoulou, D.A. Occurrence and Removal of Transformation Products of PPCPs and Illicit Drugs in Wastewaters: A Review. Sci. Total Environ. 2015, 505, 905–926. [Google Scholar] [CrossRef] [PubMed]
  8. Ren, G.; Han, H.; Wang, Y.; Liu, S.; Zhao, J.; Meng, X.; Li, Z. Recent Advances of Photocatalytic Application in Water Treatment: A Review. Nanomaterials 2021, 11, 1804. [Google Scholar] [CrossRef]
  9. Olver, J.S.; Burrows, G.D.; Norman, T.R. Third-Generation Antidepressants: Do They Offer Advantages over the SSRIs? CNS Drugs 2001, 15, 941–954. [Google Scholar] [CrossRef]
  10. Sansone, R.A.; Sansone, L.A. Serotonin Norepinephrine Reuptake Inhibitors:A Pharmacological Comparison. Innov. Clin. Neurosci. 2014, 11, 37–42. [Google Scholar] [PubMed]
  11. Marsh, W. Venlafaxine. In xPharm: The Comprehensive Pharmacology Reference; Elsevier Inc.: Amsterdam, The Netherlands, 2007; pp. 1–5. ISBN 9780080552323. [Google Scholar]
  12. Yin, L.; Ma, R.; Wang, B.; Yuan, H.; Yu, G. The Degradation and Persistence of Five Pharmaceuticals in an Artificial Climate Incubator during a One Year Period. RSC Adv. 2017, 7, 8280–8287. [Google Scholar] [CrossRef]
  13. García-Galán, J.J.; Anfruns, A.; Gonzalez-Olmos, R.; Rodríguez-Mozaz, S.; Comas, J. UV/H2O2degradation of the Antidepressants Venlafaxine and O-Desmethylvenlafaxine: Elucidation of Their Transformation Pathway and Environmental Fate. J. Hazard Mater 2016, 311, 70–80. [Google Scholar] [CrossRef]
  14. Giannakis, S.; Hendaoui, I.; Jovic, M.; Grandjean, D.; De Alencastro, L.F.; Girault, H.; Pulgarin, C. Solar Photo-Fenton and UV/H2O2 Processes against the Antidepressant Venlafaxine in Urban Wastewaters and Human Urine. Intermediates Formation and Biodegradability Assessment. Chem. Eng. J. 2017, 308, 492–504. [Google Scholar] [CrossRef]
  15. Lambropoulou, D.; Evgenidou, E.; Saliverou, V.; Kosma, C.; Konstantinou, I. Degradation of Venlafaxine Using TiO2/UV Process: Kinetic Studies, RSM Optimization, Identification of Transformation Products and Toxicity Evaluation. J. Hazard Mater 2017, 323, 513–526. [Google Scholar] [CrossRef]
  16. Rúa-Gómez, P.C.; Püttmann, W. Degradation of Lidocaine, Tramadol, Venlafaxine and the Metabolites O-Desmethyltramadol and O-Desmethylvenlafaxine in Surface Waters. Chemosphere 2013, 90, 1952–1959. [Google Scholar] [CrossRef]
  17. Lin, W.; Zhao, B.; Ping, S.; Zhang, X.; Ji, Y.; Ren, Y. Ultraviolet Oxidative Degradation of Typical Antidepressants: Pathway, Product Toxicity, and DFT Theoretical Calculation. Chemosphere 2022, 305, 135440. [Google Scholar] [CrossRef]
  18. Maślanka, A.; Żmudzki, P.; Szlósarczyk, M.; Talik, P.; Hubicka, U. Photodegradation Assessment of Amisulpride, Doxepin, Haloperidol, Risperidone, Venlafaxine, and Zopiclone in Bulk Drug and in the Presence of Excipients. Monatshefte Fur Chem. Chem. Mon. 2020, 151, 483–493. [Google Scholar] [CrossRef]
  19. Girotti, A.W. Photodynamic Lipid Peroxidation in Biological Systems. Photochem. Photobiol. 1990, 51, 497–509. [Google Scholar] [CrossRef] [PubMed]
  20. Jamrógiewicz, M.; Jasińska, K.; Sawicki, W. Photolabile Drug Compounds in the Pharmaceutical Dosage Forms—The Range of Problem. Farm Pol. 2012, 68, 858–866. [Google Scholar]
  21. van der Merwe, J.; Steenekamp, J.; Steyn, D.; Hamman, J. The Role of Functional Excipients in Solid Oral Dosage Forms to Overcome Poor Drug Dissolution and Bioavailability. Pharmaceutics 2020, 12, 393. [Google Scholar] [CrossRef] [PubMed]
  22. Dos Santos, J.; da Silva, G.S.; Velho, M.C.; Beck, R.C.R. Eudragit®: A Versatile Family of Polymers for Hot Melt Extrusion and 3D Printing Processes in Pharmaceutics. Pharmaceutics 2021, 13, 1424. [Google Scholar] [CrossRef] [PubMed]
  23. Patra, C.N.; Priya, R.; Swain, S.; Kumar Jena, G.; Panigrahi, K.C.; Ghose, D. Pharmaceutical Significance of Eudragit: A Review. Future J. Pharm. Sci. 2017, 3, 33–45. [Google Scholar] [CrossRef]
  24. Raffin, R.P.; Colomé, L.M.; Schapoval, E.E.S.; Pohlmann, A.R.; Guterres, S.S. Increasing Sodium Pantoprazole Photostability by Microencapsulation: Effect of the Polymer and the Preparation Technique. Eur. J. Pharm. Biopharm. 2008, 69, 1014–1018. [Google Scholar] [CrossRef]
  25. Dhurke, R.; Kushwaha, I.; Desai, B.G. Improvement in Photostability of Pantoprazole Sodium by Microencapsulation. PDA J. Pharm. Sci. Technol. 2013, 67, 43–52. [Google Scholar] [CrossRef]
  26. Prakash Rao, B.; Rajarajan, S.; Monica, A.; Ramesh, K.; Baby, B.; Nagini, K.S.S.; Vijay Kumar Gupta, N. Spray-Dried Floating Microparticles of Ranitidine HCl by Factorial Design for Oral Delivery. J. Pharm. Sci. Res. 2013, 5, 240–248. [Google Scholar]
  27. Santos, S.S.; Lorenzoni, A.; Ferreira, L.M.; Mattiazzi, J.; Adams, A.I.H.; Denardi, L.B.; Alves, S.H.; Schaffazick, S.R.; Cruz, L. Clotrimazole-Loaded Eudragit® RS100 Nanocapsules: Preparation, Characterization and in Vitro Evaluation of Antifungal Activity against Candida Species. Mater. Sci. Eng. C 2013, 33, 1389–1394. [Google Scholar] [CrossRef] [PubMed]
  28. Rosa, P.; Friedrich, M.L.; dos Santos, J.; Librelotto, D.R.N.; Maurer, L.H.; Emanuelli, T.; da Silva, C.d.B.; Adams, A.I.H. Desonide Nanoencapsulation with Açai Oil as Oil Core: Physicochemical Characterization, Photostability Study and in Vitro Phototoxicity Evaluation. J. Photochem. Photobiol. B 2019, 199, 111606. [Google Scholar] [CrossRef] [PubMed]
  29. Roy, S.; Aitipamula, S.; Nangia, A. Thermochemical Analysis of Venlafaxine Hydrochloride Polymorphs 1-5. Cryst. Growth Des. 2005, 5, 2268–2276. [Google Scholar] [CrossRef]
  30. ICH. Impurities in New Drug Substances—Scientific Guideline, ICH Q3A (R2); ICH: Gunpo-si, Republic of Korea, 2006. [Google Scholar]
  31. Glass, B.D.; Novák, C.; Brown, M.E. The Thermal and Photostability of Solid Pharmaceuticals: A Review. J. Therm. Anal. Calorim. 2004, 77, 1013–1036. [Google Scholar] [CrossRef]
  32. Jamrógiewicz, M. Consequences of New Approach of Chemical Stability Tests of Active Pharmaceutical Ingredients (APIs). Front. Pharmacol. 2016, 7, 166291. [Google Scholar] [CrossRef]
  33. Bounartzi, M.; Panagopoulou, A.; Kantiranis, N.; Malamataris, S.; Nikolakakis, I. Effect of Plasticiser Type on the Hot Melt Extrusion of Venlafaxine Hydrochloride. J. Pharm. Pharmacol. 2014, 66, 297–308. [Google Scholar] [CrossRef]
  34. Pignatello, R.; Ferro, M.; De Guidi, G.; Salemi, G.; Vandelli, M.A.; Guccione, S.; Geppi, M.; Forte, C.; Puglisi, G. Preparation, Characterisation and Photosensitivity Studies of Solid Dispersions of Diflunisal and Eudragit RS100® and RL100®. Int. J. Pharm. 2001, 218, 27–42. [Google Scholar] [CrossRef]
Figure 1. Chromatogram of the VEN before exposure to UV.
Processes 11 02479 g001
Figure 2. Chromatogram of the VEN—EUD physical mixture (1:5 w/w) before exposure to UVA.
Processes 11 02479 g002
Figure 3. Chromatogram of the VEN–EUD melt (1:5 w/w) before exposure to UV.
Processes 11 02479 g003
Figure 4. Chromatogram of the VEN after 64 days of exposure to UVA.
Processes 11 02479 g004
Figure 5. Chromatogram of the VEN—EUD physical mixture (1:5 w/w) after 64 days of exposure to UVA.
Processes 11 02479 g005
Figure 6. Chromatogram of the VEN–EUD melt (1:5 w/w) after 78 days of exposure to UVA.
Processes 11 02479 g006
Figure 7. Chromatogram of the VEN dark control after 78 days of exposure to UVA.
Processes 11 02479 g007
Figure 8. Chromatogram of the EUD before exposure to UVA.
Processes 11 02479 g008
Figure 9. Chromatogram of the EUD after 78 days of exposure to UVA.
Processes 11 02479 g009
Figure 10. The lnc = f(t) graph of photodegradation of VEN, the VEN–EUD physical mixture, and VEN–EUD melt.
Processes 11 02479 g010
Figure 11. SEM images of samples before (upper panel) and after UV exposure (lower panel); (A) EUD, (B) physical mixture of VEN and EUD (1:5 w/w), (C) melt of VEN and EUD (1:5 w/w), (D) VEN.
Processes 11 02479 g011
Figure 12. DSC curves of compounds under study before exposure to UV: (A) EUD, (B) melt of VEN and EUD (1:5 w/w), (C) physical mixture of VEN and EUD (1:5 w/w), (D) raw VEN.
Processes 11 02479 g012
Figure 13. DSC curves of compounds under study after exposure to UVA: (A) EUD, (B) melt of VEN and EUD (1:5 w/w), (C) physical mixture of VEN and EUD (1:5 w/w), (D) raw VEN.
Processes 11 02479 g013
Figure 14. DSC curves of study compounds after exposure to UVA, shown using a different scale than in Figure 13: (A) EUD, (B) melt of VEN and EUD (1:5 w/w), (C) physical mixture of VEN and EUD (1:5 w/w).
Processes 11 02479 g014
Table 1. Proposed products of photodegradation of VEN.
Product IdtR[M + H]+Fragmentation IonsProposed Structure
VP-11.38180.1107.0, 135.0Processes 11 02479 i001
VP-22.04196.1121.1, 148.1, 162.1, 178.1Processes 11 02479 i002
VP-32.12180.1121.1, 148.1, 162.1Processes 11 02479 i003
VP-42.22194.1121.1, 149.1Processes 11 02479 i004
VEN3.70278.2121.1, 147.1, 215.1, 260.2Processes 11 02479 i005
VP-54.00153.1105.1, 135.1Processes 11 02479 i006
Table 2. Kinetic characteristics of the photodegradation process of VEN in different forms.
Substance Namek [Day−1]t0.5 [Days]t0.1 [Days]1 r
VEN pure7.70 × 10−390.0013.680.9779
VEN–EUD physical mixture8.00 × 10−386.6013.160.9854
VEN–EUD melt2.40 × 10−3288.7543.880.9841
1 Correlation coefficient.
Disclaimer/Publisher’s Note: The statements, opinions and data contained in all publications are solely those of the individual author(s) and contributor(s) and not of MDPI and/or the editor(s). MDPI and/or the editor(s) disclaim responsibility for any injury to people or property resulting from any ideas, methods, instructions or products referred to in the content.

