1. Introduction
As China’s shallow coal resources have nearly been exhausted, coal mining in China has shifted to deep-seated strata. Deep-seated strata are characterized by high ground stress and well-developed discontinuities, such as joints and fractures, which result in engineering disasters, such as roof collapse and significant deformation of the surrounding rock, posing significant risks to coal mining operations. The presence of fractures in deep-seated strata rock masses has a substantial contribution on the mechanical character of rocks. Accordingly, the mechanical properties of rock masses containing fractures under the conditions of high ground stress in deep-seated coal strata become a key issue in evaluating the stability of the surrounding rock and in supporting the surrounding rock in coal mining operations.
Many researchers have conducted experimental tests on rock specimens, which contain fissures or joints. Wang researched the failure behaviors and mechanical properties of soft rocks containing different fissures under uniaxial compression. The influence of the fissure dip angle, fissure length, and fissure number on the strength of the rock specimens were studied [
1]. Liu studied the strain and stress distribution characteristics of rock specimens containing a single pre-existing fissure under uniaxial compression [
2]. Tan carried out uniaxial compressive tests on cubic rock-like specimens with fissures, and the effects of the fissure number on the mechanical properties were studied [
3]. In deep-buried strata, rock masses are commonly damaged under triaxial compressive conditions. Therefore, some researchers have studied the mechanical behaviors of fissured rocks under triaxial compression. Yang conducted triaxial compressive tests on both intact and fissured sandstone specimens. Stress–strain curves for sandstone specimens containing different fissures were obtained. The crack evolution characteristics were also studied by using the acoustic emission technique [
4]. Li studied the failure mechanism of rock with prefabricated cracks by conducting compression failure tests on rock with prefabricated fractures under different true triaxial conditions [
5]. Zhou conducted the true triaxial compressive tests on coarse and fine sandstone specimens containing two parallel fissures, and the failure characteristics were studied [
6]. Liu conducted triaxial pulling tests on sandstone rock specimens, which contained a single fissure, and studied the influence of the fissure parameters on the strength of the specimens [
7]. Although experimental tests on fissured rocks can provide accurate data, the lengthy preparation time and high cost of experimental tests make it difficult to obtain large quantities of data for research and analysis purposes.
Different experimental tests on rock specimens containing fissures have been conducted and the mechanical parameters, as well as the failure behaviors, of fissured rocks have been analyzed. Nevertheless, some drawbacks have been encountered during the implementation of experimental tests. For example, only the stress and strain distribution and evolution behaviors on the surface of rock specimens can be measured. Moreover, the failure processes of rock specimens cannot be clearly observed in experimental tests. Therefore, numerical tests on fissured rock specimens have been conducted by researchers. Zare conducted numerical tests on rock-like specimens containing fissures and compared them with experimental tests [
8]. Zhao established particle flow models of rock samples with flaws and conducted numerical tests [
9]. The influence of the inclination angle on the mechanical properties and crack propagation behaviors of the specimens were examined. Manouchehrian carried out numerical tests on rock specimens with notches under triaxial compression to investigate the influence of the notch length on the fracturing behavior of the specimen. Wang studied the mechanical behaviors of sandstone containing a single open fissure under uniaxial compression by conducting numerical tests [
10]. Feng investigated the influence of two unparalleled fissures on the mechanical behavior of rock-like specimens subjected to uniaxial compression through numerical tests [
11]. Wang studied crack coalescence modes and micro-crack propagation law of fissured sandstone specimens by conducting numerical uniaxial tests [
12]. Chen established a discrete element model of rock specimens containing X-shaped fissures and conducted uniaxial compressive tests. The influence of fissures on the mechanical properties of rock specimens were investigated [
13].
Numerical tests on fissured rocks provide a more efficient and cost-effective approach to obtain the mechanical properties of fractured rock masses under different conditions [
14,
15]. However, there are numerous factors that influence the strength of fractured rocks, making it difficult to analyze experimental results through traditional fitting methods. Therefore, some researchers have introduced machine learning techniques to analyze the outcomes of rock experiments. Yu predicted the uniaxial compressive strength of rock by using swarm intelligence optimization algorithms [
16]. Ren established the back propagation (BP) neural network and applied it in rock micro-parameter calibration of PFC numerical models [
17]. Zhang applied the BP neural network model to predict the rock parameters in underground coal mines [
18]. BP neural networks have found extensive applications in the domain of rock mechanics due to their strong learning capability, robustness, ability to achieve parallel processing through distributed computing, and high computational efficiency. However, they still have certain limitations when it comes to analyzing problems with randomness. In particular, the choice of evaluation metrics significantly influences the performance of the network, potentially leading to overfitting and substantial errors in the output predictions of the BP model.
In order to investigate the mechanical properties of deep-seated fissured rock masses in coal mines, this study first conducted triaxial compression laboratory tests on intact and fractured rock specimens. Based on the test results, a numerical model was developed utilizing the discrete element method, with the calibration of micro-mechanical parameters. After the numerical tests were verified by experimental tests, 288 triaxial compression numerical tests on rock specimens under different confining pressures, loading rates, fissure dip angles, and fissure lengths were then conducted to obtain the triaxial compression strength of the rock specimens subjected to various conditions. To address the limitations of conventional back propagation (BP) neural networks in dealing with randomness, an improved BP neural network model was developed for predicting the triaxial compressive strength of fissured rock. The model utilized random factors and interlayer mean square error correction as the evaluation function. The triaxial compressive strength of fractured rock was predicted using both the conventional and improved BP neural network models. Through comparative analysis, it was found that the modified BP neural network model had smaller prediction errors and significantly reduced overfitting, making it an effective tool for predicting the strength of fractured rock in deep-seated geological formations in coal mines.
3. Numerical Tests on Fissured Rock Specimens
The triaxial compressive strength of fractured rock specimens is affected by various factors, and the extensive range of combinations of these factors poses challenges, namely in conducting separate experimental tests for every scenario. For the purpose of studying the influence of various parameters (confining pressure, prefabricated fissure angles, etc.) on the specimen’s mechanical character, more tests under different parameters need to be conducted. Considering experimental tests are time consuming and costly, numerical tests were implemented. First of all, discrete element method (DEM) numerical models of the specimens were established by using particle flow code (PFC) simulation. Secondly, numerical tests were performed, and the obtained results were compared with those from the experimental tests, enabling the calibration of micro-parameters for the DEM models. Subsequently, the accuracy of the numerical tests was validated through a comparative analysis of the experimental and numerical test results for the fissured specimens. Finally, more numerical tests with various parameters were conducted and the test results were recorded.
3.1. Numerical Model Establishment
A model of an intact cylinder specimen, with a height of 100 mm and a diameter of 50 mm, was developed. The model contained 44,143 particles with diameters ranging from 0.7 to 1.1 mm. A cylindrical wall and two panel walls were built to apply the confining load and axial load, respectively (shown in
Figure 4).
Traditionally, the method of removing particles has been used to form fissures in PFC models. However, deleting particles can result in uneven fissure surfaces, which is inconsistent with reality. As shown in
Figure 4, in this study, during the numerical model pre-pressing phase, a wall is created at the joint position through editing the FISH code, and prefabricated fissures are generated within the wall after the pre-pressing is completed. The fissure surfaces generated using this method are smooth and unaffected by the particle radius. Using the aforementioned method, a PFC numerical model of the fissured rock specimens is established, with the actual rock specimen parameters, where the fissure length is set to 20 mm, and the fissure dip angle is set to 0°, 15°, 30°, 45°, 60°, and 90°.
3.2. Parameter Calibrations for the Numerical Model
In order to calibrate the micro-parameters of the PFC numerical model, laboratory triaxial compression tests were conducted on four intact specimens, along with corresponding numerical simulations. The numerical tests were repeated multiple times until the mechanical behavior of the numerical model closely matched that of the rock specimens. As demonstrated in
Table 3, the errors in the triaxial compressive strength between the numerical model and the rock specimens were less than 5%, thus validating the accuracy of the numerical experiments. The calibrated micro-parameters of the PFC model are shown in
Table 4.
3.3. Numerical Test Results
Upon calibrating the micro-parameters of the numerical model, to further substantiate the precision of the numerical experiments, numerical models of the fissured rock specimens were developed employing the parameters derived from the aforementioned rock specimens. The procedures for the numerical tests were established by referring to the experimental tests, thereby simulating the experimental tests conducted on the fissured rock specimens. By comparing the results of the experimental tests with the numerical tests, the accuracy and effectiveness of the numerical tests were further validated.
Numerical tests were conducted encompassing all combinations of the test parameters, including four confining pressures (15 MPa, 20 MPa, 25 MPa, 30 MPa), six fracture angles (0°, 15°, 30°, 45°, 60°, 90°), four fracture lengths (10 mm, 15 mm, 20 mm, 25 mm), and three loading rates (0.001 mm/s, 0.002 mm/s, 0.003 mm/s). A total of 288 numerical triaxial compression tests were conducted on the fissured rock specimens, and the triaxial compressive strength values were obtained. Due to space constraints, only a portion of the test results are shown in
Figure 5 and
Table 5.
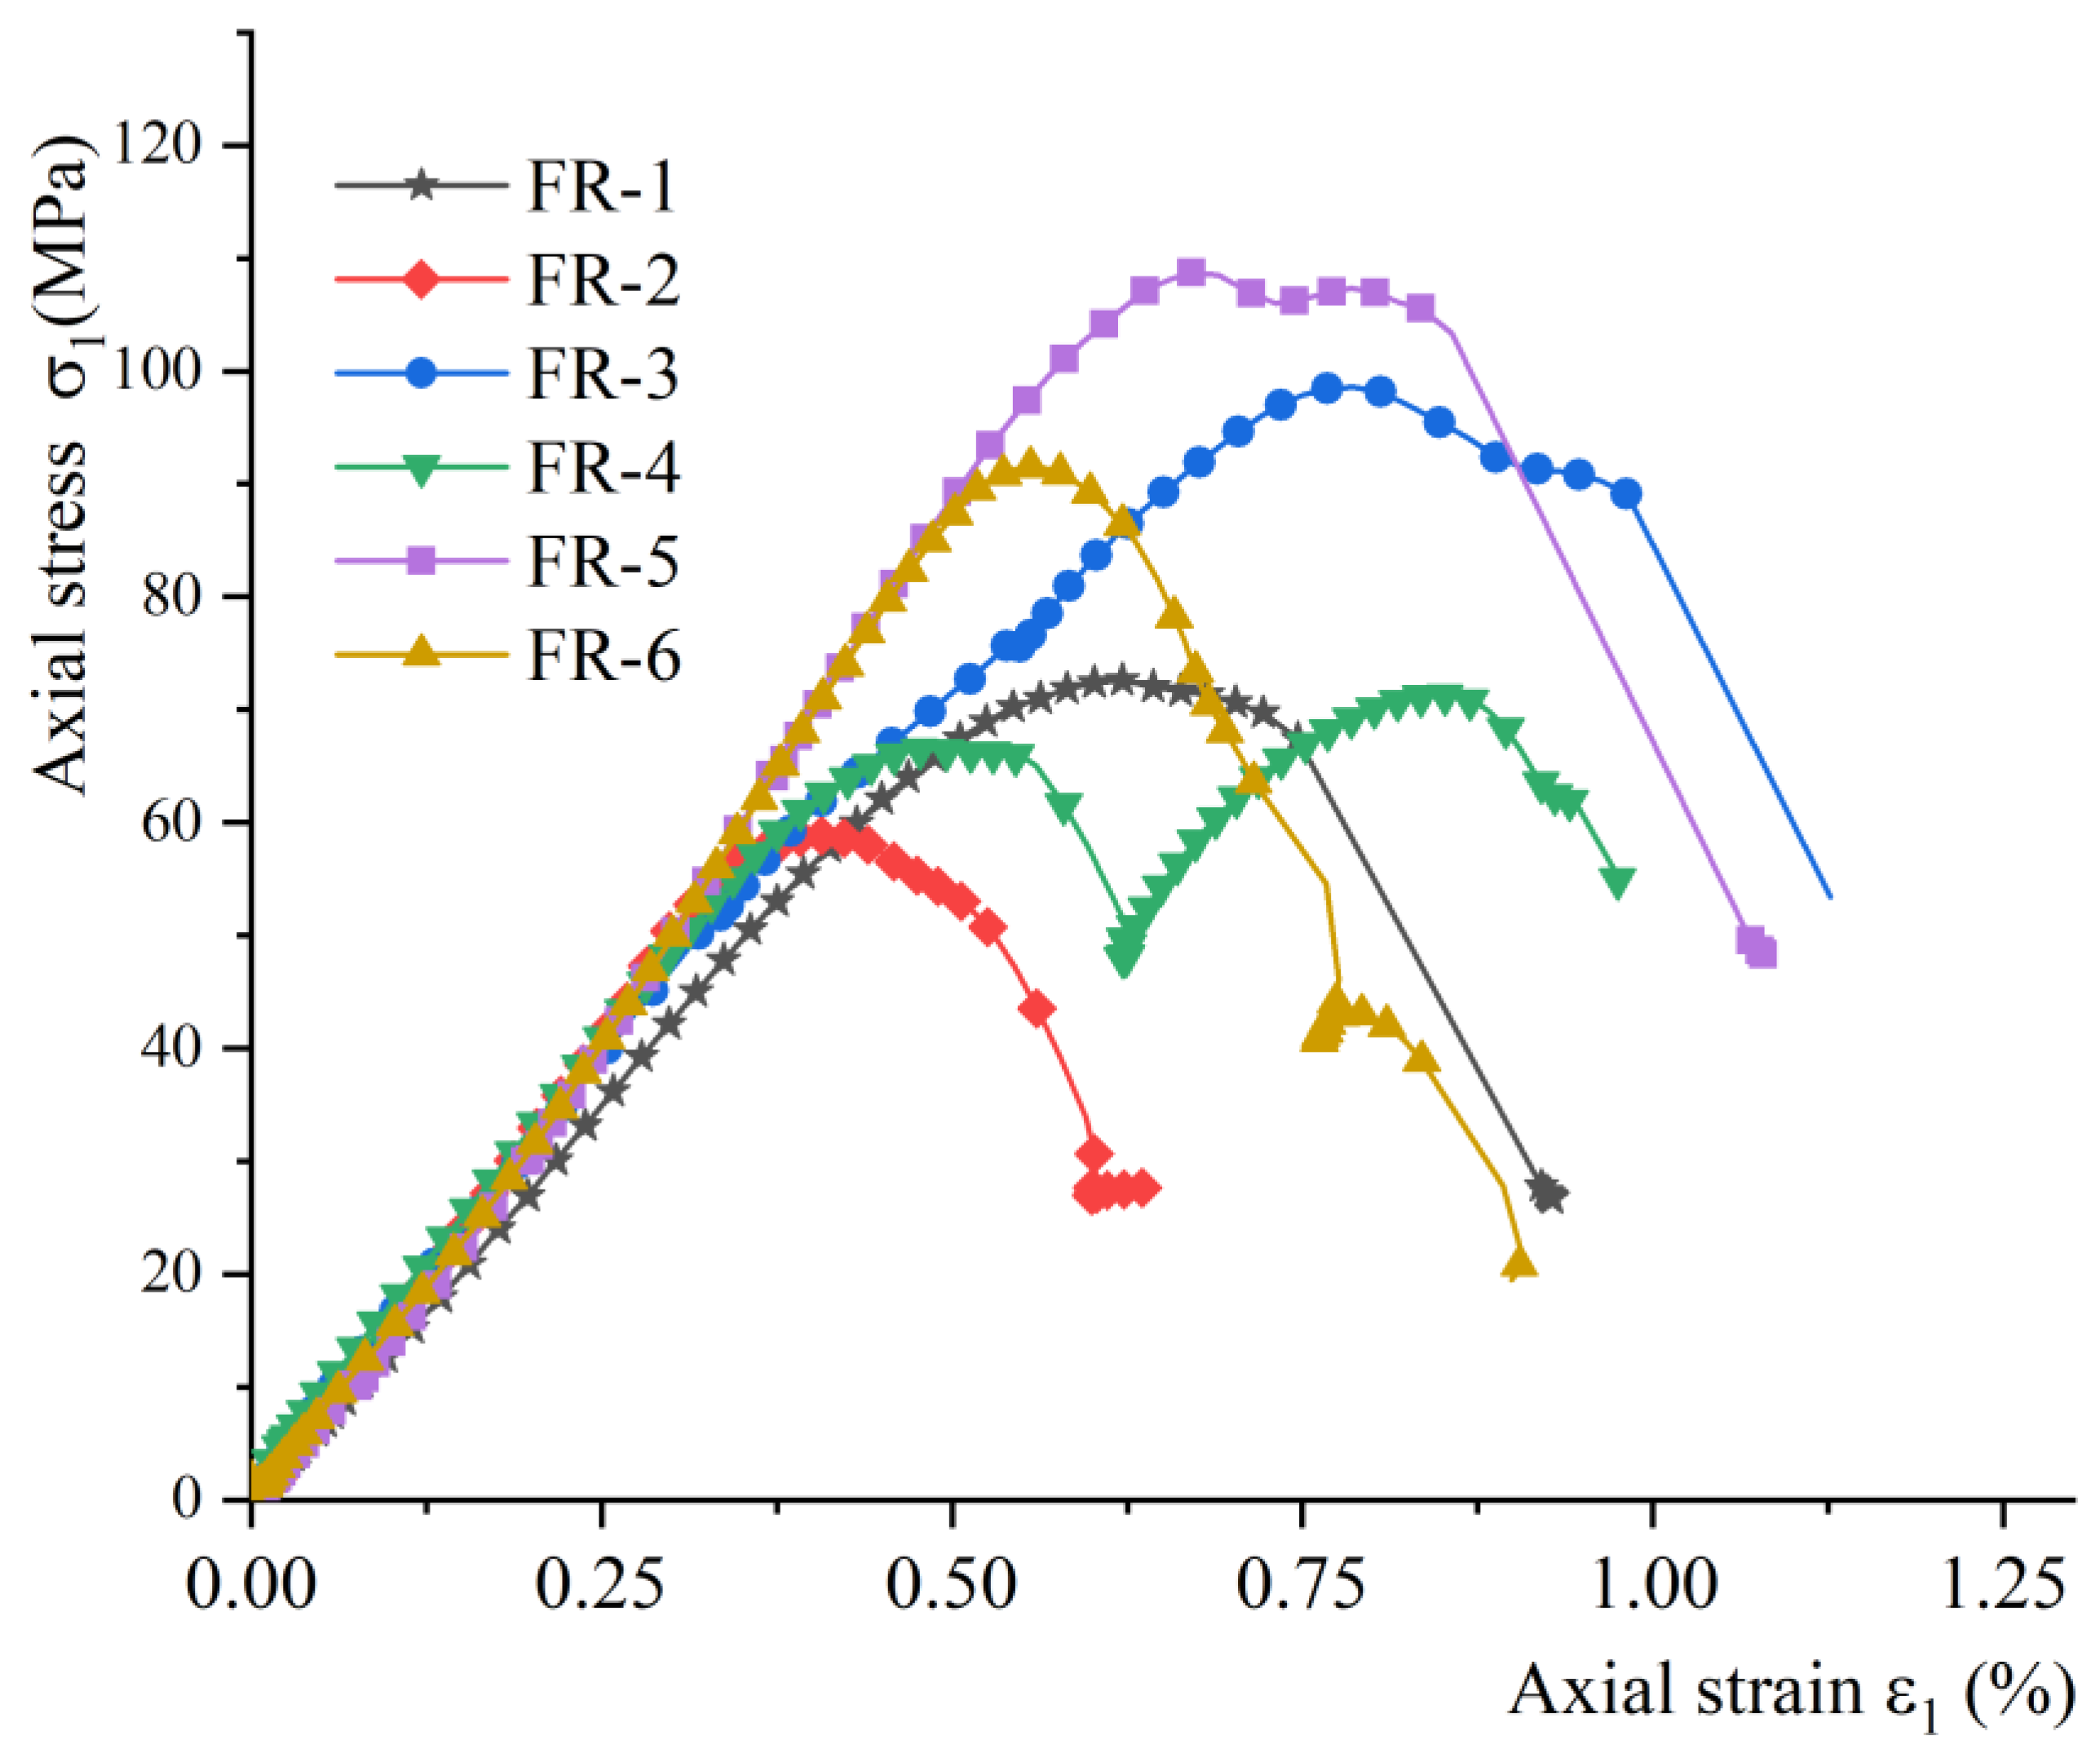
Figure 5a presents the stress–strain curve obtained from the numerical experiments under a confining pressure of 20 MPa and a fissure length of 20 mm. It can be observed that the specimen exhibits the lowest strength when the fissure dip angle is 45°.
Figure 5b illustrates the failure characteristics of different fissured specimens in the numerical experiments, where the blue dots represent cracks. As the load increases, the cracks always initiate at the fissure tip and then propagate along the diagonal direction, eventually leading to specimen failure.
4. Rock Strength Prediction Model Based on Artificial Neural Networks
The strength of fissured rock specimens is influenced by many factors, such as the confining pressure, fissure dip angle, fissure length, fissure opening, etc. Therefore, it is difficult to establish a strength prediction model for fissured rocks using conventional analytical models. A back propagation (BP) neural network is a multi-layer feed-forward network trained according to error back propagation, the basic idea is the gradient descent method, using the gradient search technique, to minimize the actual output value of the network and the expected output value of the error mean square difference [
20]. As shown in
Figure 6, the computational procedure of a BP neural network involves a forward propagation stage and a backward propagation stage. During the forward propagation stage, the input pattern is sequentially processed through the input layer, hidden layer, and output layer. The state of each neuron in a layer only influences the state of the subsequent layer. If the desired output is not achieved at the output layer, the backward propagation stage is triggered. Here, the error signal travels back through the original connection pathway, and the weight of each neuron is adjusted to minimize the error signal.
4.1. The Algorithm Steps in the BP Neural Network
The back propagation (BP) neural network is a type of multi-layer feed-forward network that is trained using the error back-propagation algorithm. It is based on the concept of gradient descent, wherein the network’s actual output values are adjusted using a gradient search technique to minimize the mean squared difference between the actual and expected output values [
21].
The procedure for the BP neural network algorithm is outlined below [
21]:
Step1: Weight Initialization.
where
sq denotes
ij,
jk, and
w represents the corresponding node connection weight.
Step 2: Input the P learning samples sequentially, with the current input being p samples.
Step 3: Calculate the outputs of each layer sequentially.
Step 4: Calculate the back propagation error.
where
k = 0, 1, 2, …,
m − 1;
where
j = 0, 1, 2, …,
.
Step 5: Record the number of samples already learned, p. If p is less than P, go back to step 2 and continue the computation. If p equals P, proceed to step 6.
Step 6: Update the weights and thresholds for each layer according to the weight adjustment formula.
Step 7: Recalculate
, yk, and the total error EA using the updated weights. If the conditions (or EA < ε) are satisfied for each p and k, or the maximum number of learning iterations is reached, the learning process is terminated. Otherwise, go back to step 2 and continue with a new round of learning.
4.2. Stochastic Improvement of BP Neural Networks
The back propagation (BP) neural network, widely utilized in machine learning, boasts numerous advantages. However, it is not exempt from a common limitation known as overfitting. Overfitting arises when a model excessively adapts to the training data, resulting in poor generalization capabilities on unseen data. To tackle this issue, regularization methods have been introduced to effectively control the magnitudes of network weights. These methods involve modifying the error function by incorporating a regularization term that imposes constraints beyond the sample data. In the case of neural networks, the mean squared error (MSE) function is commonly employed to appraise training effectiveness. It is defined as follows:
where
d(p) and
y(p) represent the target value and prediction value for the
i-th training sample among
P training samples, respectively. In the regularization method, the network performance function
msereg is modified as follows:
where
γ represents the proportion coefficient and
msw denotes the mean square weight.
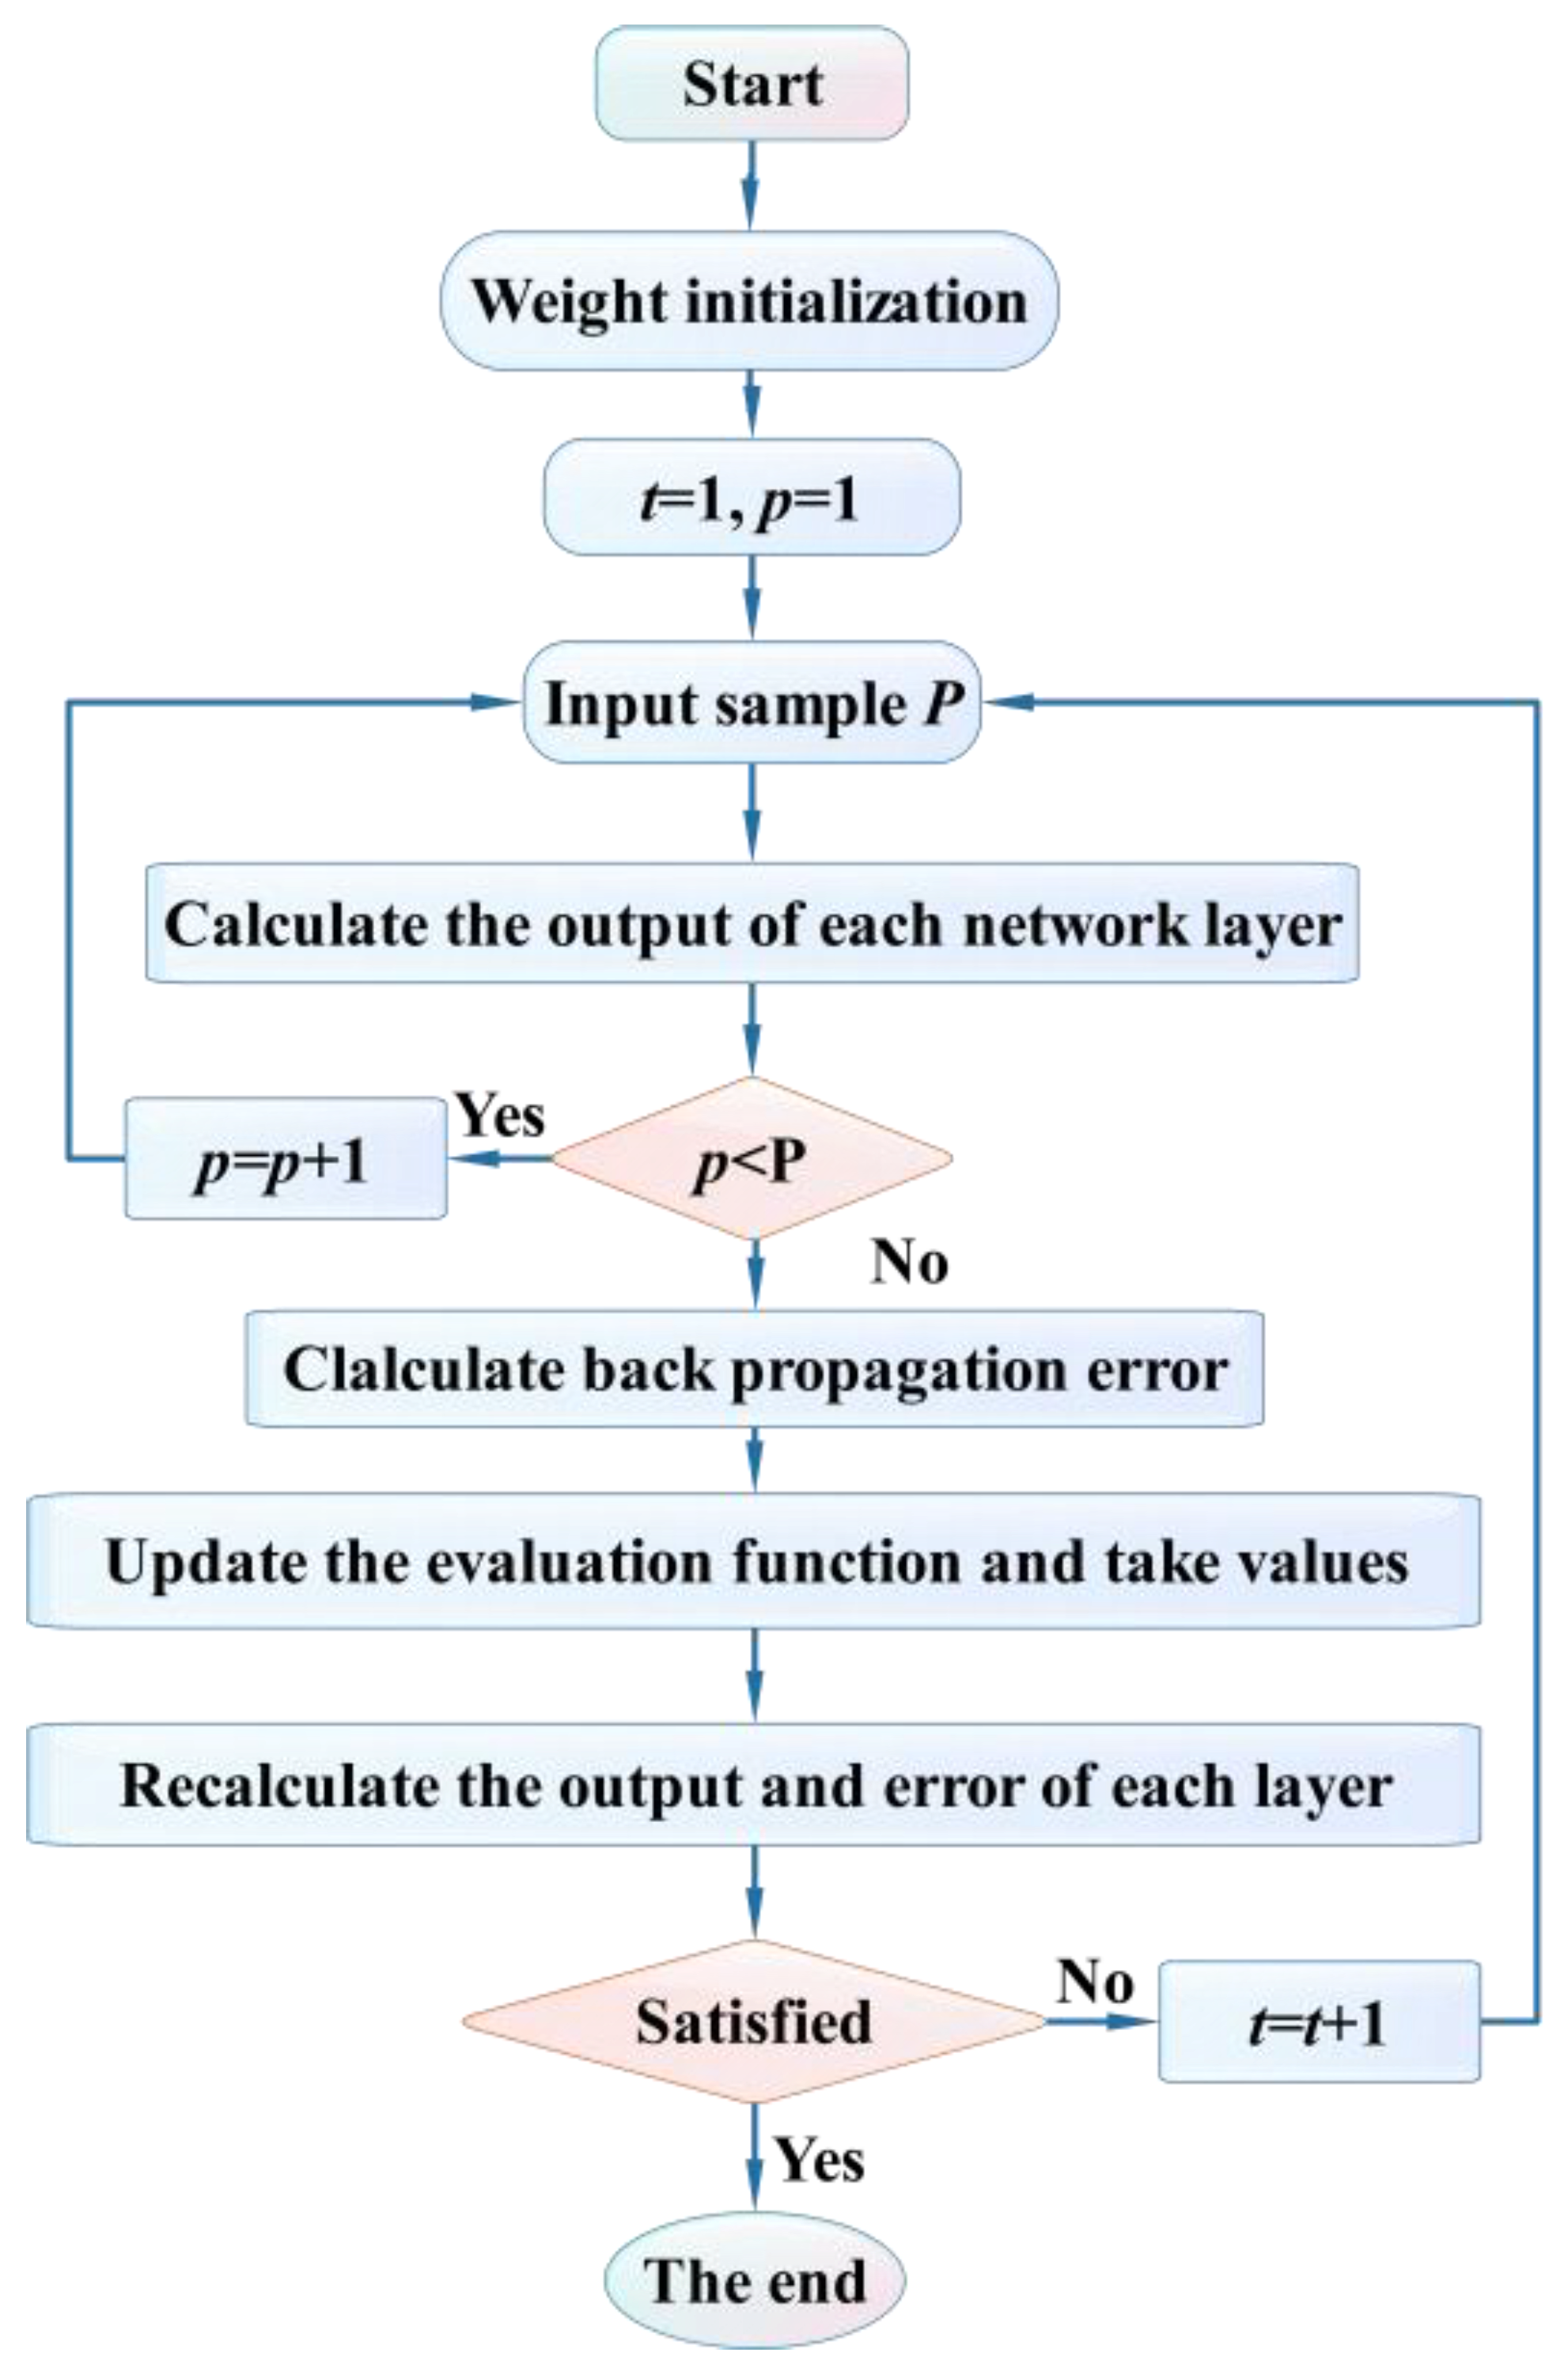
By adopting a new performance index function it is ensured that the network has smaller weights, while minimizing the training error. This effectively results in the automatic reduction of the network’s size, which in turn reduces the chances of overfitting. Overfitting occurs when the dimension of the network is considerably smaller than the magnitude of the training dataset. This is beneficial for enhancing the network’s generalization ability. The improved algorithm workflow is described in
Figure 7.
4.3. Stochastic Prediction Model for Fissured Rock Specimen Strength
In order to enhance the precision of the stochastic prediction model for the strength of fissured rock samples, the confining pressure, fissure length, and fissure dip angle were used as inputs into the improved BP neural network stochastic prediction model. The compressive strength is taken as the output of the stochastic prediction model.
In addition to the input and output layers, the determination of the hidden layers also relates to the prediction efficiency and the accuracy of the results of the network model. Usually, in order to ensure the efficiency and accuracy of the network model, Equation (8) is used to calculate the number of intermediate layer cells, according to the principle of model lightweighting.
where
T is the ideal number of neural units in the intermediate layer, and
A and
B represent the count of the input and output parameters utilized in the network model, respectively.
Substituting the number of model input and output parameters into Equation (8), results in:
Consequently, the hidden layer in the improved BP neural network-based stochastic prediction model can be determined to comprise three cells through the calculation.
4.4. Application of Fissured Rock Specimen Strength Prediction
Before establishing the model, it is necessary to pre-divide the dataset into a training set and a testing set. The training set is used for model training, while the testing set is used to verify and evaluate the reliability and generalization performance of the trained model. Proper dataset partitioning has a significant impact on the final generalization performance of the model. When the proportion of the training set is too high and the proportion of the testing set is relatively low, it can lead to overfitting, where the model performs well on the training set but poorly on the testing set. Conversely, when the proportion of the training set is too low and the proportion of the testing set is too high, it can lead to underfitting, where the model performs poorly on both the training set and the testing set [
22]. In BP neural network model training, it is common to divide the dataset into a ratio of 7:3 or 8:2 for training and testing purposes [
23]. Therefore, 75% of the data was chosen as the training set, while the remaining 25% of the data was used as the testing set. The training set consisted of 216 data points, while the testing set contained 72 data points.
To evaluate the predictive performance of the conventional BP neural network and the improved BP neural network model, the determination coefficient (
R2), root mean square error (RMSE), and mean absolute percentage error (MAPE) are used as evaluation metrics to measure the model’s generalization ability. The corresponding calculation formulas are illustrated in
Table 6.
represents the precision of the model in fitting the data, and a value closer to 1 indicates a better fit. The RMSE reflects the deviation between the predicted values and the actual values, while the MAPE represents the average absolute error between the predicted values and the actual values. Smaller values for both metrics indicate better generalization performance of the model.
Figure 8 presents the comparison results for the predicted values and measured values between the two models, namely the conventional BP neural network and the improved BP neural network. As shown in
Figure 8, the blue and orange scattered points represent the predicted results of the models for the samples in the training set and the testing set, respectively. The former reflects the learning ability of the models for complex nonlinear relationships in known data, while the latter reflects the generalization ability of the models for predicting unknown data. From
Figure 8, it can be observed that the scattered points for the improved BP neural network model are more concentrated near the reference line compared to the conventional BP neural network model, indicating that the improved BP neural network model achieves better prediction results for the triaxial compressive strength of fractured rock specimens. The
R2, RMSE, and MAPE for the improved BP neural network model using the training set are 0.992, 3.53, and 4.91%, respectively, which are better than those of the conventional BP neural network model (0.965, 5.42, and 7.89%). Moreover, the
R2, RMSE, and MAPE for the improved BP neural network model using the testing set are 0.985, 6.29, and 9.83%, respectively, outperforming the conventional BP neural network model (0.961, 10.35, and 14.72%). Based on the values of the evaluation metrics, it can be concluded that the improved BP neural network model exhibits better performance using both the training and testing datasets compared to the conventional BP neural network model.
5. Conclusions
The experimental and numerical triaxial compression tests on fissured rock specimens containing pre-existing fissures were conducted and the improved BP neural network model was established for strength prediction of fissured rock specimens under triaxial compression. Some conclusions can be made, as follows:
Triaxial compression tests were conducted on intact and fissured rock specimens under different confining pressures, fracture angles, and loading rates to obtain the triaxial compression strength of the fissured rock specimens under different conditions, serving as reference data for the numerical experiments.
Discrete element method numerical models were established for the intact and fissured rock specimens. After calibrating the micro-parameters of the numerical models, numerical triaxial compression tests were conducted on the rock specimens and validated through experimental tests. The error in the numerical experiments was within 5%, indicating a high level of accuracy of the numerical models.
Numerical triaxial compression tests on the fractured rock specimens were conducted under four confining pressures, four fracture lengths, six fracture inclinations, and three loading rates, resulting in a total of 288 sets of triaxial compression test data for the fractured rock specimens. These data were used to train a predictive model on the triaxial compressive strength of fractured rock. By employing a modified back propagation neural network based on random factor and interlayer mean square error correction, the predictive model for the triaxial compressive strength of fractured rock was established. The R2, RMSE, and MAPE for the improved BP neural network model in the training set was 0.992, 3.53, and 4.91%, respectively, indicating that the model’s prediction performance is superior to that of the traditional BP neural network model.
In summary, this study combines machine learning with rock mechanics to achieve intelligent prediction of rock strength using a limited number of rock mechanics tests. Compared to traditional experimental methods, this approach saves a significant amount of manpower, financial resources, and time, providing a new reference for predicting the strength of fractured rocks under high stress conditions in deep coal mine strata. However, the training process for the BP neural network requires iterative computations through the back propagation algorithm to adjust the network’s weights and biases. As a result, the training speed is relatively slow. In the future, the authors will continue to conduct further research on accelerating the training speed of BP neural networks.


 ,
, 


