1. Introduction
Industry 4.0 has become the main keyword used by researchers, policymakers, and entrepreneurs when describing how worldwide industrial systems will evolve [
1]. It has been considered a new industrial stage in which several emerging technologies converge to provide digital solutions [
2]. In Germany, Industry 4.0 is one of the ten future projects outlined in the New High-Tech Strategy 2020 document introduced by the German federal government [
3]. The New High-Tech Strategy 2020 aims to move Germany forward on its way to becoming a worldwide innovation leader, contributing to finding creative answers to urgent challenges, then translating them rapidly into innovative products and services [
4].
The basic concept of Industry 4.0 is the integration of advanced technologies into the industrial sector. Researchers and companies hold different points of view about the Industry 4.0 concept and visions [
5,
6], but there is a consensus about the most common terms used in the research area to specify the technologies related to Industrial 4.0, such as big data, simulation, cyber-physical system (CPS), internet of things (IoT), cloud computing, virtual reality, cyber-security, and collaborative robots.
A few years ago, it was inconceivable that Industry 4.0 would create value for the manufacturing industry in the ways that it has. It has resulted in increased productivity, decreased product lead time, enhanced product quality, increased workforce efficiency, and enhanced process visualization and control [
7]. It is essential to comprehend the impact of these key technologies in order to capture their added value, which illustrates how much the manufacturing industry has benefited from Industry 4.0 key technologies. In industrial manufacturing, the literature focused on clarifying the capabilities of these key technologies and defining deployment strategies. These strategies can be used as building blocks for the strategic approach, ensuring that every aspect of a manufacturing organization has been considered and that suitable strategies for the implementation of Industry 4.0 key technologies have been defined.
In the process of specifying an appropriate technique for the solution of the problem based on the transition to Industry 4.0, different methods have been used, such as multi-criteria decision-making methodology, MCDM. The authors of reference [
8] integrated a multi-criteria decision-making methodology with intuitionistic fuzzy sets, IFS, which is used to create an Industry 4.0 road map which is applicable and effective for Industry 4.0 implementation decision-making. The six sigma method is also extensively used for creating improvement strategies in various industries. Six sigma is a statistics-based philosophy that aims to reduce the number of defects and variations in processes, making it an important aspect of improving organizational performance [
9]. Motorola adopted six sigma in 1986 in order to reduce the defects in their products and improve quality. General Electric (GE) has also implemented the six sigma program successfully in 1995, it has become the robust improvement methodology used by most of businesses and non-profit organizations. In recent years, Hassan et al. introduced the application of Design for six sigma (DFSS) in Sustainable Product Design to enhance the manufacturing sustainability of electric kettles [
10]. Similarly, Yang et al. presented The Development of the New Process of Design for six sigma (DFSS) to guarantee manufacturing process design and product design quality [
11], while Trubetskaya et al. implemented the methods in a medical device manufacturing company to create a new strategic space management system. The advantage of using the DFSS method is that it ensures that the product functions meet the customer’s needs and that the chosen technology will perform those functions in a robust manner throughout the product’s life. It also improves the production time and reduces the total cost [
10].
Nevertheless, there is still apprehension regarding the adoption and implementation of Industry 4.0 due to the absence of standardized approaches. Therefore, this study proposes a new practical approach for Industry 4.0 implementation that enterprises may use to fill the gap in the knowledge and information required to make technical decisions for the gradual implementation of Industry 4.0 and reduce the investment cost to improve production efficiency and competitiveness.
2. Industry 4.0 Implementation Barriers
In addition, when planning the improvement strategies within the context of the Industry 4.0 development approach, it is necessary to identify and analyze the barriers that manufacturing organizations face when attempting to implement Industry 4.0 in the literature. A total of 12 barriers to the adoption of Industry 4.0 and sustainability have been identified by Shashank Kumar et al. [
12]. Abdelalim Eltayeb et al. identified 23 barriers and challenges for Industry 4.0 implementation from the literature which covers different sectors [
13]. Less than five barriers were identified by other scholars [
14,
15]. As a result, the number of barriers to the implementation of Industry 4.0 varies across countries. The literature review brought about the most frequently identified barriers, such as a lack of skilled workers, a lack of managerial competency, a lack of financial resources, a lack of standard planning and strategy, and a lack of infrastructure.
However, few studies have examined the implementation of Industry 4.0 in manufacturing companies by identifying and highlighting barriers [
12]. Thus, to identify and analyze the most identified barriers that could support the development of the proposed Industry 4.0 implementation approach, 15 studies across the world were utilized in this study.
The most frequently identified barriers to the adoption of Industry 4.0 have been taken into consideration based on the currently available literature. The variables of the important barriers identified in the literature were sorted in
Table 1. The significance of these barriers as reported in the literature is summarized in
Table 2. To gain insight into the most significant barriers to Industry 4.0, a sample of the literature was carefully selected from various countries. As an analysis criterion, the ranking priority of the most prevalent barriers in the country under study was utilized. In Serbia [
16], the Czech Republic [
17], and Hungary [
17,
18], a lack of skilled workers is the first barrier. In Bangladesh [
19] and Romania [
18], the main barrier is a lack of managerial competence. Similarly, one of the global studies [
15] cites a lack of financial resources as the primary barrier. In Denmark [
20] and India [
12], a lack of standard planning and strategy is the first barrier. Likewise, a lack of infrastructure is the first barrier in Germany [
20,
21]. Although different countries have different levels of barriers, an accurate assessment of the barriers will aid in the development of the Industry 4.0 approach. Consequently, fuzzy logic methodology is employed to analyze the chosen data. In this study, the barriers to implementing Industry 4.0 are evaluated and ranked using a novel tool for multi-criteria decision-making (MCDM) called the ‘best-worst method’ (BWM) [
19]. It was created in 2015 by Professor Rezaei [
22]. This method yields superior performance outcomes in comparison to other MCDM tools, such as the analytical hierarchy process, AHP [
23]. The procedure of applying BWM can be summarized as follows [
24]:
Assigning of the criteria for decision-making. In this step, a set of decision-making criteria …, is required to assist in determining the study objectives.
Assigning of the best (e.g., most important, most desirable) and worst (e.g., least important, least desirable) criteria. In this step, the assigned decision-makers determine the most and least important criteria without using a comparison matrix. There is no need for a value to identify the decision criteria; decision-makers simply indicate the most and least important criteria.
Determination of the best criterion over the other criteria using a 1–5 point rating scale. In this step, decision-makers determine the resulting best-to-others vector. The rating scale indicates the preference for one criterion over the other criterion. The rating scale value of 5 indicates that the best criterion is vastly superior to the other criterion. The resulting best-to-others (bo) vector of the criteria is represented as follows:
where
represents the preference of best criterion over criterion j. Hence,
.
Determination of the preference of all the other criteria over the worst criterion using a 1–5 point rating scale. In this step, decision-makers determine the resulting others-to-worst vector. Therefore, the resulting others-to-worst vector can be represented by the given notation:
where
indicates the preference of the j criteria over the worst criteria, and
.
Computing of the optimal weights ().
The optimal weights of the criteria should satisfy the stated conditions: for each pair of
and
, the best possible solution is where
and
. Hence, to obtain the best possible solution, the maximum should be minimized among the set of [
,
], and the problem can be expressed as follows:
The abovementioned problem of Equation (1) can be transformed into a linear programming problem and can be shown as follows:
The optimal weights and can be obtained by solving the abovementioned linear programming (LP) problem. The notation indicates the consistency of the comparison matrices. If the value of is closer to zero, it indicates the system is more consistent and provides a reliable comparison, and vice versa.
Table 2.
A summary of important barriers as reported in the literature.
Table 2.
A summary of important barriers as reported in the literature.
| | Studies | Region | First Barrier | Second Barrier | Third Barrier | Fourth Barrier | Fifth Barrier |
|---|
| 1 | Md. Abdul Moktadir et al. [19] | Bangladesh | B2 | B1 | B4 | B5 | B3 |
| 2 | Iva Vuksanovi’c Herceg et al. [16] | Serbia | B1 | B2 | B3 | B4 | B5 |
| 3 | Kumar et al. [12] | India | B4 | B1 | B5 | B3 | B2 |
| 4 | Müller et al. [21] | Germany | B5 | B4 | B2 | B1 | B3 |
| 5 | Josef et al. [17] | Czech Republic | B1 | B3 | B5 | B4 | B2 |
| 6 | Kiel et al. [25] | Germany | B5 | B2 | B4 | B3 | B1 |
| 7 | Romanello et al. [26] | Global | B5 | B2 | B1 | B3 | B4 |
| 8 | Stentoft et al. [20] | Denmark | B4 | B1 | B2 | B3 | B5 |
| 9 | Shashank et al. [12] | India | B4 | B1 | B3 | B2 | B5 |
| 10 | Elhusseiny et al. [27] | Global | B3 | B1 | B5 | B4 | B2 |
| 11 | Horváth et al. [18] | Hungary | B1 | B3 | B2 | B4 | B5 |
| 12 | Türkeș et al. [28] | Romania | B2 | B1 | B5 | B3 | B4 |
| 13 | Kornyshova et al. [15] | Global | B5 | B2 | B1 | B3 | B4 |
| 14 | Ingaldi et al. [29] | Poland | B2 | B3 | B1 | B4 | B5 |
| 15 | Abdelalim Eltayeb et al. [13] | Malaysia | B2 | B5 | B4 | B3 | B1 |
2.1. Barriers Analysis
This section identifies the barriers to implementing Industry 4.0 through a combination of the literature reviews from various countries. The implementation barriers identified from the results of the literature review were analyzed and ranked based on the impact of the barriers on the implementation outcomes.
Firstly, the determination of the decision criteria is based on the most frequent barriers that have been studied. The most identified barriers are arranged in accordance with their ranking results.
Secondly, the identification of the best and worst barriers. The most important criteria (severe barrier) and the least important criteria (less severe barrier) identified from 15 studies are outlined in
Table 3.
Thirdly, the determination of the best (severe) barrier over the other barriers. From the referenced data in
Table 2, we can determine the preferences of the best (severe) barrier over the other barriers using a 1–5 point rating scale. The determination of the best barrier over the other barriers of the used data 1 is shown in
Table 4.
Fourthly, the determination of the other barriers over the worst (less severe) barrier. From the referenced data in
Table 2, we can determine the preferences of the other barriers over the worst (less severe) barrier using a 1–5 point rating scale. The determination of the other barriers over the worst (less severe) barrier of the used data 1 is shown in
Table 5.
Fifthly, determining the optimal weights for decision criteria. The optimal weights of each barrier are computed by satisfying the aforementioned model and constraints in Equation (2) for each of the 15 utilized data points. As an illustration, the model for the used data 1 is given below:
Therefore, the optimal weights of the objective function and challenges for the used data 1 are demonstrated in
Table 6.
However, we also computed the simple averages of the optimal weights of the barriers using individual optimal weights of barrier results for each of the 15 used data sets.
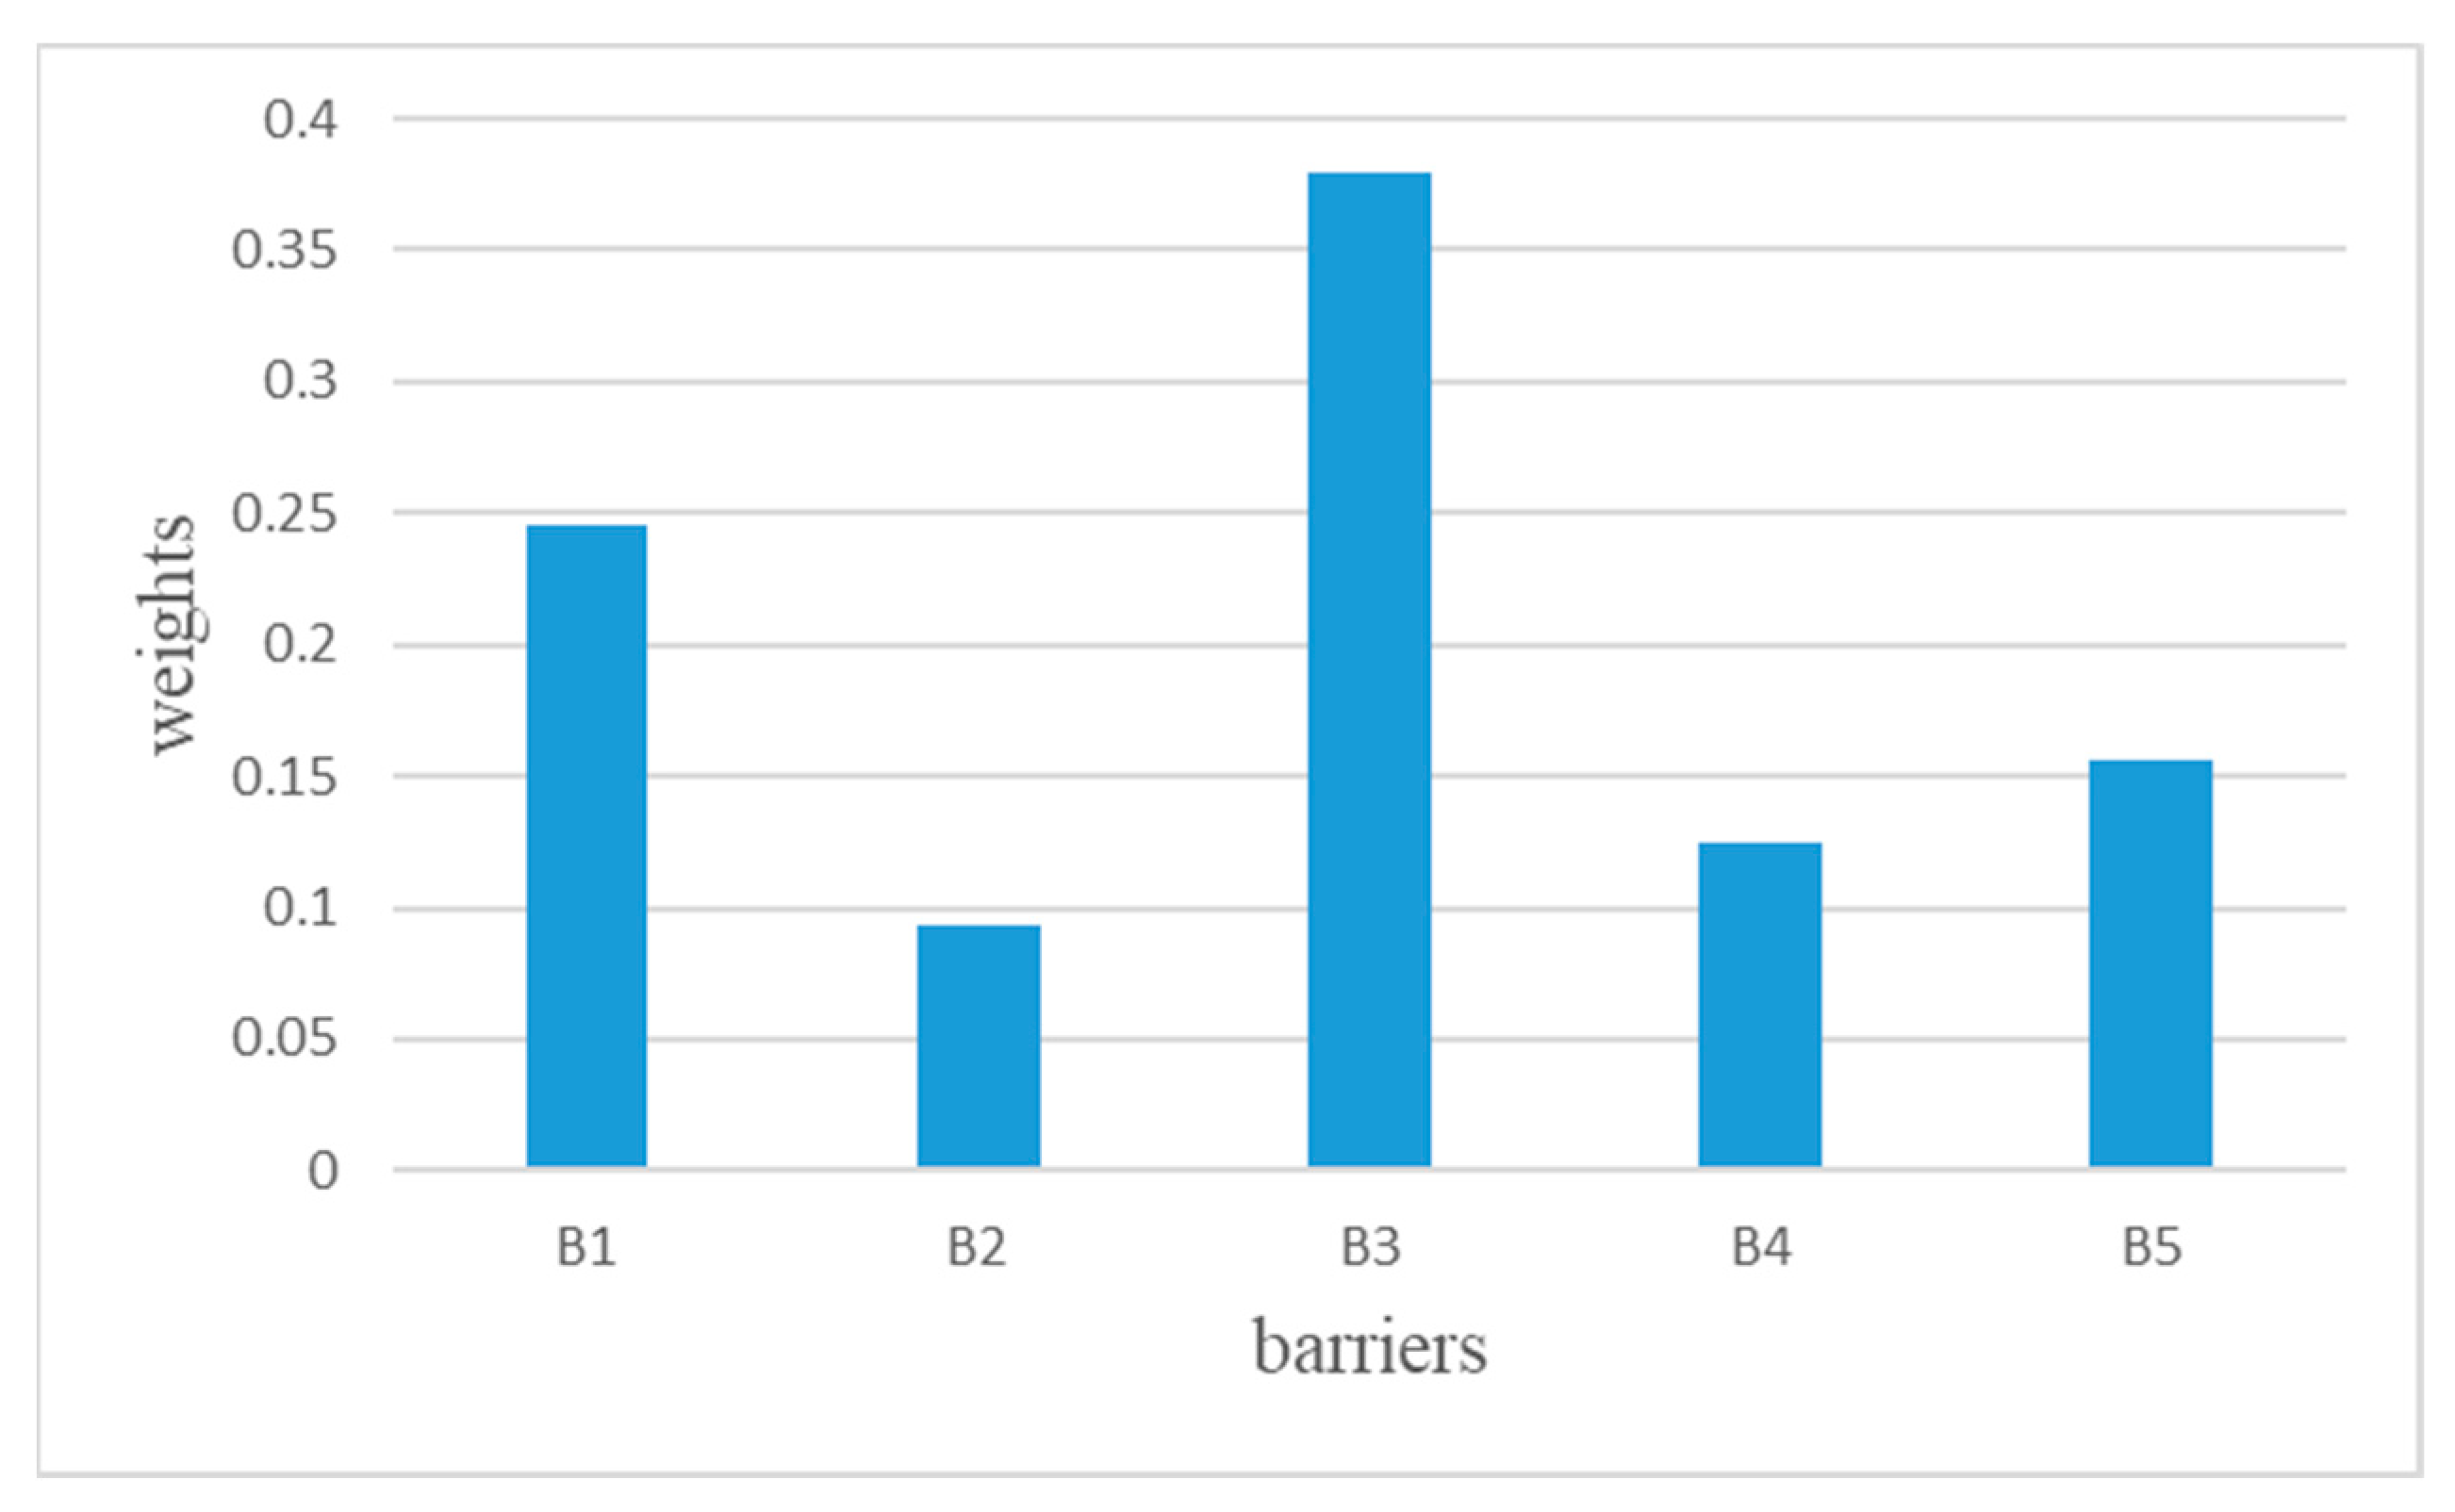
Table 7 and
Figure 1 display the final optimal weights. The value of
is the objective function of the constructed LP model. The closer the value of
to zero, the better the indication of consistency and reliability of the obtained results. The lower values of standard deviation indicate the homogeneity among the eight respondents.
2.2. Findings Discussion and Analysis
The list of optimal weights shown in
Table 8 represents the final results of ranking the importance of the barriers. This result can be used to formulate new strategies for addressing these barriers and implementing Industry 4.0. According to
Table 8, “the lack of financial resources (B3)” is the barrier with the highest weight of 0.3800, indicating that the enterprises expect higher investment [
30]. Therefore, the lack of financial resources and high investment is the most crucial barrier that needs to be addressed to enable the implementation of Industry 4.0 in bearing manufacturing companies.
The lack of skilled workers scored the second highest weight of 0.2456. The high rank of this barrier indicates that the bearing manufacturing companies will face this serious hurdle during the adaptation of the latest Industry 4.0 key technologies in practices. This barrier is followed by a lack of technical infrastructure (B5), which was weighted 0.156. It is a fundamental, central, and critical barrier to the implementation of Industry 4.0, necessitating urgent attention during the development of the Industry 4.0 approach. The least weighted barriers were a lack of standard planning and strategy (B4) and a lack of managerial competency (B2), with weights of 0.1248 and 0.0938, respectively, where these barriers obtained the least pressing and important priority ranking among the barriers.
The impact of the potential technological and organizational changes has prevented many companies from generating an explicit Industry 4.0 strategy or even systematically investing in Industry 4.0 capabilities [
31]. The barriers analysis results represented in the previous section clarify these fears. Therefore, the proposed new approach of Industry 4.0 implementation is designed to address the most important barriers according to the analysis findings.
3. Basic Steps of the Proposed Industry 4.0 Approach
Due to the implementation barriers, high requirements, and risks, it is difficult for most organizations to get involved with the Industry 4.0 transition. Several studies, for instance, have examined the implementation of Industry 4.0 technologies on an individual basis; Industry 4.0 was discussed by Vogel-Heuser and Hess using the German term, which is also known as CPS and Cyber-Physical Production System (CPPS) in manufacturing systems [
32]. The area of supply–demand matching manufacturing services in cloud computing concept was addressed by Tao et al. [
33]. The scenarios of design principles for modeling and simulation in Industry 4.0 were proposed by de Paula Ferreira et al. [
34]. Waibel et al., however, looked into the impact of intelligent production systems in Industry 4.0 [
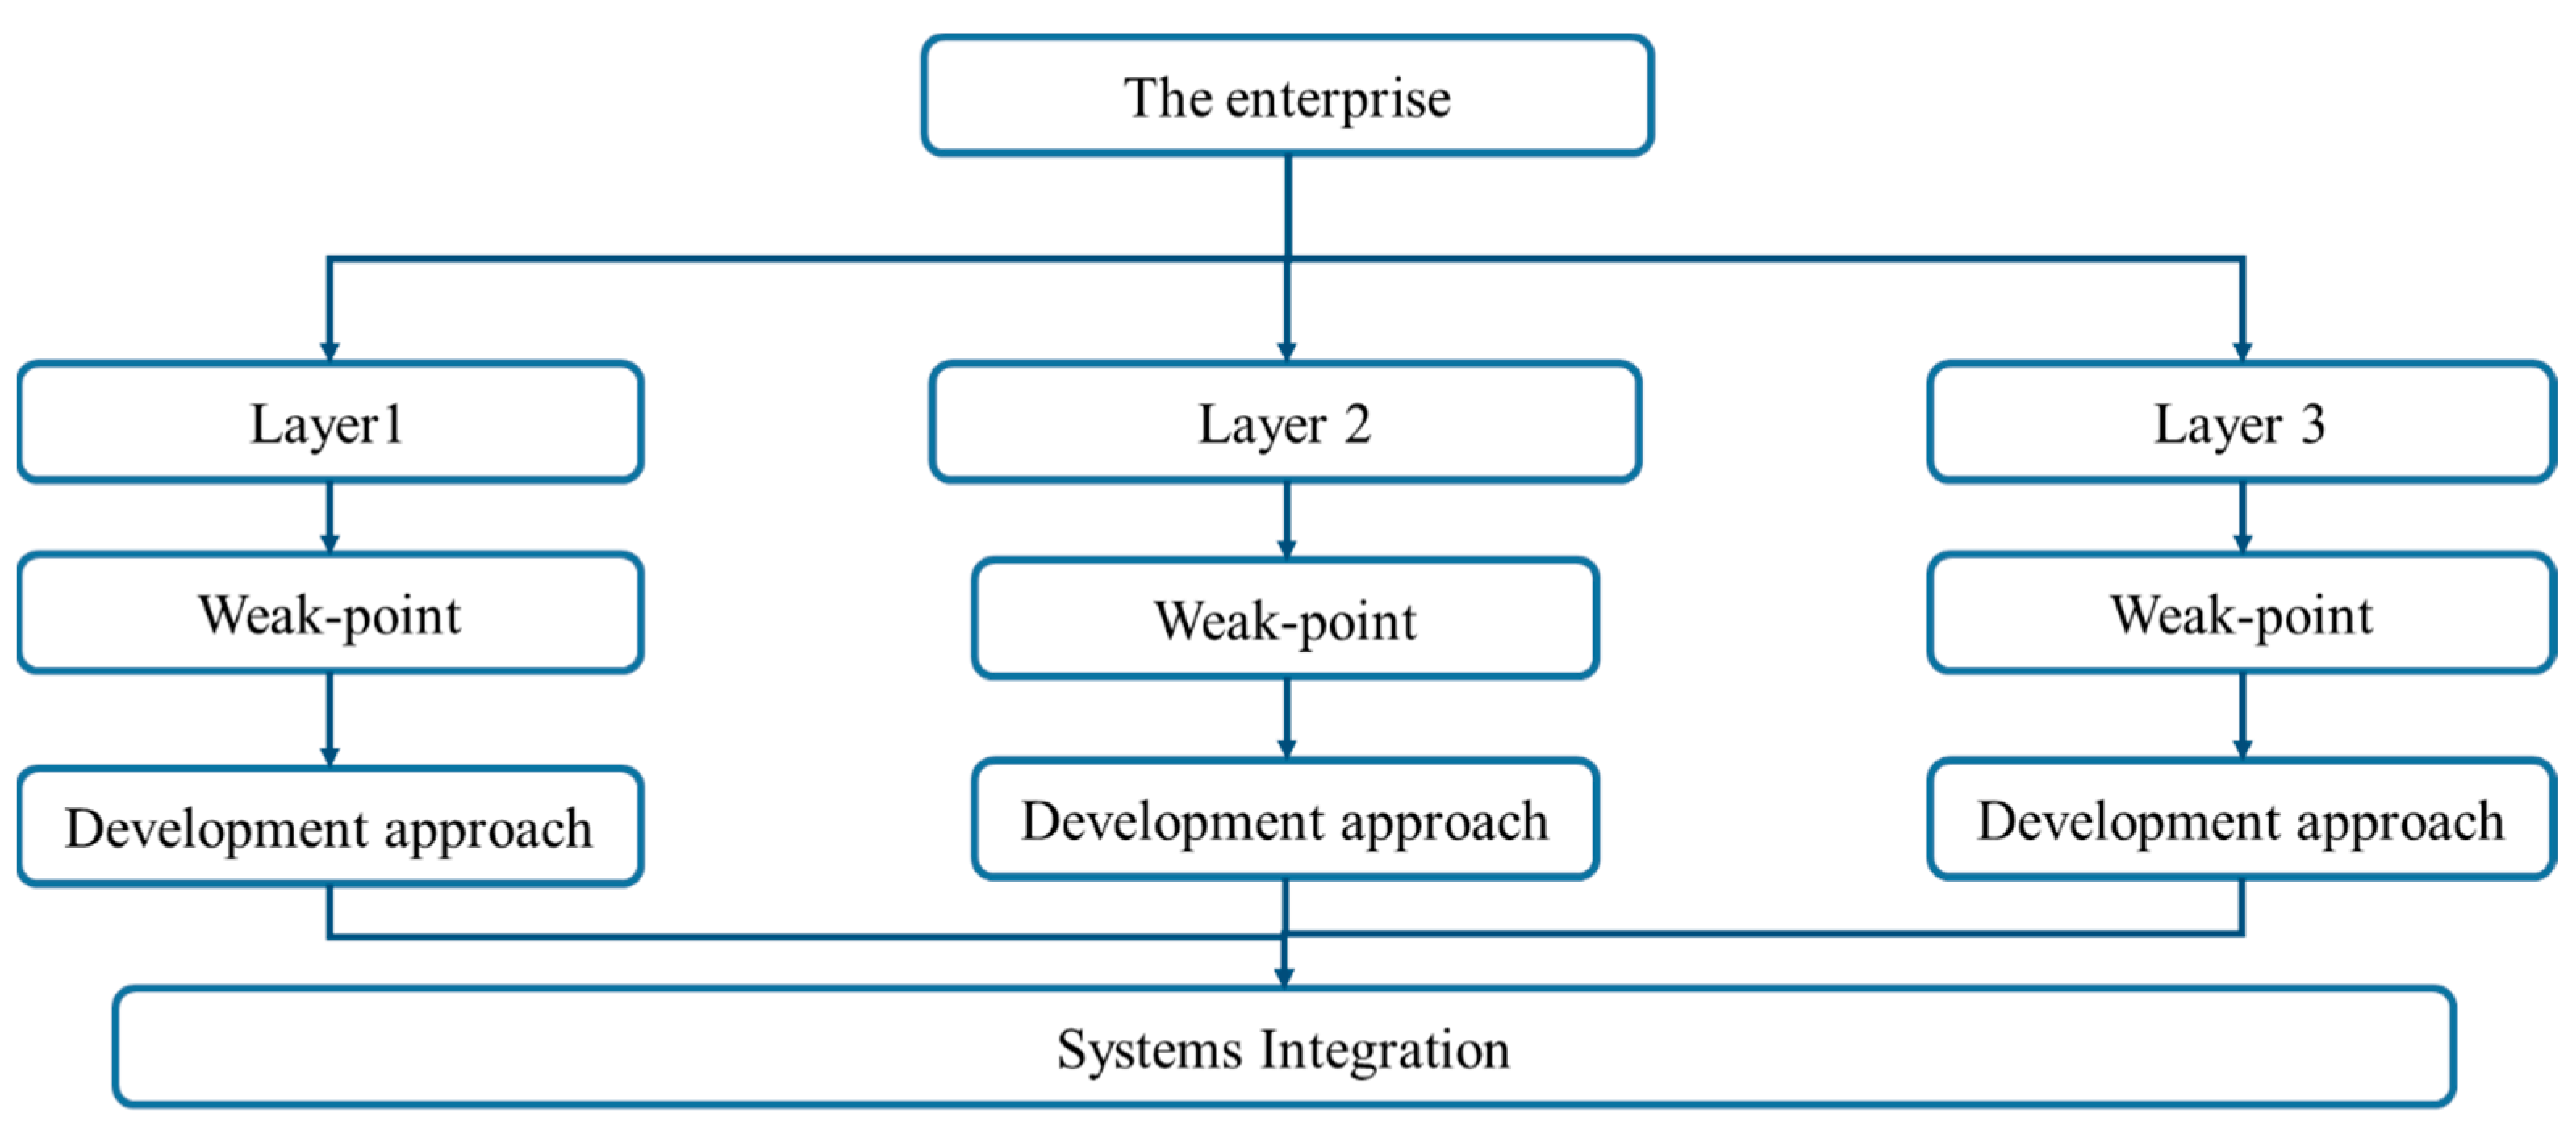
35]. However, instead of individually implementing Industry 4.0 technologies to reduce the risk, in this study we assumed that, in the proposed Industry 4.0 approach, the departments of the intended organization will be subdivided into multiple small layers, with each layer having its own improvement objectives, which will then serve as the system’s weak points in each layer. The scheme of the proposed approach’s layer divisions is depicted in
Figure 2 as a guide for individual layer improvement with system integration capability.
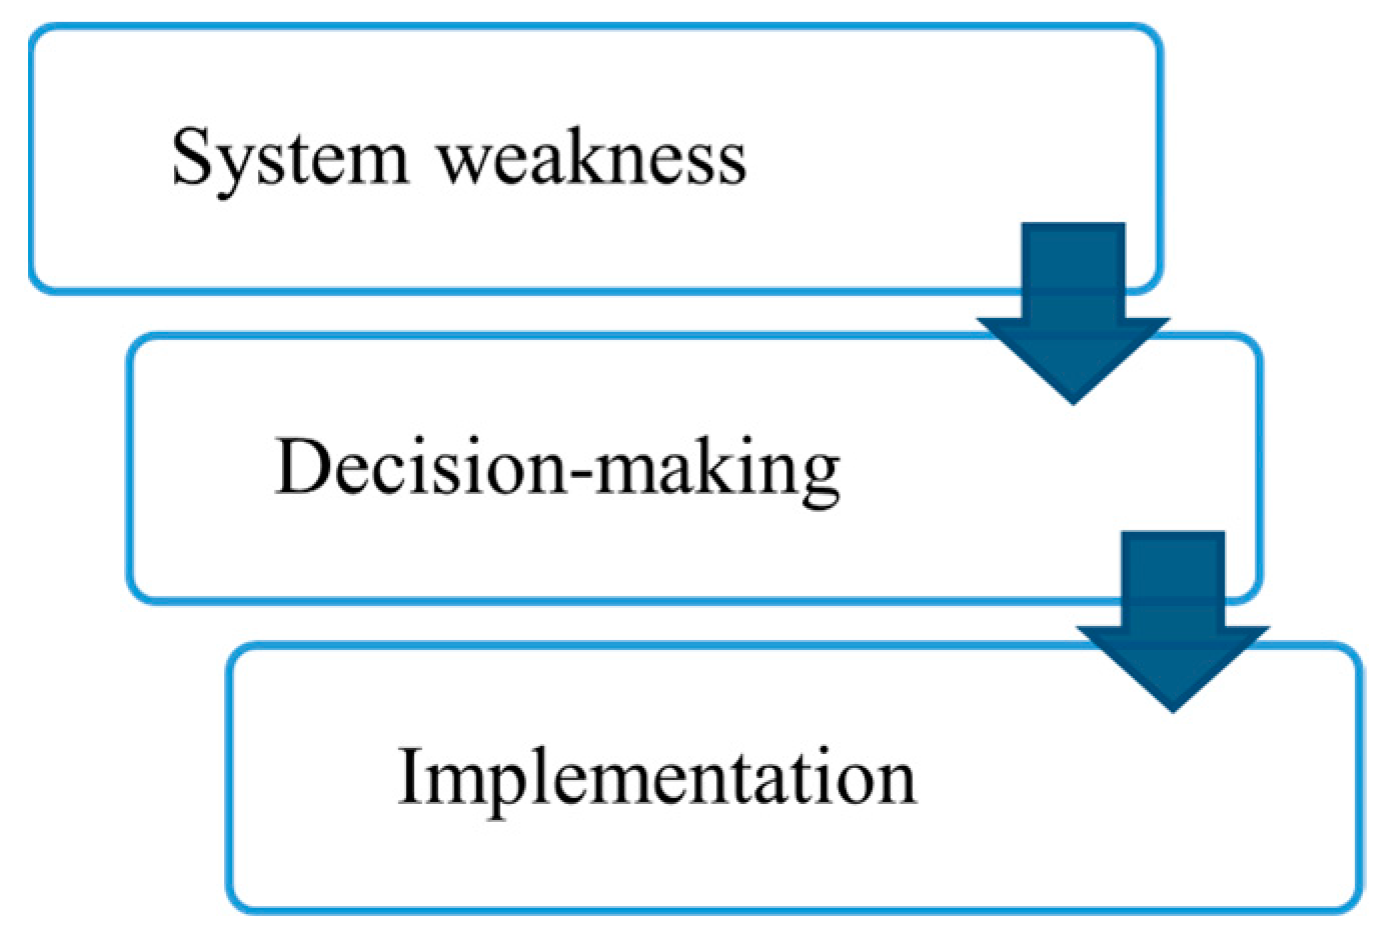
According to the Industry 4.0 implementation barriers analysis results, a lack of financial resources (B3) is the highest-ranked barrier, since the primary concern of manufacturing enterprises is the investment cost. However, in terms of another basic idea to address this barrier, the study assumes dividing the transition process into two steps: first is the decision-making step, and second is the implementation step.
The first step relies on modeling virtual simulation technologies. It aids companies to evaluate the risks, costs, implementation barriers, and impact on operational performance, and provides a roadmap toward Industry 4.0 [
34,
36]. It also provides essential knowledge for Industry 4.0 development by visualizing the intended problem, which can reduce the change resistance of the employees, encourage the organization to take the lead toward the Industry 4.0 transition, and aid the decision-making process. The second step is implementing the suitable key technologies for Industry 4.0 adaption in accordance with the desired development design. This step supports the infrastructure development. The basic steps of the proposed approach are illustrated in
Figure 3.
4. Development Methodology
In the context of Industry 4.0, various best-documented approaches were introduced from strategic management, marketing, management information system, supply chain management, and manufacturing technology backgrounds. In the process of specifying an appropriate technique for the solution of the problem based on the transition to Industry 4.0, different methods have been used, such as the multi-criteria decision-making methodology MCDM. The authors of reference [
8] integrated a multi-criteria decision-making methodology with intuitionistic fuzzy sets, IFS, which is used to create an Industry 4.0 road map that is applicable and effective for Industry 4.0 implementation decision-making.
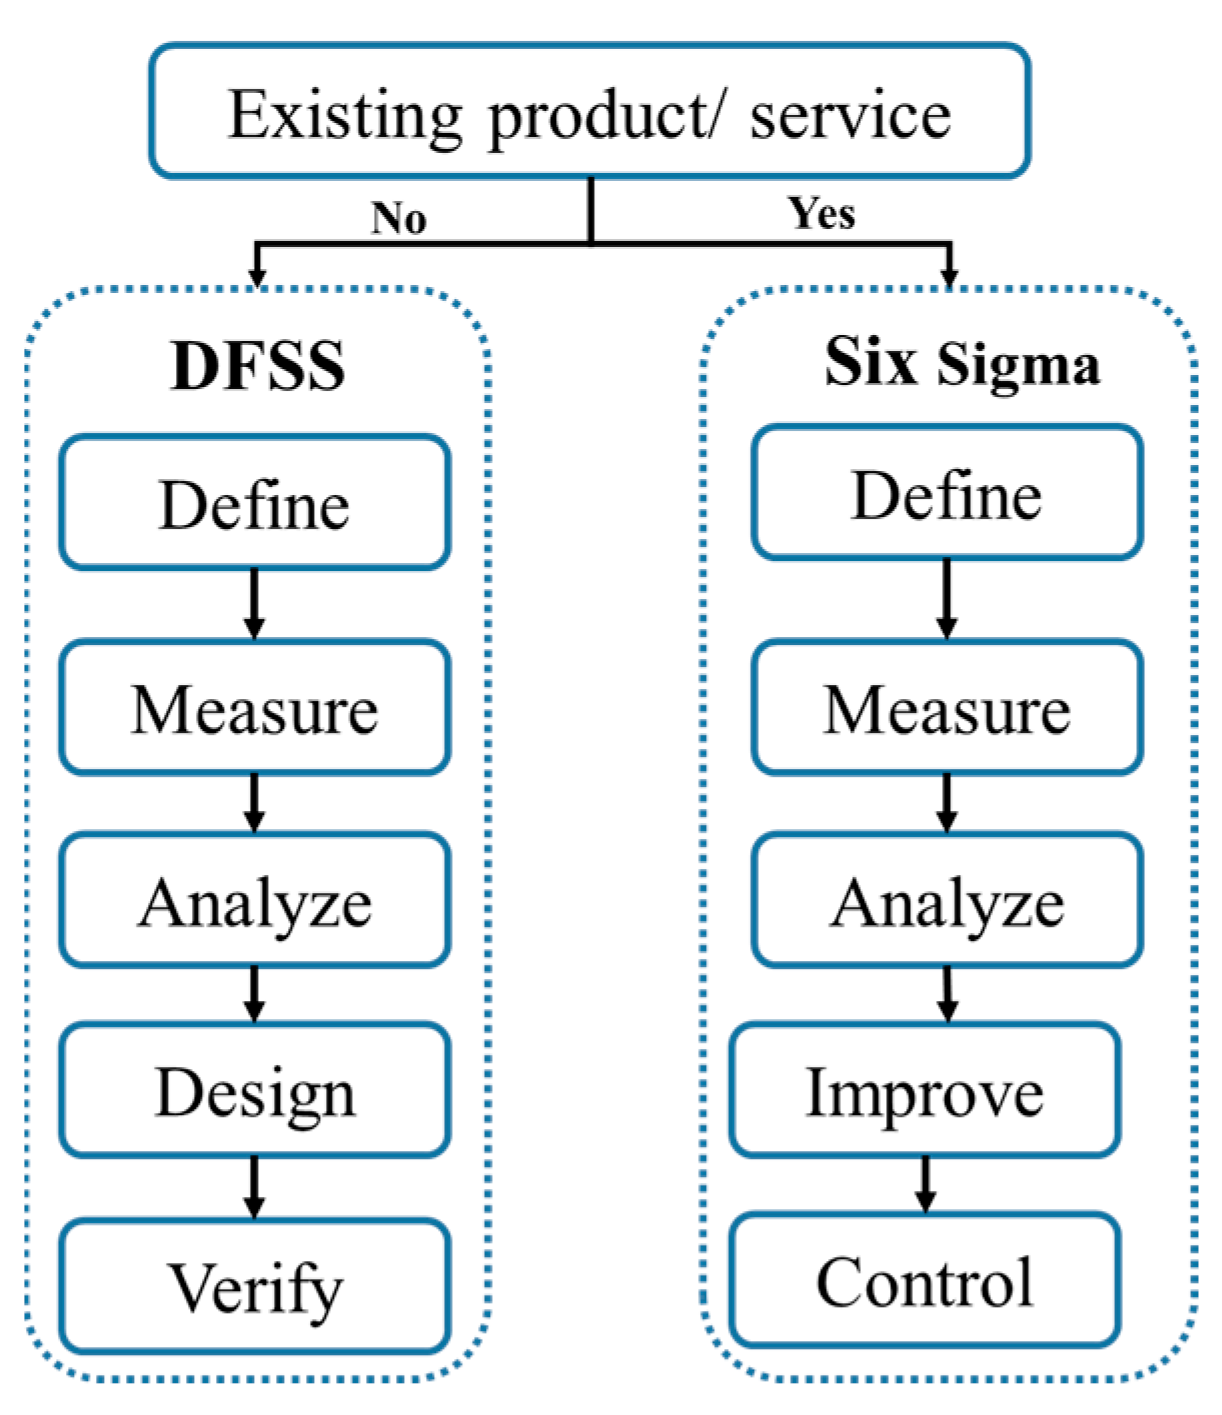
Six sigma employs two major methodologies: define, measure, analyze, improve, and control (DMAIC), and define, measure, analyze, design, and verify (DMADV), also known as the design for six sigma DFSS.
Figure 4 illustrates the fundamental difference between the two methodologies.
Researchers have considered the six sigma methodology in a variety of disciplines. In education, the identify, define, develop, optimize, and verify (IDDOV) model was used in the design of the six sigma (DFSS) approach for describing the creation of communication lessons, exchanging advice, and recording (CLEAR) for the lessons learned database. It assists the desired organization in institutionalizing knowledge and improving project cost variations and scheduling predictability [
9]. In industrial manufacturing, the DMADV method was utilized for data transmission during the development of an optoelectronic device (connectable transmitter unit). The authors of reference [
37] used a variety of tools throughout the phases of the DMADV method in order to address the project’s primary requirements. These tools included computer-aided design (CAD), measurement system analysis, design of experiment (DOE), statistical process control, etc. In design, the DFSS methodology and DMADV method are used in the process of developing an innovative multifunctional fan (lamp, aroma diffuser, and fan); the authors of reference [
38] identified consumer product expectations and translated them into product requirements, conceptual design, simulation, and production.
Most of these approaches have a great base in the six sigma principles, such as DMAIC (define, measure, analyze, improve, and control), used for continuous quality performance improvement [
39]. Design for six sigma (DFSS), which also applies the six sigma principles, is a systematic, disciplined method of problem prevention that is frequently utilized to create innovative, reliable engineering systems [
9]. The most frequent DFSS approaches and their phases, as shown in the literature, are summarized in
Table 8 [
40].
5. The Proposed Industry 4.0 Approach Outcome Real Case Application
Based on the previous discussion and adequate barriers analysis, we can summarize the basic ideas as follows:
To reduce the risk and fear of high investment costs we assume the intended organization’s departments will be divided into different small layers, with each layer having individual improvement objectives, which are then represented as the system’s weak point in each layer, as shown in
Figure 2.
To fill the gap of high investment cost and provide the knowledge and information required to make technical decisions toward Industry 4.0, we divided the development process into two steps: the decision-making step and the implementation step. The decision-making step is based on design, modeling, and virtual simulation technologies and the implementation step is based on the required key technologies for Industry 4.0 adaptation in accordance with the desired development design.
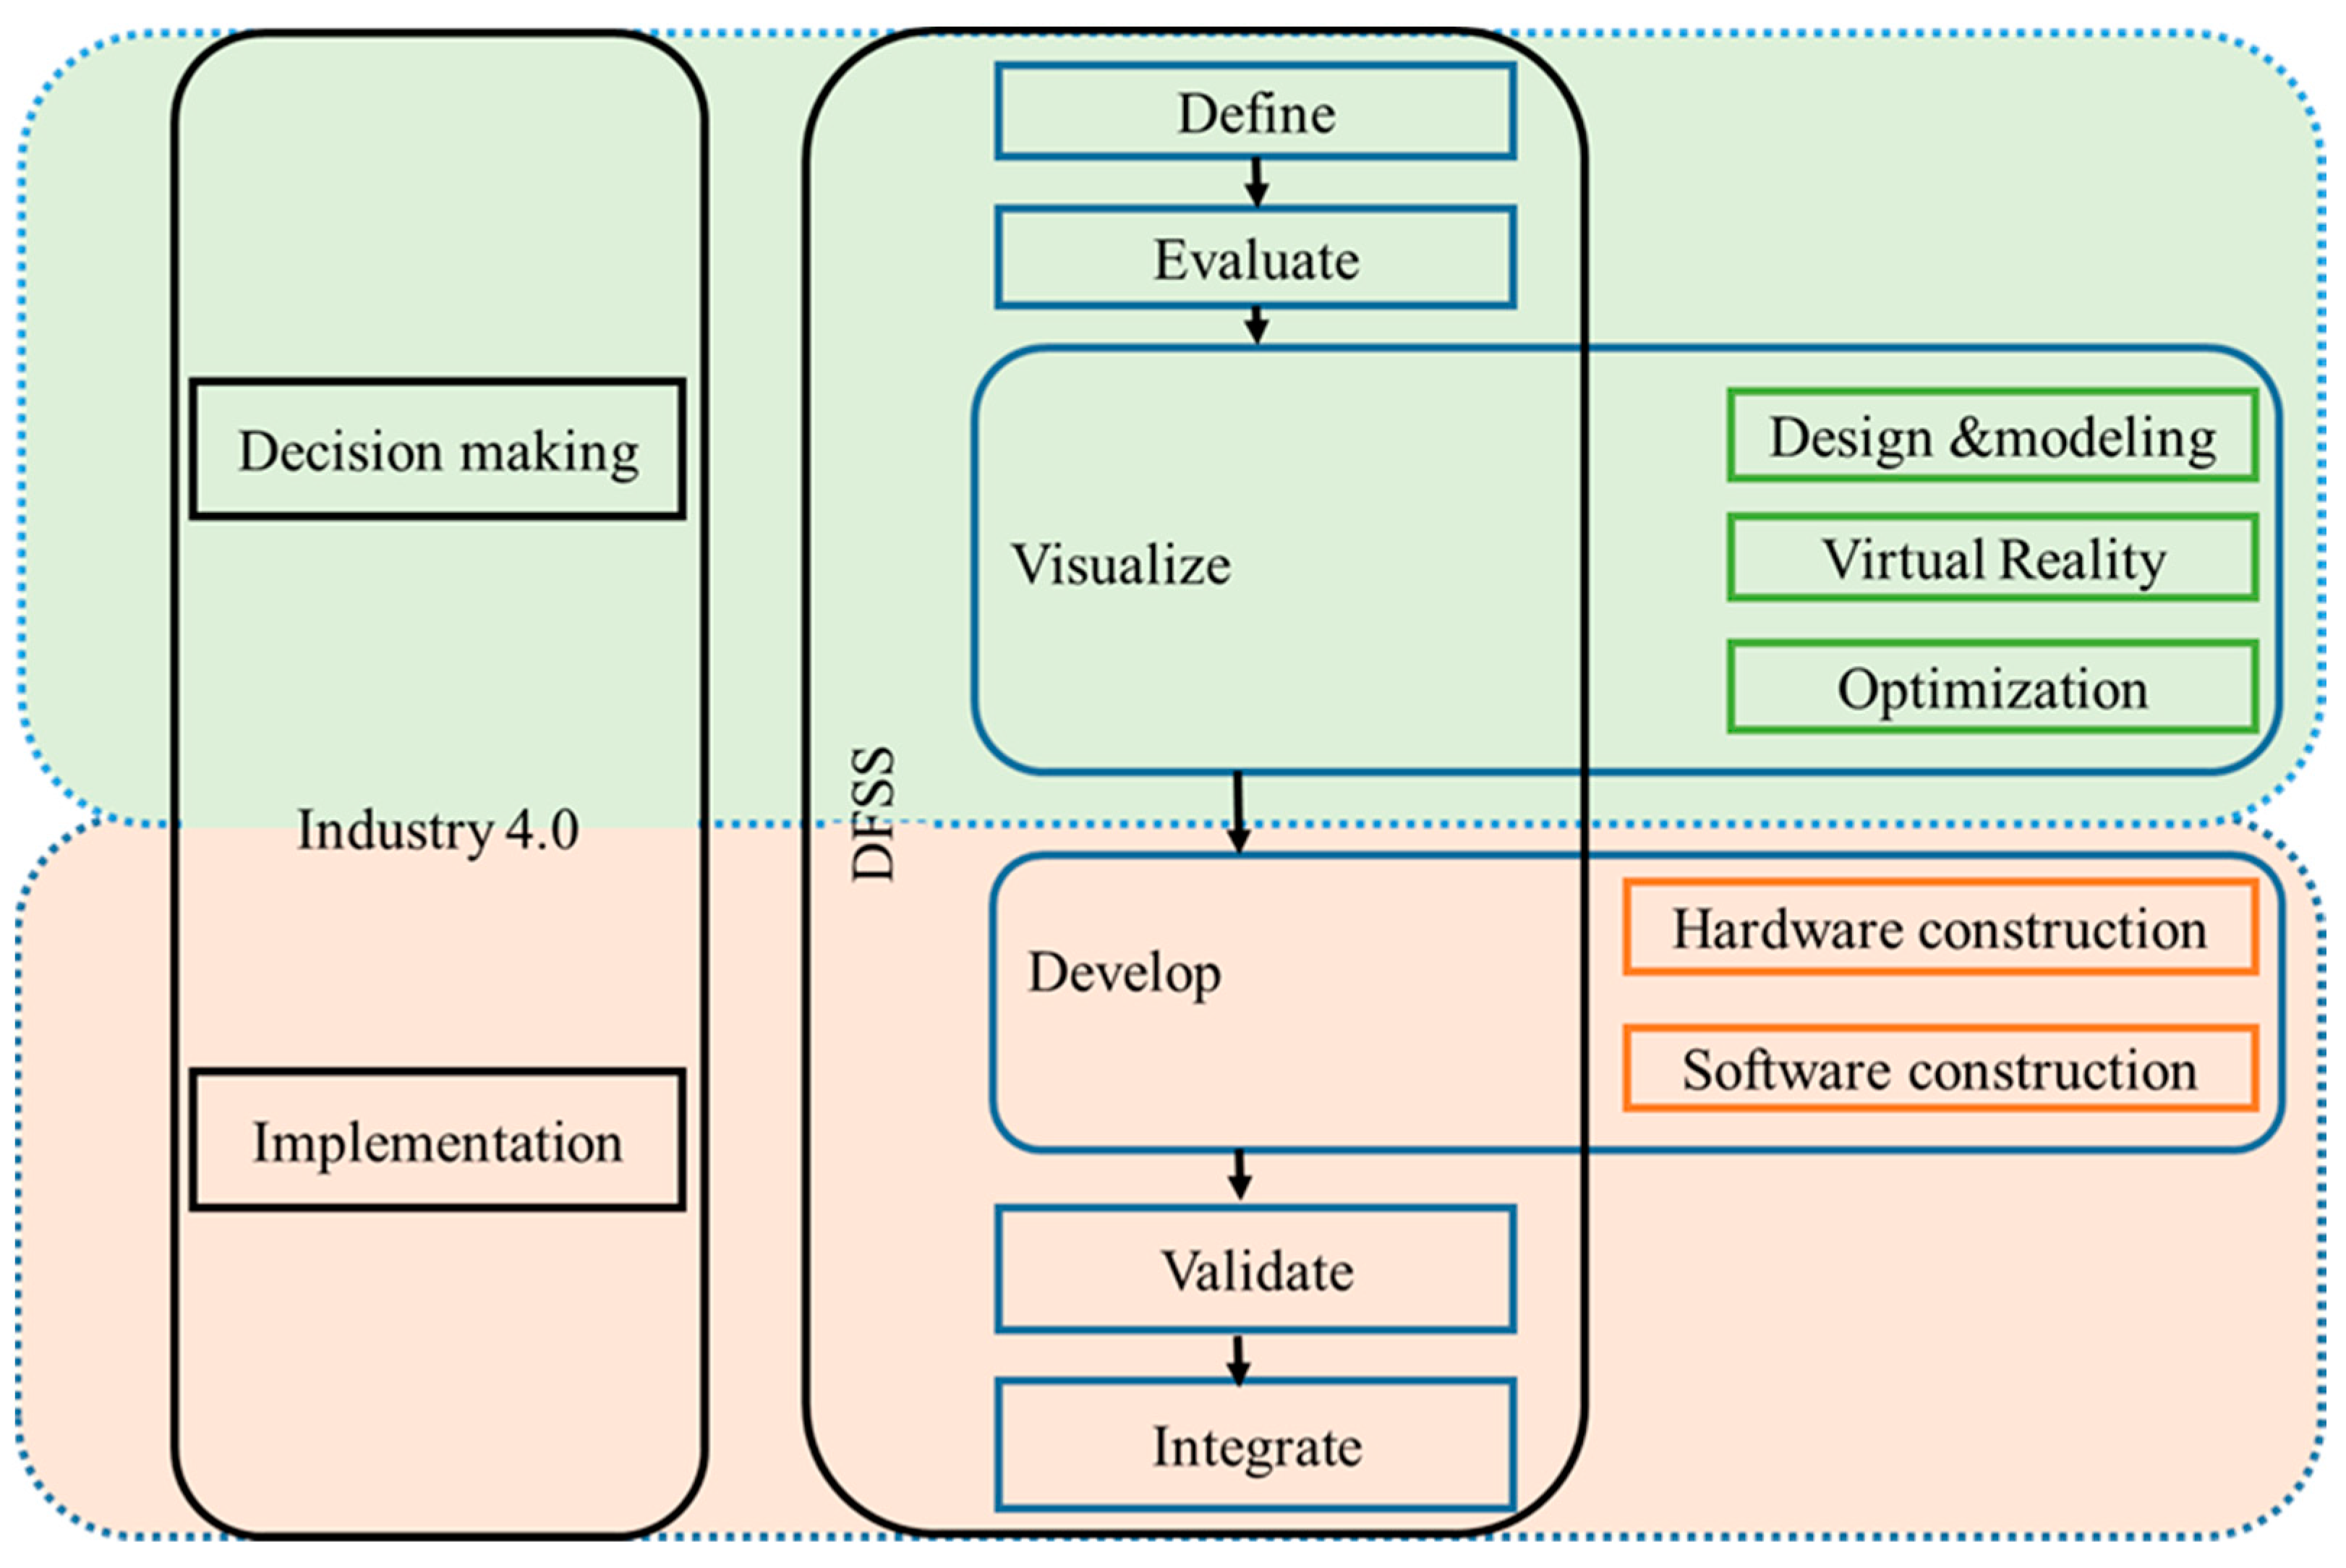
The design for the six sigma (DFSS) methodology is utilized for the development of the proposed Industry 4.0 approach, which facilitates the understanding of Industry 4.0 transition benefits and practical stand-alone solutions, as well as building a strong foundation for organizational solutions in the manufacturing environment. The result of the proposed DM&I approach, as shown in
Figure 5, provides an Industry 4.0 transition approach which is mainly divided into two steps. First is the decision-making step, which consists of four phases; define, evaluate, visualize, and optimize. Second is the implementation step, which consists of three phases; develop, validate, and integrate.
The following sections describe a real case of the development of an automatic dimensional quality measurement system for a bearing ring production line using the proposed DM&I approach stated in the previous section as a practical strategic approach to accomplish the desired objective. In clarifying this approach, we appreciate the collaboration of Chang Shu Cheng Chang bearing company, Ltd. From the investigation of the manufacturing processes, the study stated that the dimensional quality measurement was conducted manually using conventional equipment, therefore, based on different considerations, such as the production quality, production cost, and global competitiveness, the study set the improvement of the quality and productivity of the railway bearing ring production line as the primary goal. Therefore, we discussed the system design and simulation processes in order to achieve the optimum design that can provide basic knowledge about the development process and aid in decision-making for continuing the Industry 4.0 transition journey. The steps of the DM&I approach are represented as follows:
6. Decision-Making Step
The decision-making step is intended to provide a clear understanding of the development of Industry 4.0 and to encourage the organization to take the lead in discussing the Industry 4.0 transition issue with the ability to consult experts in need. The organization should be able to make decisions about Industry 4.0 transition processes by the end of this step without inquiring about high costs.
This study represents the developments of the quality measurement system and investigates the application of recent advanced technologies to improve system capability and productivity in order to meet the adoption requirements of Industry 4.0. Firstly, we carefully define the development targets, evaluate the current situation using a specific maturity model, design and model the system components, and, finally, simulate the system operation function using a virtual environment. In the following section, we will explore the practical phases of the decision-making step:
6.1. Define Phase
The manufacturing organization should identify the characteristics and limitations of existing resources, discuss customer needs, market analysis, costs, profits, etc., and then develop a project scope for implementing Industry 4.0, decoding the transition procedure into a detailed project plan and defining the characteristics of work in each phase of transition [
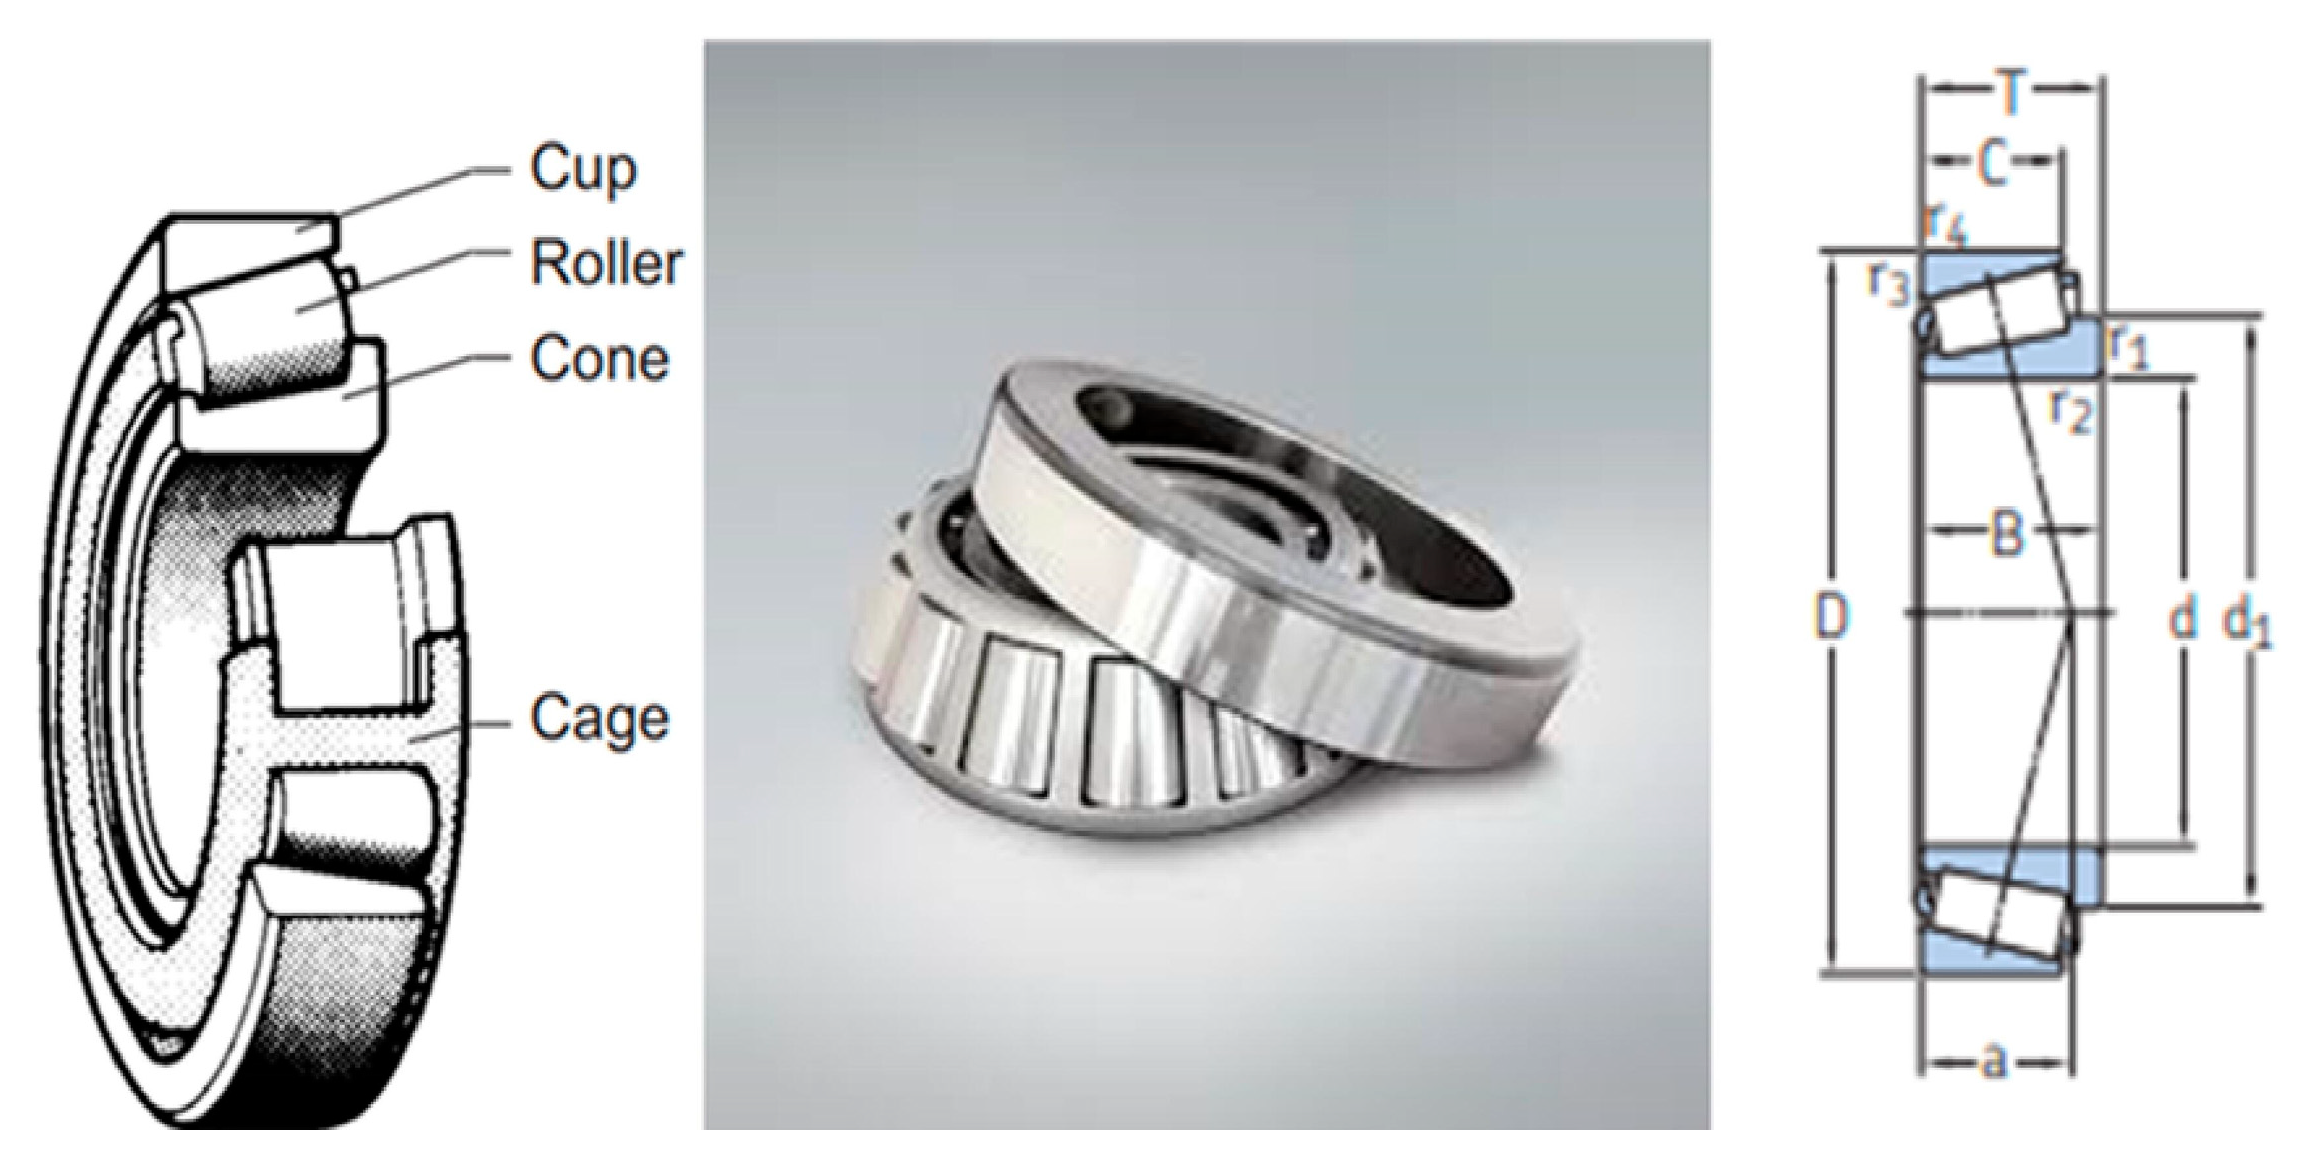
11]. According to the case study driven by the company, the company produces a variety of bearings, and different production lines are used. The tapered bearing ring has been considered, as shown in
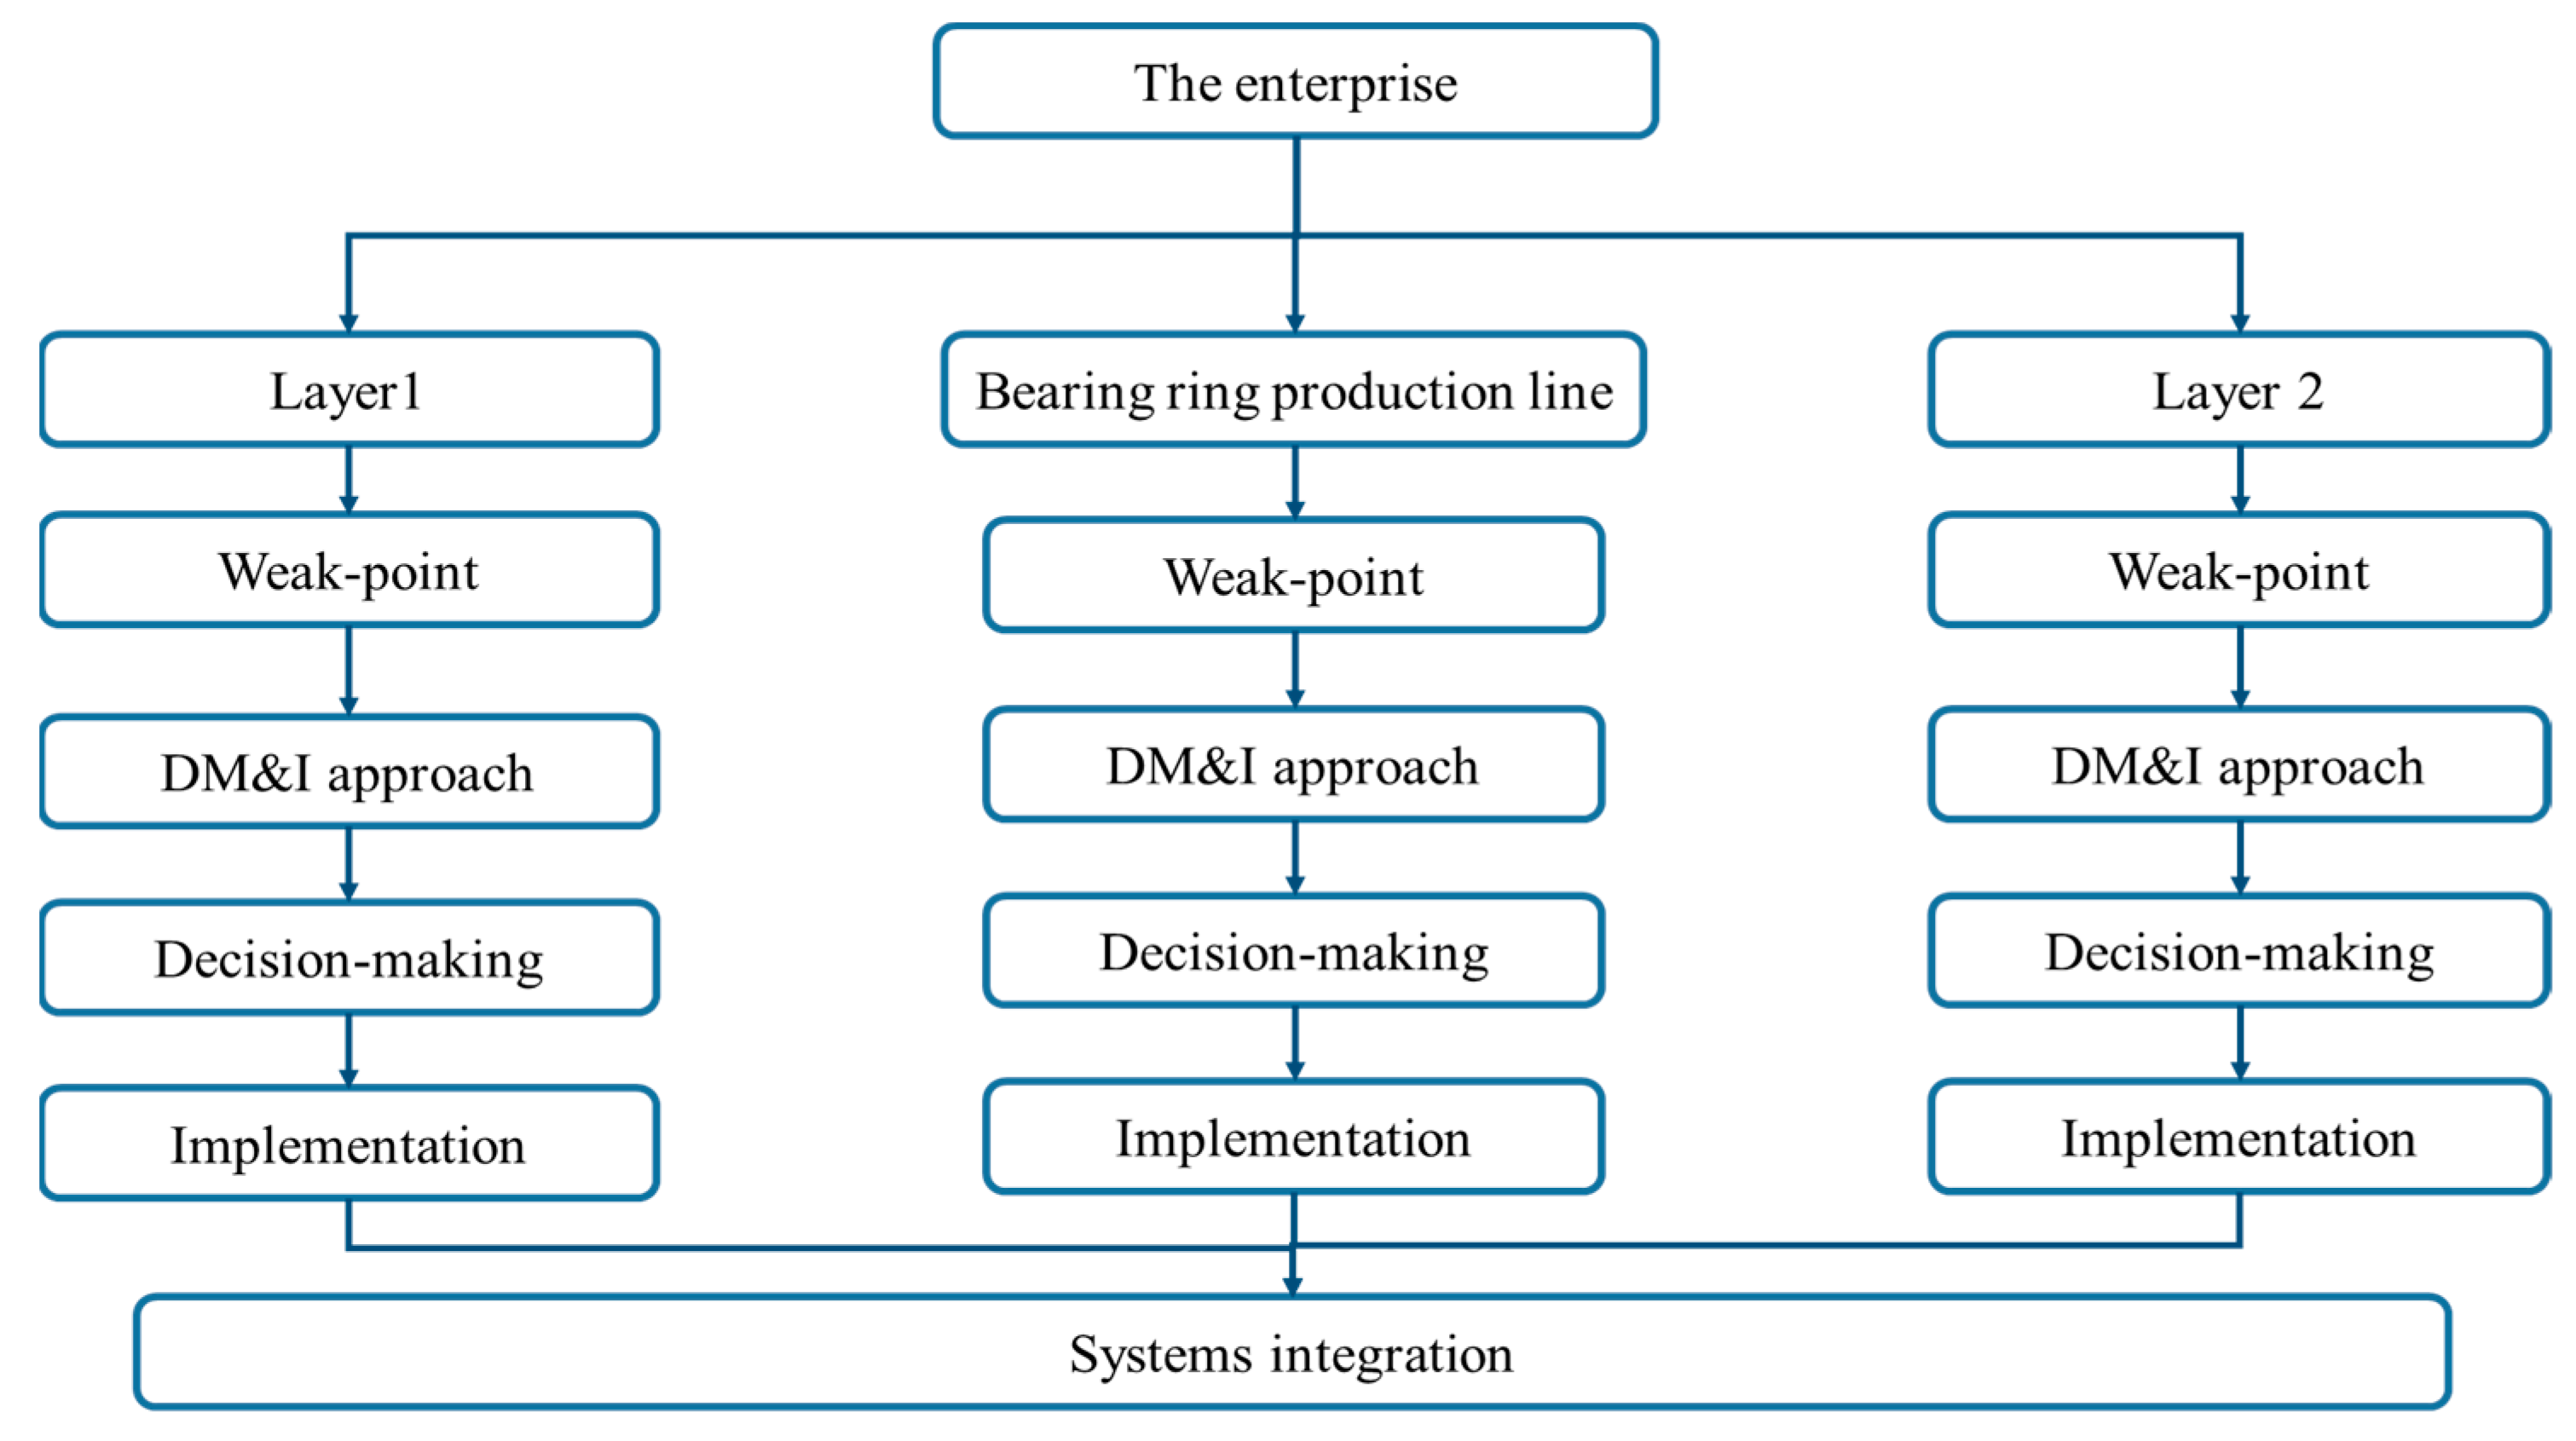
Figure 6; the research and development department pointed out that the weakness of the certain production line is the quality measurement process, which has been executed manually, whereas improving the quality measurement process will increase production efficiency and competitiveness. Generally, the manufacturing department consists of various production lines such as assembly lines, quality inspection, etc., which we consider as a layer. Then, the development processes will go through every layer separately, step by step, to reduce the disturbance of the actual production process and assist the company toward an Industry 4.0 transition without a huge investment.
Figure 7 shows the layers development sequence of the various departments within the organization.
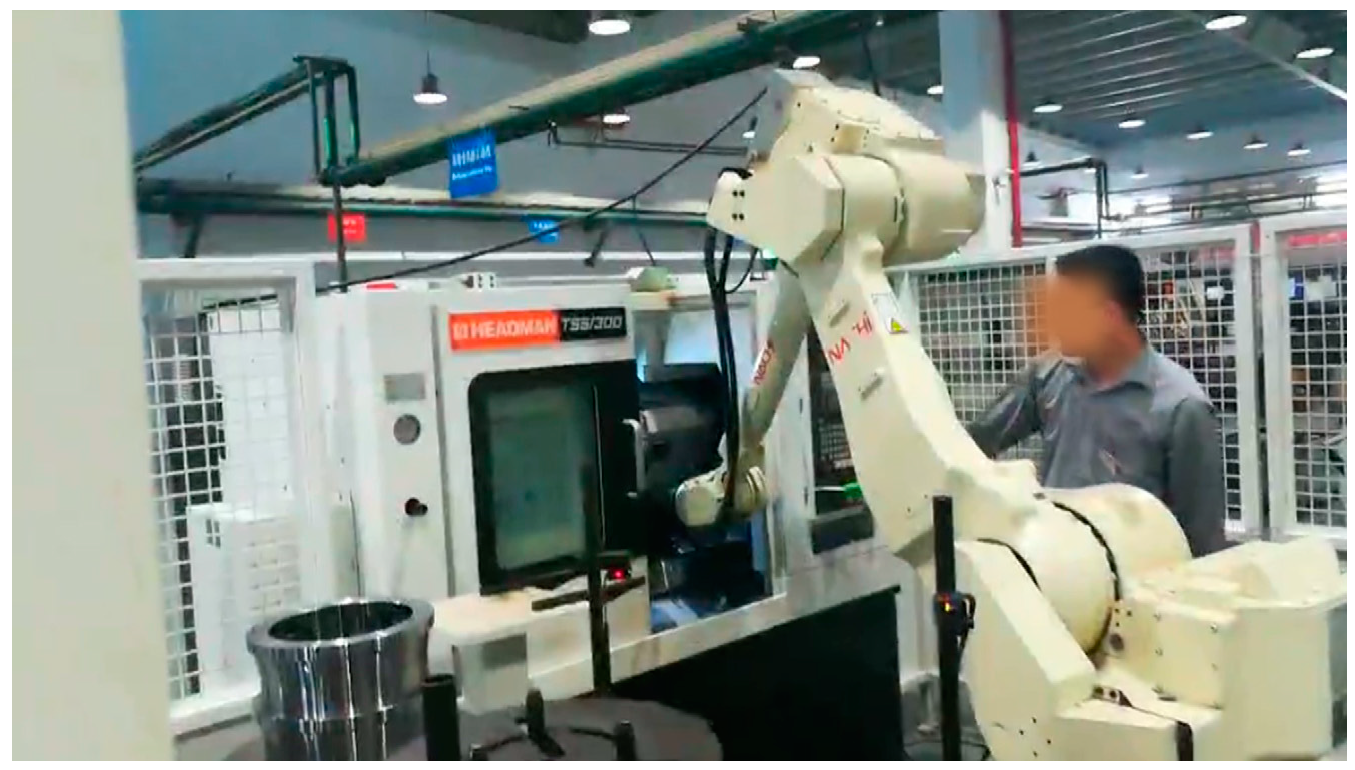
As illustrated in
Figure 8, the intended production line produces a railway-bearing ring. The particular production line consists of two CNC milling machines, and one handling robot operates both of the machines automatically. However, all other operations, including quality inspection, were carried out manually, which reduced productivity and bearing quality. The first step in getting the company on track toward an Industry 4.0 transition is by automating all manufacturing operations. Thus, from the weak point introduced by the company, the ideal goal is to improve product quality and enhance the company’s productivity via building an intelligent automatic bearing dimensional quality measurement system.
6.2. Evaluate Phase
Utilizing existing Industry 4.0 readiness and maturity assessment tools will enhance the evaluation phase. Human resource factors, process factors, and technology factors will typically be evaluated during the evaluation process [
41]. The study uses Industry 4.0 key technologies as evaluation criteria to determine the current maturity of the bearing ring production line based on the provided information and the company’s current development requirements. The level of maturity is determined by the organization’s current resources and technologies.
6.2.1. Maturity Assessment
Maturity levels, which range from Level 0 to Level 5, are frequently used to describe technical design and other changes. Level 0 refers to a company with minimal to no implementation. A company that conducts planned or in-progress pilot projects was described by Level 1. In Level 2, implementation activities have been initiated and put it into practice, and some benefits are seen. The partial implementation of measures to improve the company’s competitiveness is included in Level 3. The advanced adoption of measures with evident economic benefits is described as Level 4. Level 5 serves as a guide for applying ideas and putting smart technologies into practice [
42]. There are numerous models for assessing digital maturity developed by various conciliating companies, such as the Smart Manufacturing Kaizen Level (SMKL) method developed by Mitsubishi Electric [
43]. Furthermore, researchers who have proposed their own models for assessing maturity in new contexts, such as Gajdzik, et al. [
44], Çınar et al. [
45], Schumacher et al. [
46], Bibby, and Dehe [
47], Santos, and Martinho [
48], Akdil et al. [
49], Gökalp et al. [
50], and Temur et al. [
51], have provided a good base for maturity level self-assessment. However, as previously mentioned, the proposed approach takes into account the evaluation of a specific section of the enterprise based on Industry 4.0 key technologies. Thus, for this study, the assessment of the maturity level is evaluated based on the degree of implementation of Industry 4.0 key technologies in the intended enterprise, and the self-assessment maturity method introduced by Schumacher et al. [
46] was used.
Table 9 provides an overview of the maturity assessment key element together with some short descriptions to support understanding.
Self-assessment maturity is measured through the maturity items of an organization using a standardized questionnaire with a single closed-ended question per item. Each question requires a response on a Likert scale ranging from 1 (not distinct) to 5 (very distinct). The sample questionnaire is presented in
Appendix A, and it was answered by company employees. According to Schumacher et al. [
46], the maturity level is calculated using the following Formula:
where
M—Maturity
K—Key Element
I—Item
g—Weighting Factor
n—Number of Maturity Items
6.2.2. Maturity Result
the maturity level of each key element result,
is the weighting of the key element equal to the average importance rating from all answers for each item. The questionnaire response is collected from three production lines to calculate each item’s weighting factor, which is demonstrated in
Appendix A.
Table 10 shows an example of the questionnaire data extraction.
e.g., using Formula (4) to calculate the level of maturity for
.
The
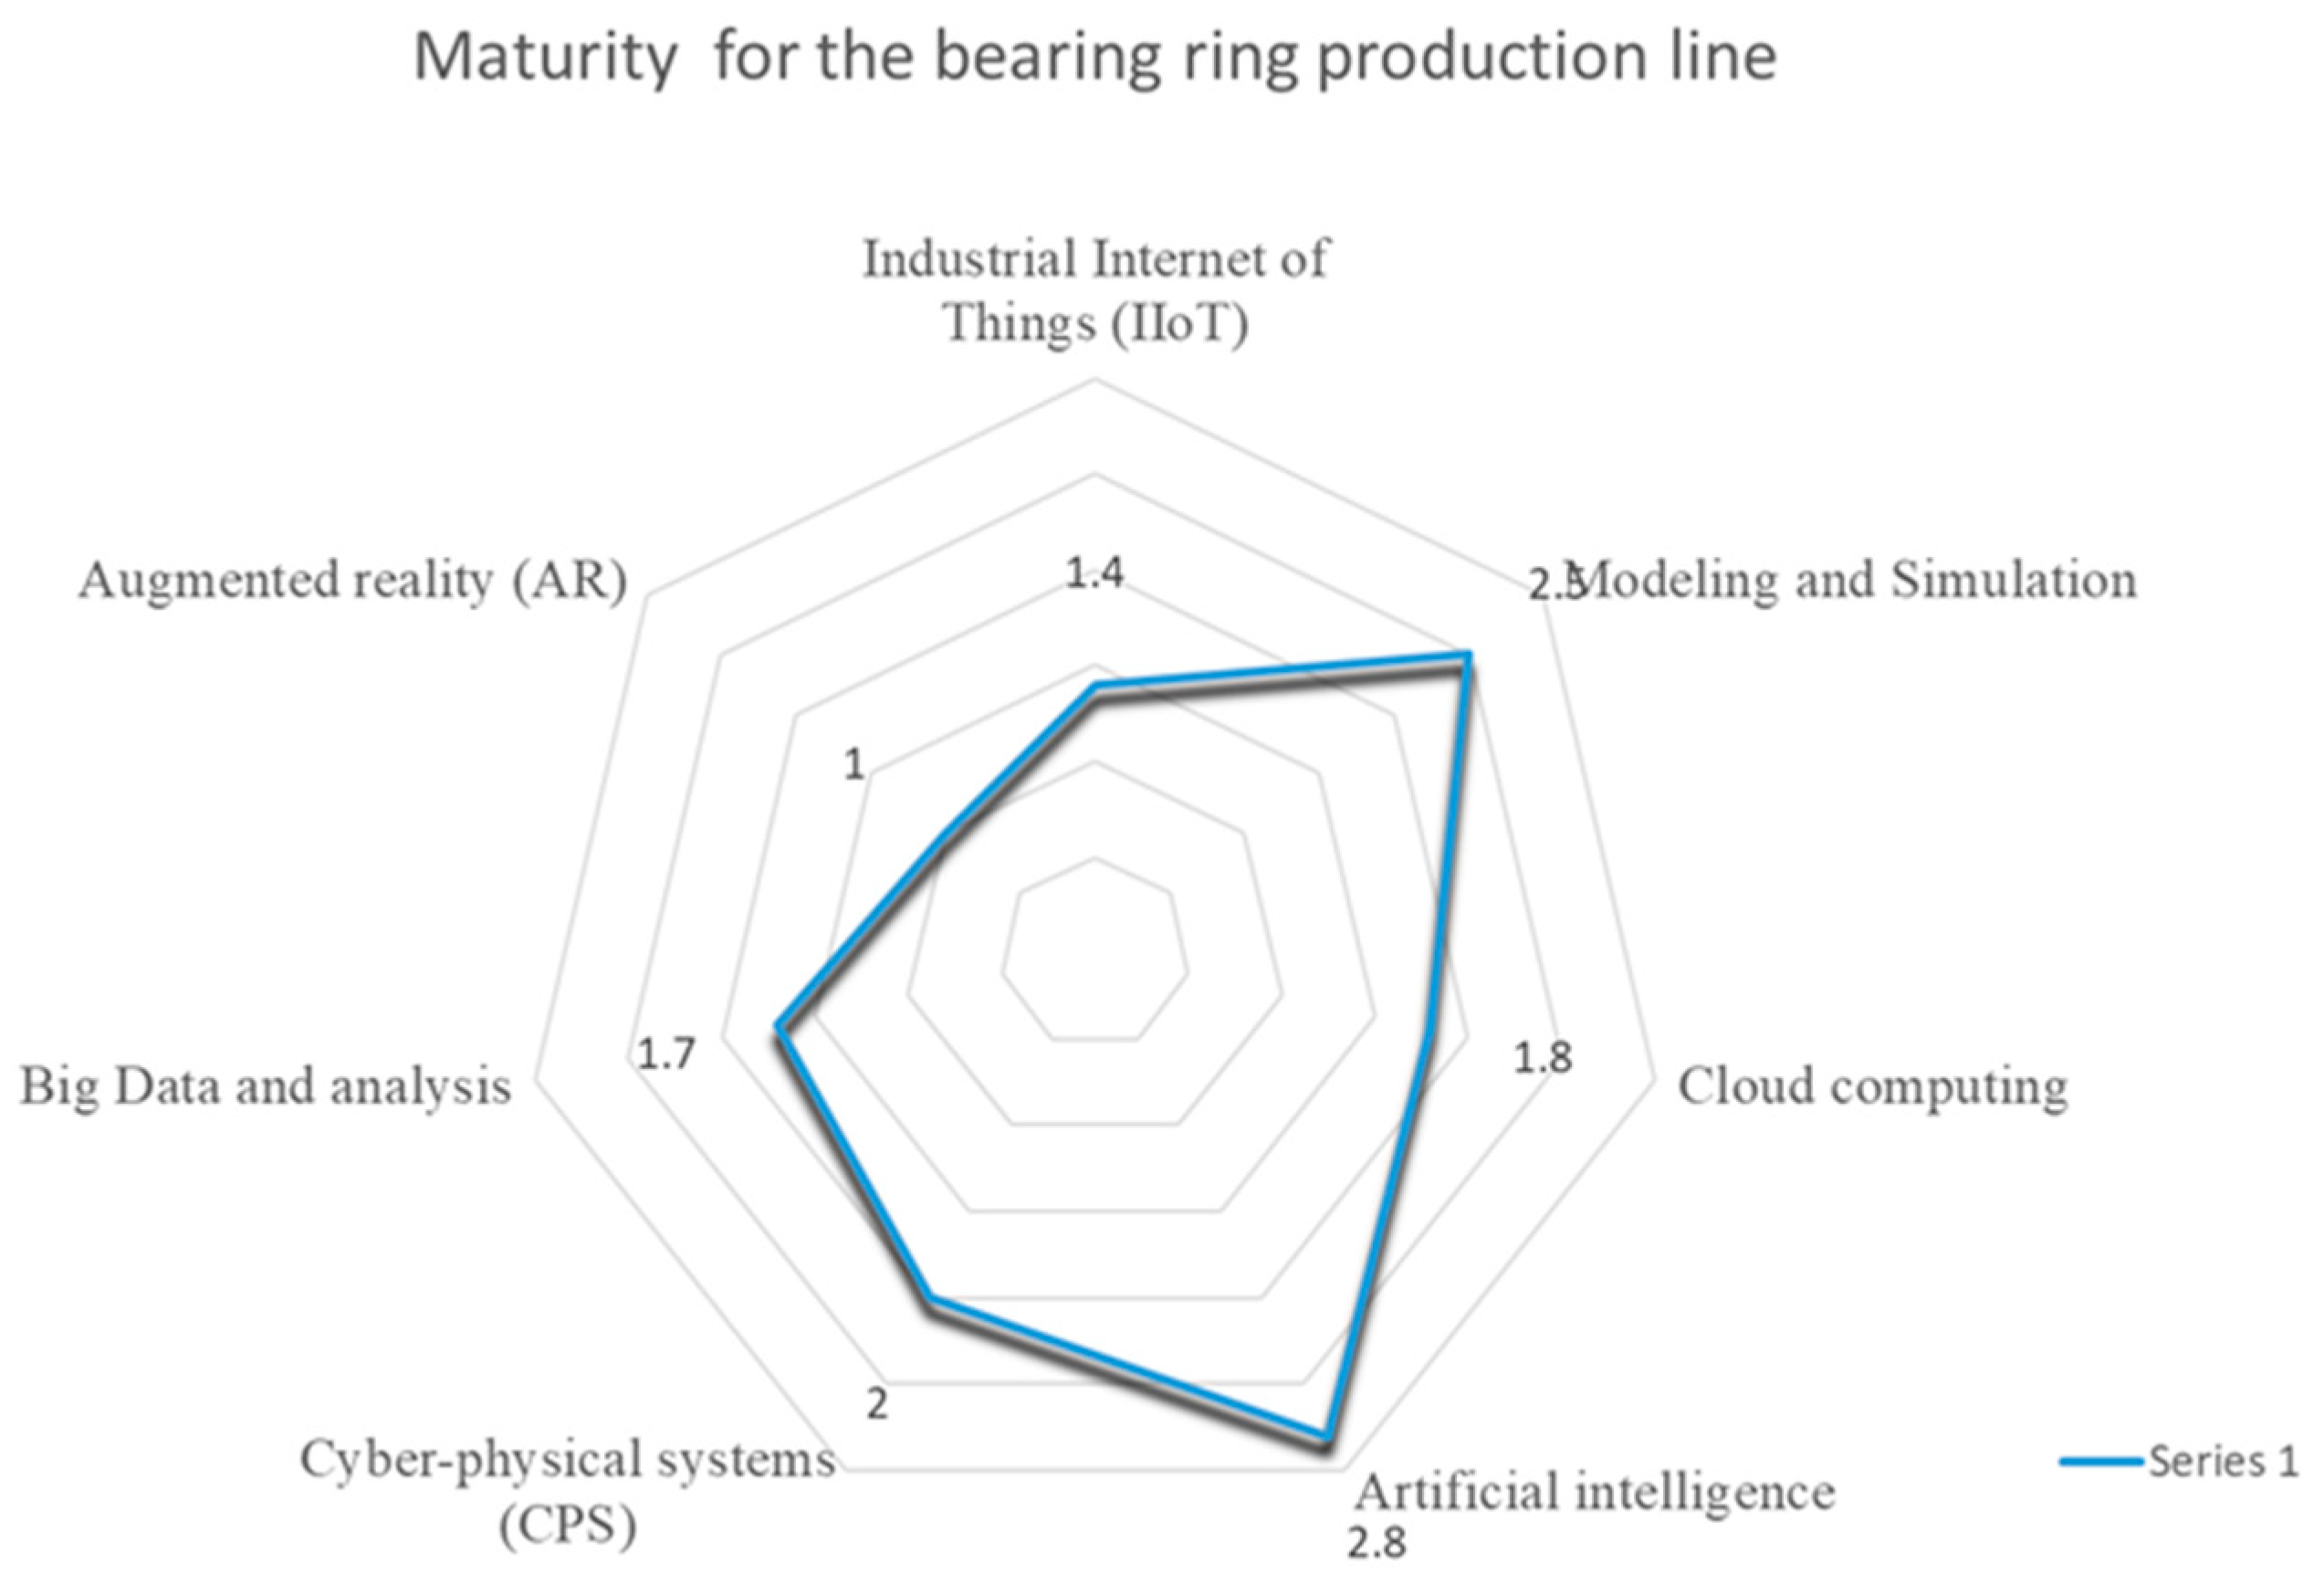
maturity rating of 1.8 out of 5 indicates that the concept of “cloud computing” is not utilized. Similarly, the maturity level of the remaining key elements was also calculated, as illustrated in
Table 11. The results shown in
Figure 9 demonstrate that the maturity factor of “artificial intelligence”, rating 2.8 out of 5, is the best rate among the other key elements because the production line uses CNC machines and artificial manipulating robots. But, compared with the maturity scale, a rating factor less than 3 indicates the ‘‘implementation of actions initiated, with some benefits being observed,”. While most of the key elements are rated less than 2. The total score is 1.9 which indicates that “low or none degree of implementation”, therefore, all key elements should be considered in the design process. In this study, we primarily rely on technologies that scored 2 or higher on the proposed measurement system, due to the fact that the organization’s experience with these technologies can facilitate design discussions and aid in decision-making.
6.3. Visualize Phase
Scientific visualization is the creation of a graphical representation of scientific phenomena. It is a part of the scientific inquiry process that facilitates the planning processes and verification [
52]. The visualize phase, in the proposed approach, is the first stage in the use of Industry 4.0 key technologies such as Design and modeling and Virtual Simulation.
In this section, we will, therefore, go through the visualization process steps in order to design and model the measuring system and then create the virtual simulation environment. Various design methods were reviewed, such as the available asset design method and LNE design method. The design thinking process would be utilized to create the desired prototype. It is a problem-solving methodology that employs a creative and user-centric approach to product creation and design [
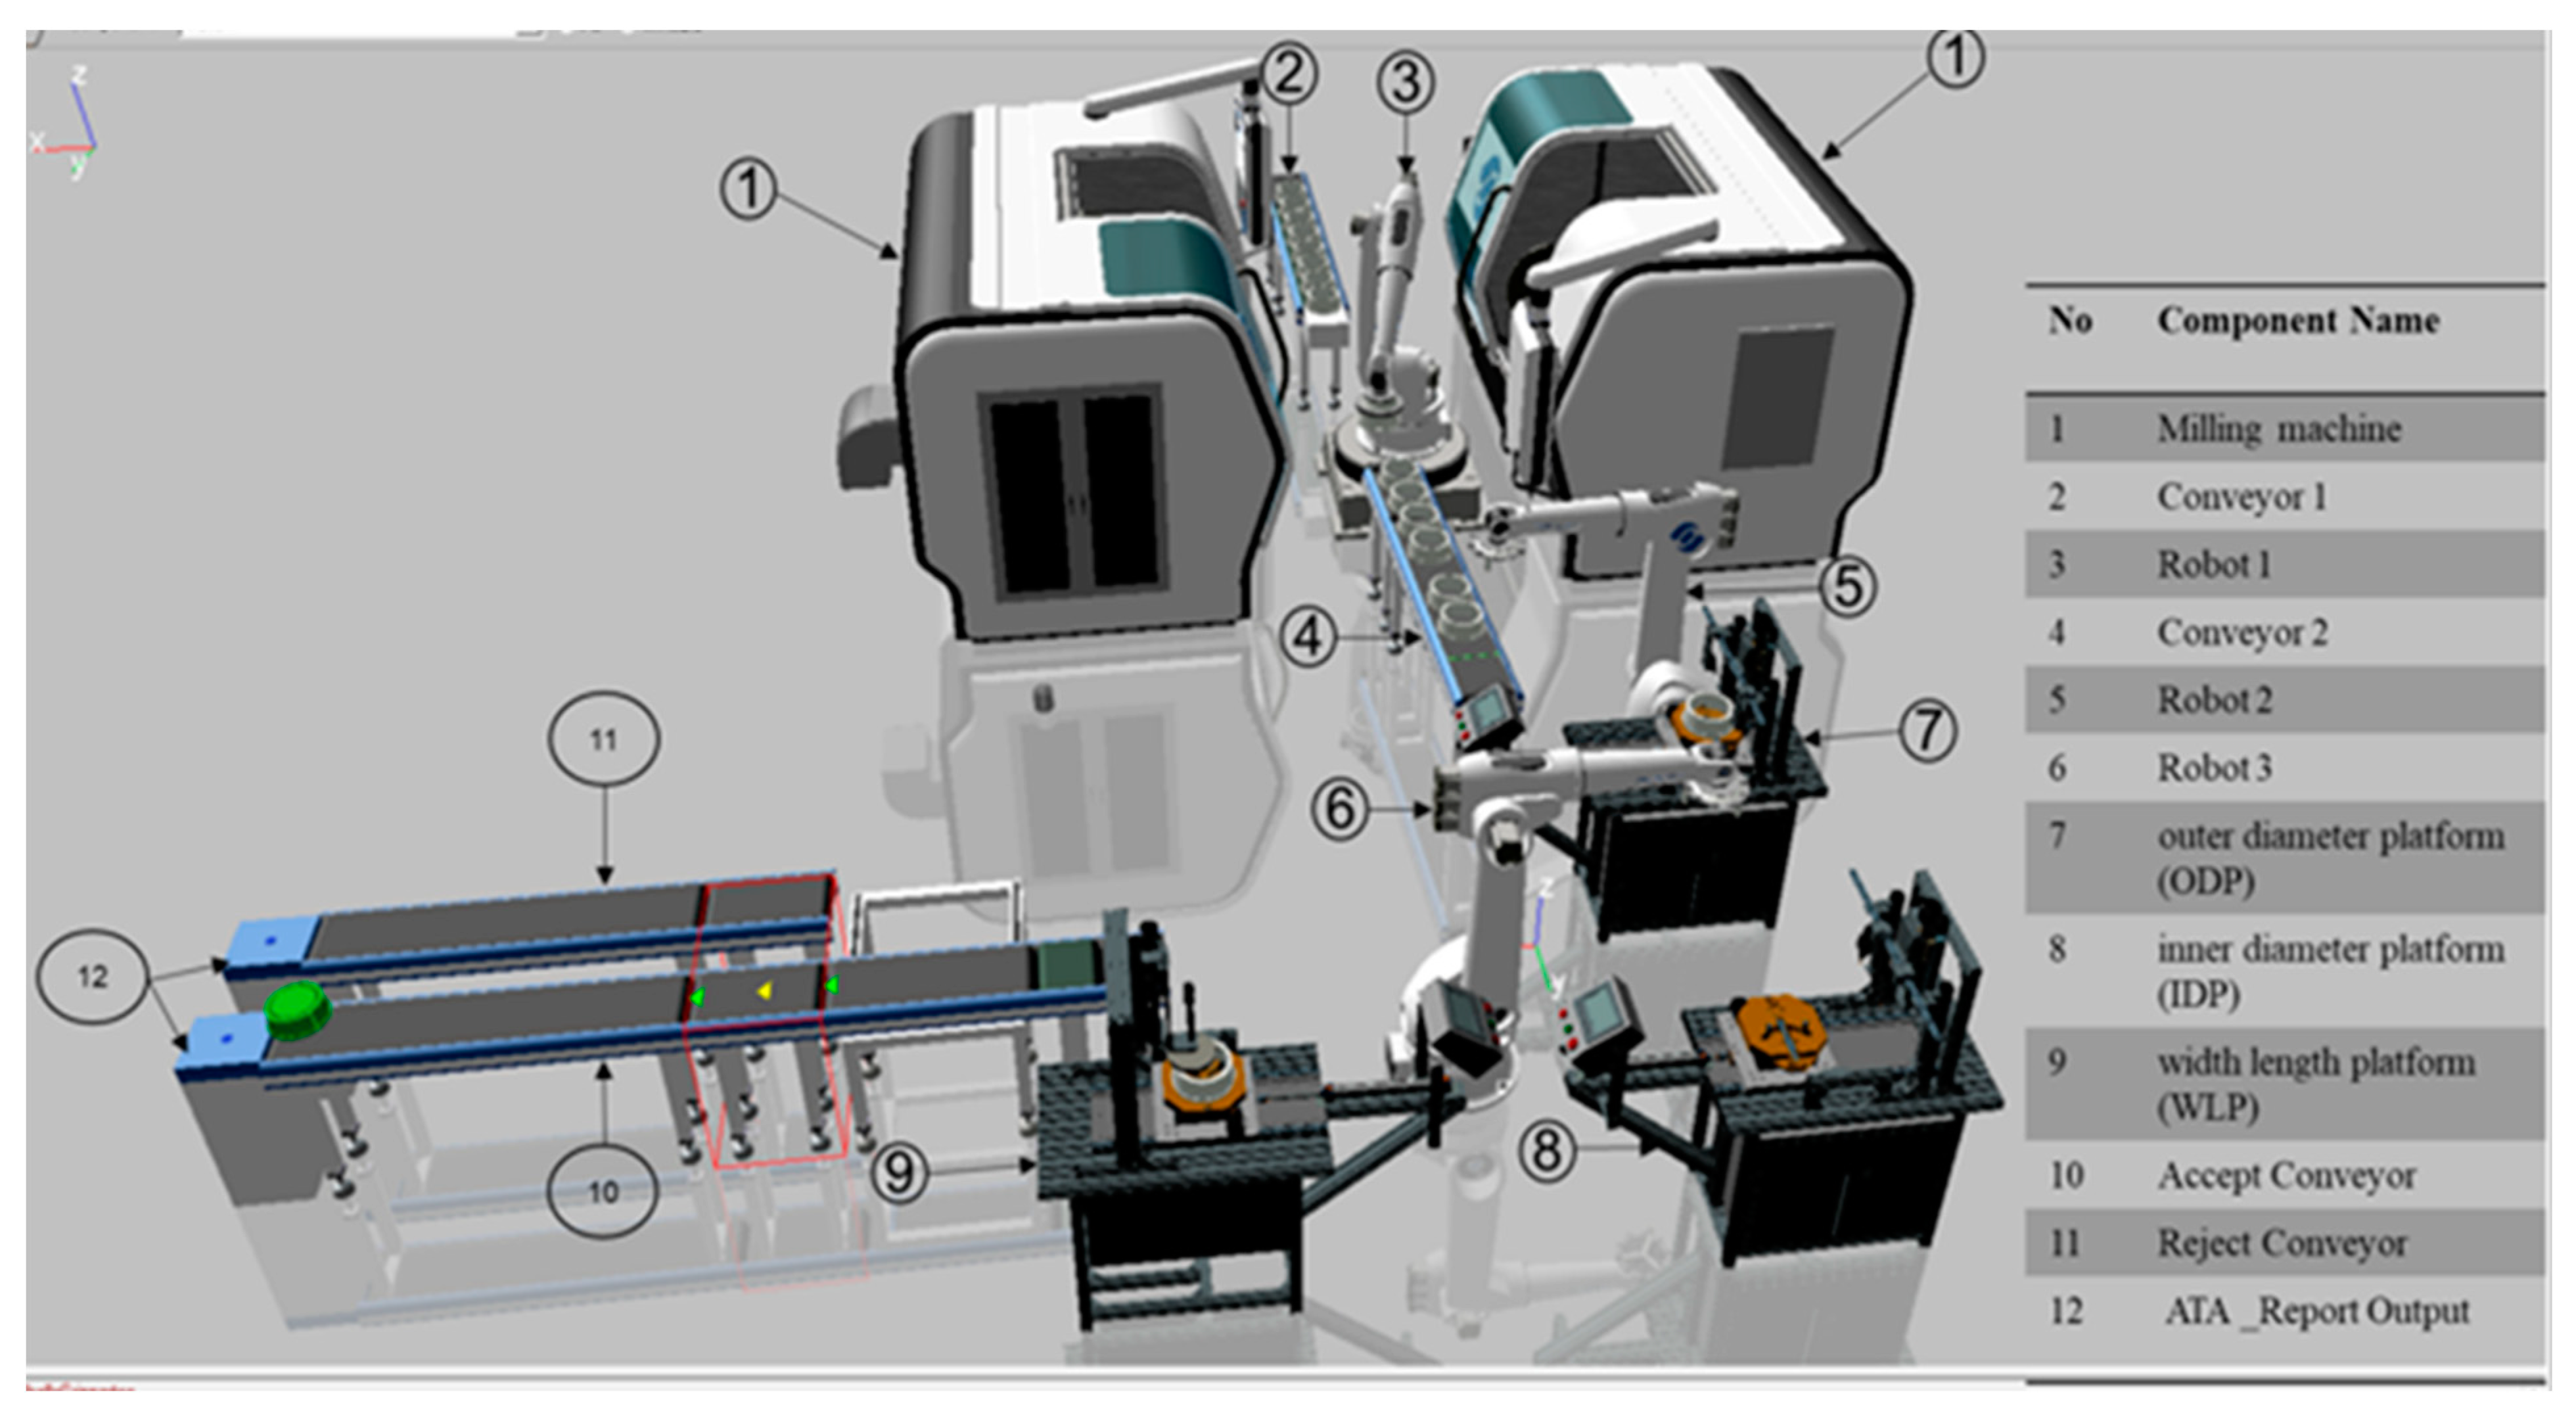
53]. Based on the design thinking process, the organization requirements were analyzed, and a novel fully automatic measurement system was designed, which consists of three detection platforms: an outer diameter platform (ODP) to measure the part in a different section, an inner diameter platform (IDP) for measuring the bearing inner diameter, and a width length platform (WLP) to measure the bearing ring height and the large flange width. The three measurement prototypes were visualized in 3D models using CAD software. Using 3D Automate software, the virtual simulation environment was created. However, the ideal design of the automatic dimensional quality measurement system for the bearing ring has been visualized, as shown in
Figure 10. The virtual simulation environment provides the product flow process for the entire system in the real world. This clarifies the significance of Industry 4.0 for the intended enterprise and facilitates the development discussion. The virtual simulation environment results shown in
Table 12 represent the characteristics of the proposed dimensional quality measurement system for the bearing ring, which helped the intended organization make the right decision regarding when and where to begin the improvement journey.
6.4. Optimize Phase
Optimization processes go through multiple rounds to provide the optimal design. In earlier stages, a thorough design is constructed that can be subjected to numerical and statistical analysis to enhance performance. Different software packages are used for CAD design (such as Autodesk Inventor), process flow (such as AnyLogic), and product analysis (such as ANSYS) [
54]. In this phase, a comprehensive discussion amongst the various levels of the organization’s management should be held. The handling robot selection was taken as an example, since the virtual environment was built whether it represents a product, an equipment, or an online service.
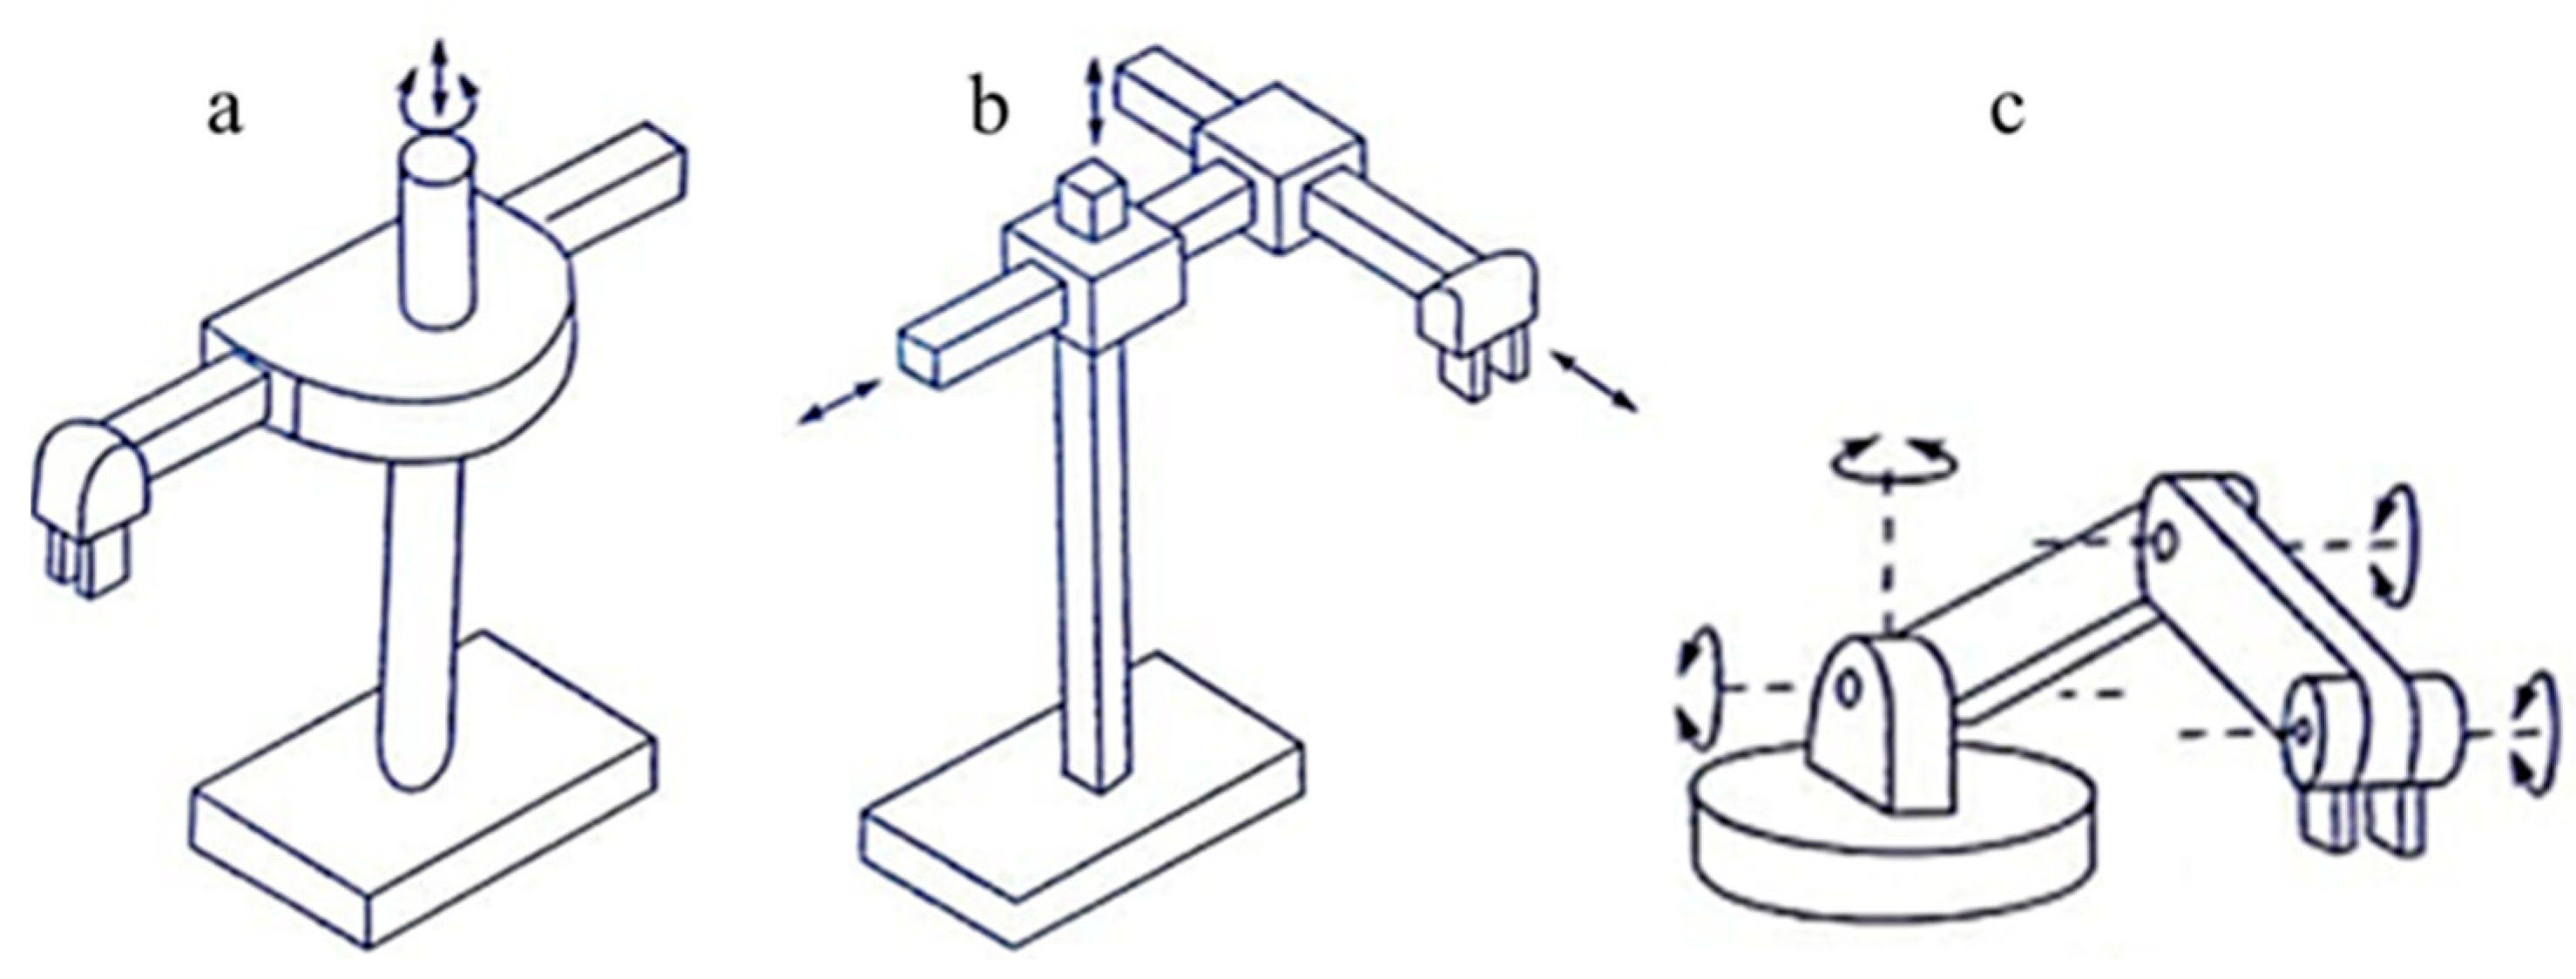
In practice, the selection of a handling robot type is an additional crucial design concept. However, the transmission of bearing parts between detection modules can be conceptualized as a simple combination of vertical lifting and translation. To carry out the bearing parts handling process, three forms of robots can be used. The three basic types are multi-joint robots, cylindrical coordinate robots, and cartesian coordinate robots, as shown in
Figure 11. The multi-joint robot is more efficient for optimal design, but it will increase the cost, and it is more complex in programming, which affects the integration process with the existing system. Both the cartesian coordinate robot and the cylindrical coordinate robot satisfy the requirements and are economical. Depending on the needs, the cartesian coordinate robot can be designed as a truss robot capable of transporting measured parts between the detection modules. The truss robot is positioned between two working platforms and functions to pick and place measured component positions. The workspace limitation conflicts with the consecutively positioned modules in the modular design concept if a single truss robot covers more than two detecting modules. Similarly, the cylindrical coordinate robot could be utilized, which is positioned on one side of the detecting module as a single individual and mimics the tower crane often used in the construction industry.
However, in the current situation, a multi-criteria decision-making method is recommended to determine the best choice for handling robot design based on the needs of the company. However, different methodologies can be used to support the robot selection based on various criteria depending on the design circumstances. The analytic hierarchy process method in spice logic software is used based on the fuzzy logic methodology. Hence, optimization aims to determine the best choice among the three types of robots. Establishing the criteria for selection is the core of the optimization process. The first criterion is the cost, which is most important in the optimization process. The second is the workspace condition, which also constrains the robot selection. The third is the programming process; how easy or complex this is also influences the selection. The fourth is work efficiency compared with the desired functions. The criteria were weighted, and the three robot choices were compared to the criteria.
Table 13 illustrates the weights of each alternative relative to the cost criterion. In general, the sum of all decimals will equal 1, and a higher decimal value indicates a higher priority.
Table 14 shows the weights of the options against the cost in pairwise comparisons of options and criteria.
Table 15 shows the weights of the options against the work-space condition in pairwise comparisons of options and criteria.
Table 16 shows the weights of the options against the programming process in pairwise comparisons of options and criteria.
Table 17 shows the weights of the options against the work efficiency in pairwise comparisons of options and criteria.
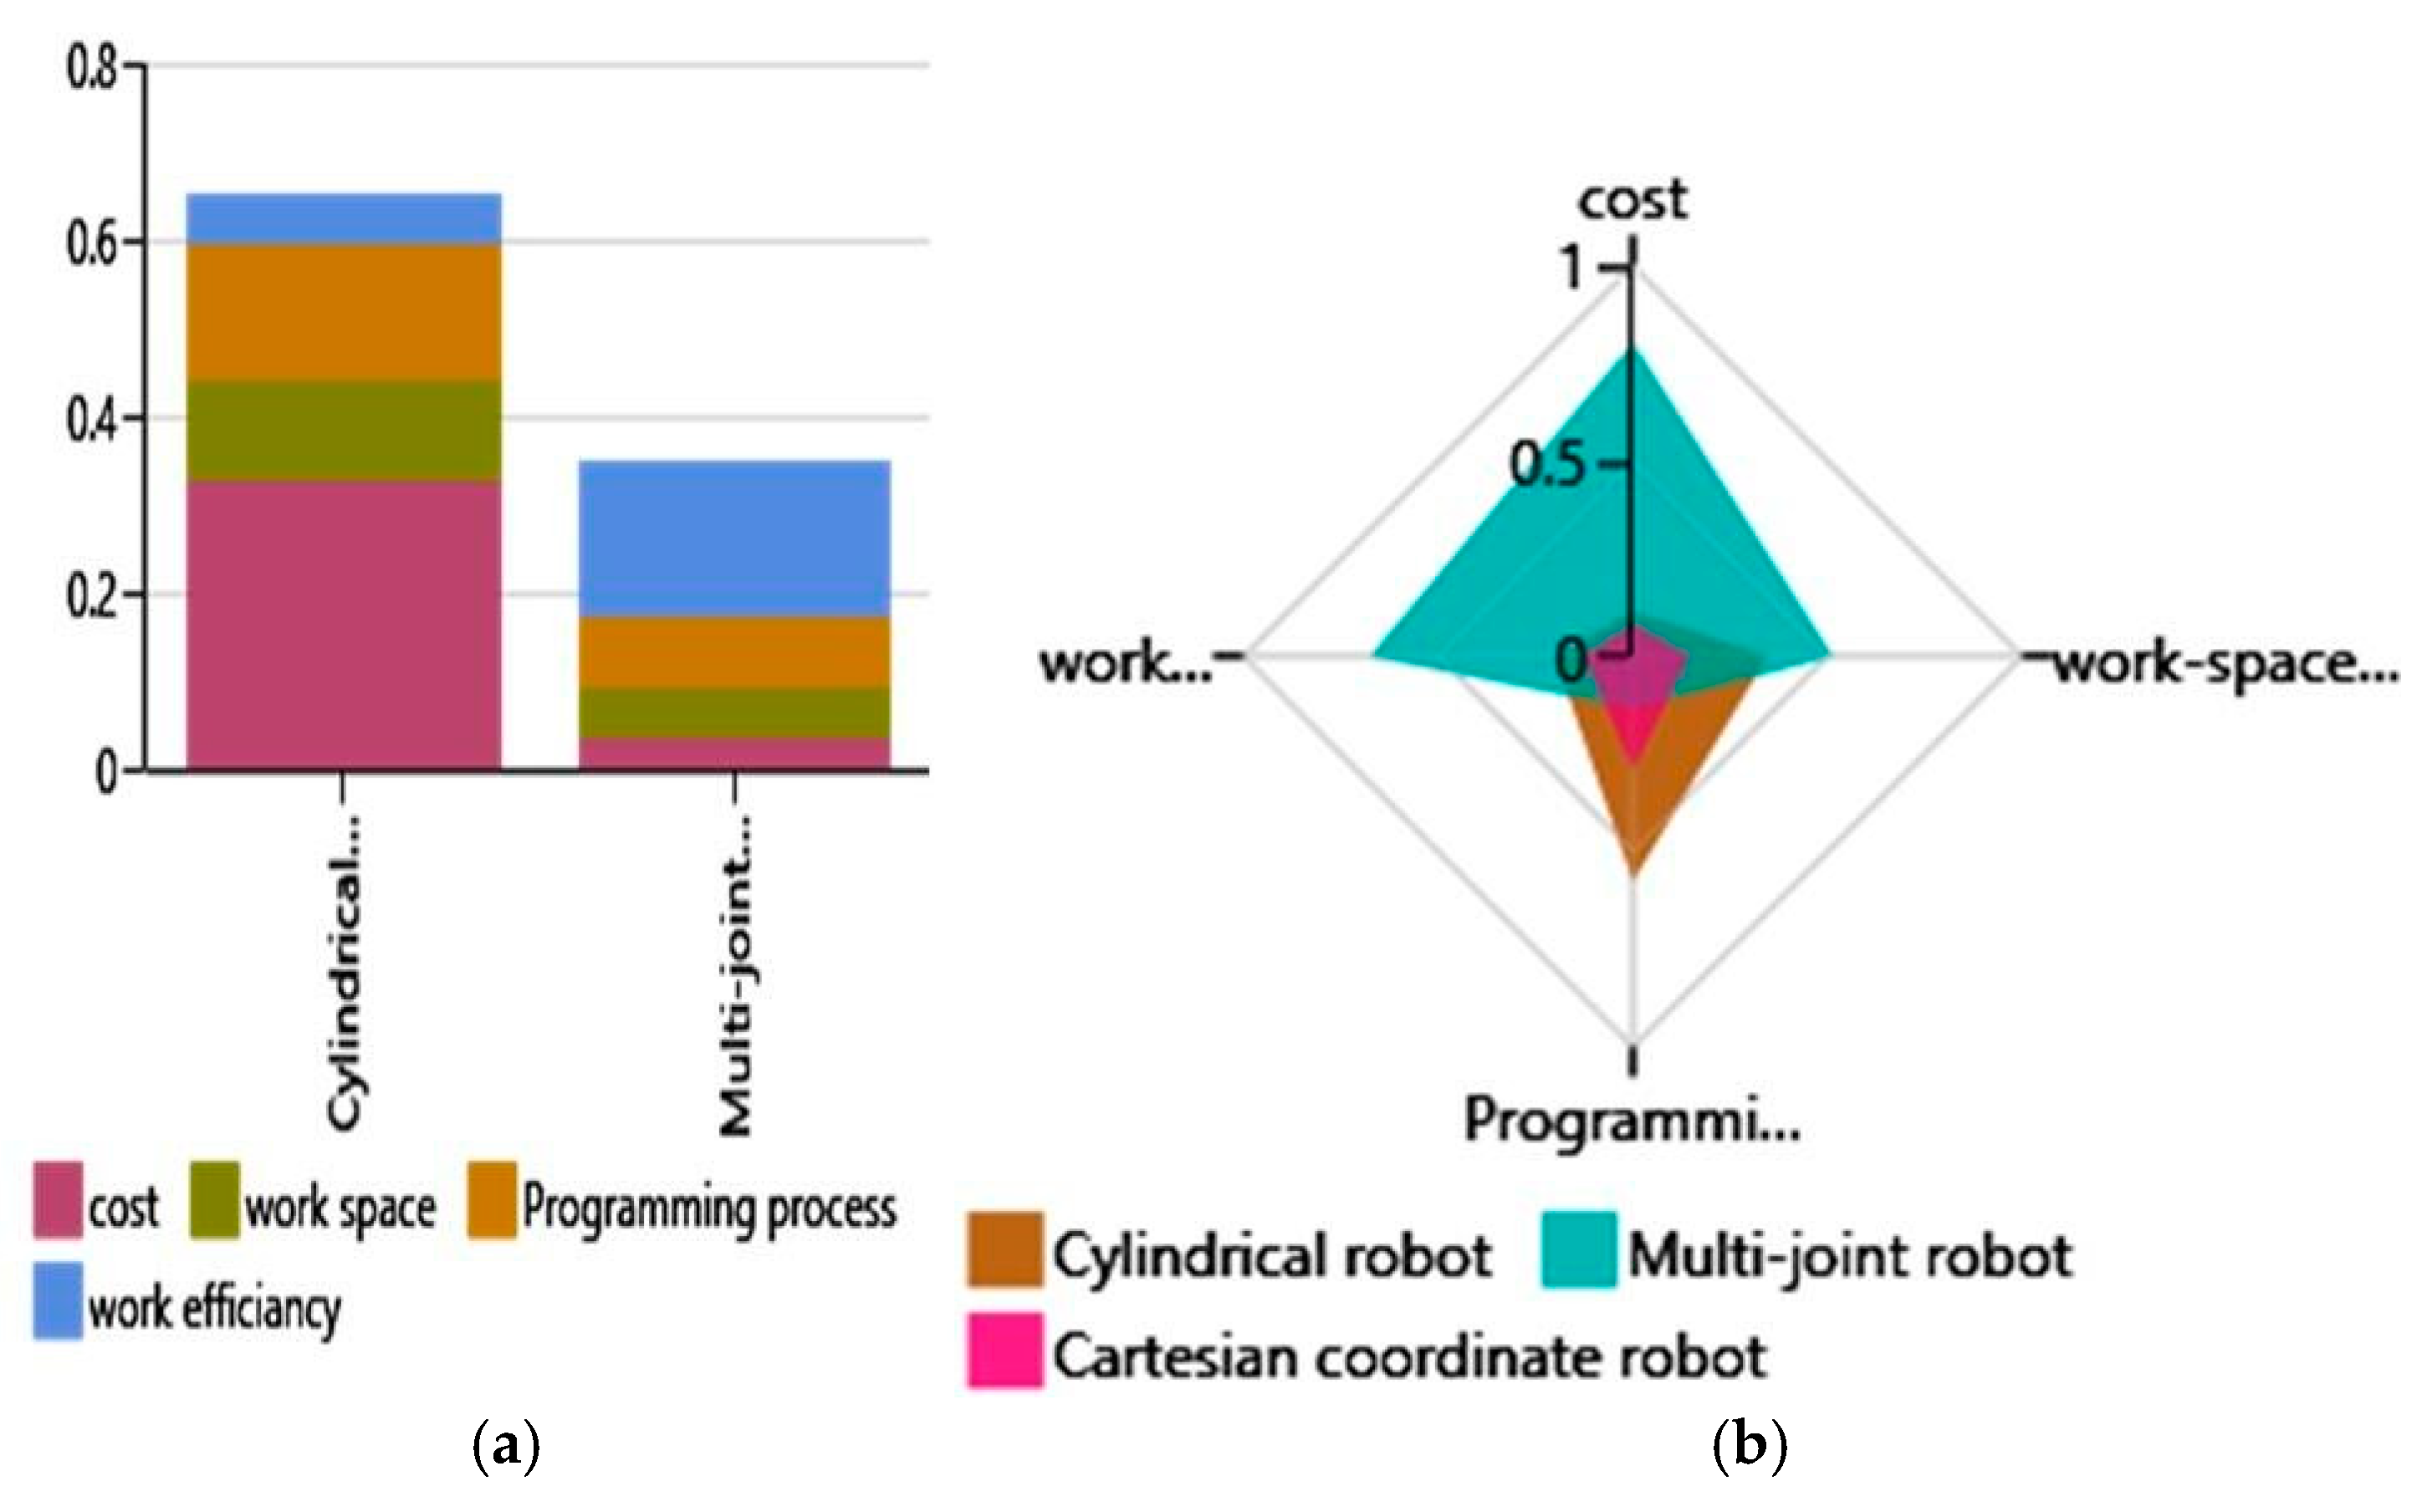
Finally, the weighted importance of each criterion was then multiplied against the score of each alternative to get the weighed score, i.e.,
Figure 12a illustrates a calculated weighted score based on the attributes shown in
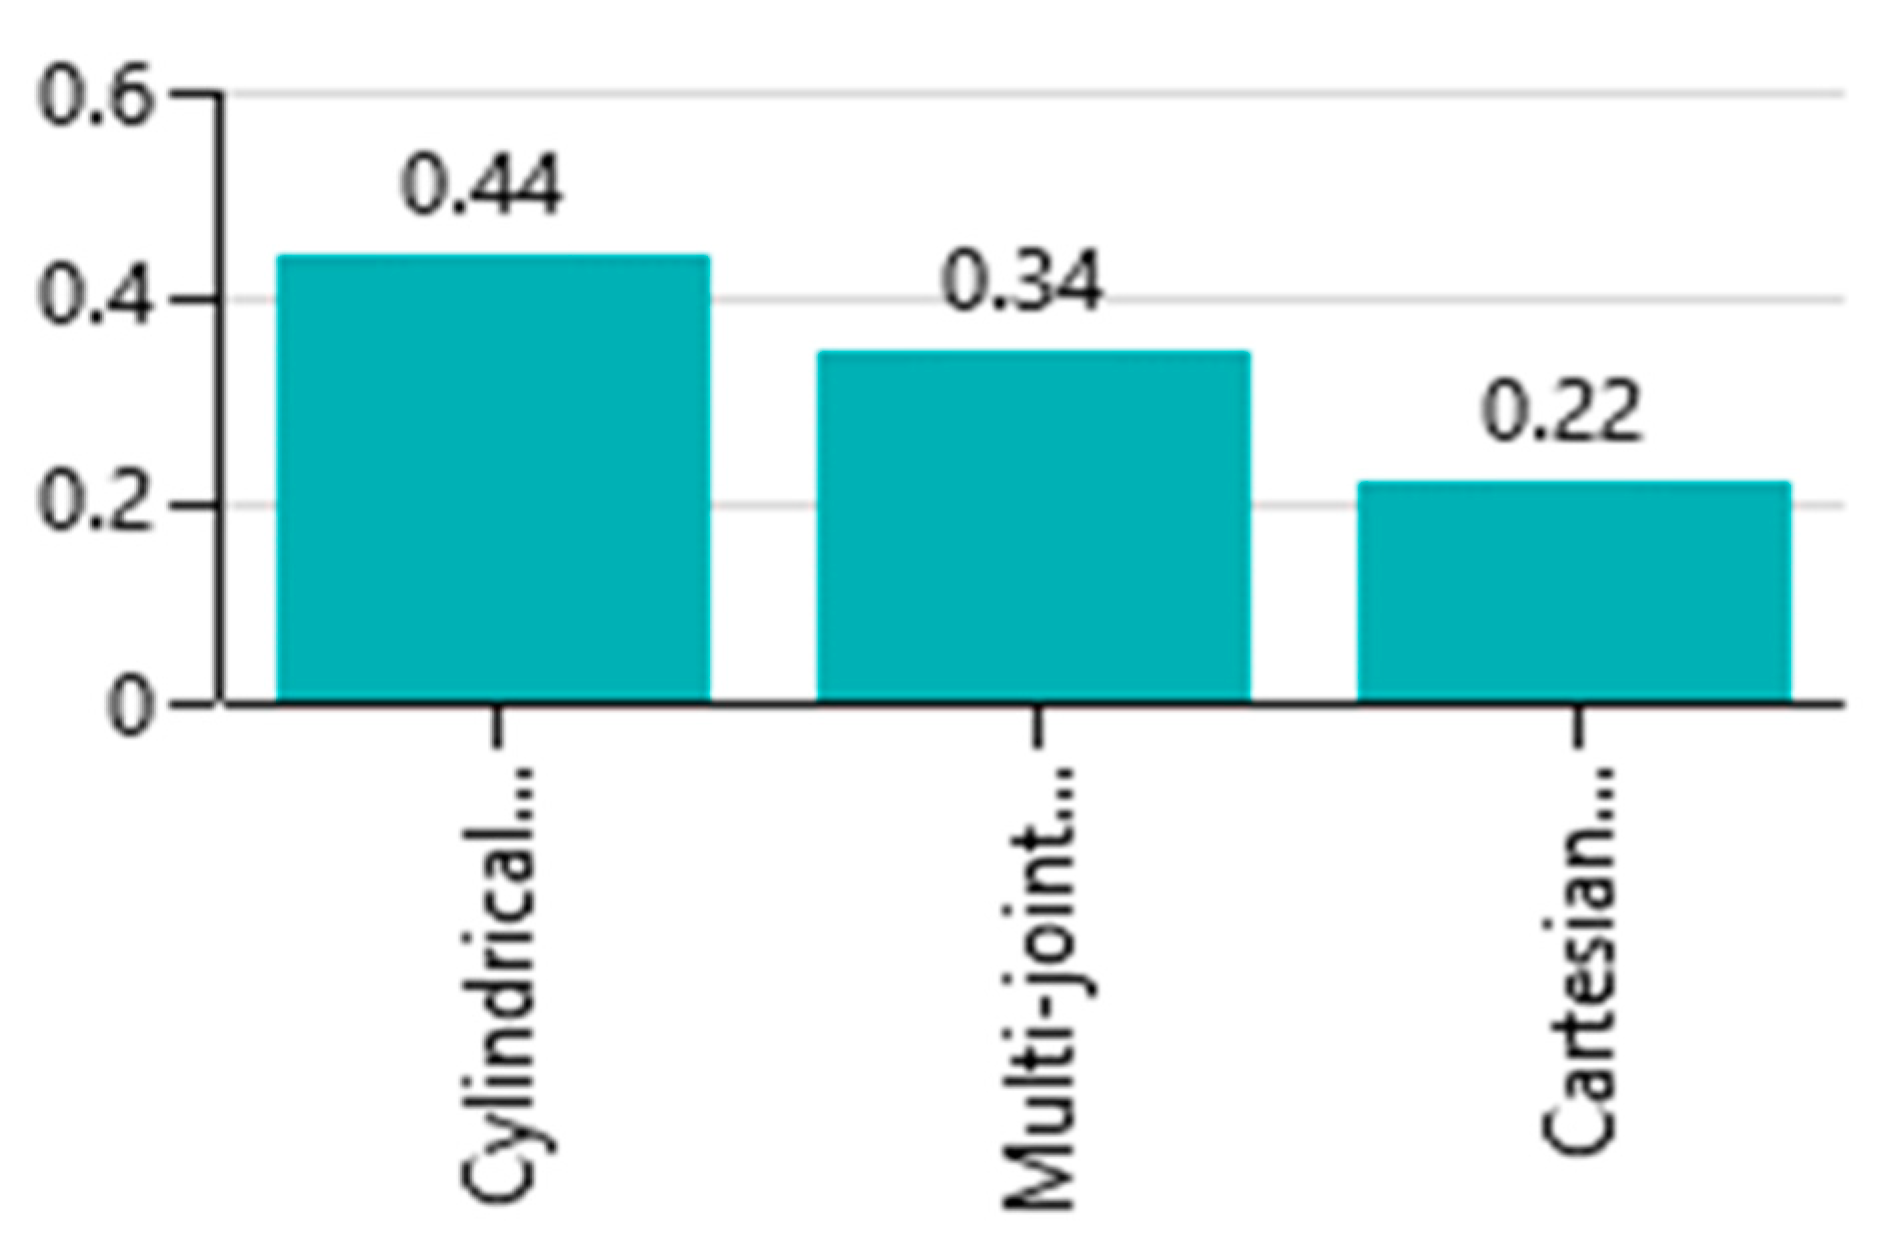
Figure 12b. The final results illustrated in
Table 18 indicate that the cylindrical coordinate robot scored 44%, the multi-joint robot scored 35%, and the cartesian coordinate robot scored 22%. Consequently, based on the prioritization results shown in
Figure 13, a cylindrical coordinate robot is the optimal choice for the handling robot. The detecting module is equipped with a cylindrical coordinate robot that can be positioned flexibly and tailored to the space requirements of various processing workshops.
As a result of the decision-making step from the current practical case:
The development objective (weak point) is simply identified from the organization’s departments, which reduces the development risk and disturbance of the existing systems.
Evaluate the current situation of the uses of the advanced technologies, which brings the organization managers and workers engaged to the current situation and further expected development.
Design and model the intended measurement system, creating the virtual simulation environment that represents the proposed dimensional quality measurement system. This provides basic knowledge about the used Industry 4.0 key technologies, and the intended ideal design in the real world without a huge investment cost, allowing the organization to be able to maneuver freely, whether engaged in Industry 4.0 transition or not.
However, the organization’s decision-making process for the implementation of Industry 4.0 should be completed by the end of this phase. Therefore, an important workshop was held among the different levels of the organization. The virtual simulation environment represents the dimensional quality measurement system for the bearing rig, explaining the expected development and the required uses of technologies. Thus, the results encouraged the organization to agree to continue the Industry 4.0 transition journey.
7. Implementation Step
Based on the proposed strategic approach of Industry 4.0, the organization should move from decision-making to particular development objectives and improvement requirements following the implementation step. Consequently, this section will discuss the physical system construction, installation of hardware and software, and configuration based on Industry 4.0’s key technologies. It moves the Industry 4.0 transition process into practical execution, including the phases of develop, validate, and integrate.
7.1. Develop Phase
Based on the specifications determined in the previous stage, a complete plan has been created for the prototype build. This phase will involve the development of a physical prototype and the corresponding hardware and software requirements. To ensure that the hardware and software requirements were met in an acceptable manner, it is crucial at this point to include all the required resources, skilled personnel, and to find the most cost-effective way after they have been acquired. Therefore, the prototype will be developed based on advanced technologies such as Cyber-Physical Systems and Industrial Internet of Things (IIoT). The dimensional quality measurement system for bearing ring was developed to address the challenge of manual quality measurement processes and improve the bearing companies’ infrastructure based on current Industry 4.0 key technologies. To improve productivity and increase production competitiveness, the automatic measurement processes were designed; firstly, the automatic detection using a two-point detection method a sensors holder mechanism was constructed, which provides a fast measurement and quick calibration and adaptation. To guarantee a fully automatic process without human intervention, a special fixture was developed with a self-lock property to clamp the measured part and, in addition, to accurately position the measured part using the three-jaws method. Furthermore, a cylindrical coordinate robot was developed with a pick and place function to transfer the measured part between the detection modules. The D-H method is used for kinematic analysis to determine the position parameter. For advanced automation, the motion control system was developed based on a programmable logic controller (PLC). To support the control signal and data input and output, software development and device configurations were developed using a TIA PORTAL software platform utilized for control system programming and configuration. The local network was created, and OPC Server software translates the hardware communication protocol into the OPC protocol in order to transmit the obtained data to the host computer. Using LabVIEW, an interactive user interface was constructed. It monitors operation processes and displays measurement results.
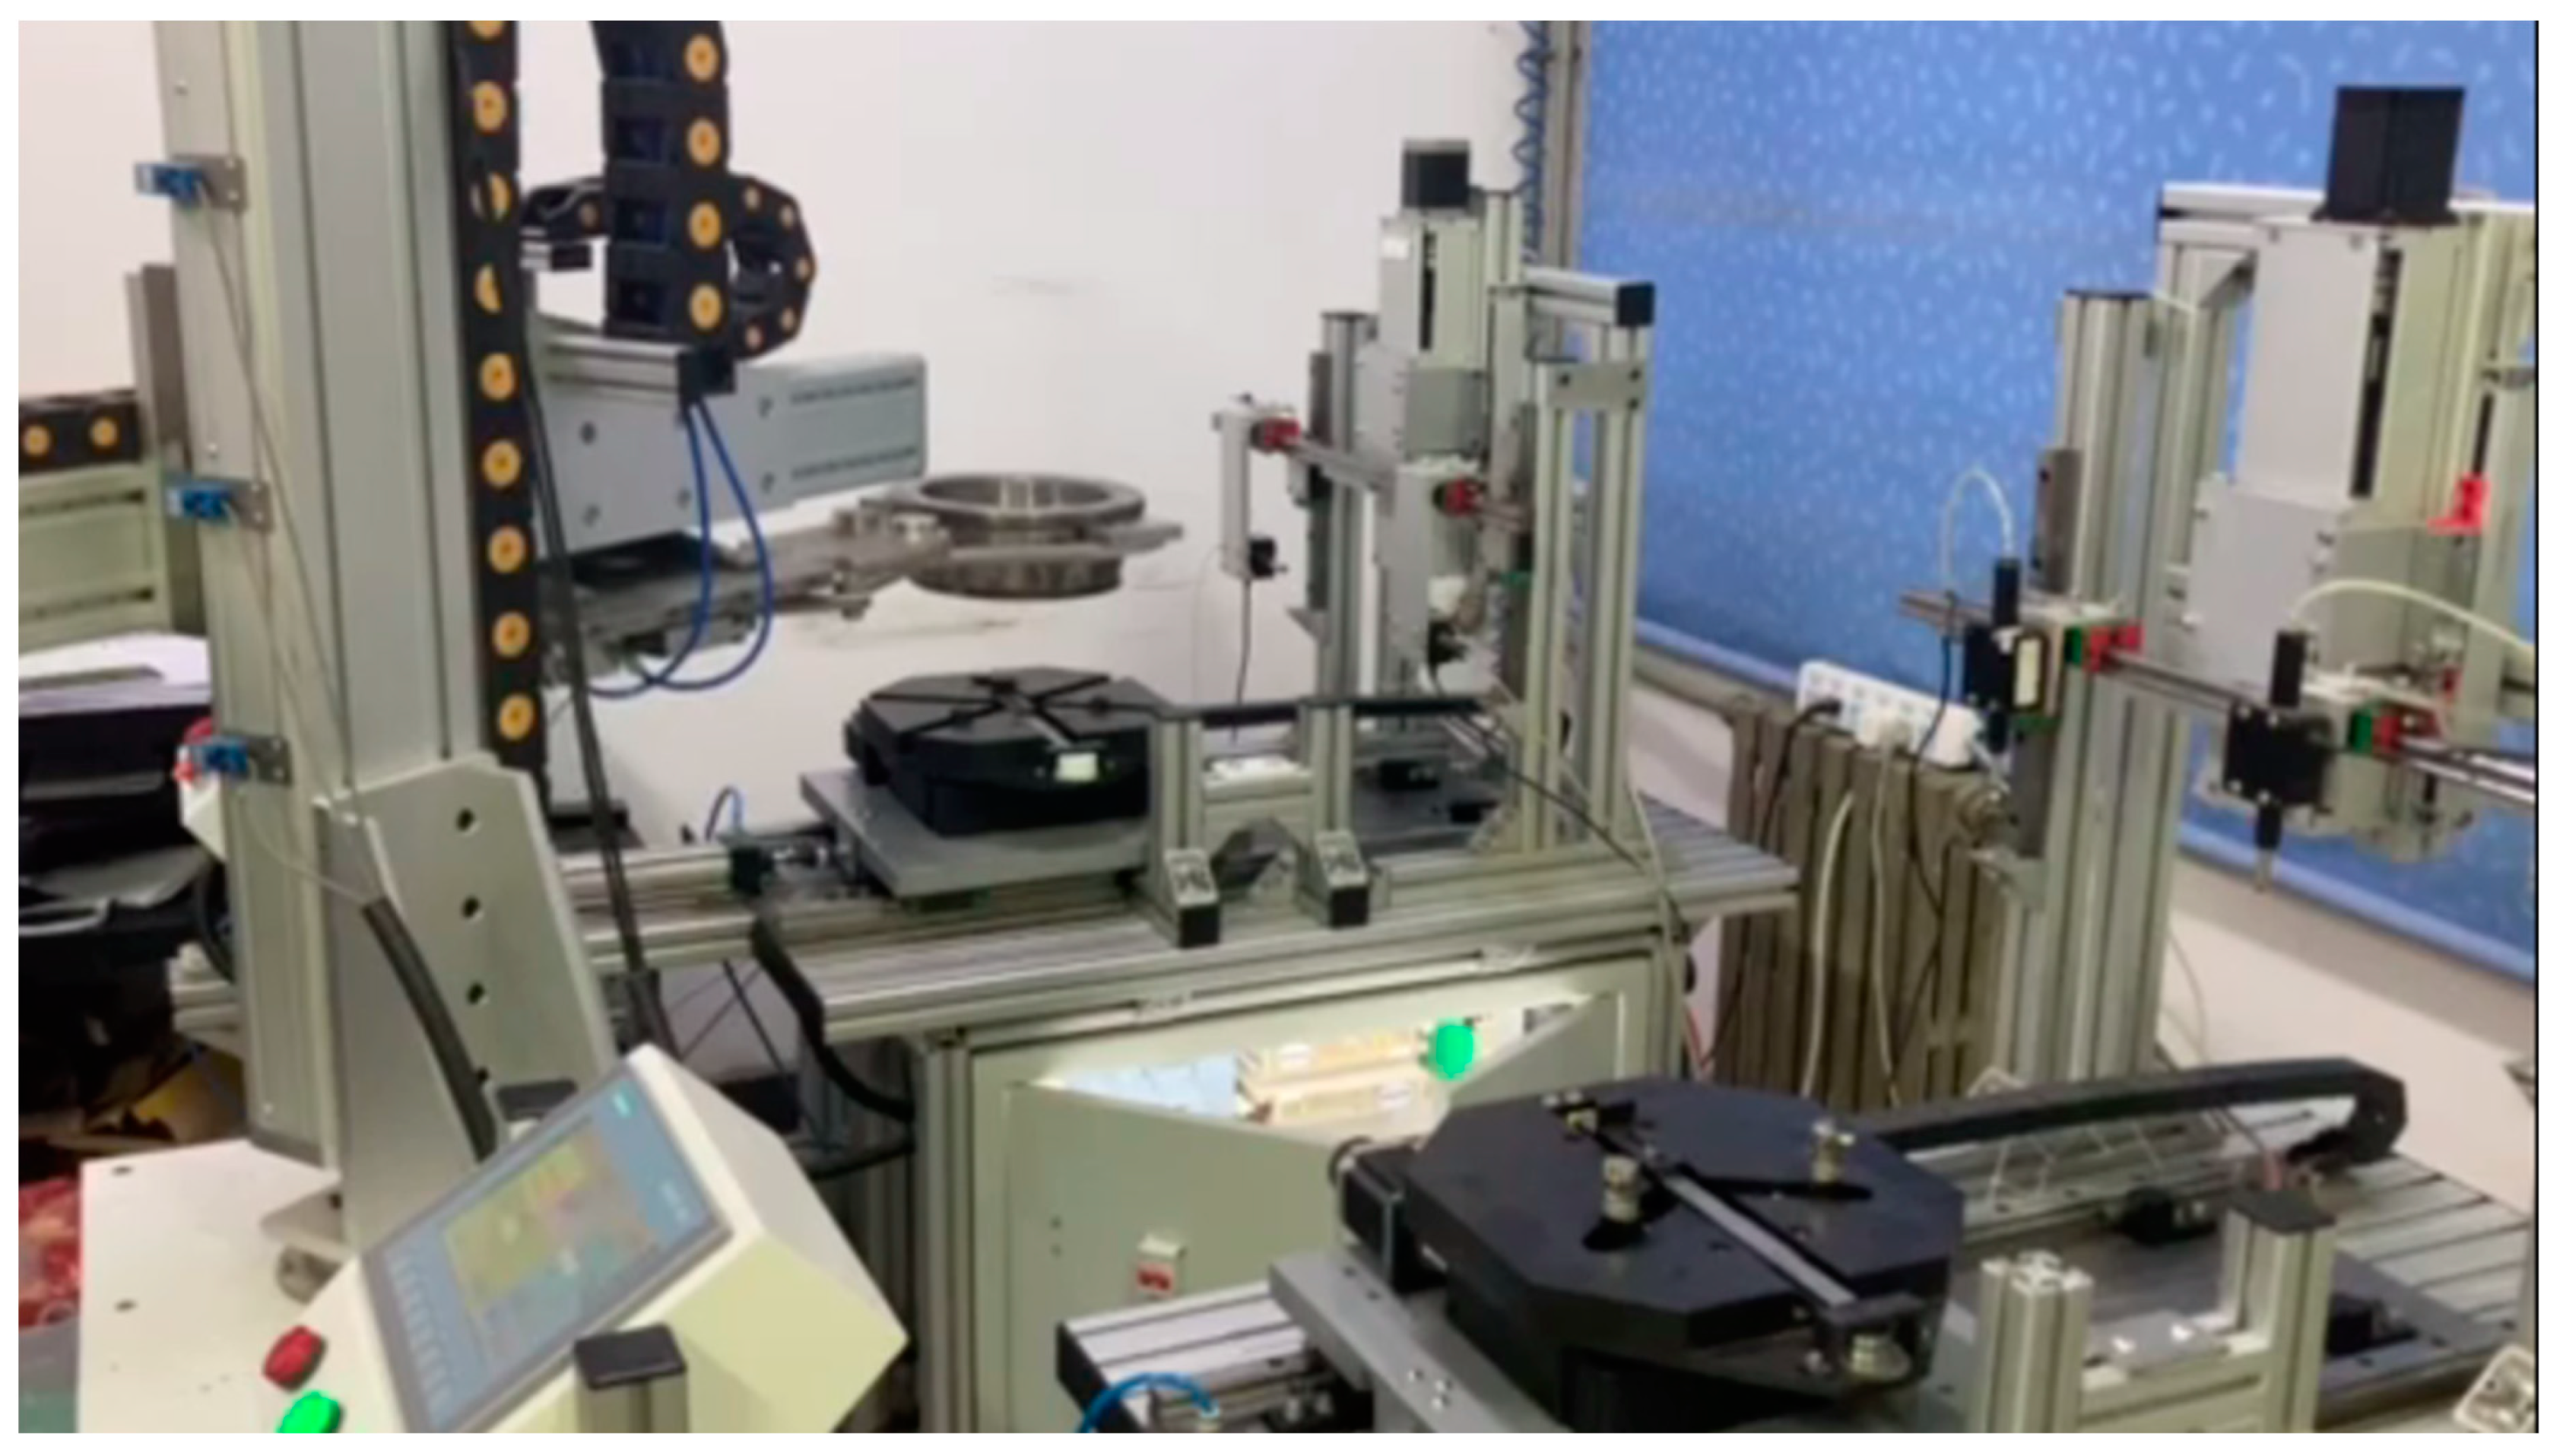
The primary components were carefully selected and assembled as described in the design processes, as shown in
Figure 14. The physical structure of automatic dimensional quality measurement platforms for measuring outer bearing ring diameter was finished.
7.2. Validate Phase
Depending on the prototype’s sophistication, many testing experiments have been run to ensure that all the defined strategies were achieved seamlessly. The benefits of conducting an experiment investigation before full-scale implementation include decreasing the risk of failure, evaluating true performance in controlled real-world experiments, confirming or refuting anticipated results and relationships, testing and validating the benefits of the suggested solutions, validating the measurement systems, identifying additional improvements in either the solution or the launch of the implementation itself, and improving future projections of the benefits of full-scale implementation [
55]. The prototype should be exposed to various inputs and process conditions during the run. The project team should examine any discrepancies between the expected performance and the actual performance after the test run.
The automatic dimensions quality measuring system was built based on the planning, design, and visualization process. Therefore, this section discusses the validate and integration preparation capability in order to finalize the implementation of the Industry 4.0 transition. This section will validate the prototype depending on the designed features. The experiment process is executed several times to investigate the prototype performance and ensure that all the defined properties are achieved before full-scale integration. The validation process’s advantages include reducing the risk of failure, evaluating the actual performance in the real world, and confirming or refuting anticipated results. The automatic dimensional quality measurement system (ADQMS) components have been tested and debugged individually. The primary challenge could be ensuring that each of these components is compatible in order to fulfil their tasks on time. The system is intended to be integrated into an existing product line.
The application of digital twin DT validation is proposed in order to validate the system features, performance, and environments with a high degree of reliability by using the digital space characteristic. The DT is another concept associated with cyber-physical integration. It creates high-fidelity virtual models of physical objects in virtual space to simulate their behaviors in the real world and provide feedback [
56], and synchronizes the digital and physical worlds in order to provide closed-loop control of a product or system [
57].
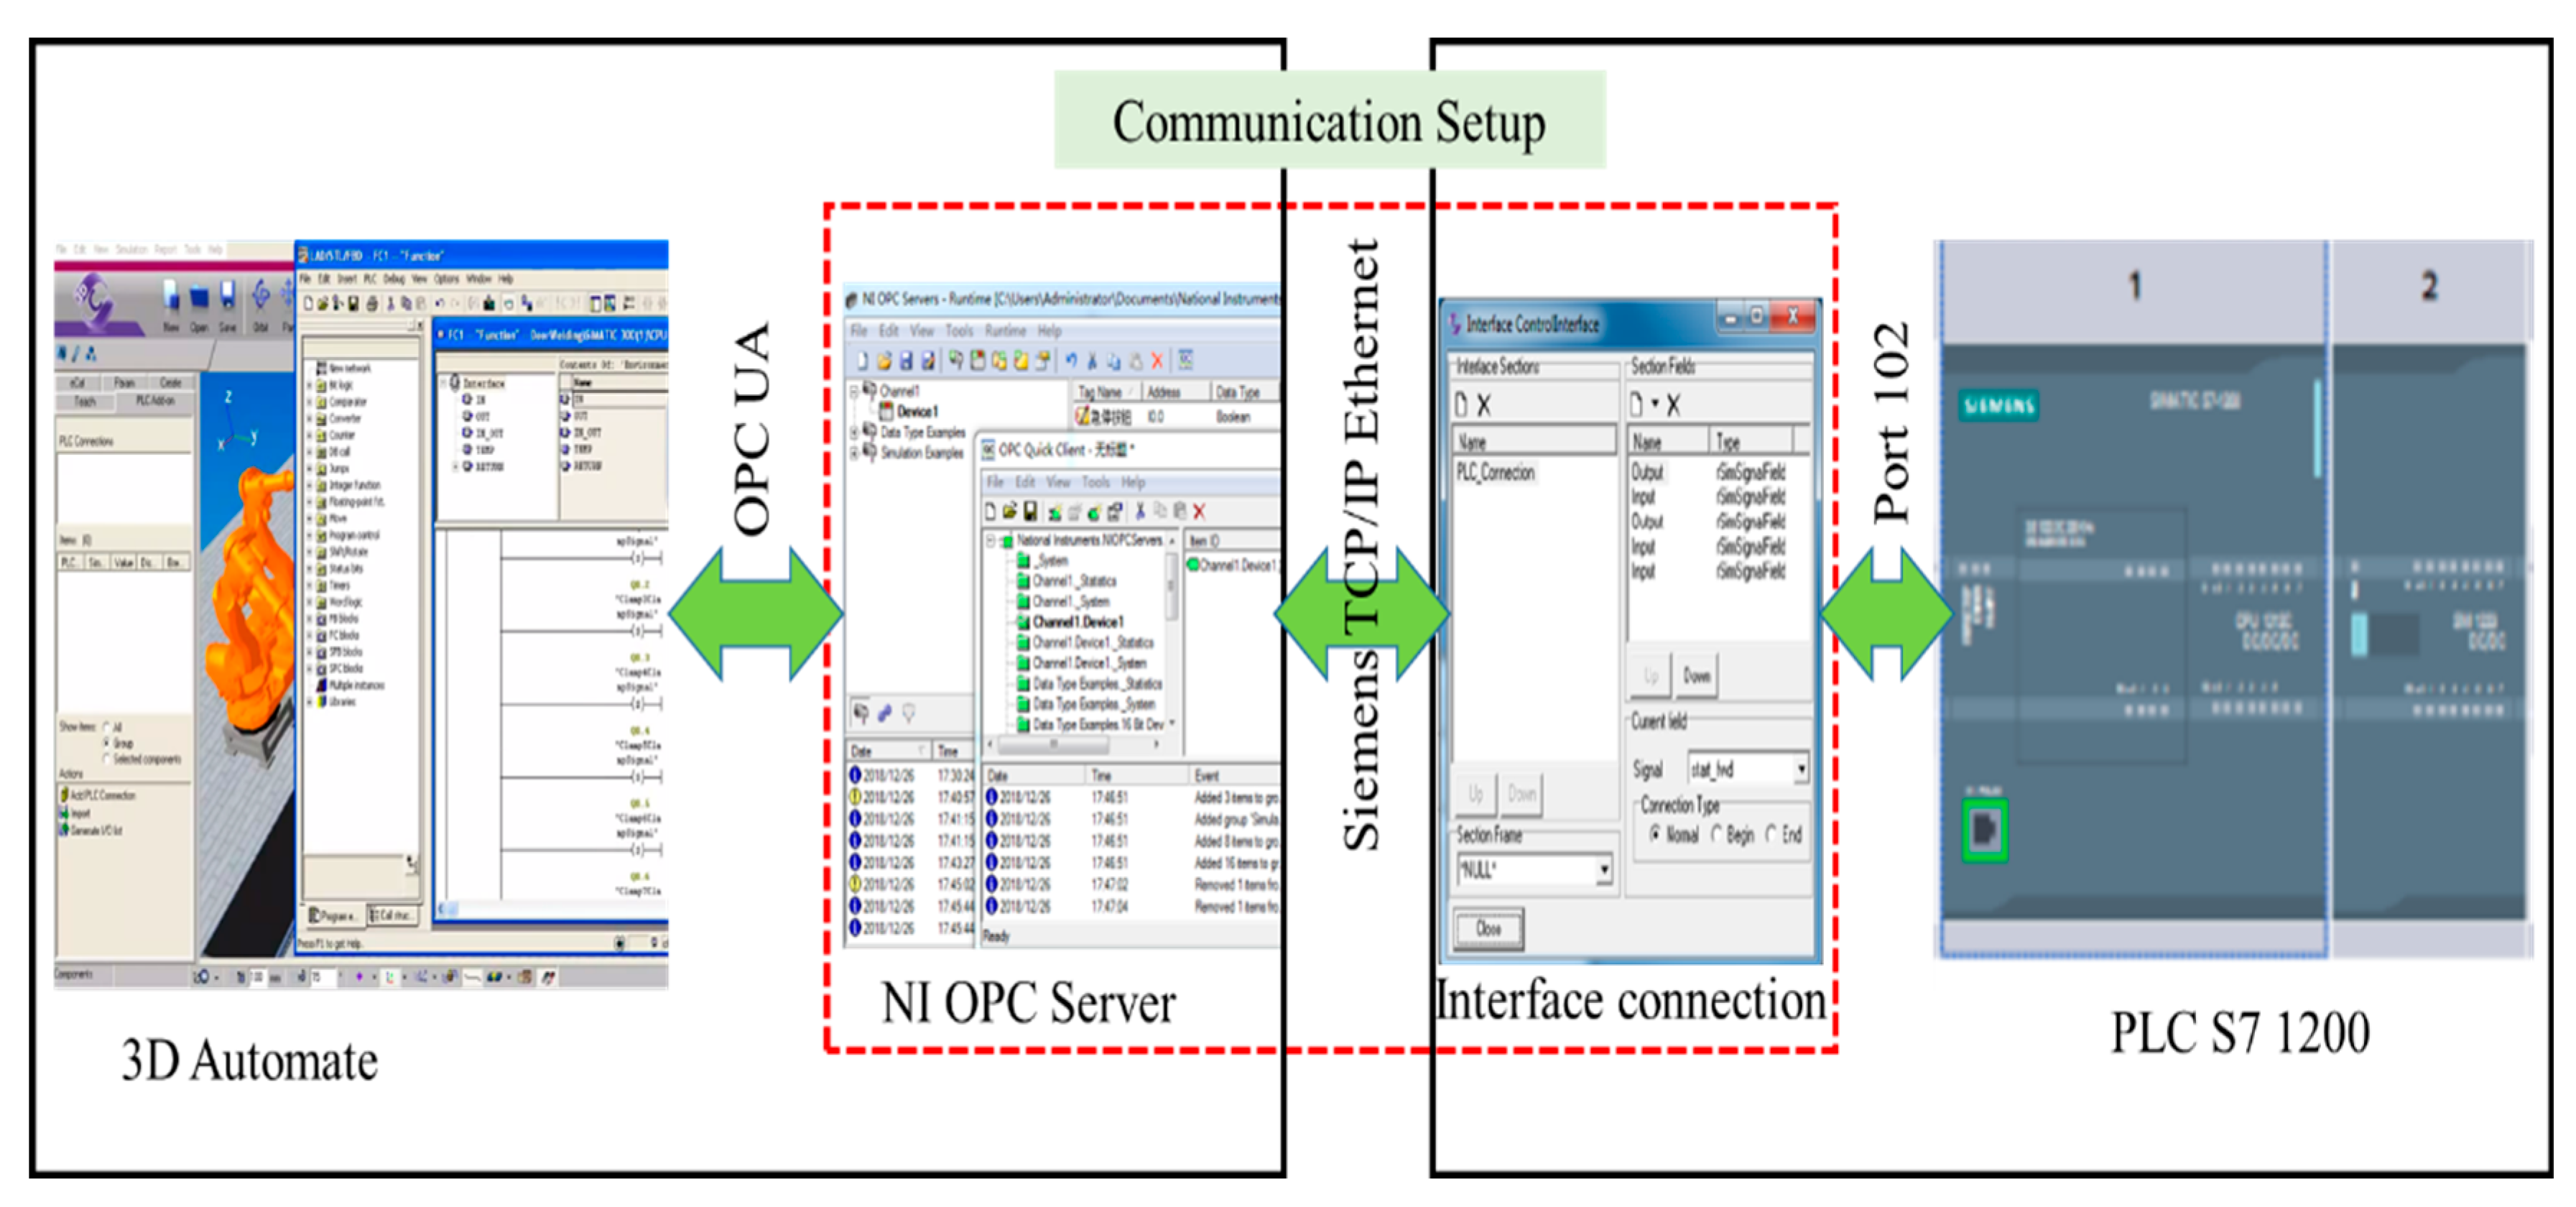
In this stage, we will use the virtual simulation environment created in the visualize phase as a virtual world, and the recently constructed system as the physical world. The virtual environment was created using 3D Automate software, which uses different types of signals to control the component’s movement, and Python script language is used for the programming. This indicates that the virtual system can read and write signals.
3DAutomate uses the PLC Add-On feature for network connection configuration. The PLC Add-on enables hardware- or software-based programmable logic controllers (PLCs) to control simulated machines in real time through a standard OPC connection or PLC vendor-specific interfaces.
Figure 15 shows the communication setup between 3D Automate and PLC.
As discussed, the planned automatic dimensional quality measurement system consists of two CNC Lathe machines, three handling robots, four conveyor belts, and three detection platforms.
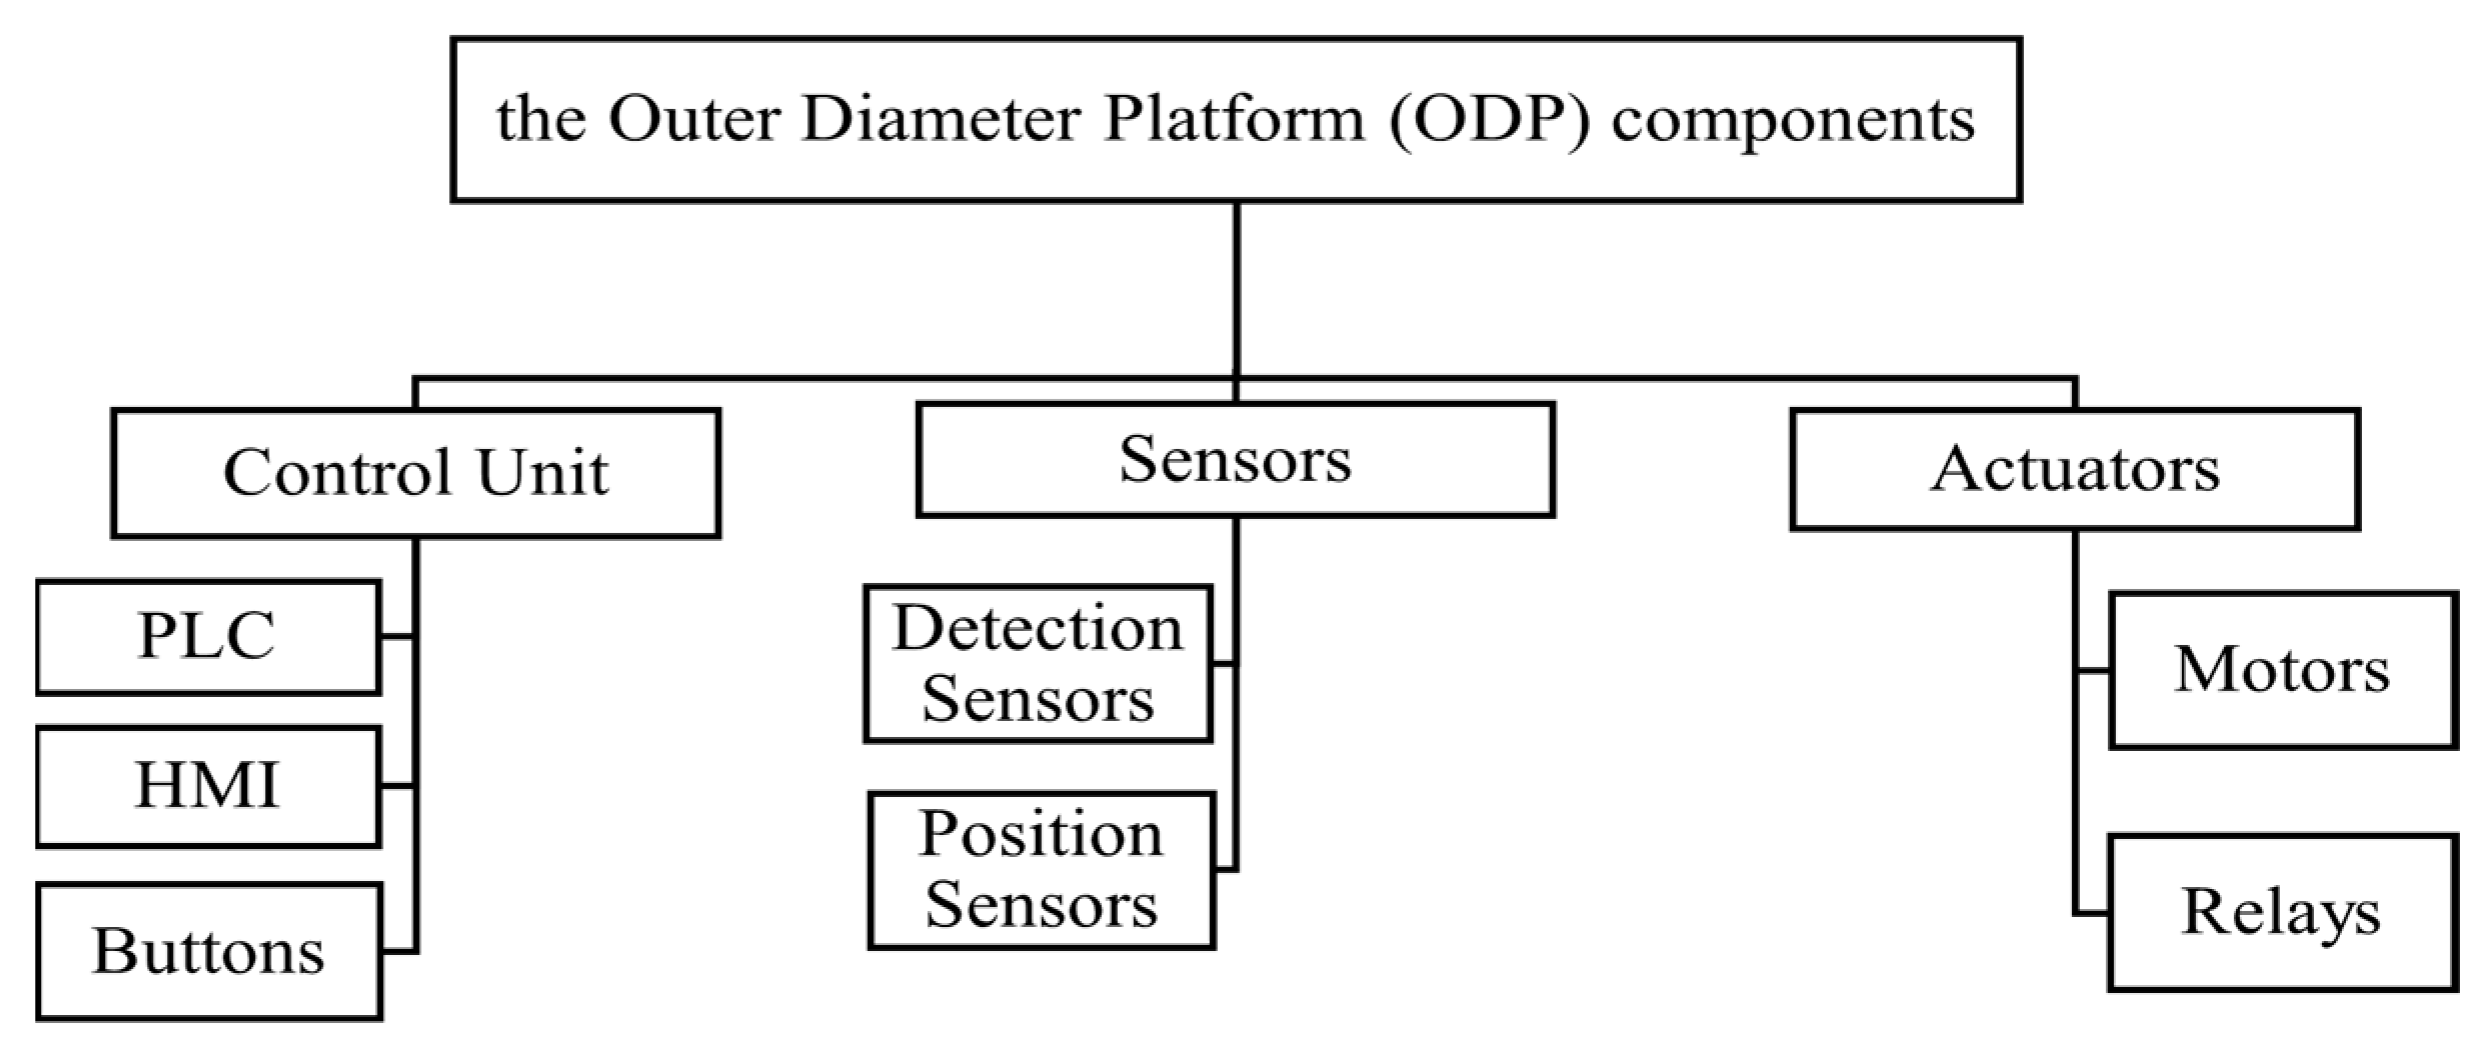
The virtual machines were set based on the production plan consideration of “One hundred pieces per shift”, determining another consideration factor, i.e., if a worker produces 100 parts during an 8 h shift, it may be estimated that each part requires 4.8 min of processing time. According to this production cycle, the automatic inspection cycle of the bearing ring should not be more than 4.5 min for a full inspection of the bearing parts. As demonstrated in
Figure 16, the validation process specifies the Outer Diameter Platform (ODP) components as a connection sample.
The testing process was done to debug the control program and optimize the system performance. The motor’s motion was regulated and set down. As a result, all components have been validated properly, and the optimal performance time for ODP is 4.5 min, while the maximum designed time is 4.8 min. The micrometer measures the outer diameter parameters of the section circles at A, B, C, and D of the bearing ring, and four sets of measurement data can be obtained correspondingly, and each set of measurement data can be obtained, containing 968 measurements.
7.3. Integrate Phase
Integration is a type of strategy for business expansion. Integration can occur horizontally or vertically. Horizontal integration typically involves the merger of similar companies, whereas vertical integration typically involves the merger of different companies that produce a similar product [
58]. After the components and performance of the Automatic Quality Measurement System have been successfully validated, the system should be fully integrated. Therefore, horizontal integration is utilized to merge the developed prototypes into the existing production line, which allows the system to acquire the attribute of advanced Industry 4.0 technologies.
For future improvements, the study considers merging the developed system with other departments within the company and other businesses, where the industrial Internet of Things IIoT is recommended based on vertical integration. The IIoT emphasizes the interconnections between items via physical addresses, whether they are industrial or civilian in nature [
59,
60].
Currently, the system uses host-PC as its data centre, connected with the developed of a suitable local network with improvement capability. Thus, the future planning data center should be replaced with a cloud computing technology. A wireless drive that is compatible with LabView and the Infrared Data Association protocol (IrDA) will be utilized to send data across the network.
8. Discussion
The study aims to improve production efficiency, quality, and global competitiveness, therefore, a new decision-making and implementation approach (DM&I) is proposed to provide basic knowledge about Industry 4.0, as well as a flexible solution to enable the progressive implementation and sufficient sources to upgrade the existing manufacturing systems toward Industry 4.0. The DM&I approach is divided into two steps. Decision-making consists of a define phase and determines the exact system’s weak point to reduce the improvement risk and system operation disturbance. The weak point represents the point that needs to be improved after analyzing the existing system operation efficiency. In recent cases, the analysis results of the bearing ring is recommended to improve the quality measurement process. The evaluate phase determines the level of use of key technologies. The total score for the maturity level is 1.9 out of 5, which indicates “low or No degree of implementation”, which means all identified technologies should be considered in the design process. The visualize phase in the proposed approach relies on design and modeling, and virtual simulation key technologies. A fully automatic dimensional quality measurement system has been designed, and the virtual simulation environment has been created, which provides the product flow process for the entire system in the real world. This will support the improvement of decision-making and avoid the fear of high costs. The optimize phase goes through multiple rounds to provide the optimal design. Establishing the criteria for selecting the handling robot, the results indicate that the cylindrical coordinate robot scored 44%, the multi-joint robot scored 35%, and the cartesian coordinate robot scored 22%. Consequently, based on the prioritization results, a cylindrical coordinate robot is the optimal choice for the handling robot. However, the virtual simulation environment represents the dimensional quality measurement system for the bearing rig, explaining the expected development and the required uses of technologies.
The implementation step supports the organization’s infrastructure improvement, which consists of the develop phase, the stage of building the physical system and hardware software development. The primary components were carefully selected and assembled as described in the design processes. In the validate phase, the benefits of conducting an experiment investigation before full-scale implementation include decreasing the risk of failure, evaluating true performance in controlled, real-world experiments, and confirming or refuting anticipated results and relationships. Consequently, all components have been adequately validated, and the optimal performance time for ODP is 4.5 min, whereas the maximum designed time is 4.8 min. The micrometer measures the outer diameter parameters of the section circles at A, B, C, and D of the bearing ring, and each set of measurement data could be obtained, containing 968 measurements. The terms of full-scale integration with the existing system constitute the integrate phase.
9. Conclusions
The DM&I approach is developed as a practical strategic approach based on barriers analysis using the literature reviews from various countries. The barrier “the lack of financial resources (B3)” scored the highest weight of 0.3800, indicating that the enterprises expect higher investment, and the second ranked barrier is the lack of skilled workers highest weight of 0.2456. The third ranking is the lack of infrastructure. The high rank of these barriers indicates that the bearing manufacturing companies will face this serious hurdle during the adaptation to the latest Industry 4.0. Therefore, the decision-making and implementation approach (DM&I) is proposed to defeat the basic implementation barriers and provide a flexible solution to allow a gradual implementation. The decision-making step is designed to reduce the development risk and disturbance of the existing systems by identifying the objective (weak point), bringing the organization managers and workers engaged in evaluating the current situation and further expected development. Using modeling and simulation technologies to design the intended measurement system and create a virtual simulation environment provides basic knowledge about the used Industry 4.0 key technologies and represents the intended ideal design in the real world without a huge investment cost. In general, the decision-making step allows the organization to be able to maneuver freely, whether engaged in an Industry 4.0 transition or not. The implementation step describes the practical execution for Industry 4.0 implementation and improves the basic infrastructure. Cyber-physical technology is adapted to build a physical construction model and hardware and software configuration. The digital twin and industrial Internet of Things technologies are proposed to validate the system and integrate it into the existing system.
However, the new proposed DM&I approach provides the perfect guidance for industrial companies adopting Industry 4.0 technologies in their improvement processes.


