Article

Fracture Patterns of Rocks Observed under Cryogenic Conditions Using Cryo-Scanning Electron Microscopy

1
China United Coalbed Methane Corporation Ltd., Beijing 100015, China
2
Provincial Center of Technology Innovation for Coal Measure Gas Co-Production, Taiyuan 030082, China
3
National Key Laboratory of Petroleum Resources and Engineering, China University of Petroleum, Beijing 102249, China
*
Author to whom correspondence should be addressed.
Processes 2023, 11(7), 2038; https://doi.org/10.3390/pr11072038
Submission received: 2 June 2023 / Revised: 28 June 2023 / Accepted: 5 July 2023 / Published: 7 July 2023

Abstract

:
Cryogenic fracturing, which uses liquid nitrogen (LN2) as a fracturing fluid, is a waterless fracturing method. However, previous attempts to investigate the fracture morphology of rocks after LN2 quenching have been mainly based on standard scanning electron microscopy (SEM) analysis at room temperature. This can be problematic since thermally-induced fractures created by temperature difference tend to close as a sample warms and thermal stress relaxes. To address this issue, we established a novel approach employing Cryo-scanning electron microscopy (Cryo-SEM) to investigate the fracture patterns induced by liquid nitrogen quenching under cryogenic conditions. This method can achieve in-situ visualization of fractures and pores with a nano-scale resolution at −190 °C. X-ray computed tomography (CT) is also employed to illustrate the fracture distribution inside samples. Cryo-SEM and standard SEM are compared, and statistical assessments are conducted to quantify fracture aperture size and closure scale. The results demonstrate that Cryo-SEM can more accurately preserve native fracture morphology and provide a more accurate means of evaluating fracture scales generated during LN2 quenching, particularly at higher temperature differences between rock and liquid nitrogen. Distinct fracture patterns and fracture width are observed for various rock types (i.e., coal, sandstone, shale, granite) by using these methods. More prominently, the maximum fracture width of coal, sandstone, shale and granite were 89.17 µm, 1.29 µm, 0.028 µm and 2.12 µm when the temperature difference between LN2 and rock samples were 296 °C. LN2 is shown to exhibit superior fracturing efficiency on coal and granite, characterized by complex fracture networks with branched fractures. This research contributes to our understanding of liquid nitrogen fracturing mechanisms and may offer effective approaches for unconventional reservoirs stimulation.

1. Introduction

Hydraulic fracturing is widely used in the exploitation of unconventional resources and geothermal energy [1,2]. Nonetheless, the utilization of extensive water-based fracturing fluids in hydraulic fracturing presents certain obstacles, notably, high water consumption, formation damage, treatment and disposal issues of flowback water [3]. The water-related challenges associated with hydraulic fracturing may be potentially addressed by utilizing unconventional fracturing fluids such as liquefied natural gases (LNG), liquid nitrogen (LN2), liquid/supercritical carbon dioxides (LCO2/SC-CO2) and liquefied petroleum gases (LPG) for the purpose of waterless fracturing [4,5,6,7]. Specifically, LN2 is a kind of cryogenic fluid (−196 °C at atmospheric pressure), which can exert a sharp thermal gradient when it is injected into the much warmer reservoir rocks [7,8,9]. Then, thermal stress could be induced. When thermal stress is higher than the rock tensile strength, fractures will be initiated and extended further by nitrogen volume expansion because of LN2 phase transition [9,10]. Due to the coupled hydraulic/thermal loadings, breakdown pressure can be reduced and complex fracture networks could be formed [7,11,12,13,14]. In addition, field tests have demonstrated the effectiveness of using liquid nitrogen (LN2) as a fracturing fluid in increasing production rates in several coalbed methane (CBM) wells, while simultaneously reducing pollution of the coal seam in CBM reservoirs [15,16]. Recently, researchers also proposed cryogenic fracturing in deep geothermal reservoirs, especially the hot dry rock (HDR) geothermal resources due to the significant temperature difference (>400 °C) between high-temperature rocks and LN2 [17,18,19,20].
Because of the above advantages, various studies have focused on the fracturing mechanism of LN2 fracturing. Elucidating the LN2 cryogenic effect on rock structure change is critical for evaluating the permeability evolution and fracturing efficiency. Previous attempts have investigated the pore structure change and fracture network distribution after LN2 freezing by means of Nuclear Magnetic Resonance (NMR), Scanning Electron Microscopy (SEM), Computed Tomography (CT), etc. Cai et al. [21] examined the pore structure change for sandstone, marble and shale samples after LN2 cooling by using SEM and NMR. Their results indicated that LN2 cooling could cause an increase in the pore scale due to the appearance of micro-fissures and macro-cracks. Qin et al. [22] studied the LN2 freeze-thaw cyclic treatment effect on coal samples. They found that the length and width of thermally generated cracks increased with the number of freeze-thaw cycles, and the maximum crack width was 60.5 µm when the sample was subjected to 30 freeze-thaw cycles based on SEM analysis. Wu et al. [23] studied the effect of cyclic heating/LN2 cooling treatment on physical/mechanical properties of rocks, and intra-granular or inter-granular cracks were observed on sample surfaces from SEM images. Akhondzadeh et al. [24] investigated LN2 fracturing of a bituminous coal at pore scale through 3D X-ray micro-CT, and concluded that LN2 freezing could enhance the pore network connectivity by creating fractures and connecting the pre-existing cleats. Additionally, the maximum fracture aperture size was up to 9 µm on sample surfaces based on SEM images. Yan et al. [25] explored cyclic LN2 quenching effects on coal samples by high-resolution X-ray micro-CT and suggested that porosity of the sample, fracture volume, fracture thickness and fracture connectivity increased significantly with the growth of LN2 quenching cycle times. The 3D visualization also showed that the proportion of relatively small fracture volume decreased and the proportion of relatively large fracture volume increased with LN2 quenching cycle times. Zhang et al. [26] investigated the microstructure and permeability evolution behavior of coal after LN2 treatment based on 3D X-ray microanalyzer (3D-XRM) and a steady-state gas seepage method. They showed that the number and size of pores, throats and fractures after LN2 treatment were significantly higher than those were before, the results of which corelated well with the increment of coal permeability.
The above-mentioned work provided valuable knowledge regarding the fracture morphology and size of rocks subjected to LN2. Currently, our understanding of thermally-induced fractures is limited to ensemble studies using indirect imaging techniques such as 3D-XRM or standard SEM at room temperature. However, thermally-induced fractures formed by temperature difference tend to close as a sample warms and thermal stress relaxes [9]. To address these challenges, a cryo-transfer method inspired from structural material and biology science, known as Cryogenic transmission electron microscopy (Cryo-EM) or Cryogenic scanning electron microscopy (Cryo-SEM), has been developed to enable the high-resolution imaging of samples at −190 °C [27,28]. This method includes sample preparation schemes that safeguard rock samples against environmental exposure and maintain their natural state. Cryo-EM was awarded the Nobel Prize in Chemistry in 2017 for its profound impact on the field of structural biology by freezing and stabilizing fragile biomolecules for near atomic-resolution imaging in their native states [29,30,31]. In addition to its impact on life science, Cryo-EM and Cryo-SEM have also been used in material science since the 1990s. Pioneers of this technology have made significant contributions in areas such as batteries, soft polymers, metal-organic frameworks, perovskite solar cells, electrocatalysts and quantum materials [32,33,34,35,36,37]. In particular, Li et al. [38] combined Cryo-EM, Cryo-analytical TEM and Cryo-SEM to discover individual Li metal atomic structures which are sensitive to electron beam irradiation or air exposure at room temperature during sample transfer into the conventional TEM column, thus establishing an ideal tool for sensitive batteries’ nanoscale characterization. In the petroleum industry, Cryo-SEM was first introduced to investigate reservoir wettability in the 1990s [36,39,40]. Desbois et al. [41] used Cryo-BIB-SEM to investigate the in-situ distribution of pore fluids in cryogenic preserved samples on Ar-ion polished cross sections. Schmatz et al. [42] used Cryo-BIB-SEM to study the micro- to nano-scale in-situ-fluid distribution in oil/brine-filled reservoir carbonates by quenching fluid-filled samples in LN2, which aims to study the effect of chemical variations in the flooding brine on wettability during enhanced oil recovery (EOR).
The use of Cryo-SEM has allowed researchers to investigate in-situ fracture morphology and quantify pore and fracture sizes resulting from LN2 quenching treatment. In this study, four types of rock specimens were selected: coal, sandstone, shale and granite. Prior to cryogenic imaging, the specimens underwent an initial scanning process using a standard SEM at room temperature to allow for comparison with the pre-LN2 treatment state. Cryo-SEM was then used to assess fracture patterns on the rock surface at cryogenic temperatures, as the cryo-transfer method preserves fractures that were initiated by the sudden and intense thermal shock during the plunge freezing process. X-ray CT was also utilized to analyze the distribution of fractures within each specimen. Finally, statistical assessments were conducted on the size of the fracture aperture to quantify the disparities between the results obtained from Cryo-SEM and conventional SEM, as well as to quantify the degree of fracture closure. The findings of this study provide a feasible and direct method to visualize and quantify the fracture patterns of rocks resulting from LN2 quenching treatment.

2. Materials and Methods

2.1. Measurements

In this paper, we present three types of measurements, standard SEM, Cryo-SEM and 3D X-ray Computed Tomography (CT) (Table 1). We used four types of outcrop rocks: coal, sandstone, shale and granite. These four rock samples are the main rock types of coalbed methane, tight oil/gas, shale gas and HDR geothermal reservoirs, respectively. Initially, we performed dry measurements with standard SEM at room temperature (25 °C) to characterize the dry-rock properties such as porosity, cracks and surface characteristics. To simulate the conditions of different reservoirs, rock samples were heated to various initial temperatures based on the conventional pay zone depth of each reservoir. Coal samples were tested for considerations of LN2 fracturing conducted in coalbed methane reservoirs at initial temperatures ranging from 25 °C to 100 °C. Sandstone samples were measured as a reference for LN2 fracturing employed in tight oil/gas reservoirs at initial temperatures ranging from 25 °C to 200 °C. Shale samples were assessed for considerations of LN2 fracturing applied in shale gas reservoirs at initial temperatures ranging from 25 °C to 350 °C. Granite samples were tested as a reference for LN2 fracturing used in HDR geothermal reservoirs at initial temperatures ranging from 25 °C to 350 °C. Subsequently, rock samples were quenched by LN2 and the temperature decreased sharply. Then, Cryo-SEM were conducted to identify the fractures distribution on rock samples induced by LN2 thermal shock. The Cryo-SEM process will be explained in more detail in the following paragraphs. To make up for the shortcomings of SEM or Cryo-SEM that can only display 2D images, X-ray CT (nanoVoxel-3000, resolution of 0.5μm) tests were carried out to display fractures and fracture planes in a 3D view at room temperature. Specifically, X-ray CT is a non-invasive technique that involves the use of X-ray beams to capture images of the internal structure of the rock sample. The 2D images obtained from the CT scan reveal valuable information about the rock sample’s porosity, fractures, mineral composition, and grain size distribution. Subsequently, 3D fracture morphology of fractured rock samples can be obtained through a series of image enhancement techniques including filtering and denoising, threshold segmentation and 3D reconstruction based on 2D images. Since more obvious alterations had been observed on the surfaces of coal and granite samples in 2D, the coal sample with initial temperature of 100 °C and the granite sample with initial temperature of 350 °C were selected for X-ray CT scan. Finally, SEM images were taken when the above rock samples returned to room temperature. Histograms for the frequency of fracture-width sizes were displayed and compared with Cryo-SEM results.

2.2. Sample Preparation

The rock specimens were sliced into lamina measuring 8 mm × 8 mm × 2 mm. To create a flat and even cross-section, the specimen surface was bombarded with Ar-ions. X-ray diffraction (XRD) analysis was performed prior to the tests to identify the mineral components of the rock samples (Figure 1). For coal rock, clay mineral content is the highest, accounting for 91%. For sandstone and shale, the quartz content is the highest, reaching 88% and 63%, respectively. It is noteworthy that the mineral composition of granite is more intricate, with K-feldspar, plagioclase and quartz comprising 20%, 22% and 25%, respectively.

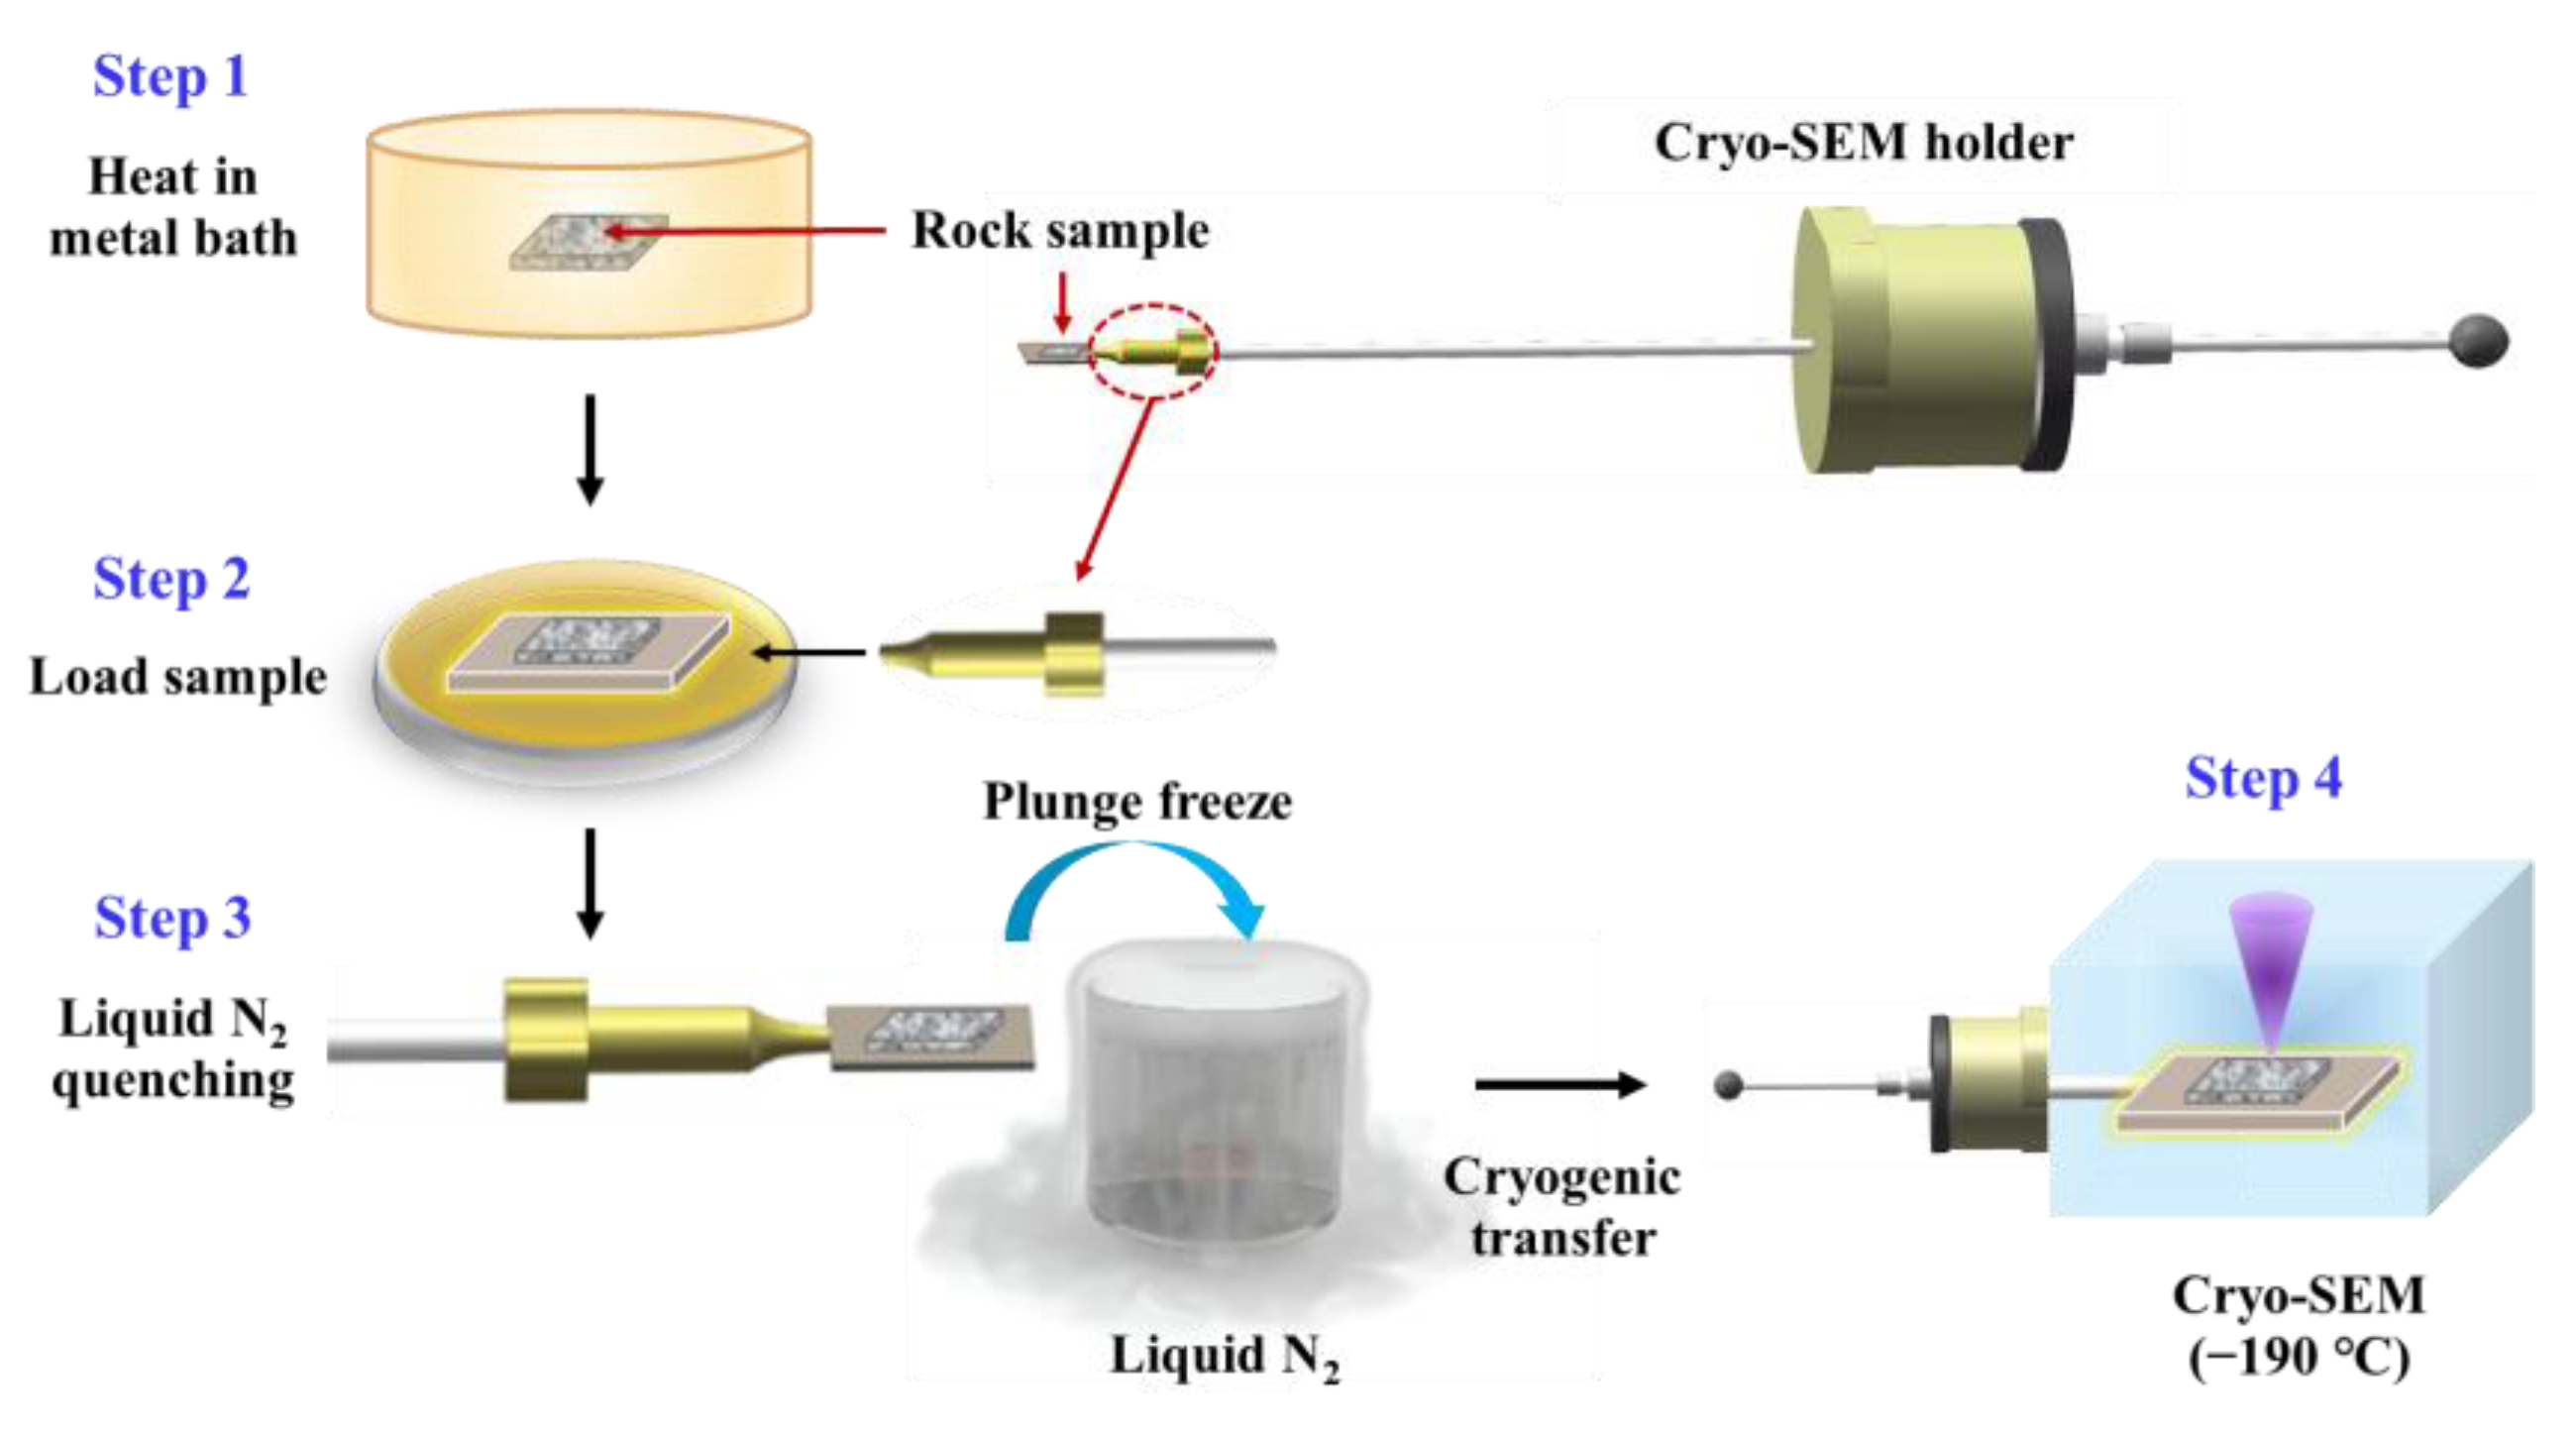
2.3. Cryo-SEM Methodology

A sketch illustrating the Cryo-SEM method can be found in Figure 2. The specific observation process can be divided into the following four steps: (1) Step 1: the rock specimens were subjected to a high-temperature metal bath for 30 min to 60 min to reach the setting temperature as shown in Table 1. Each rock sample had dimensions of 8 mm × 8 mm × 2 mm, with a surface that was polished to achieve a roughness index (Ra) of 0.008 µm to 0.012 µm. (2) Step 2: after the rock sample was heated evenly, it was taken out directly and assembled onto a sample holder quickly by using conductive adhesive. (3) Step 3: the sample were immersed entirely in LN2 for an additional 20 min to initiate fractures through thermal shock. (4) Step 4: the specimen along with its holder was transferred under cryogenic conditions using a LN2-cooled vacuum shuttle into the Cryo-SEM (FEI Helios 600i Nanolab FIB/SEM equipped with PP3000T cryo preparation system from the Institute of Biophysics, Chinese Academy of Sciences, Beijing, China), preserving the fractures [43]. Then, the rock samples were subjected to a vacuum, sublimation, and freezing process, after which they were coated within the freezer chamber. The coating involved the application of metal powders such as gold and platinum onto the rock surface. This process serves to enhance the sample’s electrical conductivity, minimize the thermal effects of plasma on the sample, reduce ion bombardment damage, and improve the outcome of scanning electron microscope observations. Subsequently, the fracture morphology on the sample surface were imaged and analyzed at random locations and different magnifications due to the wide range of fracture sizes.

3. Results and Discussion

3.1. Fracture Morphology in Cryogenic Conditions through Cryo-SEM
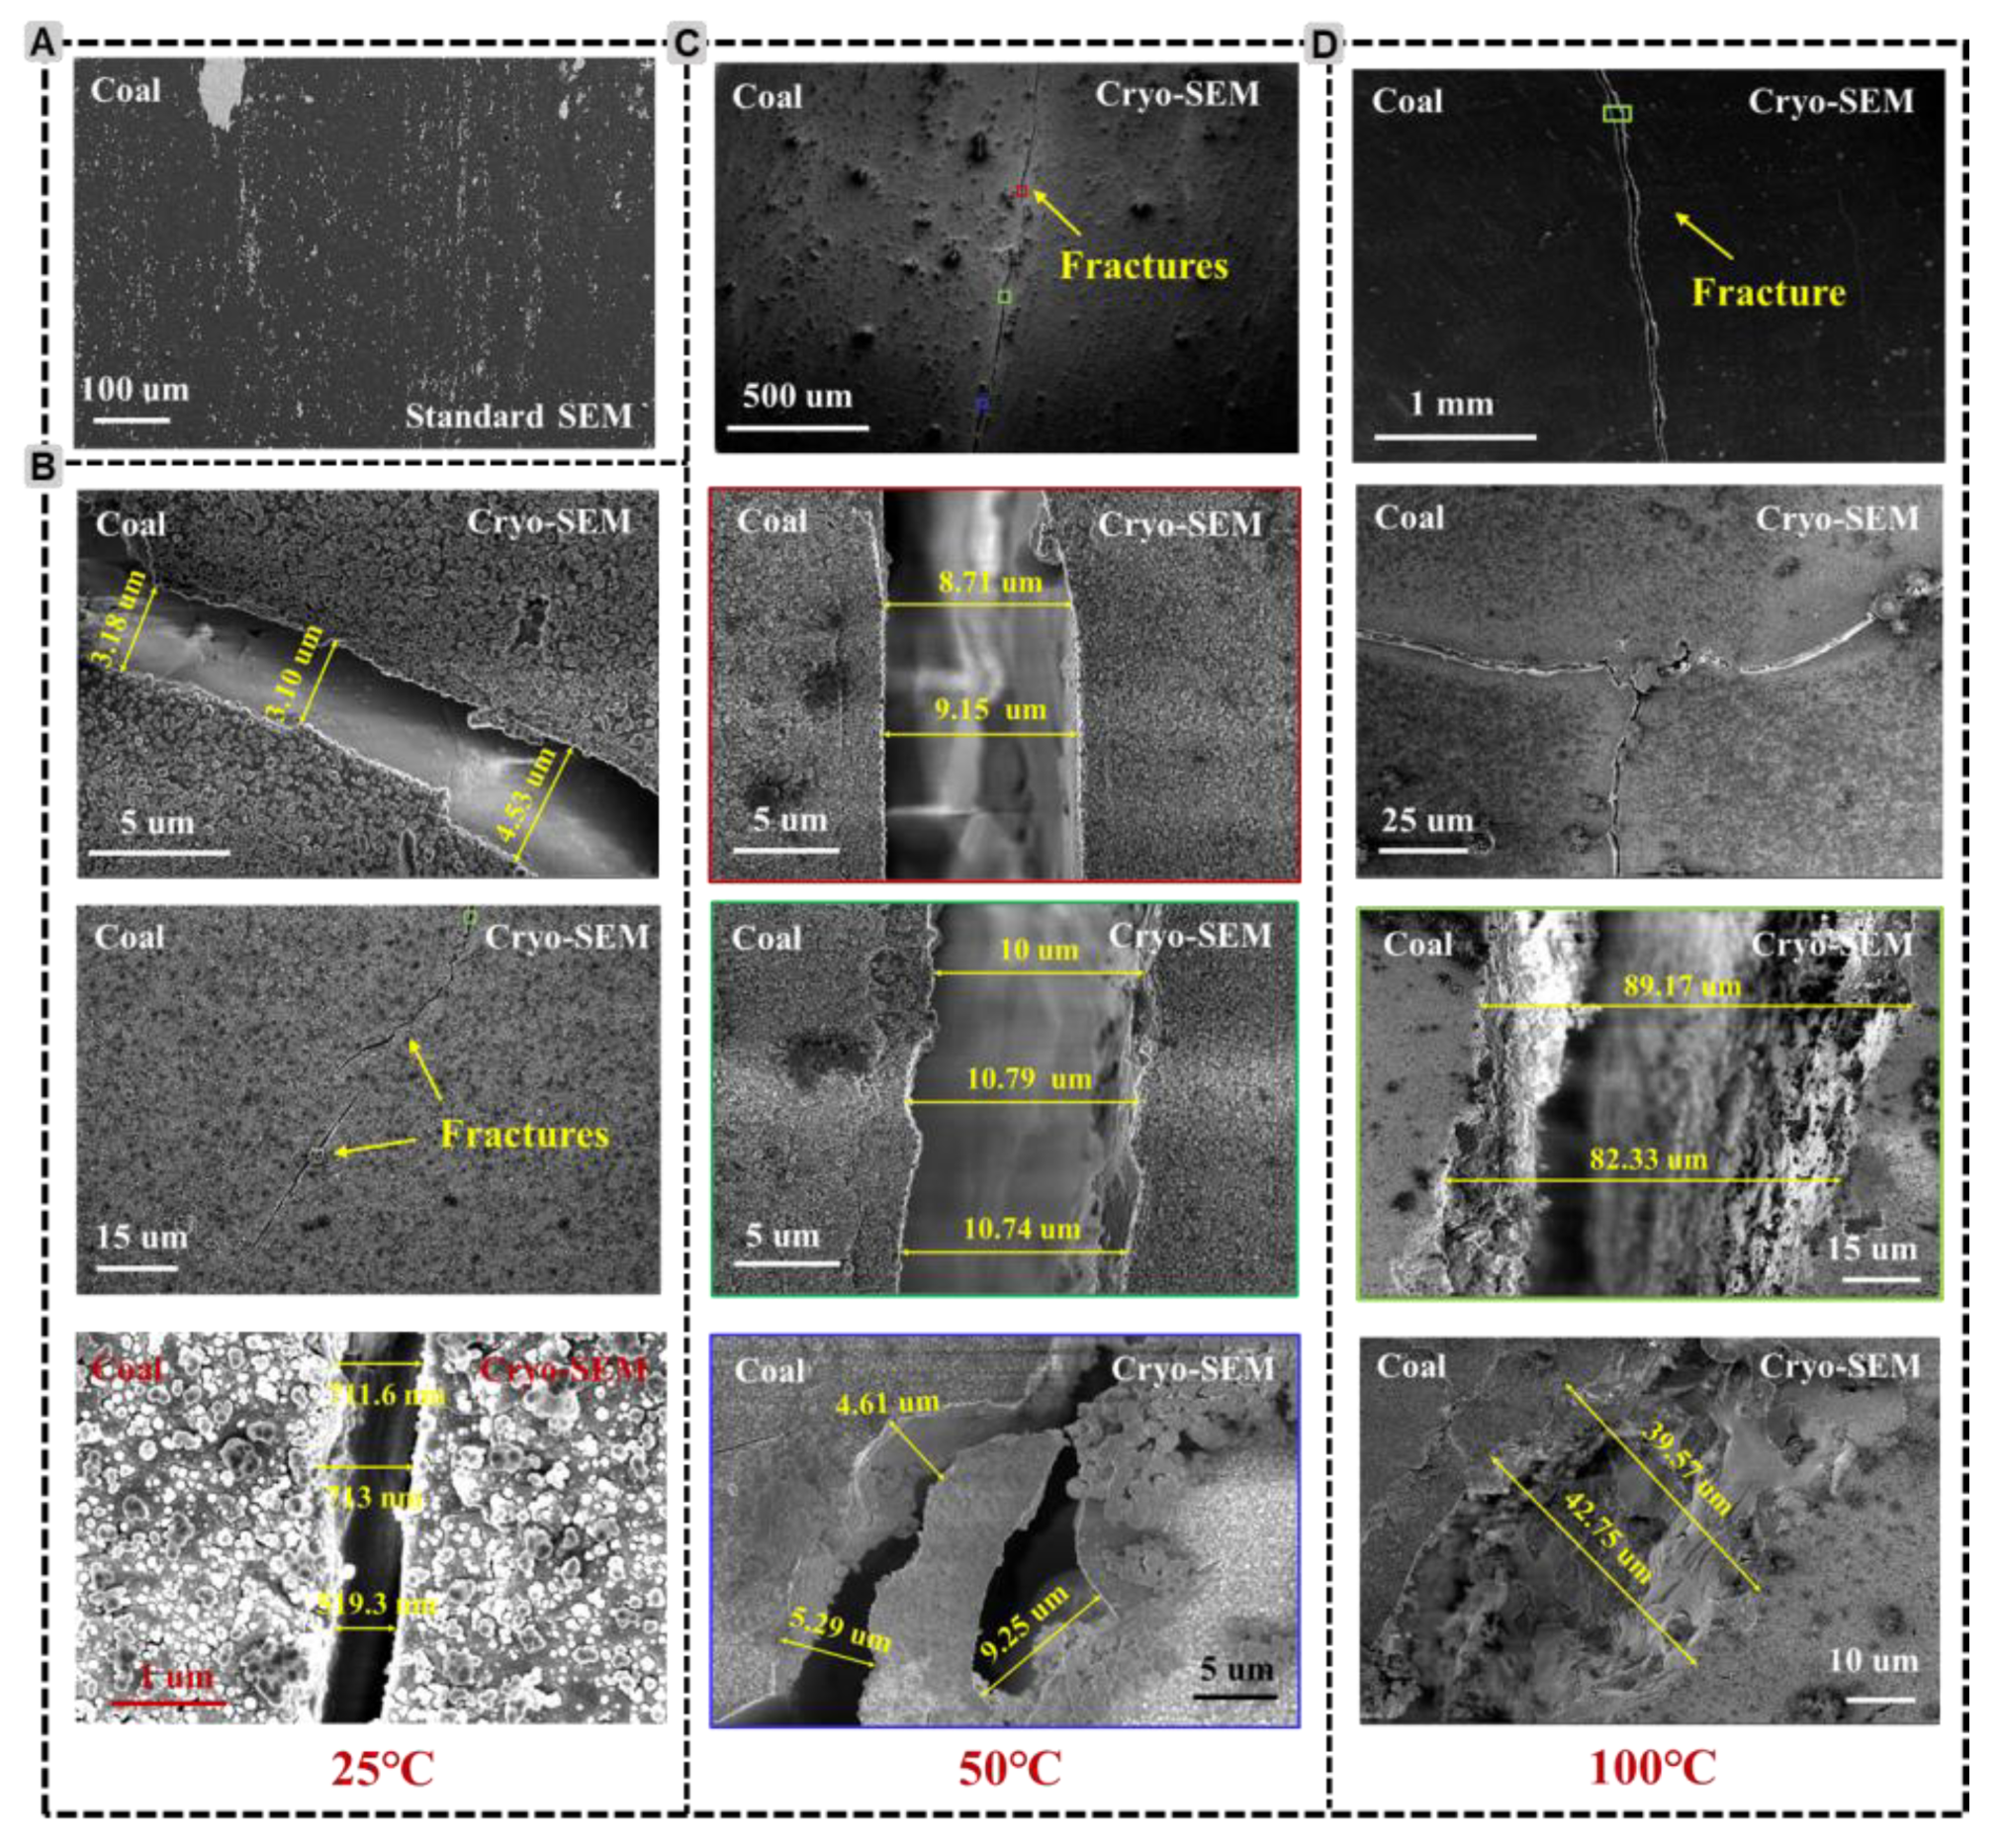
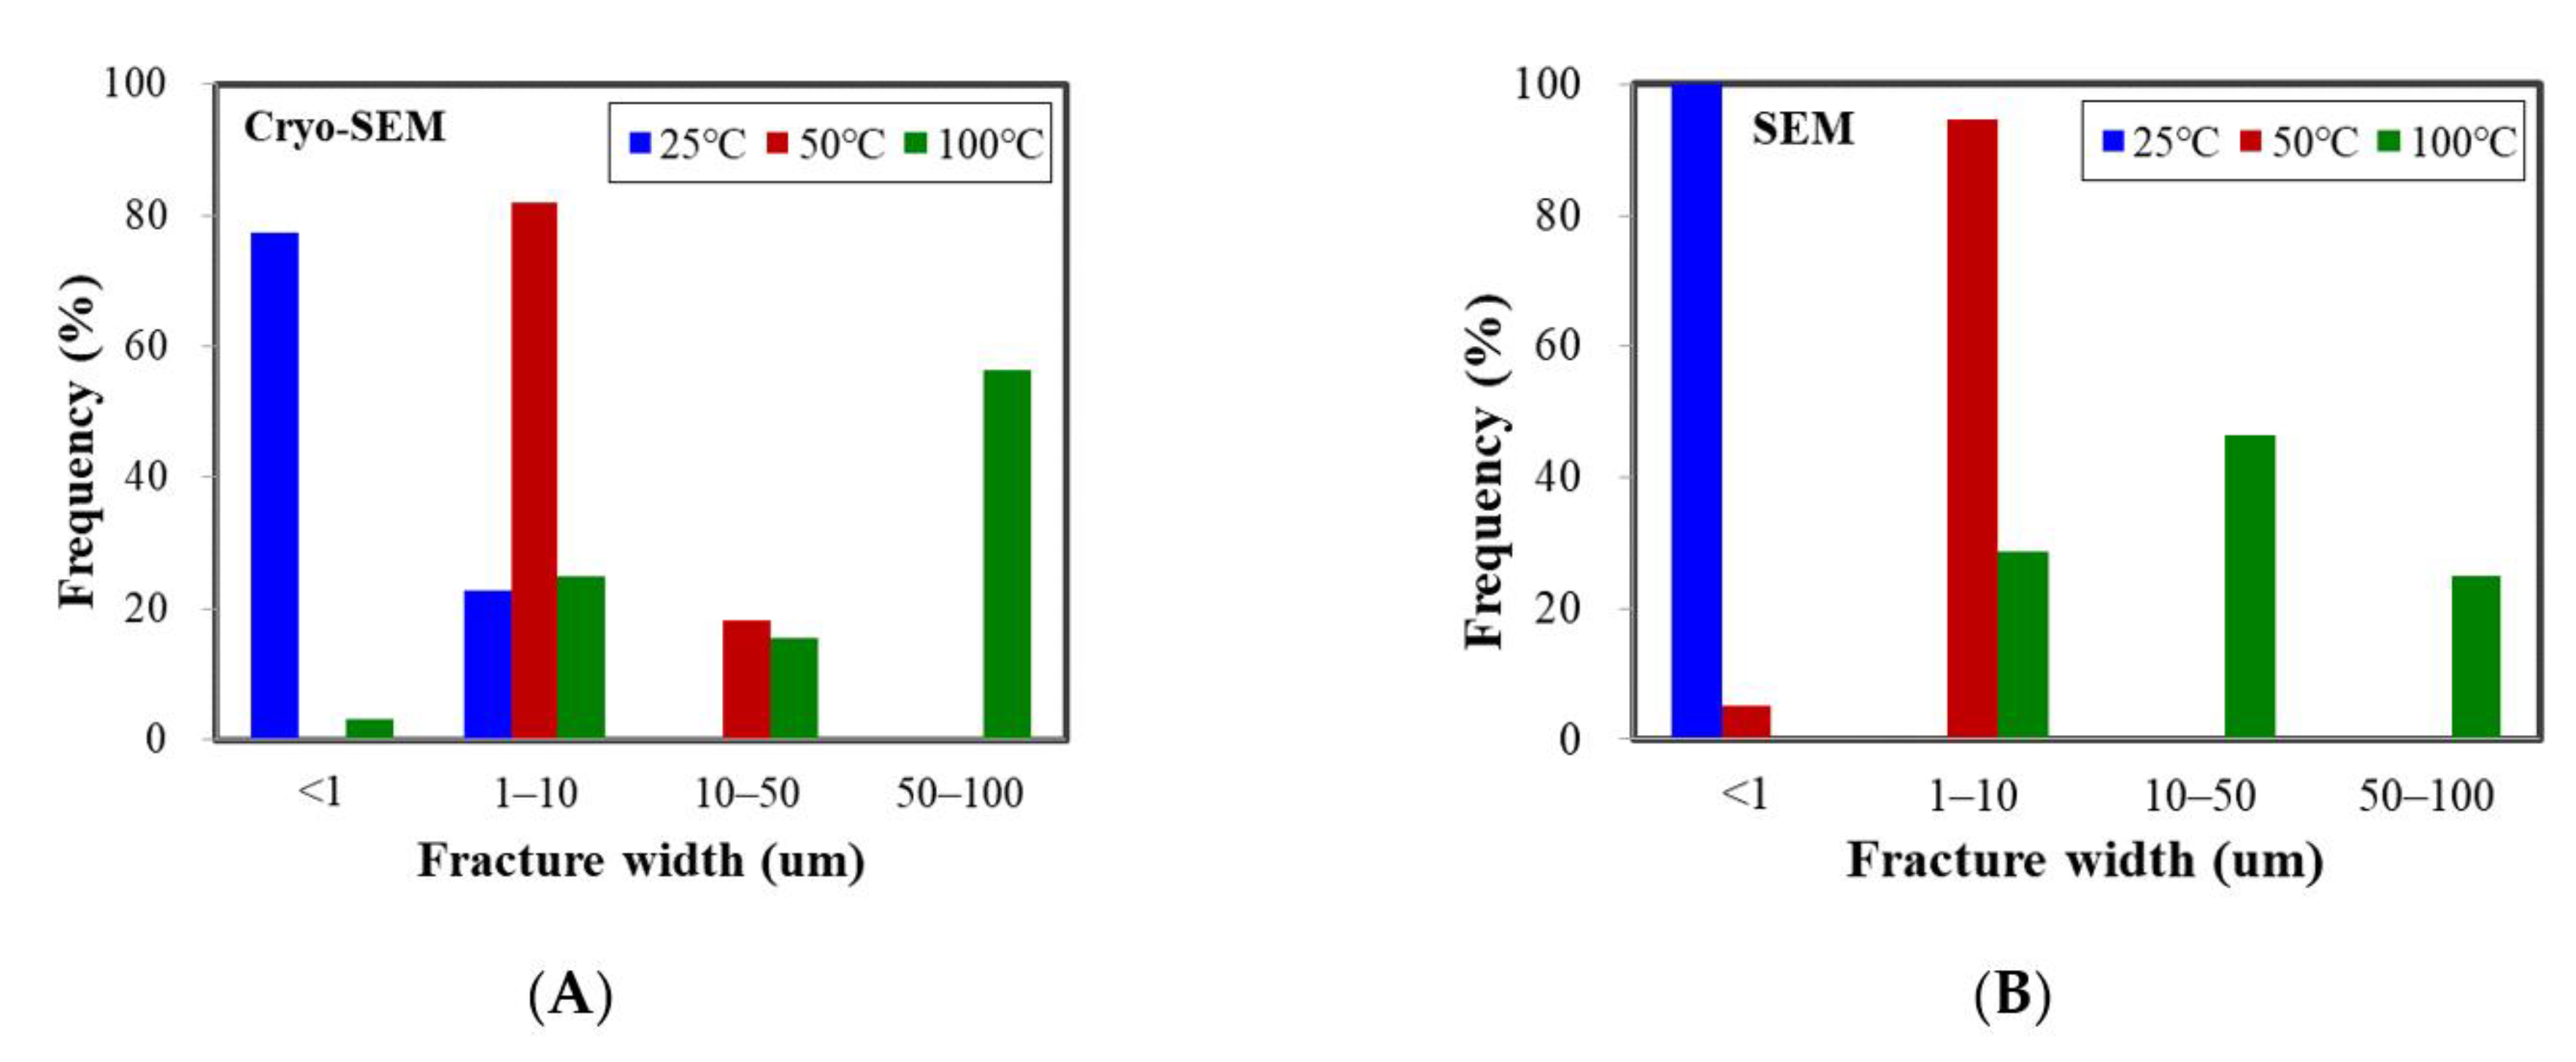
In this section, fracture patterns of different rock samples measured by Cryo-SEM are shown. Moreover, the correlations of the maximum fracture width with the temperature difference between LN2 and rock initial temperature are presented.

3.1.1. Coal Samples

Figure 3 depicts the surface morphological alterations of coal samples caused by LN2 treatment. Prior to the LN2 treatment, there were no noticeable fractures at the rock surface except several pores with nano- to micro-sizes (Figure 3A). After LN2 treatment, fractures were initiated (Figure 3B). This is because local thermal gradient and the alteration of pore structure by expansion/contraction and softening/hardening of the mineral constituents of rocks could cause the pre-existing pores to be connected and further extended when subjected to the sharp thermal shock [44]. The maximum fracture width was approximately 4.53 µm. One of the major fractures (the green-outlined area) are magnified in the following figures. When the initial coal sample temperature was 50 °C, a long fracture with branches were appeared in the post-LN2-treatment stage (Figure 3C). The maximum fracture-width increased to 10.79 µm and some parts of the sample became unconsolidated (the blue-outlined area in Figure 3C). When the initial sample temperature was 100 °C, fracture branches were also formed after LN2 cryogenic fracturing (Figure 3D). Obviously, fracture widths increased dramatically, with observed maximum value being 89.17 µm. Hence, major fractures with smaller-sized pores and cracks appeared following LN2 freezing on coal samples. Some of the fractures and pores were well connected, which may provide significant coalbed methane (CBM) migration pathways. Moreover, with the increase in rock-LN2 temperature difference, the fractures’ width became larger.

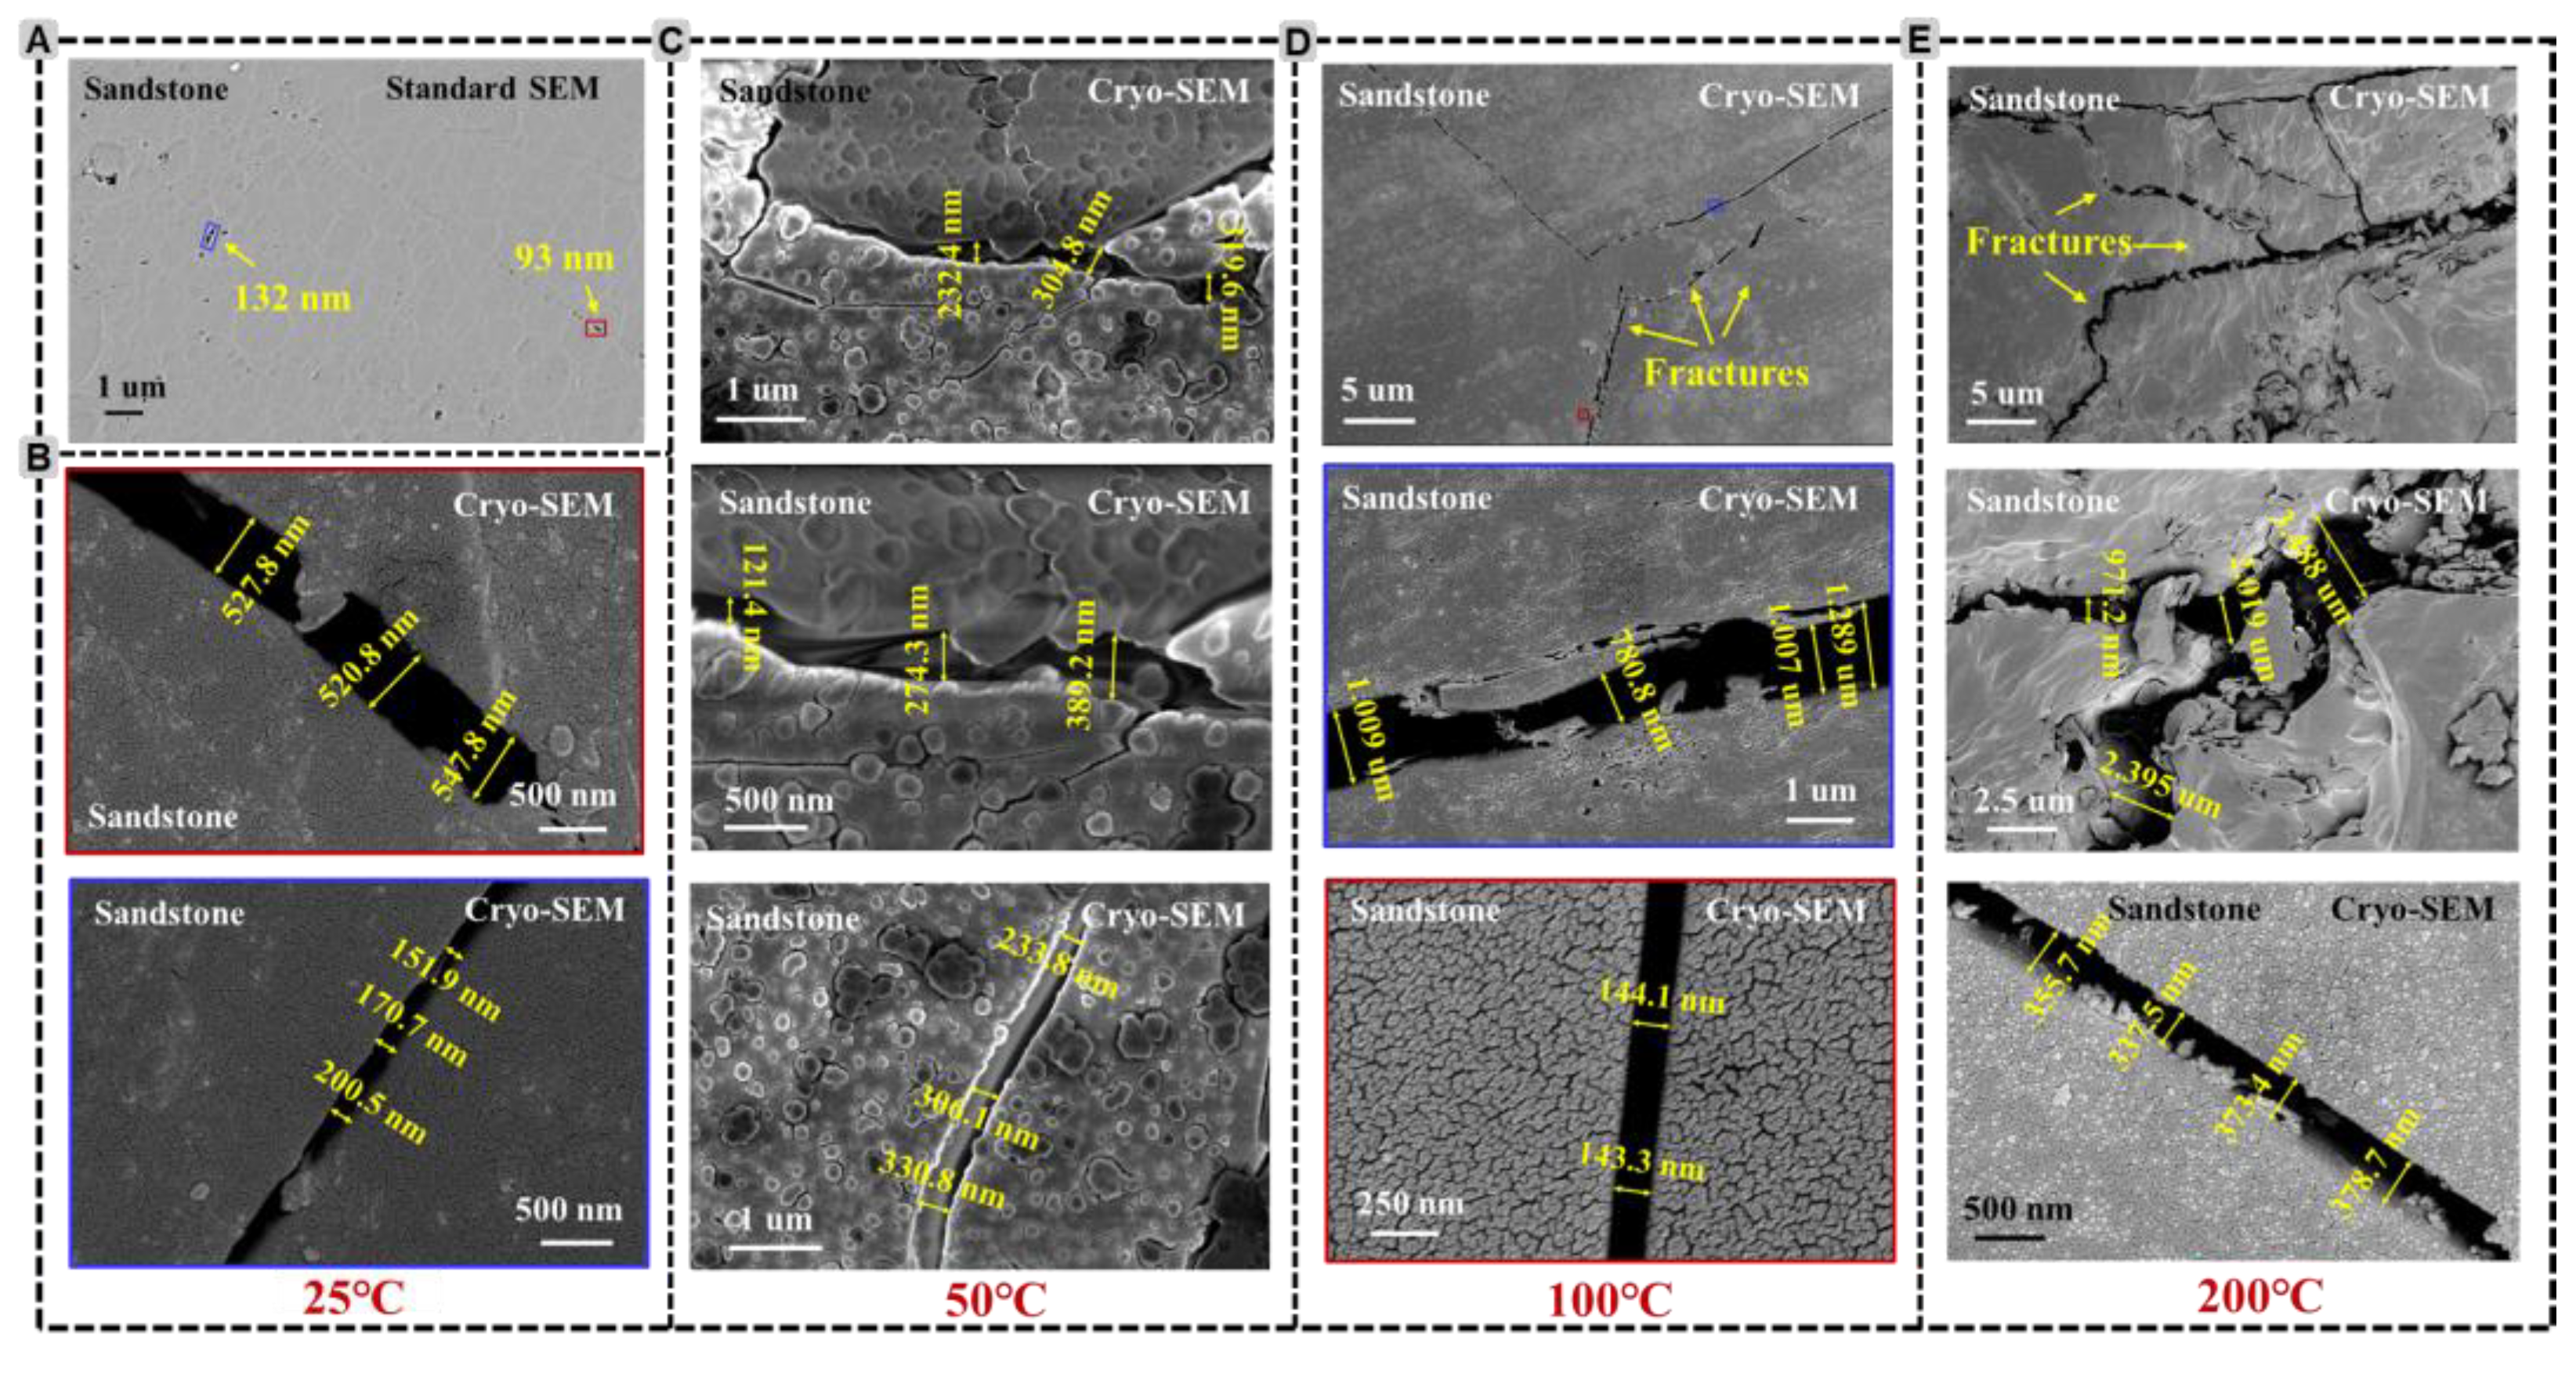
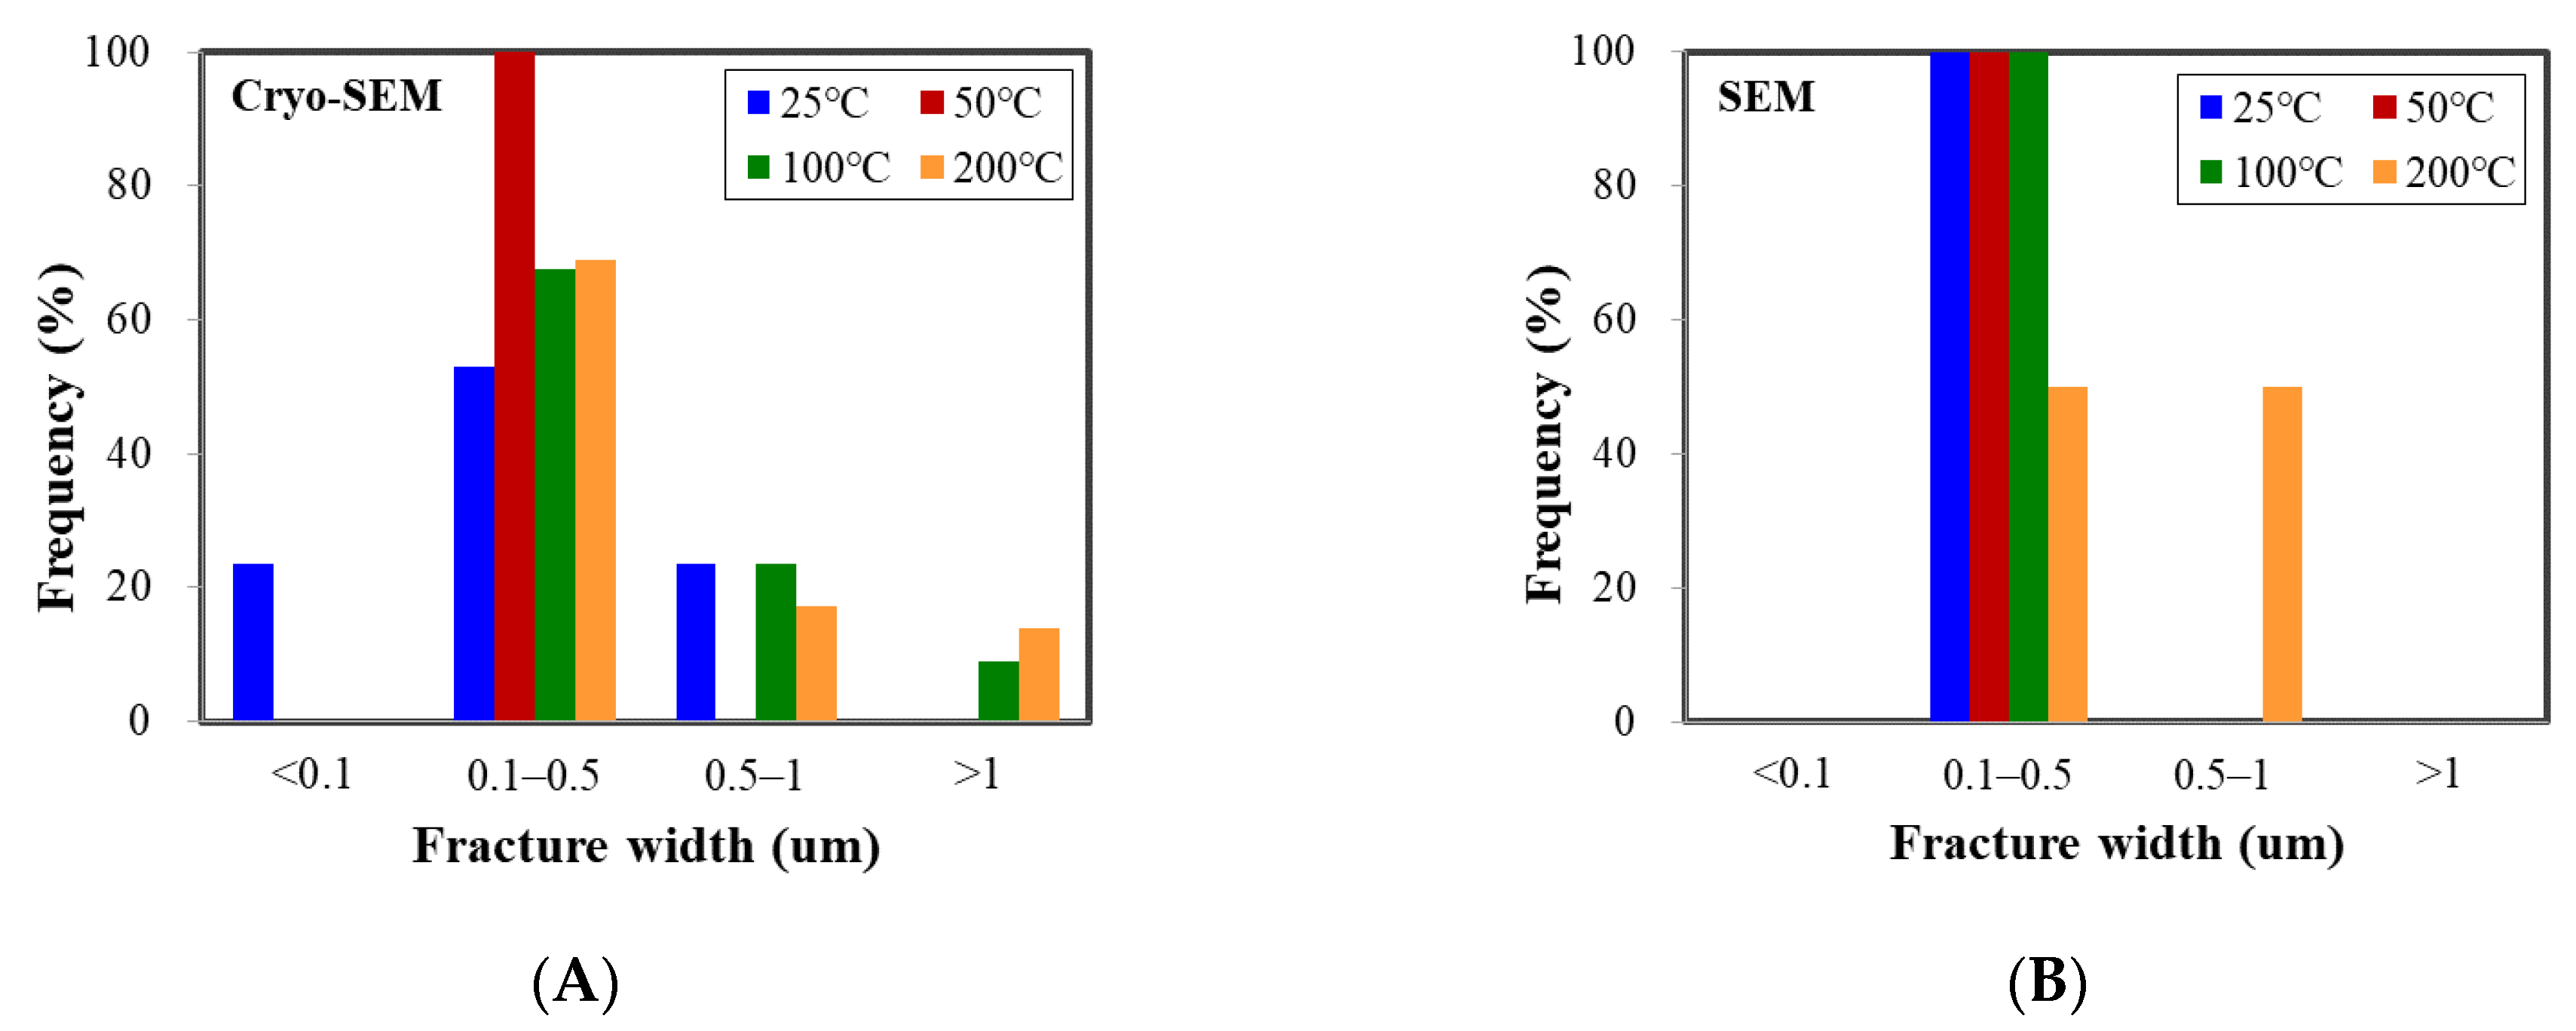
3.1.2. Sandstone Samples

For sandstone samples, from the standard SEM imaging method, we can see some pores in nano-scales were presented initially (Figure 4A). When the sandstone sample was cooled by LN2, several micro-fractures were appeared, and most of them were generated from the pre-existing pores and cracks (Figure 4B). The width of the crack can be 500 nano meters. When the initial sample temperature was 50 °C, some cracks with nanometers were induced after LN2 treatment (Figure 4C), with insignificant differences from 25 °C sandstone samples treated in LN2. Some continuous long-fractures were appeared after LN2 treatment, with maximum fracture-width being 1 µm when the initial sample temperature was 100 °C, (Figure 4D). However, fracture networks were generated on the sandstone after cryogenic exposure, with maximum fracture width being 3.5 µm when the initial sample temperature was 200 °C, (Figure 4E). Hence, the increase in rock-LN2 temperature difference could cause the occurrence of more microfractures perpendicular to or along the macro-fractures in sandstone samples. Compared with coal samples, the growth of fracture width with temperature gradient was minor.

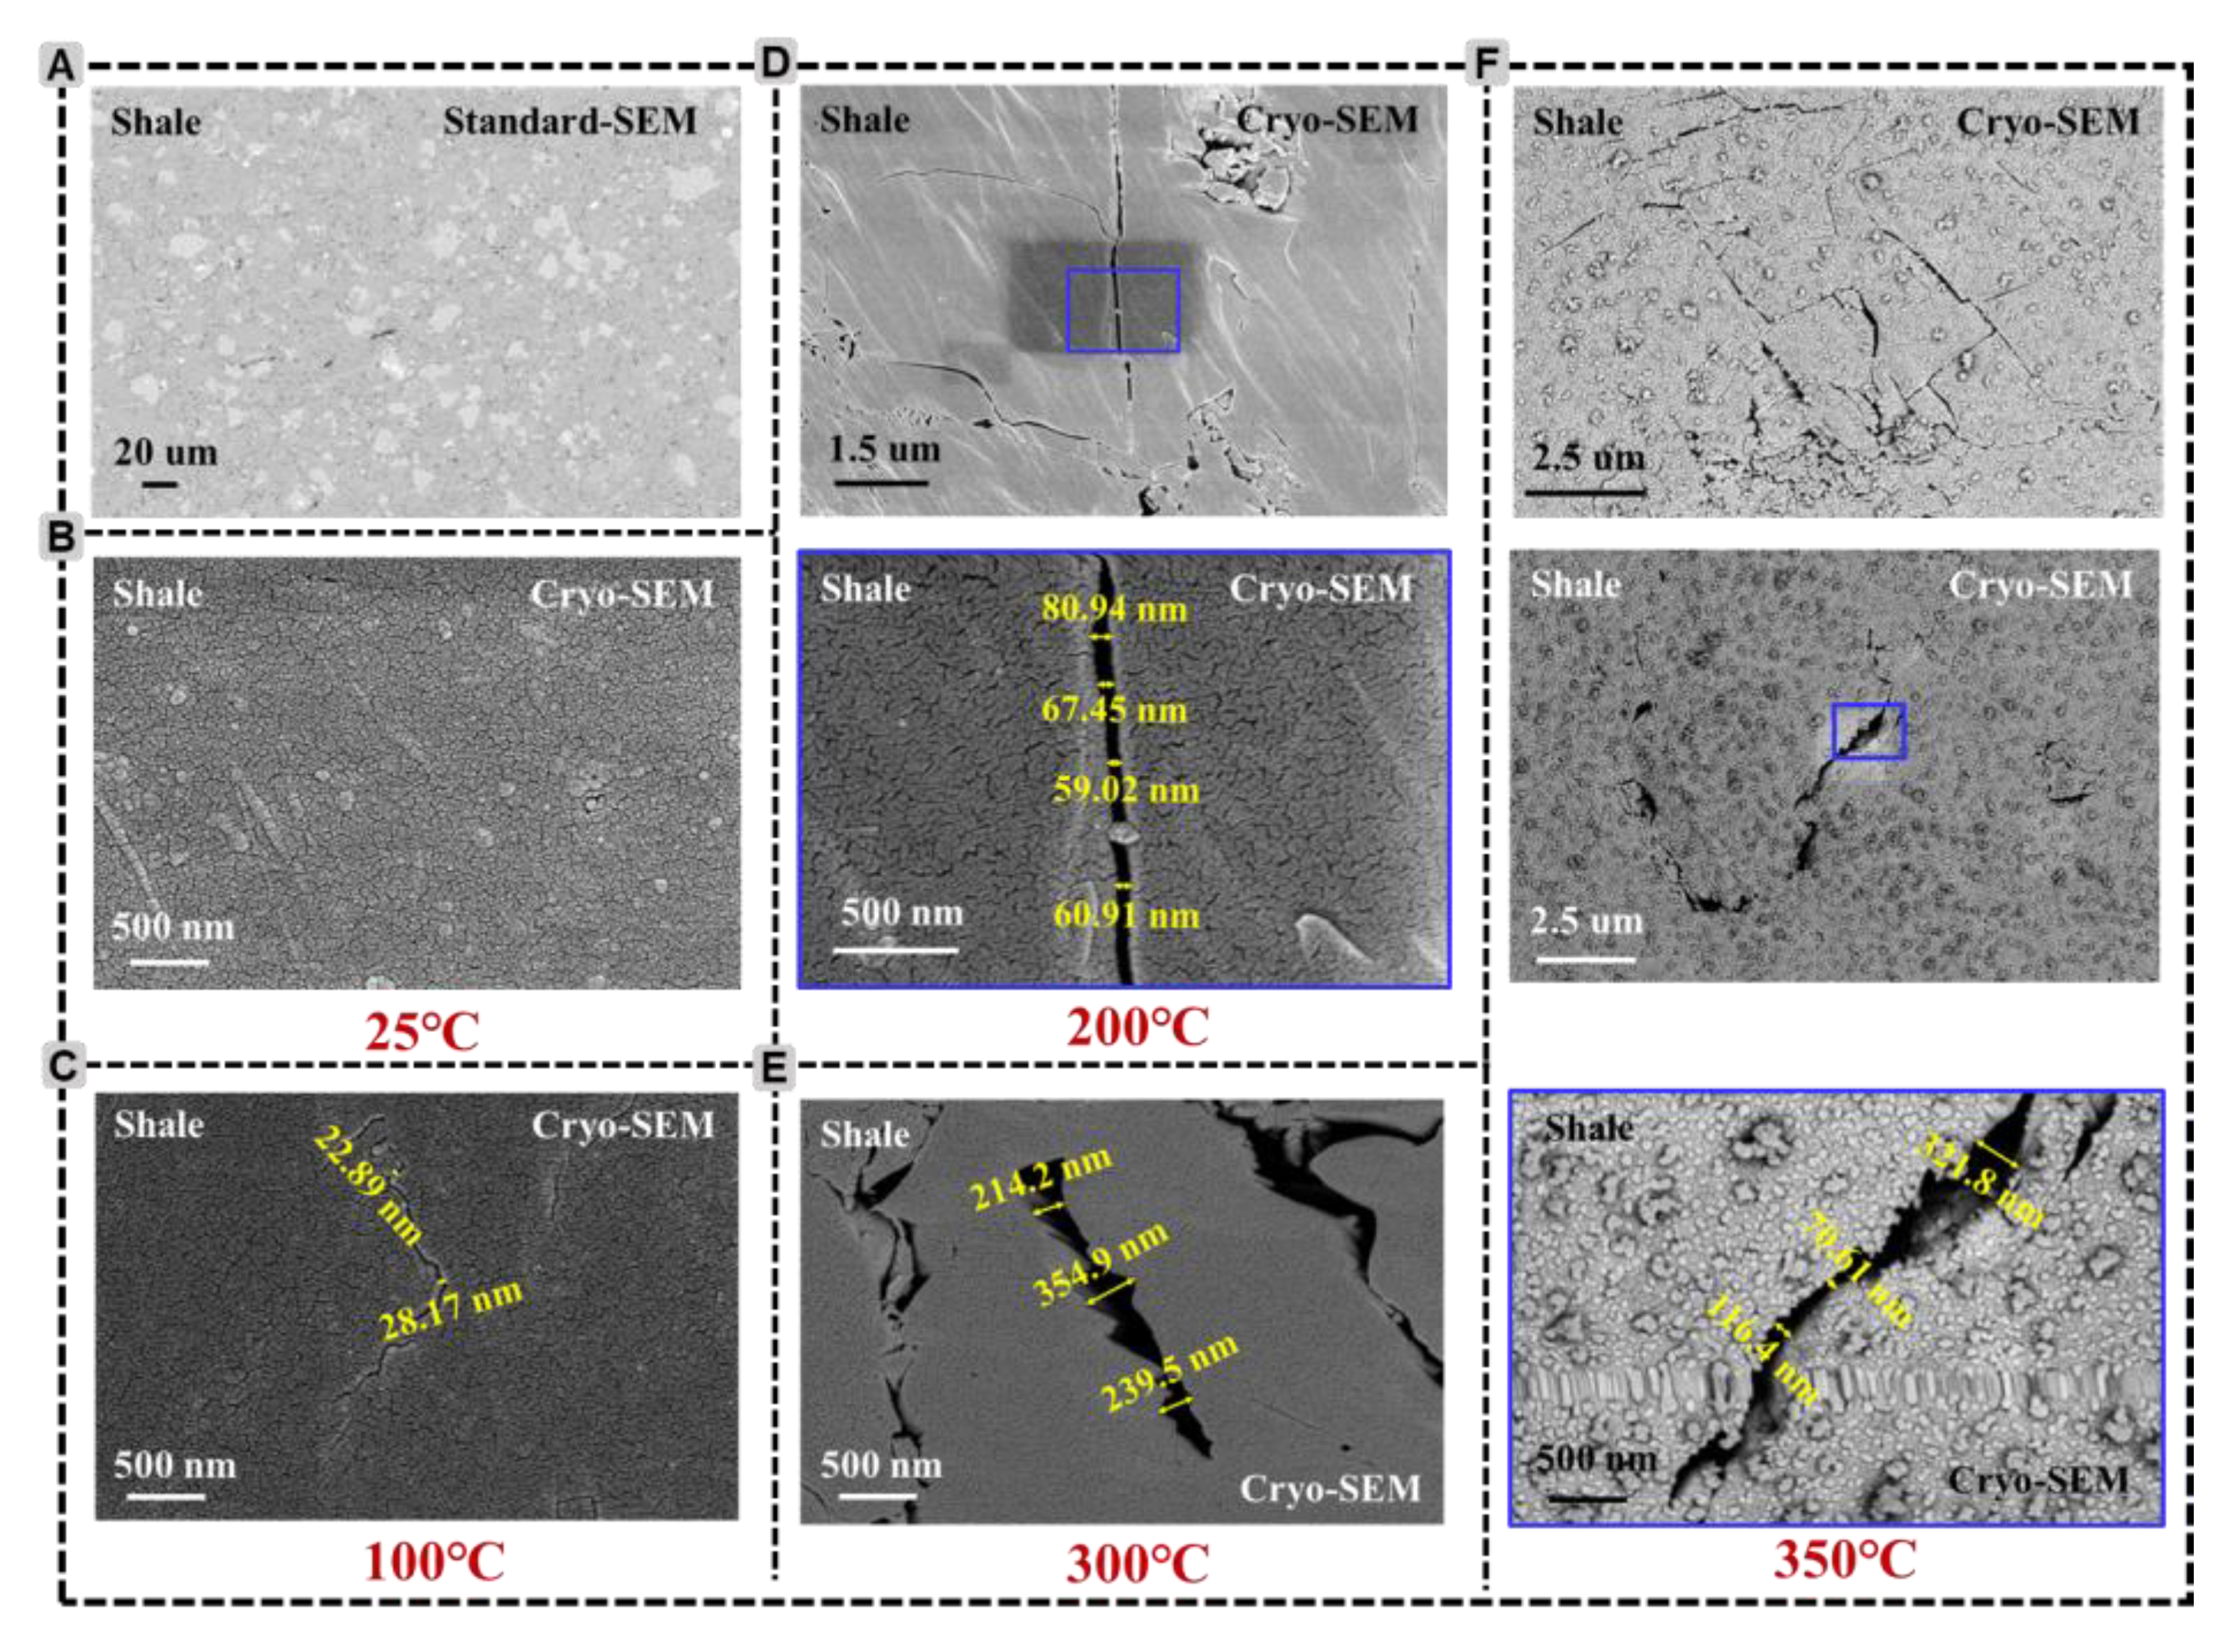
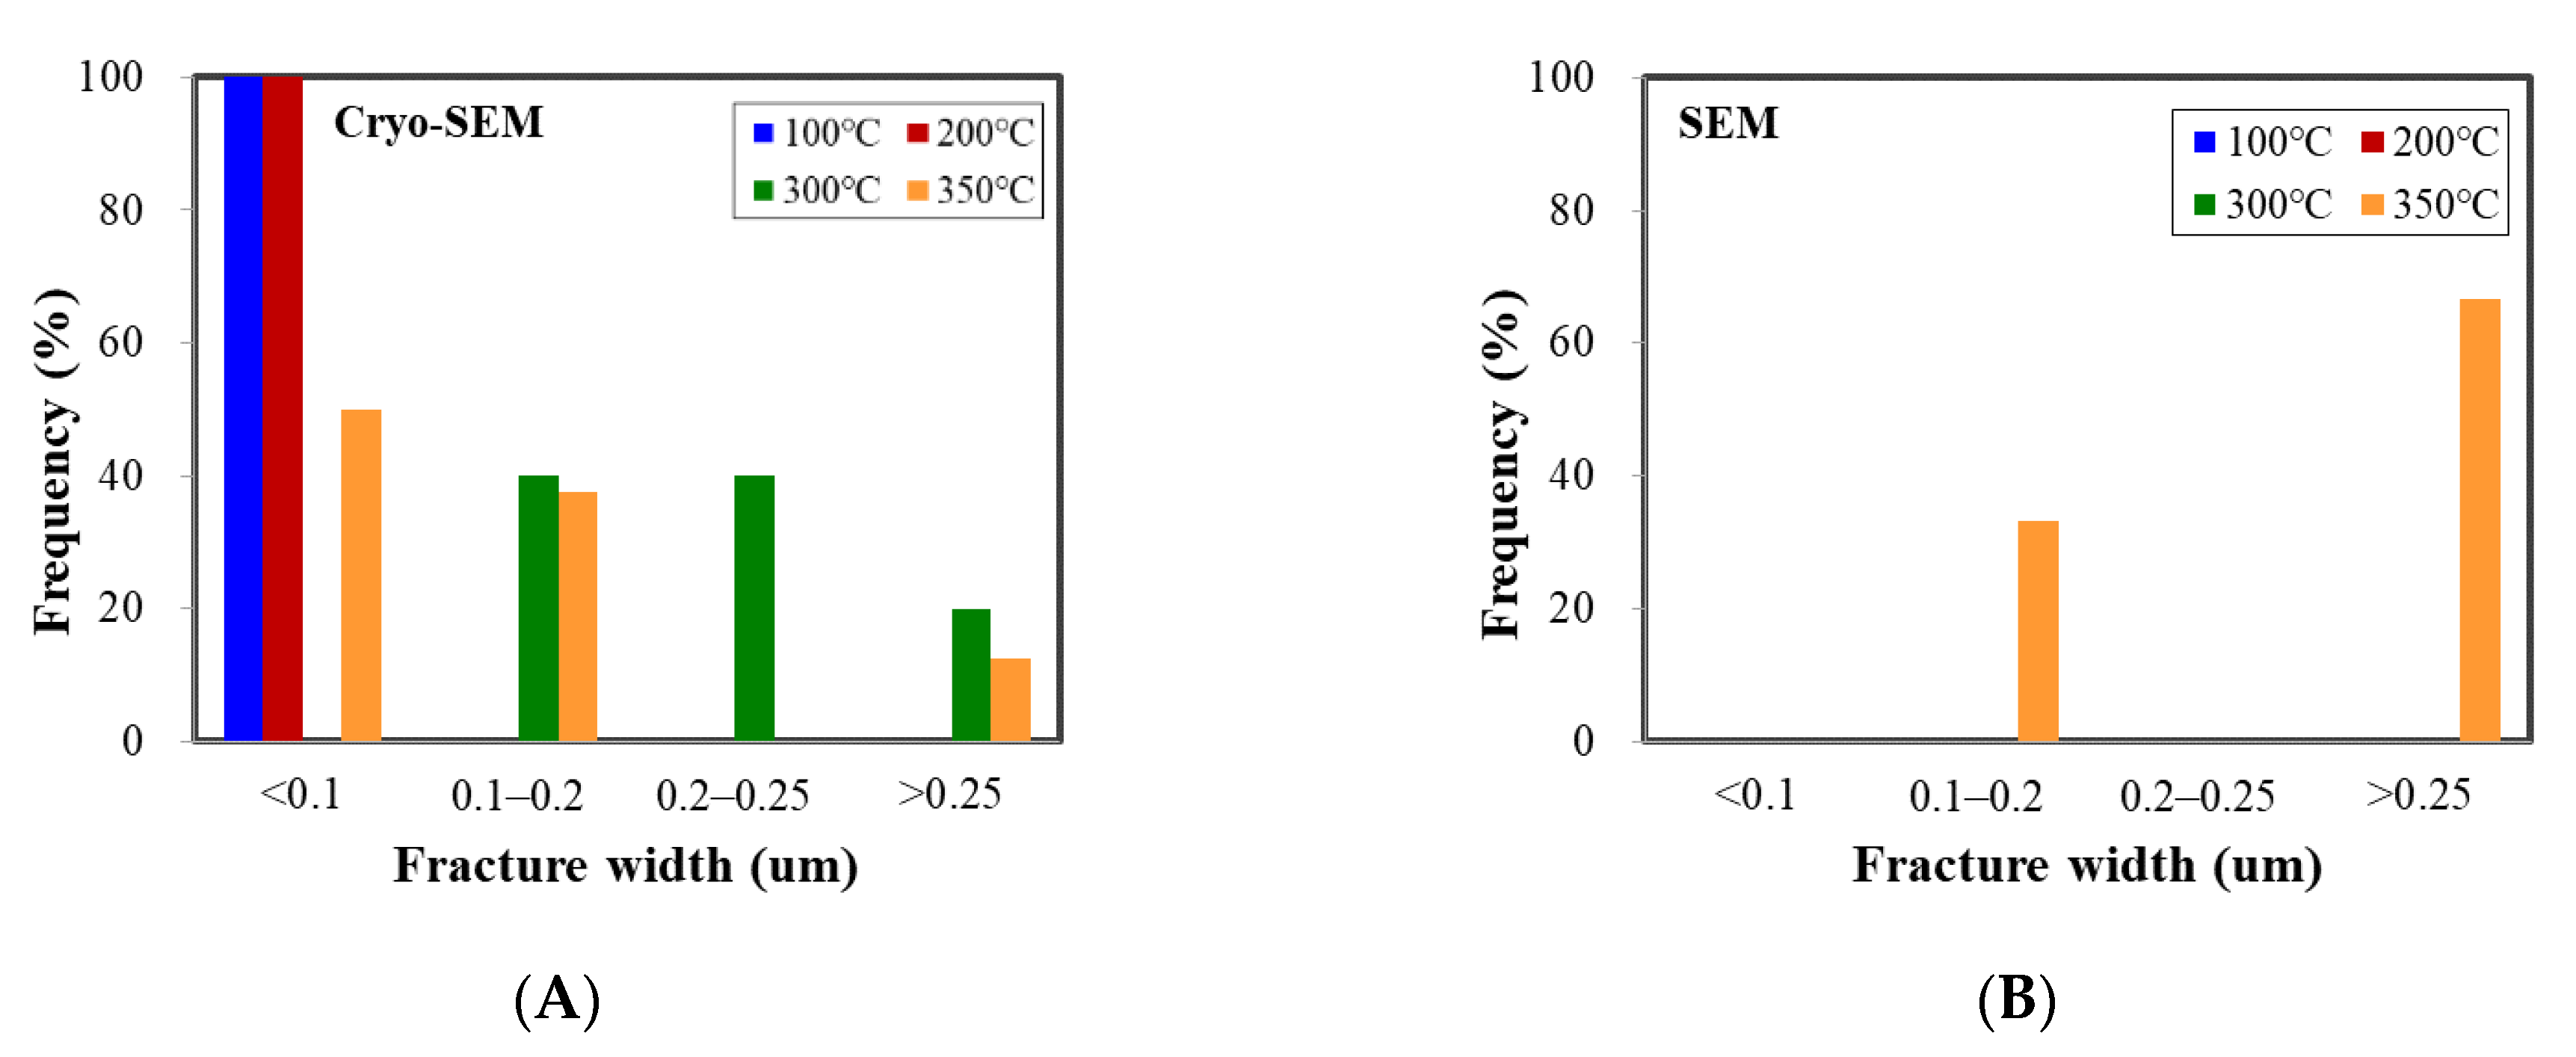
3.1.3. Shale Samples

Shales were less sensitive to the LN2 treatment as suggested in Figure 5. Initially, there were no obvious cracks on the shale surface (Figure 5A). After exposure to LN2, only small numbers of cracks under greater magnification can be observed (Figure 5B–E). Until the initial temperature of shale sample reached 350 °C, fracture networks were induced with fracture-width being 300 nm (Figure 5F). Hence, the thermal effect generated by LN2 on shale samples is not that obvious compared with coal and sandstone samples. Based on previous attempts, it was found that a majority of thermally-induced fractures initiated and propagated along the bedding planes when shale samples were cooled by LN2 [45]. It is possible that the weak cementation at the bedding planes in shale may have contributed to the previously observed thermally-induced fractures along bedding planes. However, shale samples were extracted perpendicular to the direction of the bedding planes in this paper. Hence, the thermally-induced fractures were not significant even under a higher rock-LN2 temperature gradient.

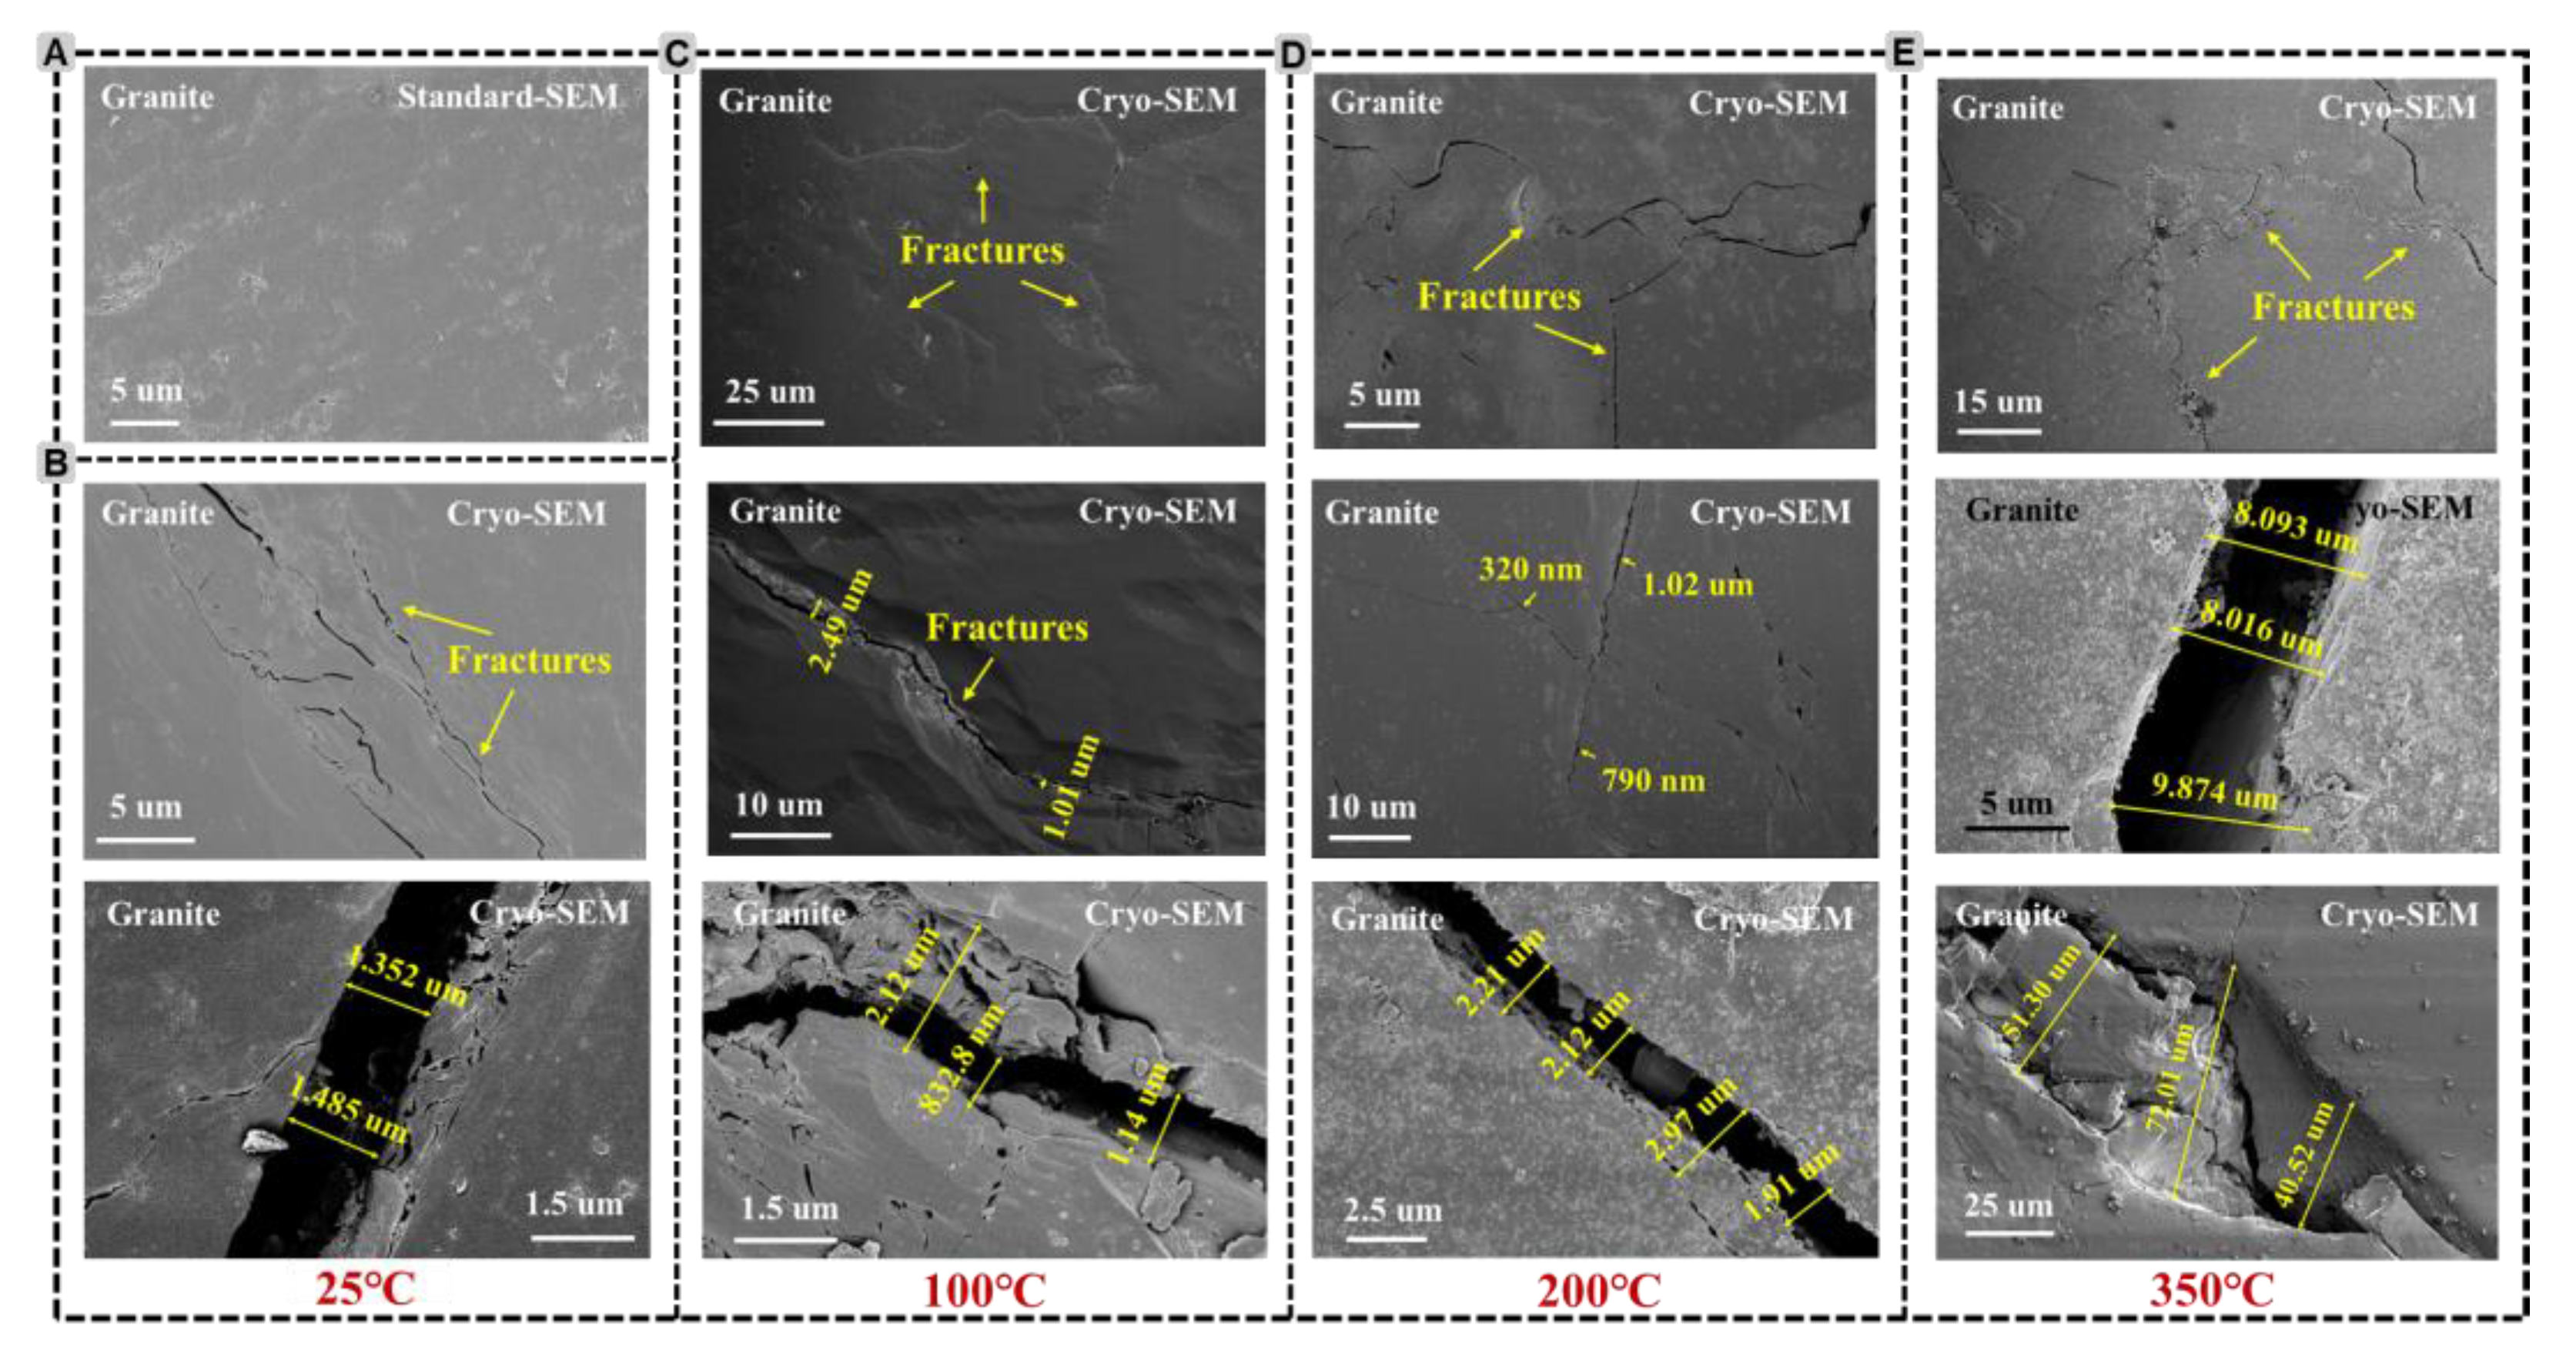
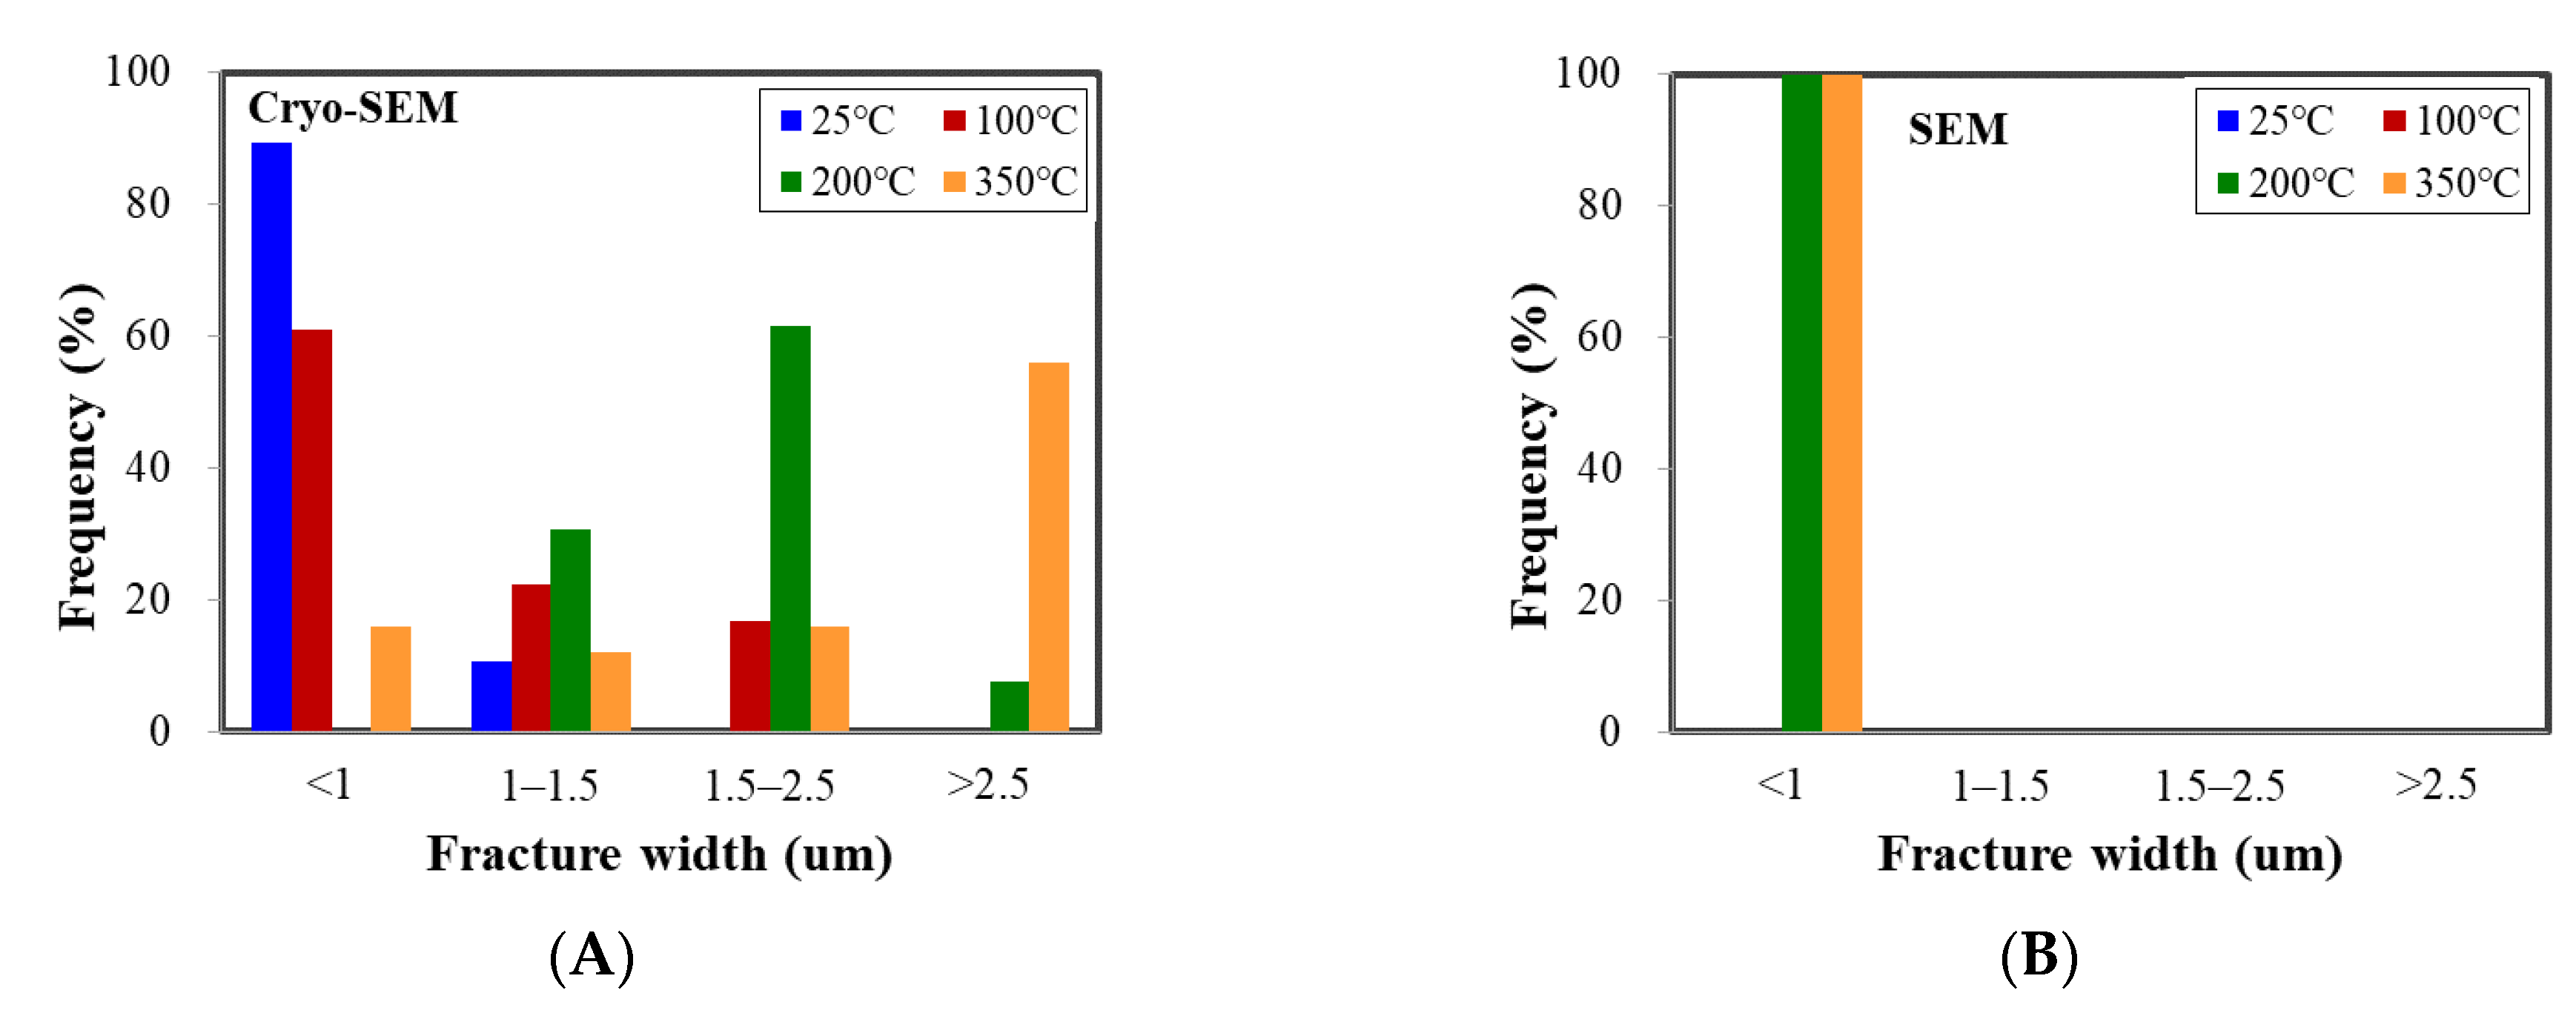
3.1.4. Granite Samples

Figure 6 shows the LN2 cryogenic effect on morphological change on granite samples. The sample surface was relatively tight prior to the LN2-treatment (Figure 6A). Multiple new fractures were generated following the LN2 freezing, and the maximum fracture-width was 1.5 µm (Figure 6B). Under greater magnification, it can be found that micro-pores and cracks were induced along the macro-fractures. When the granite sample initial temperature was 100 °C, long fractures with branches occurred and some parts became unconsolidated after cryogenic exposure (Figure 6C). When the granite sample initial temperature was 200 °C, fracture networks were displayed with the maximum fracture-width reaching more than 2 µm by the LN2 treatment (Figure 6D). Continuously increasing the initial sample temperature to 350 °C, numerous fractures with wider fracture-width were induced after LN2 treatment, and the maximum fracture-width can be 10 µm (Figure 6E). Furthermore, larger unconsolidated areas were generated, which could enhance the effective permeability. Therefore, granite with higher initial temperature can induce more complex fracture networks by LN2 treatment.

3.1.5. Comparisons of LN2 Thermal Shock Performance on Different Rock Types

The correlations of the maximum fracture width with the temperature difference between LN2 (−196 °C) and rock initial temperature are displayed in Figure 7. The maximum fracture width showed a positive exponential correlation with the temperature difference in coal samples, which also indicates that LN2 has superior cryogenic fracturing efficiency on coal. When the temperature difference between LN2 and rock increased from 221 °C to 296 °C, the maximum fracture width of coal increased by 186.8%. The maximum fracture width displayed a positive linear correlation with the temperature difference in sandstone samples, and the increase in maximum fracture width with the temperature difference follows a quadratic trend in shale samples. When the temperature difference between LN2 and rock increased from 221 °C to 296 °C, the maximum fracture width of coal increased by 134.5%. Comparatively, the frozen shale experienced minimal fracture size, with the maximum observed fracture width failing to exceed 0.4 µm, even at extreme temperatures temperature differential of 546 °C. In terms of granite samples, a positive exponential correlation between the maximum fracture width and the temperature difference is obtained. When the temperature difference between LN2 and rock increased from 221 °C to 546 °C, the maximum fracture width of coal increased by 552.7%. As a comparison, the maximum fracture width of coal, sandstone, shale and granite were 4.53 µm, 0.55 µm, 0.001 µm and 1.51 µm when the temperature difference between LN2 and rock samples were 221 °C. Additionally, the maximum fracture width of coal, sandstone, shale and granite were 89.17 µm, 1.29 µm, 0.028 µm and 2.12 µm when the temperature difference between LN2 and rock samples were 296 °C. Hence, the application of LN2 thermal shock can produce more satisfactory fracture widths in coal and granite compared to shale and sandstone.
In sum, the outcome of Cryo-SEM imaging illustrates the evolution of pores, cracks and fracture-networks of rocks frozen in LN2 by four manners: extending the pre-existing pores and cracks, inducing new fractures, losing the rock framework, and creating connections between pores and fractures. Moreover, coal samples are the most sensitive to LN2 cryogenic exposure, since the observed fracture widths enlarged dramatically with the rise of coal-LN2 temperature difference. LN2 thermal shock also has better a fracturing performance on granite, since the temperature difference between granite and LN2 has pronounced effects on fracture-network complexity and the scale of unconsolidated area. For a sandstone sample, the pre-existing pores and cracks play significant roles. Comparatively, LN2 treatment has minor effects on shale samples, but if bedding planes are existing, the result may be different. The main reason is that the sensitivity of rocks to thermal shock from LN2 primarily relies on various factors, including microstructure, sedimentation, mineral composition, diagenesis and geomechanical properties. Granite is a type of crystalline rock with highly heterogeneous mineral deformation, where mineral particles are closely cemented by crystals. This close arrangement can enhance mutual restraint between the particles and generate significant thermal stress in the rocks during temperature variations, making granite less resistant to thermal shock [45]. In terms of coal, with high content of clay minerals (92%), weak mechanical strength and cementation might be the reason for weak thermal resistance and long fractures generation. For sandstone, low mineral heterogeneity may reduce the thermal shock effect. For shale, extremely tight pore structure (in nano-scale) and bedding plane direction could impact the fracture initiation location and propagation path significantly. Hence, LN2 thermal shock has better fracturing efficiency on coal and granite.

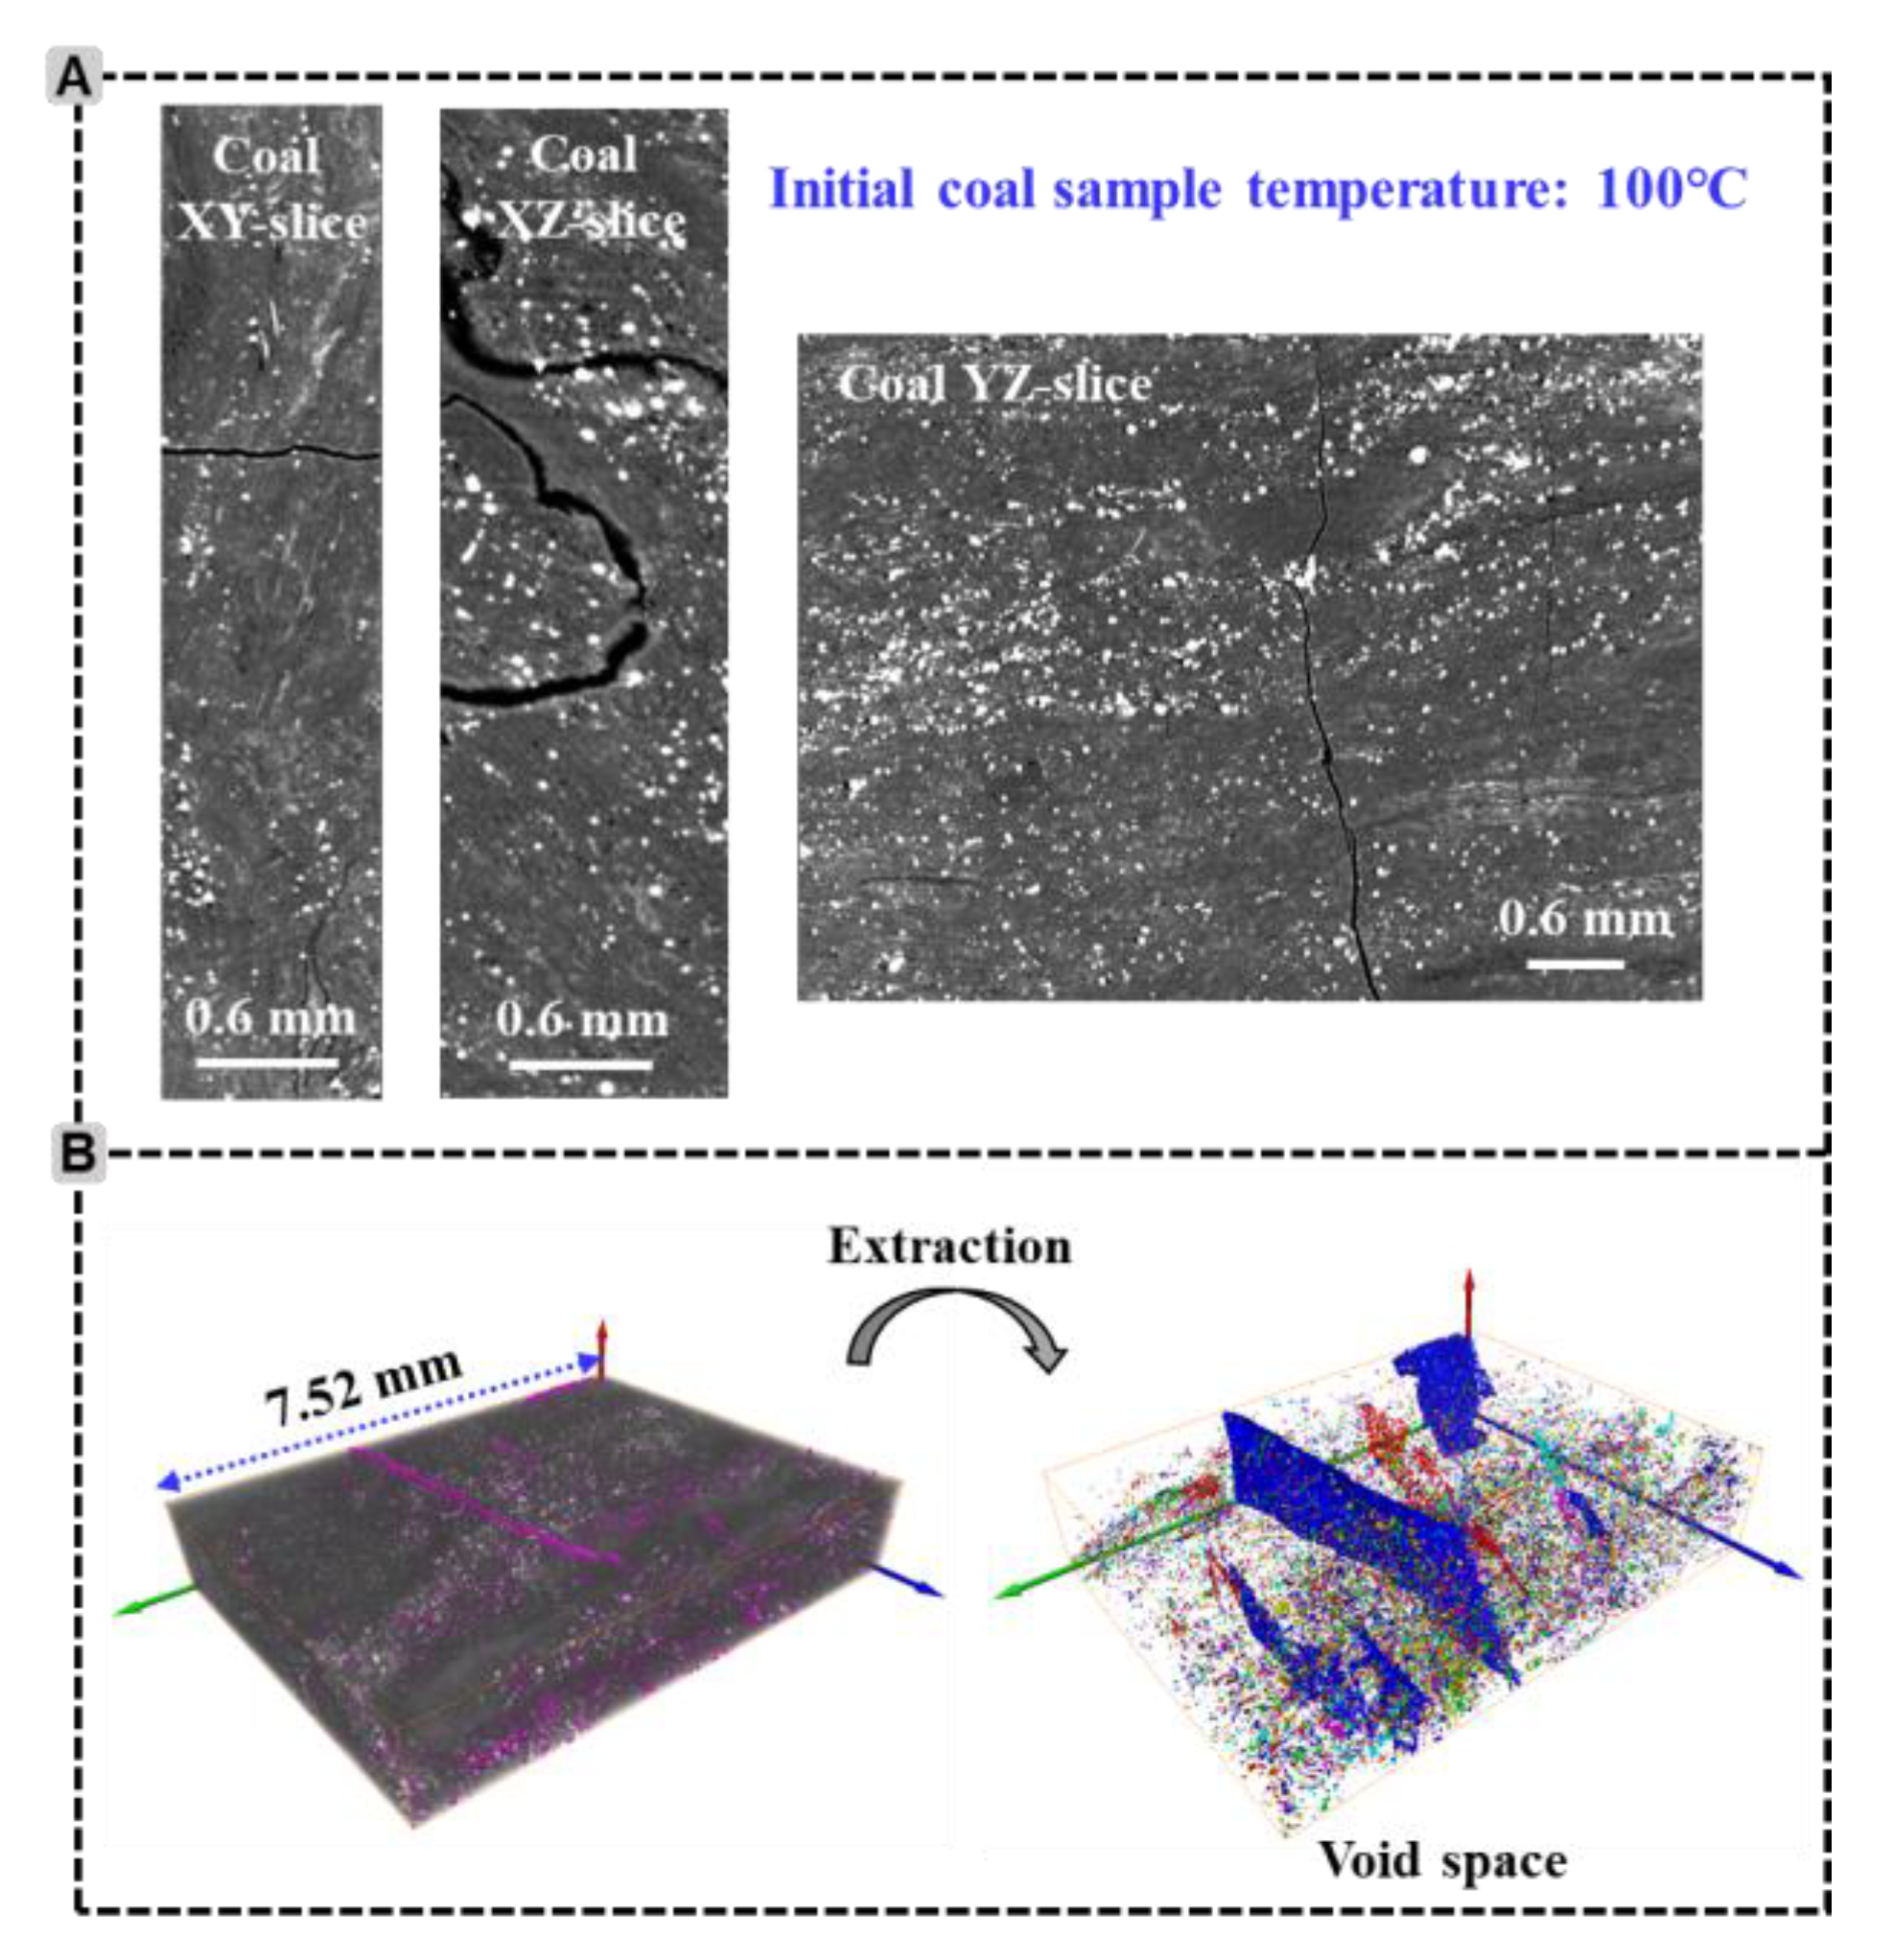
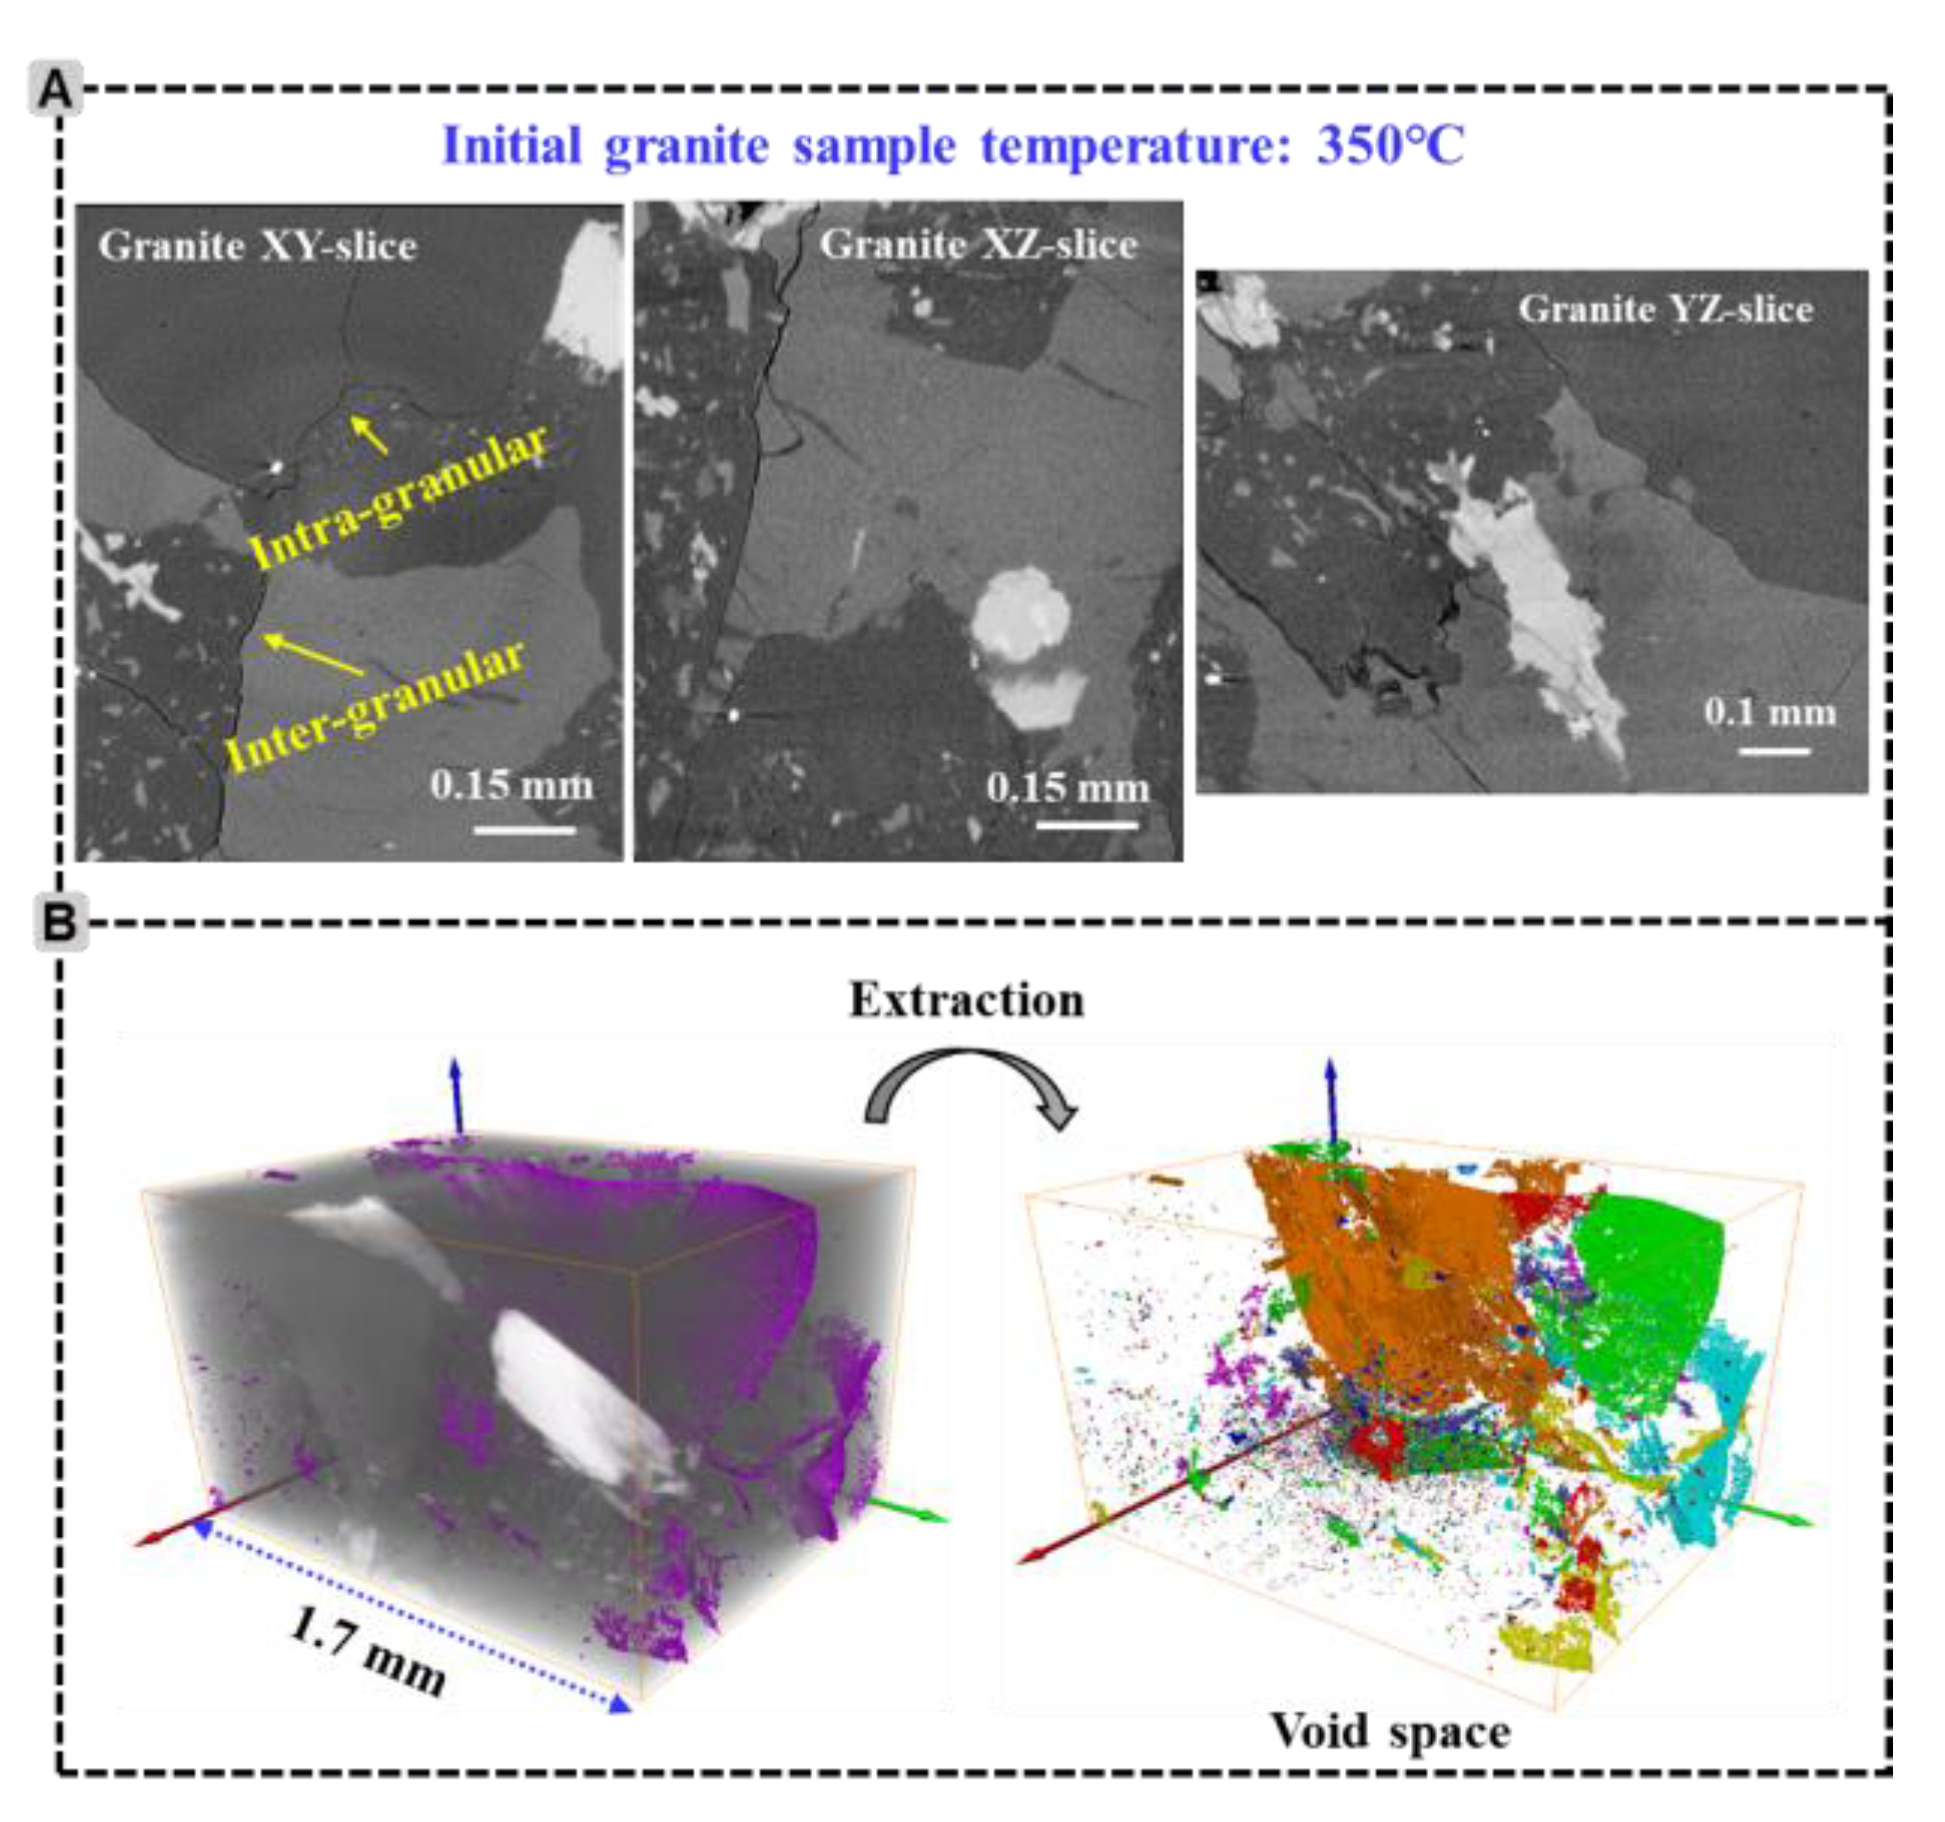
3.2. Fracture Patterns in 3D Space through CT Analysis

In this section, we visualize the fracture’s 3D morphology after LN2 treatment to further illustrate the fracture-networks generation and distribution inside the rock samples. Coal and granite samples were investigated since more obvious alterations had been observed on rock surfaces in 2D. The coal sample with initial temperature of 100 °C (sample in Figure 3D) and the granite sample with initial temperature of 350 °C (sample in Figure 6E) were selected.
Figure 8A indicates that fractures were generated not only at the surface of the sample, but also on the side, namely in 3D scale through the coal sample. Hence, it can be inferred that the thermal stress caused by the LN2 treatment is higher than the tensile strength of the coal sample, inducing fractures initiation and propagation all the way to the sample boundary. Figure 8B shows the extraction of void space from the 3D pore-fractures network reconstruction model, where the fracture-network consists of long fractures (in blue) and numerous pores and short-cracks. The total volume percent of the void space is 0.92%. These thermally generated long fractures could possibly connect the face cleats and butt cleats, leading to the enhancement of the effective permeability. Therefore, LN2 fracturing could be a promising reservoir stimulation approach to improve the coalbed methane recovery.
Different from the coal sample, intra-granular and inter-granular fractures were formed for granite samples after LN2 treatment (Figure 9A). This is because of temperature change resulting in different minerals expanding or extracting differently in different directions. This unequal expansion may cause internal cracking to take place along the lines of greatest stress. Figure 1 shows the mineral analysis for different rock types. Different minerals have different thermal expansion coefficients (Table 2) [46]. Therefore, the more types of minerals, the more thermal expansion/extraction heterogeneity of the rock. We found that granite contains the most mineral types and sandstone contains the least types, and clay minerals account for most coal. Furthermore, unlike coal samples, fractures initiation location mainly depends on grain boundaries and weaker grains for granite. Although there were no long fractures propagating across the whole sample, the intra-granular and inter-granular fractures could create more connections between isolated pores and cracks. Consequently, LN2 fracturing could also be a viable option for sustainable development of hot dry rock geothermal reservoirs, in an efficient and environmentally accepted way [3].

3.3. Comparisons of Fracture-Width Measured by Cryo-SEM and SEM

An accurate evaluation of fracture sizes obtained by LN2 treatment is important in studying permeability evolution and fracturing efficiency of rocks exposed to LN2. In this section, we make comparisons of fracture-width distribution measured by Cryo-SEM and SEM. SEM images were taken when the above rock samples returned to the room temperature. Histograms for the frequency of fracture-width sizes were displayed. Specifically, the distribution range of fracture widths and the proportionate count of fractures in each fracture-width range were calculated to provide a quantitative analysis of the Cryo-SEM and SEM. The comparison results could quantitively reflect the closure of fracture-widths due to temperature rise.
Figure 10 displays the fracture width distribution of coal samples exposed to LN2 observed by Cryo-SEM and SEM, respectively. Cryo-SEM enables the imaging of specimens at cryogenic in-situ conditions, while SEM observes the rock surface morphology after it returns to room temperature. When the initial coal sample temperature was 25 °C, Cryo-SEM analysis displayed that fractures with an aperture size of less than 1 µm accounted for 77% and 23% of fractures that were shown with aperture sizes of 1–10 µm (Figure 10A). However, when it warmed to room temperature, fractures were narrowed and all of the identified aperture sizes were less than 1 µm (Figure 10B). When the initial coal sample temperature was 50 °C, fractures with aperture size of 1–10 µm accounted for 82% and the proportion of 10–50 µm was 18% through Cryo-SEM analysis (Figure 10A). Comparatively, the SEM indicated that fractures with aperture size of 1–10 µm increased to 95%, but aperture sizes larger than 10 µm almost disappeared, and the remaining 5% portion was less than 1 µm (Figure 10B). When the initial coal sample temperature was 100 °C, 56% of the fracture aperture sizes were larger than 50 µm, and 16% of the fracture aperture sizes were between10–50 µm under Cryo-SEM observation. Although the largest aperture size for Cryo-SEM measurement (89.17 µm) was approximately the same with SEM measurement (85.21 µm), several fractures were narrowed. Fractures with aperture size larger than 50 µm reduced to 25% and the proportion for fracture width being 10–50 µm was increased to 46% through SEM analysis. Hence, it proves that some thermally generated fractures could narrow or even close after the rock sample returning warm. Cryo-SEM could provide a more accurate way to evaluate the performance of LN2 fracturing, especially at higher rock-LN2 temperature variance.
Figure 11 shows the fracture width distribution of sandstone samples exposed to LN2 observed by Cryo-SEM and SEM, respectively. The Cryo-SEM observation indicated that multi-scaled fractures were presented and with the growth of initial sandstone sample temperature, the proportion of larger fracture-width increased. Comparatively, SEM observation demonstrated that all of the identified fracture aperture sizes were within 0.1–0.5 µm when the initial rock temperatures were 25 °C and 100 °C. When the initial rock temperature was 200 °C, the Cryo-SEM results displayed that 14% fracture aperture-size was higher than 1 µm. However, the SEM showed that all of the identified fracture aperture sizes were less than 1 µm. Hence, this suggested that smaller-sized fractures closed and larger-sized fractures narrowed as the temperature returns to ambient.
The fracture width distribution of shale samples exposed to LN2 observed by Cryo-SEM and SEM were compared in Figure 12. There were neglected cracks that formed by LN2 thermal shock when the initial shale sample temperature was below 100 °C. When the initial shale sample temperature was 100 °C to 200 °C, fractures with aperture size of nano-meters presented under cryogenic in-situ conditions. When the initial shale sample temperature was higher than 300 °C, fractures with aperture size of several hundred nano-meters appeared. However, there were no fractures that were generated by LN2 thermal shock observed by the conventional SEM analysis, when the initial shale sample temperature was below 350 °C. Moreover, only small numbers of fractures with aperture sizes larger than 0.2 µm can be identified by the conventional SEM analysis when the initial shale sample temperature was 350 °C. As a consequence, same as for coal and sandstone samples, most of the fractures will narrow or even close when the shale sample warms back.
The fracture width distribution of granite samples exposed to LN2 observed by Cryo-SEM and SEM were compared in Figure 13. The Cryo-SEM observation proved that with the rise of initial granite sample temperature, the proportion of larger fracture-width increased. However, the conventional SEM observation presented that there were neglected cracks that formed by LN2 thermal shock when the initial granite sample temperature was below 200 °C. When the initial granite sample temperature was 200 °C, fractures with aperture sizes of 1–1.5 µm accounted for 31% and the proportion of 1.5–2.5 µm was 61%, and the remaining 8% portion was larger than 2.5 µm through Cryo-SEM analysis. However, the SEM showed that all of the identified fracture aperture sizes were less than 1 µm. When the initial granite sample temperature was 350 °C, 56% of fractures were shown with aperture sizes larger than 2.5 µm and 16% of fractures were shown with aperture sizes between 1.5 µm and 2.5 µm, under Cryo-SEM observation. Furthermore, the Cryo-SEM also indicated that fractures with aperture sizes of 1–1.5 µm accounted for 12% and the remaining 16% portion was smaller than 1 µm. Comparatively, the SEM observed that all of the identified fracture aperture sizes were less than 1 µm. It is noteworthy that the CT results suggested that the maximum fracture aperture size was 6.7 µm inside the granite sample (Figure 9), which was also smaller than that imaged by Cryo-SEM measurement (9.87 µm) on the sample surface. Hence, compared with coal samples, fractures were easier to narrow or close as the granite sample warms back. Consequently, fracture sizes on the crystalline rocks were more sensitive to the temperature change.
In summary, the fractures generated through cryogenic cooling tend to narrow or close when the rock samples are warmed back, especially for fractures at a nanometer scale or fractures generated on crystalline rocks such as granite. To accurately evaluate the stimulation performance during LN2 fracturing, especially at higher rock-LN2 temperature variance, cryo-SEM can provide a more precise way of assessment. This imaging technology allows examination of the samples in a frozen state, and therefore captures the true fracture geometry and distribution without the potential alterations that may occur during the warming process. Additionally, fractures or cracks, especially the smaller-sized fractures, that are generated by LN2 thermal shock tend to narrow or close as a rock sample warms back. To reduce the possibility of fracture closure when rock temperature rises, it is suggested that LN2 can be injected in a cyclic manner (i.e., cyclic stimulation) in the field application [23,25,47]. This is because cyclic LN2 cooling can trigger fatigue failure in rocks, exacerbating pre-existing or induced damage and inducing a more severe deterioration of the rock’s mechanical properties. Moreover, dynamic heating-cooling treatments can assist in widening the fracture aperture, promoting fracture connectivity and also inducing shear slippage of natural fractures. Another possible solution is to pump ultralightweight proppants (ULWP, specific gravities 1.06–2.0) during LN2 fracturing to avoid fracture closure [9]. ULWP proppants are chemically synthesized proppants consisting of a hardened core with multiple layers of outer resin coating [48]. According to the data, the utilization of ULWP has resulted in enhanced post-stimulation production rates over a period of time. This is particularly evident in the wells that underwent nitrogen foam fracturing in the Devonian shale formation [48,49].

4. Conclusions

In this paper, a novel method was presented to study the fracture patterns on rock samples that were induced by liquid nitrogen (LN2) quenching achieved by Cryo-SEM under cryogenic conditions. This direct-imaging technique enables researchers to investigate the in-situ distribution of pores and fractures on the rock surface at a temperature of −190 °C with a nano-scale resolution. Hence, fractures that were generated by LN2 quenching can be preserved and cryogenic fracturing efficiency can be evaluated. Following major conclusions can be drawn:
(1) The maximum fracture width of coal, sandstone, shale and granite were 89.17 µm, 1.29 µm, 0.028 µm and 2.12 µm when the temperature difference between LN2 and rock samples were 296 °C. LN2 thermal shock has better fracturing efficiency on coal and granite. The sensitivity of rocks to thermal shock can be attributed to a range of factors, including diagenesis, sedimentation, microstructure, mineral composition, and geomechanical properties.
(2) Different fracture morphology characteristics can be observed on different rock types under cryogenic conditions. Regarding coal, major fractures with branches tend to be formed and coal-LN2 temperature difference has a significant impact on the size of fracture width. In terms of sandstone, caused by high content of quartz and low mineral heterogeneity, fracture-networks with crushed pieces could be appeared if the initial sample temperature was higher than 100 °C. In terms of shale, due to its tight structure, cracks with nano-scales were presented, but bedding plane may impact the results. Concerning granite, with highly heterogeneous in mineral composition, inter-granular and intra-granular fractures were generally formed, and granite-LN2 temperature gradient has pronounced influences on fracture-network complexity and the size of fracture width.
(3) The cryogenically generated fractures tend to narrow or even close after the rock samples warm back, especially for the nanometer-scale fractures or fractures generated on the crystalline rocks, such as granite. Cryo-SEM could provide a more accurate way to evaluate the stimulation performance during LN2 fracturing, especially at higher rock-LN2 temperature variance, which contributes to our understanding of the liquid nitrogen fracturing mechanisms and may offer effective approaches for unconventional reservoirs stimulation.
(4) The thermally-induced fractures induced by pure cryogenic effects have the potential to assist in lowering breakdown pressure, generating enhanced permeability regions and forming complex fracture networks surrounding the borehole. Consequently, LN2 fracturing may represent a promising alternative for the sustainable development of tight reservoirs (especially coalbed methane and hot dry rock geothermal resources) in an efficient and environmentally acceptable manner.
(5) To reduce the drawbacks of fracture closure when the temperature rises, it is suggested that LN2 can be injected in a cyclic manner (i.e., cyclic stimulation) in the field application, so that dynamic and fatigue treatments can assist in promoting fracture connectivity and generating shear slippage of natural fractures.

Author Contributions

Methodology, formal analysis, writing—original draft preparation, Q.A.; writing—original draft preparation, investigation, C.H.; conceptualization, data curation, investigation, H.W. All authors have read and agreed to the published version of the manuscript.

Funding

This research was funded by the Research on Key Technologies for CUCBM’s Production of 6 Billion Cubic Meters (CNOOC-KJ 135 ZDXM 40) and Young Elite Scientists Sponsorship Program by CAST (2021QNRC001).

Data Availability Statement

No new data were created or analyzed in this study. Data sharing is not applicable to this article.

Acknowledgments

The authors would like to thank the Research on Key Technologies for CUCBM’s Production of 6 Billion Cubic Meters (CNOOC-KJ 135 ZDXM 40) and Young Elite Scientists Sponsorship Program by CAST (2021QNRC001) for financial support.

Conflicts of Interest

The authors declare no conflict of interest.

References

  1. Temizel, C.; Canbaz, C.H.; Gok, I.M.; Roshankhah, S.; Palabiyik, Y.; Deniz-Paker, M.; Gormez, E. A Thorough Review and Latest Advances in Shale Reservoirs: Seismic to Surveillance. In Proceedings of the SPE Latin American and Caribbean Petroleum Engineering Conference, Virtual, 27–31 July 2020. [Google Scholar]
  2. Watanabe, N.; Egawa, M.; Sakaguchi, K.; Ishibashi, T.; Tsuchiya, N. Hydraulic fracturing and permeability enhancement in granite from subcritical/brittle to supercritical/ductile conditions. Geophys. Res. Lett. 2017, 44, 5468–5475. [Google Scholar] [CrossRef]
  3. Yang, R.; Hong, C.; Liu, W.; Wu, X.; Wang, T.; Huang, Z. Non-contaminating cryogenic fluid access to high-temperature resources: Liquid nitrogen fracturing in a lab-scale Enhanced Geothermal System. Renew. Energy 2021, 165, 125–138. [Google Scholar] [CrossRef]
  4. Wang, L.; Yao, B.; Cha, M.; Alqahtani, N.B.; Patterson, T.W.; Kneafsey, T.J.; Miskimins, J.L.; Yin, X.; Wu, Y.-S. Waterless fracturing technologies for unconventional reservoirs-opportunities for liquid nitrogen. J. Nat. Gas Sci. Eng. 2016, 35, 160–174. [Google Scholar] [CrossRef] [Green Version]
  5. Moridis, G. Literature Review and Analysis of Waterless Fracturing Methods; (No. LBNL-1007287); Lawrence Berkeley National Lab. (LBNL): Berkeley, CA, USA, 2018. [Google Scholar]
  6. Wang, H.; Li, X.; Sepehrnoori, K.; Zheng, Y.; Yan, W. Calculation of the wellbore temperature and pressure distribution during supercritical CO2 fracturing flowback process. Int. J. Heat Mass Transf. 2019, 139, 10–16. [Google Scholar] [CrossRef]
  7. Yang, R.; Hong, C.; Huang, Z.; Wen, H.; Li, X.; Huang, P.; Liu, W.; Chen, J. Liquid Nitrogen Fracturing in Boreholes Under True Triaxial Stresses: Laboratory Investigation on Fractures Initiation and Morphology. SPE J. 2021, 26, 135–154. [Google Scholar] [CrossRef]
  8. Yao, B.; Wang, L.; Patterson, T.; Kneafsey, T.; Yin, X.; Wu, Y. Experimental study and modeling of cryogenic fracturing treatment of synthetic rock samples using liquid nitrogen under tri-axial stresses. In Proceedings of the SPE Unconventional Resources Conference., Calgary, AB, Canada, 15–16 February 2017. [Google Scholar]
  9. Cha, M.; Alqahtani, N.B.; Yao, B.; Yin, X.; Kneafsey, T.J.; Wang, L.; Wu, Y.-S.; Miskimins, J.L. Cryogenic fracturing of wellbores under true triaxial-confining stresses: Experimental investigation. SPE J. 2018, 23, 1271–1289. [Google Scholar] [CrossRef] [Green Version]
  10. Wen, H.-T.; Yang, R.-Y.; Jing, M.-Y.; Huang, Z.-W.; Hong, C.-Y.; Chen, J.-X.; Cong, R.-C. Rock mechanical properties of coal in cryogenic condition. Pet. Sci. 2023, 20, 407–423. [Google Scholar] [CrossRef]
  11. Yang, R.; Hong, C.; Wen, H.; Huang, Z.; Li, G.; Lan, T.; Wang, H.; Dubinya, N. Cyclic Liquid Nitrogen Fracturing Performance on Coal with Various Coal Ranks: Laboratory Investigation and Mechanism Analysis. SPE J. 2023, 1–23. [Google Scholar] [CrossRef]
  12. Yang, R.; Wen, H.; Huang, Z.; Zhang, B.; Wang, H.; Wang, B.; Dubinya, N. Experimental investigation on fracture characteristics by liquid nitrogen compound fracturing in coal. Fuel 2023, 340, 127434. [Google Scholar] [CrossRef]
  13. Hong, C.; Yang, R.; Huang, Z.; Qin, X.; Wen, H.; Cong, R.; Liu, W.; Chen, J. Fracture Initiation and Morphology of Tight Sandstone by Liquid Nitrogen Fracturing. Rock Mech. Rock Eng. 2022, 55, 1285–1301. [Google Scholar] [CrossRef]
  14. Wen, H.; Yang, R.; Lu, M.; Huang, Z.; Hong, C.; Cong, R.; Qin, X. Experimental comparisons of different cryogenic fracturing methods on coals. J. Pet. Sci. Eng. 2023, 220, 111250. [Google Scholar] [CrossRef]
  15. McDaniel, B.; Grundmann, S.R.; Kendrick, W.D.; Wilson, D.R.; Jordan, S.W. Field applications of cryogenic nitrogen as a hydraulic fracturing fluid. In Proceedings of the SPE Annual Technical Conference and Exhibition, San Antonio, TX, USA, 5–8 October 1997. [Google Scholar]
  16. Grundmann, S.R.; Rodvelt, G.D.; Dials, G.A.; Allen, R.E. Cryogenic nitrogen as a hydraulic fracturing fluid in the devonian shale. In Proceedings of the SPE Eastern Regional Meeting, Pittsburgh, PA, USA, 9–11 November 1998. [Google Scholar]
  17. Zhang, S.; Huang, Z.; Zhang, H.; Guo, Z.; Wu, X.; Wang, T.; Zhang, C.; Xiong, C. Experimental study of thermal-crack characteristics on hot dry rock impacted by liquid nitrogen jet. Geothermics 2018, 76, 253–260. [Google Scholar] [CrossRef]
  18. Yang, R.; Huang, Z.; Shi, Y.; Yang, Z.; Huang, P. Laboratory investigation on cryogenic fracturing of hot dry rock under triaxial-confining stresses. Geothermics 2019, 79, 46–60. [Google Scholar] [CrossRef]
  19. Zhang, H.; Huang, Z.; Zhang, S.; Yang, Z.; Mclennan, J.D. Improving heat extraction performance of an enhanced geothermal system utilizing cryogenic fracturing. Geothermics 2020, 85, 101816. [Google Scholar] [CrossRef]
  20. Hong, C.-Y.; Yang, R.-Y.; Huang, Z.-W.; Zhuang, X.-Y.; Wen, H.-T.; Hu, X.-L. Enhance liquid nitrogen fracturing performance on hot dry rock by cyclic injection. Pet. Sci. 2023, 20, 951–972. [Google Scholar] [CrossRef]
  21. Cai, C.; Li, G.; Huang, Z.; Shen, Z.; Tian, S.; Wei, J. Experimental study of the effect of liquid nitrogen cooling on rock pore structure. J. Nat. Gas Sci. Eng. 2014, 21, 507–517. [Google Scholar] [CrossRef]
  22. Qin, L.; Zhai, C.; Liu, S.; Xu, J.; Tang, Z.; Yu, G. Failure mechanism of coal after cryogenic freezing with cyclic liquid nitrogen and its influences on coalbed methane exploitation. Energy Fuels 2016, 30, 8567–8578. [Google Scholar] [CrossRef]
  23. Wu, X.; Huang, Z.; Cheng, Z.; Zhang, S.; Song, H.; Zhao, X. Effects of cyclic heating and LN2-cooling on the physical and mechanical properties of granite. Appl. Therm. Eng. 2019, 156, 99–110. [Google Scholar] [CrossRef]
  24. Akhondzadeh, H.; Keshavarz, A.; Al-Yaseri, A.Z.; Ali, M.; Awan, F.U.R.; Wang, X.; Yang, Y.; Iglauer, S.; Lebedev, M. Pore-scale analysis of coal cleat network evolution through liquid nitrogen treatment: A Micro-Computed Tomography investigation. Int. J. Coal Geol. 2020, 219, 103370. [Google Scholar] [CrossRef]
  25. Yan, H.; Tian, L.; Feng, R.; Mitri, H.; Chen, J.; He, K.; Zhang, Y.; Yang, S.; Xu, Z. Liquid nitrogen waterless fracking for the environmental protection of arid areas during unconventional resource extraction. Sci. Total Environ. 2020, 721, 137719. [Google Scholar] [CrossRef]
  26. Zhang, L.; Chen, S.; Zhang, C.; Fang, X.; Li, S. The characterization of bituminous coal microstructure and permeability by liquid nitrogen fracturing based on μCT technology. Fuel 2020, 262, 116635. [Google Scholar] [CrossRef]
  27. Li, Y.; Huang, W.; Li, Y.; Chiu, W.; Cui, Y. Opportunities for Cryogenic Electron Microscopy in Materials Science and Nanoscience. ACS Nano 2020, 14, 9263–9276. [Google Scholar] [CrossRef] [PubMed]
  28. Qian, H.; Zhao, X.; Yan, R.; Yao, X.; Yan, N. Structural basis for catalysis and substrate specificity of human ACAT1. Nature 2020, 581, 333–338. [Google Scholar] [CrossRef] [PubMed]
  29. Nogales, E. The development of cryo-EM into a mainstream structural biology technique. Nat. Methods 2016, 13, 24–27. [Google Scholar] [CrossRef] [Green Version]
  30. Fernandez-Leiro, R.; Scheres, S.H.W. Unravelling biological macromolecules with cryo-electron microscopy. Nature 2016, 537, 339–346. [Google Scholar] [CrossRef] [Green Version]
  31. Cressey, D.; Callaway, E. Cryo-electron microscopy wins chemistry Nobel. Nature 2017, 550, 167. [Google Scholar] [CrossRef] [Green Version]
  32. Wang, J.; Huang, W.; Pei, A.; Li, Y.; Shi, F.; Yu, X.; Cui, Y. Improving cyclability of Li metal batteries at elevated temperatures and its origin revealed by cryo-electron microscopy. Nat. Energy 2019, 4, 664–670. [Google Scholar] [CrossRef]
  33. Lin, Z.; Hill, R.M.; Davis, H.T.; Scriven, L.E.; Talmon, Y. Cryo transmission electron microscopy study of vesicles and micelles in siloxane surfactant aqueous solutions. Langmuir 1994, 10, 1008–1011. [Google Scholar] [CrossRef]
  34. Won, Y.Y.; Brannan, A.K.; Davis, H.T.; Bates, F.S. Cryogenic Transmission Electron Microscopy (Cryo-Tem) of Micelles and Vesicles Formed in Water by Poly(Ethylene Oxide)-Based Block Copolymers. J. Phys. Chem. B 2002, 106, 3354–3364. [Google Scholar] [CrossRef]
  35. Cheng, Y.; Grigorieff, N.; Penczek, P.A.; Walz, T. A primer to single-particle cryo-electron microscopy. Cell 2015, 161, 438–449. [Google Scholar] [CrossRef] [Green Version]
  36. Sutanto, E.; Davis, H.T.; Scriven, L.E. Liquid Distributions in Porous Rock Examined by Cryo Scanning Electron Microscopy. In Proceedings of the SPE Annual Technical Conference and Exhibition, New Orleans, LA, USA, 23–26 September 1990. [Google Scholar]
  37. Henderson, R. Avoiding the pitfalls of single particle cryo-electron microscopy: Einstein from noise. Proc. Natl. Acad. Sci. USA 2013, 110, 18037–18041. [Google Scholar] [CrossRef]
  38. Li, Y.; Li, Y.; Pei, A.; Yan, K.; Sun, Y.; Wu, C.-L.; Joubert, L.-M.; Chin, R.; Koh, A.L.; Yu, Y. Atomic structure of sensitive battery materials and interfaces revealed by cryo–electron microscopy. Science 2017, 358, 506–510. [Google Scholar] [CrossRef] [Green Version]
  39. Mann, U.; Neisel, J.D.; Burchard, W.G.; Heinen, V.; Welte, D.H. Fluid-rock interfaces as revealed by cryo-scanning electron microscopy. First Break 1994, 12, 131–134. [Google Scholar] [CrossRef]
  40. Fassi-Fihri, O.; Robin, M.; Rosenberg, E.J.S.F.E. Wettability Studies at the Pore Level: A New Approach by the Use of Cryo-Scanning Electron Microscopy. SPE Form. Eval. 1995, 10, 11–19. [Google Scholar]
  41. Desbois, G.; Urai, J.L.; Kukla, P.A.; Konstanty, J.; Baerle, C. High-resolution 3D fabric and porosity model in a tight gas sandstone reservoir:A new approach to investigate microstructures from mm- to nm-scale combining argon beam cross-sectioning and SEM imaging. J. Pet. Sci. Eng. 2011, 78, 243–257. [Google Scholar] [CrossRef]
  42. Schmatz, J.; Klaver, J.; Jiang, M.; Urai, J.L. Nanoscale Morphology of Brine-Oil-Mineral Contacts in Connected Pores of Carbonate Reservoirs: Insights on Wettability from Cryo-BIB-SEM. SPE J. 2017, 22, 1374–1384. [Google Scholar] [CrossRef]
  43. Sheng, M.; Wang, H.; Yang, R.; Yang, B. Chapter Six—Experimental methods in fracturing mechanics focused on minimizing their environmental footprint. In Sustainable Natural Gas Reservoir and Production Engineering; Wood, D.A., Cai, J., Eds.; Gulf Professional Publishing: Houston, TX, USA, 2022; Volume 1, pp. 143–182. [Google Scholar]
  44. Hao, Z.; Xiangyi, Y. The Experiments Study of Tight Gas Sandstone Permeability by Effective Stress and Temperature Coupling. Phys. Numer. Simul. Geotech. Eng. 2017, 26, 58–61. [Google Scholar]
  45. Wu, X.; Huang, Z.; Zhang, S.; Cheng, Z.; Li, R.; Song, H.; Wen, H.; Huang, P. Damage analysis of high-temperature rocks subjected to LN 2 thermal shock. Rock Mech. Rock Eng. 2019, 52, 2585–2603. [Google Scholar] [CrossRef]
  46. Igarashi, G.; Maruyama, I.; Nishioka, Y.; Yoshida, H. Influence of mineral composition of siliceous rock on its volume change. Constr. Build. Mater. 2015, 94, 701–709. [Google Scholar] [CrossRef]
  47. Hofmann, H.; Zimmermann, G.; Zang, A.; Min, K.-B. Cyclic soft stimulation (CSS): A new fluid injection protocol and traffic light system to mitigate seismic risks of hydraulic stimulation treatments. Geotherm. Energy 2018, 6, 27. [Google Scholar] [CrossRef] [Green Version]
  48. Kendrick, D.; Puskar, M.; Schlotterbeck, S.T. Ultralightweight Proppants: A Field Study in the Big Sandy Field of Eastern Kentucky. In Proceedings of the SPE Eastern Regional Meeting, Morgantown, WV, USA, 14–16 September 2005. [Google Scholar]
  49. Bestaoui-Spurr, N.; Li, C. Ultra-Light Weight Proppants for Better Placement. In Proceedings of the SPE Annual Technical Conference and Exhibition, Dallas, TX, USA, 24–26 September 2018. [Google Scholar]
Figure 1. Mineral contents of four types of rock samples.
Processes 11 02038 g001
Figure 2. Sketch illustrating the Cryo-SEM method [3] (Reproduced with permission from Chunyang Hong, Renewable Energy, published by Elsevier, 2021).
Processes 11 02038 g002
Figure 3. Fracture morphology of coals. (A) Standard SEM image; (B) Cryo-SEM images, initial sample temperature = 25 °C. (C) Cryo-SEM images, initial sample temperature = 50 °C. (D) Cryo-SEM images, initial sample temperature = 100 °C. Note: the colored frames indicate the magnified section of the corresponding rectangular area.
Processes 11 02038 g003
Figure 4. Fracture morphology of sandstone. (A) Standard SEM image; (B) Cryo-SEM images, initial sample temperature = 25 °C. (C) Cryo-SEM images, initial sample temperature = 50 °C. (D) Cryo-SEM images, initial sample temperature = 100 °C. (E) Cryo-SEM images, initial sample temperature = 200 °C. Note: the colored frames indicate the magnified section of the corresponding rectangular area.
Processes 11 02038 g004
Figure 5. Fracture morphology of shale. (A) Standard SEM image; (B) Cryo-SEM image, initial sample temperature = 25 °C. (C) Cryo-SEM image, initial sample temperature = 100 °C. (D) Cryo-SEM images, initial sample temperature = 200 °C. (E) Cryo-SEM image, initial sample temperature = 300 °C. (F) Cryo-SEM images, initial sample temperature = 350 °C. Note: the colored frames indicate the magnified section of the corresponding rectangular area.
Processes 11 02038 g005
Figure 6. Fracture morphology of granite. (A) Standard SEM image; (B) Cryo-SEM images, initial sample temperature = 25 °C. (C) Cryo-SEM images, initial sample temperature = 100 °C. (D) Cryo-SEM images, initial sample temperature = 200 °C. (E) Cryo-SEM images, initial sample temperature = 350 °C.
Processes 11 02038 g006
Figure 7. Correlations of the maximum fracture width with the temperature difference between LN2 and rock initial temperature. (A) coal samples; (B) sandstone samples; (C) shale samples; (D) granite samples.
Processes 11 02038 g007
Figure 8. CT scanning results of the coal sample (initial temperature was 100 °C) for post-LN2-treatment. (A) 2D slices of coal: pores and fractures, minerals (white and light grey) and organic matrix (grey); (B) 3D pores and fracture networks reconstruction. Left: void space (purple), organic matrix (grey) and minerals (white and light grey); Right: the image of void space, each color signals an isolated pore or fracture, the total volume percent of void space is 0.92%.
Processes 11 02038 g008
Figure 9. CT scanning results of granite (initial temperature was 350 °C) for post-LN2-treatment. (A) 2D slices of granite: pores and fractures, minerals (white and light grey) and organic matrix (grey); (B) 3D pores and fracture networks reconstruction. Left: void space (purple), organic matrix (grey) and minerals (white and light grey); Right: the image of void space, each color signals an isolated pore or fracture, the total volume percent of void space is 0.49%.
Processes 11 02038 g009
Figure 10. Fracture width distribution of coal samples for post-LN2-treatment. (A) Cryo-SEM; (B) SEM.
Processes 11 02038 g010
Figure 11. Fracture width distribution of sandstone samples for post-LN2-treatment. (A) Cryo-SEM; (B) SEM.
Processes 11 02038 g011
Figure 12. Fracture width distribution of shale samples for post-LN2- treatment. (A) Cryo-SEM; (B) SEM.
Processes 11 02038 g012
Figure 13. Fracture width distribution of granite samples for post-LN2- treatment. (A) Cryo-SEM; (B) SEM.
Processes 11 02038 g013
Table 1. Overview of experimental materials, settings and methods.
Test No.Rock TypeInitial Temperature (°C)Scanning Method
1Coal25Standard SEM
2Coal25~100Cryo-SEM
3Sandstone25Standard SEM
4Sandstone25~200Cryo-SEM
5Shale25Standard SEM
6Shale25~350Cryo-SEM
7Granite25Standard SEM
8Granite25~350Cryo-SEM
9Coal100 CT
10Granite350CT
Table 2. Uniaxial thermal expansion coefficient.
MineralValue (×10−6/°C)
Quartz15, 16.6, 24.3
Microcline6, 5.2, 5.3
Orthoclase5.1, 3.2, 2
Anorthite5, 7.5
Albite7.5, 8.9
Calcite6.7
Dolomite7.6
Pyrite11.3, 8.6
Chlorite10.4
Disclaimer/Publisher’s Note: The statements, opinions and data contained in all publications are solely those of the individual author(s) and contributor(s) and not of MDPI and/or the editor(s). MDPI and/or the editor(s) disclaim responsibility for any injury to people or property resulting from any ideas, methods, instructions or products referred to in the content.

