Article

Removal of Organic Contaminants in Gas-to-Liquid (GTL) Process Water Using Adsorption on Activated Carbon Fibers (ACFs)

1
Department of Chemical Engineering, College of Engineering, Qatar University, Doha P.O. Box 2713, Qatar
2
Gas Processing Center, Qatar University, Doha P.O. Box 2713, Qatar
*
Author to whom correspondence should be addressed.
Processes 2023, 11(7), 1932; https://doi.org/10.3390/pr11071932
Submission received: 1 June 2023 / Revised: 17 June 2023 / Accepted: 21 June 2023 / Published: 27 June 2023

Abstract

:
Gas-To-Liquid (GTL) processing involves the conversion of natural gas to liquid hydrocarbons that are widely used in the chemical industry. In this process, the Fischer–Tropsch (F-T) approach is utilized and, as a result, wastewater is produced as a by-product. This wastewater commonly contains alcohols and acids as contaminants. Prior to discharge, the treatment of this wastewater is essential, and biological treatment is the common approach. However, this approach is not cost effective and poses various waste-related issues. Due to this, there is a need for a cost-effective treatment method. This study evaluated the adsorption performance of activated carbon fibers (ACFs) for the treatment of GTL wastewater. The ACF in this study exhibited a surface area of 1232.2 m2/g, which provided a significant area for the adsorption to take place. Response surface methodology (RSM) under central composite design was used to assess the effect of GTL wastewater’s pH, initial concentration and dosage on the ACF adsorption performance and optimize its uptake capacity. It was observed that ACF was vitally affected by the three studied factors (pH, initial concentration and dosage), where optimum conditions were found to be at a pH of 3, 1673 mg/L initial concentration and 0.03 g of dosage, with an optimum uptake of 250 mg/L. Kinetics and isotherm models were utilized to fit the adsorption data. From this analysis, it was found that adsorption was best described using the pseudo-second order and Freundlich models, respectively. The resilience of ACF was shown in this study through conducting a regeneration analysis, as the results showed high regeneration efficiency (~86%) under acidic conditions. The results obtained from this study show the potential of using ACF under acidic conditions for the treatment of industrial GTL wastewater.

1. Introduction

To counteract climate change, there has been a vast focus on the Fischer–Tropsch (F-T) process to produce liquid hydrocarbon products [1]. This is reasoned for F-T’s ability to operate at lower carbon dioxide (CO2) emissions than regular fossil fuel production processes [2]. Along with that, fossil fuels from the F-T process have lower contents of sulfur and aromatics in comparison to fossil fuels from conventional processes [3]. These lower contents are advantageous towards the environment [2] as they are favored by end-users [4]. However, there is a side effect of this process, where wastewater is produced as a by-product in huge quantities [5], and this by-product is expected to grow even further [6,7].
Wastewater produced from the F-T process is known as Gas-To-Liquid (GTL) water [8]. For every ton of liquid fuel obtained from the F-T process, 1–1.3 tons of wastewater is produced as a by-product. The source of this GTL wastewater is mainly from the reaction units [9], and this water mainly contains dissolved organic matter. This organic matter is usually constituted of acids, alcohols, acetates, ketones and aldehydes [10,11]. The adversity of the presence of these contaminants is usually portrayed through measuring their chemical oxygen demand (COD) or total organic carbon (TOC) [12,13]. Commonly, the COD of GTL wastewater mixture consists of 76% and 10% of short- and long-chain alcohols, respectively, with the rest being acids and hydrocarbons [8]. Due to the organic mixed nature of this wastewater, there are limited treatment approaches. Given that, the conventional treatment approach is anaerobic biodegradation. This treatment in the GTL process does not achieve complete removal of these contaminants before discharge [14,15,16]. Hence, there is a need to explore new methods to achieve better removal levels, where discharge regulations are expected to become even sterner [7].
As the current treatment method delivers undesirable removal, a more robust treatment approach is needed to achieve better treatment of GTL wastewater. Advanced biological treatment methods for contaminant removal have been of interest in the literature to enhance the current treatment approach [8]. Such methods were observed to be cell immobilization [17,18] and bio-nanotechnology [19,20]. Regardless of their effectiveness, these methods exhibit several drawbacks. These drawbacks were reported to be mainly cost related, linked to the cost of chemicals and the considerable solid waste produced [8,21]. Based on this, a low-cost approach with less waste and appealing removal is needed for GTL wastewater treatment.
Although the literature is mostly focused on developing advanced aerobic biological methods, exploring alternative cost-effective treatment methods is of value to enhance GTL wastewater treatment. Such methods need to be able to tackle various contaminants at the same time, while exhibiting minimal solid waste and operational costs. From the different methods of treatment discussed in the literature for wastewater treatment, adsorption is known to bring in these attributes: low cost and waste [22,23]. In addition to that, the best material reported to exhibit these attributes using the adsorption technique is known to be activated carbon [6]. This is due to its high efficiency and reusability, as it is reported to last for several adsorption cycles through means of regeneration [6,24]. Based on the advantages brought by activated carbon and the lack of work on GTL wastewater adsorption in the literature, there is a need to explore this area as it is of great economic value. Hence, the objective of this study is to investigate the effectiveness of inexpensive activated carbon fibers (ACFs) for the treatment of GTL wastewater as an inexpensive alternative method to costly biological treatment. To report the output of this investigation, the ACF was characterized and tested against actual GTL wastewater using different investigation approaches. These approaches consisted of response surface methodology (RSM) to determine the optimal conditions for the adsorption medium, equilibrium studies that were used to discuss the adsorption mechanism and a regeneration study to report the recyclable nature of the ACF used.

2. Materials and Method

2.1. Materials

GTL wastewater samples for the study were collected from a local GTL plant. The main characteristics of this water have been reported in a previous study by Surkatti et al. [25]. To ensure the stability of the system, the GTL wastewater samples were pretreated using aeration to remove any volatile organic components such as short-chain alcohols. Analysis of the GTL wastewater is shown in Figure 1.

2.2. Adsorbents

Activated carbon fibers (ACFs), obtained from Zhejiang Xingda in China, were utilized as adsorbent materials. The ACF was selected based on a screening process, where several types of adsorbents were tested for the removal of organic pollutants in GTL wastewater. These adsorbents are as shown in Table 1. Out of these types, ACF showed superior performance in terms of reducing the COD and TOC content.

2.3. Activated Carbon Fibers Characterization

To characterize the ACF, functional groups were obtained using transform infrared spectroscopy (FTIR) analysis that was performed on a range from 400 to 5000 cm−1. Transmission electron microscopy (TEM—EDX) was used to observe the internal form of the adsorbent using Transmission Electron Microscopy Model: TECNAI G2 TEM, TF20, Thermo Fisher Scientific, Waltham, MA, USA. The choice of TEM instead of the SEM is due to the sample size. Depending on the sample size, it was reported by many studies that it is ideal to use TEM to view the internal details of the adsorbent [27,28,29,30]. The X-ray diffraction (XRD) trims were obtained using Rigaku MiniFlex-600 equipped with a Cu X-ray tube. The readings from the device provide diffraction peaks that define the structures present using their distinct fingerprint. The intensity and width of the peak can be used to identify the quantity of the structures present. Surface area and pore volume were obtained using Brunauer Emmett Teller (BET, Micromeritics, Tristar II series, USA).

2.4. Batch Adsorption and Response Surface Methodology

For the adsorption studies, a shaker of Labnet model was used. This shaker was used at a 200 rpm rotational speed and 293 K temperature for all the experiments. The factors under investigation consisted of GTL wastewater pH and initial concentration, in addition to adsorbent dosage. GTL wastewater of 50 mL in a sealed jar was used in all the batch experiments unless it is otherwise mentioned. For each experiment where an adsorbent was inserted into the GTL wastewater, a corresponding GTL wastewater of the same concentration without an adsorbent was placed in the shaker. This was performed to unify the conditions where concentration readings are taken. The concentration readings are measured with an HAC—UV spectrophotometer using COD reagents. The samples were inserted into HAC LCK514 cuvettes and were heated for 2 h to ensure the completion of the reaction between the GTL wastewater sample and the reagent. The cuvettes were then transferred to HAC 3900 to measure the COD content that is reported in milligrams per liter (mg/L).
These concentration measurements are used to quantify the uptake capacity using Equation (1). This is to show the effect of the GTL wastewater pH, initial concentration and ACF dosage.
q e = C i C e m   V
where qe is the adsorption capacity in milligrams per gram (mg/g), Ci is the initial concentration in mg/L, Ce is the equilibrium capacity in mg/L, V is the volume of the adsorption system in L and m is the mass of the ACF adsorbent.
The factors under investigation were three, and they are as shown in Table 2. The Minitab software generated 20 experimental runs under central-composite type of design. The results obtained from the RSM analysis were fitted using a polynomial shown in Equation (2) to acquire the investigated factors at their optimized conditions.
Y = β 0 + i = 1 4 β i X i + i = 1 4   j = 1 4 ( β i X i X j ) + i = 1 4 β i i X i 2 +                          
where Y is the measured response (adsorption capacity—qe); β0, βi, βij and βii are the coordinates of constant, linear, interaction and quadratic, respectively. Xi is the independent factor that affects the measured response and ℇ is the error posed by the model. To gain the interactions between the factors and the measured response, analysis of variance (ANOVA) was utilized. The significance of the factors in the model on the response was assessed using the Fisher value ratio (F-value) and probability value (p-value) and the correlation between them was constructed based on the correlation coefficient (R2).
Based on the results obtained, another set of 12 experimental RSM runs was conducted for two factors to confirm the results obtained from the first RSM. The runs obtained are under the same levels and they are shown in Table 3.

2.5. Kinetic and Isotherm Modeling

For reporting the kinetic behavior of the GTL wastewater adsorption system, the adsorption process was conducted at room temperature, using 250 mL of GTL at 1000 ppm concentration. The pH was set at the original pH conditions which are (3.2) of 1000 ppm. A total of 0.25 g of ACF was used in the system, and a 10–180 min of contact time was considered. The output of this experiment was assessed using the below models.
Pseudo - first   order :   q t = q e 1 e k 1 t
Pseudo - second   order :   q t = k 2   q e 2   t 1 + k 2 q e t
Intraparticle   diffusion :   q t = K i n t t
where qt is the uptake capacities of the ACF at the time of measurement in (mg/g), qe is the equilibrium uptake capacity qe in (mg/g) of the ACF where t is the time of the measurement (min). k1 is the rate of adsorption factor (min−1), k2 is the rate constant of the Pseudo-second order model (g/mg.min), Kint is the intraparticle diffusion constant (mg/g min0.5) [31,32].
In order to obtain the adsorption isotherms, batch experiments were carried out for a duration of 24 h. These experiments were conducted at room temperature, where an ACF dosage of 0.1 g was used in a 100 mL volume of GTL wastewater. The initial concentration of the GTL wastewater ranged between 300–1640 ppm and the output of these runs were fitted using the below models.
Langmuir :   q e = q m k 1 C e 1 + k 1 C e
Freundlich :   q e = k f C e 1 n
Exponential :   q e = a   1 e e b C e
Dubinin - Radushkevick   ( D - R ) :   q e   = q e exp β   R T l n   1 + 1 C e   2 ,   E = 1 2 β  
where qe is the uptake capacity of ACF at equilibrium in mg/g, qm is the maximum uptake capacity in mg/g, k1 is the Langmuir isotherm constant in L/mg, kf is the Freundlich constant in mg/g (L/g)n, 1/n is the heterogeneity factor, a and b are the exponential isotherm model constants in mg/g and g/mg, respectively, β is the activity coefficient of the D-R model in mol2/kJ2, R is the gas constant, T is the absolute temperature in (K) and E is the free energy of sorption in kJ/mol [33,34].

2.6. ACF Regeneration

The ACF adsorbents were regenerated using ethanol, which has been reported to achieve the best performance for the regeneration of activated carbon [35] (El-Naas et al., 2010). A specific mass of the saturated adsorbent (about 0.1 g) was tested in a series of batch experiments with 1000 ppm COD GTL wastewater. After each batch experiment, the uptake capacity is calculated and ACF was treated with 100 mL of 100% ethanol and placed on the shaker for a period of 2 h. The ACF was washed using distilled water and later dried in the oven at 105 °C for 24 h. The results from these runs are then translated into regeneration efficiency that is described below:
R e g e n e r a t i o n   E f f i c i e n c y   % = q r q 1   100 %
where q1 is the uptake capacity in mg/g obtained from the first cycle of batch adsorption and qr is the uptake capacity in the succeeding cycles in mg/g.

3. Results and Discussion

3.1. TEM—EDX and BET Analysis

Figure 2 shows the TEM imaging for the ACF used in this study. From the figure, it can be seen that the activated carbon fibers are cylindrical in shape, which is similar to other fibrous activated carbon used in the literature [27,28]. In addition, the surface of the adsorbent shown is rough, as indicated by the stripes in Figure 2b. These stripes enable the adsorbent to enhance the trapping of small organic molecules [36,37], and this serves the objective of this study: removing organic material from GTL wastewater. With the rough surfaces, various smears are observed on the ACF. These indicate the modification of the adsorbent, where similar smear patterns were observed in the literature [38,39,40]. This confirms the treatment of the ACF shown in the map—EDX in 
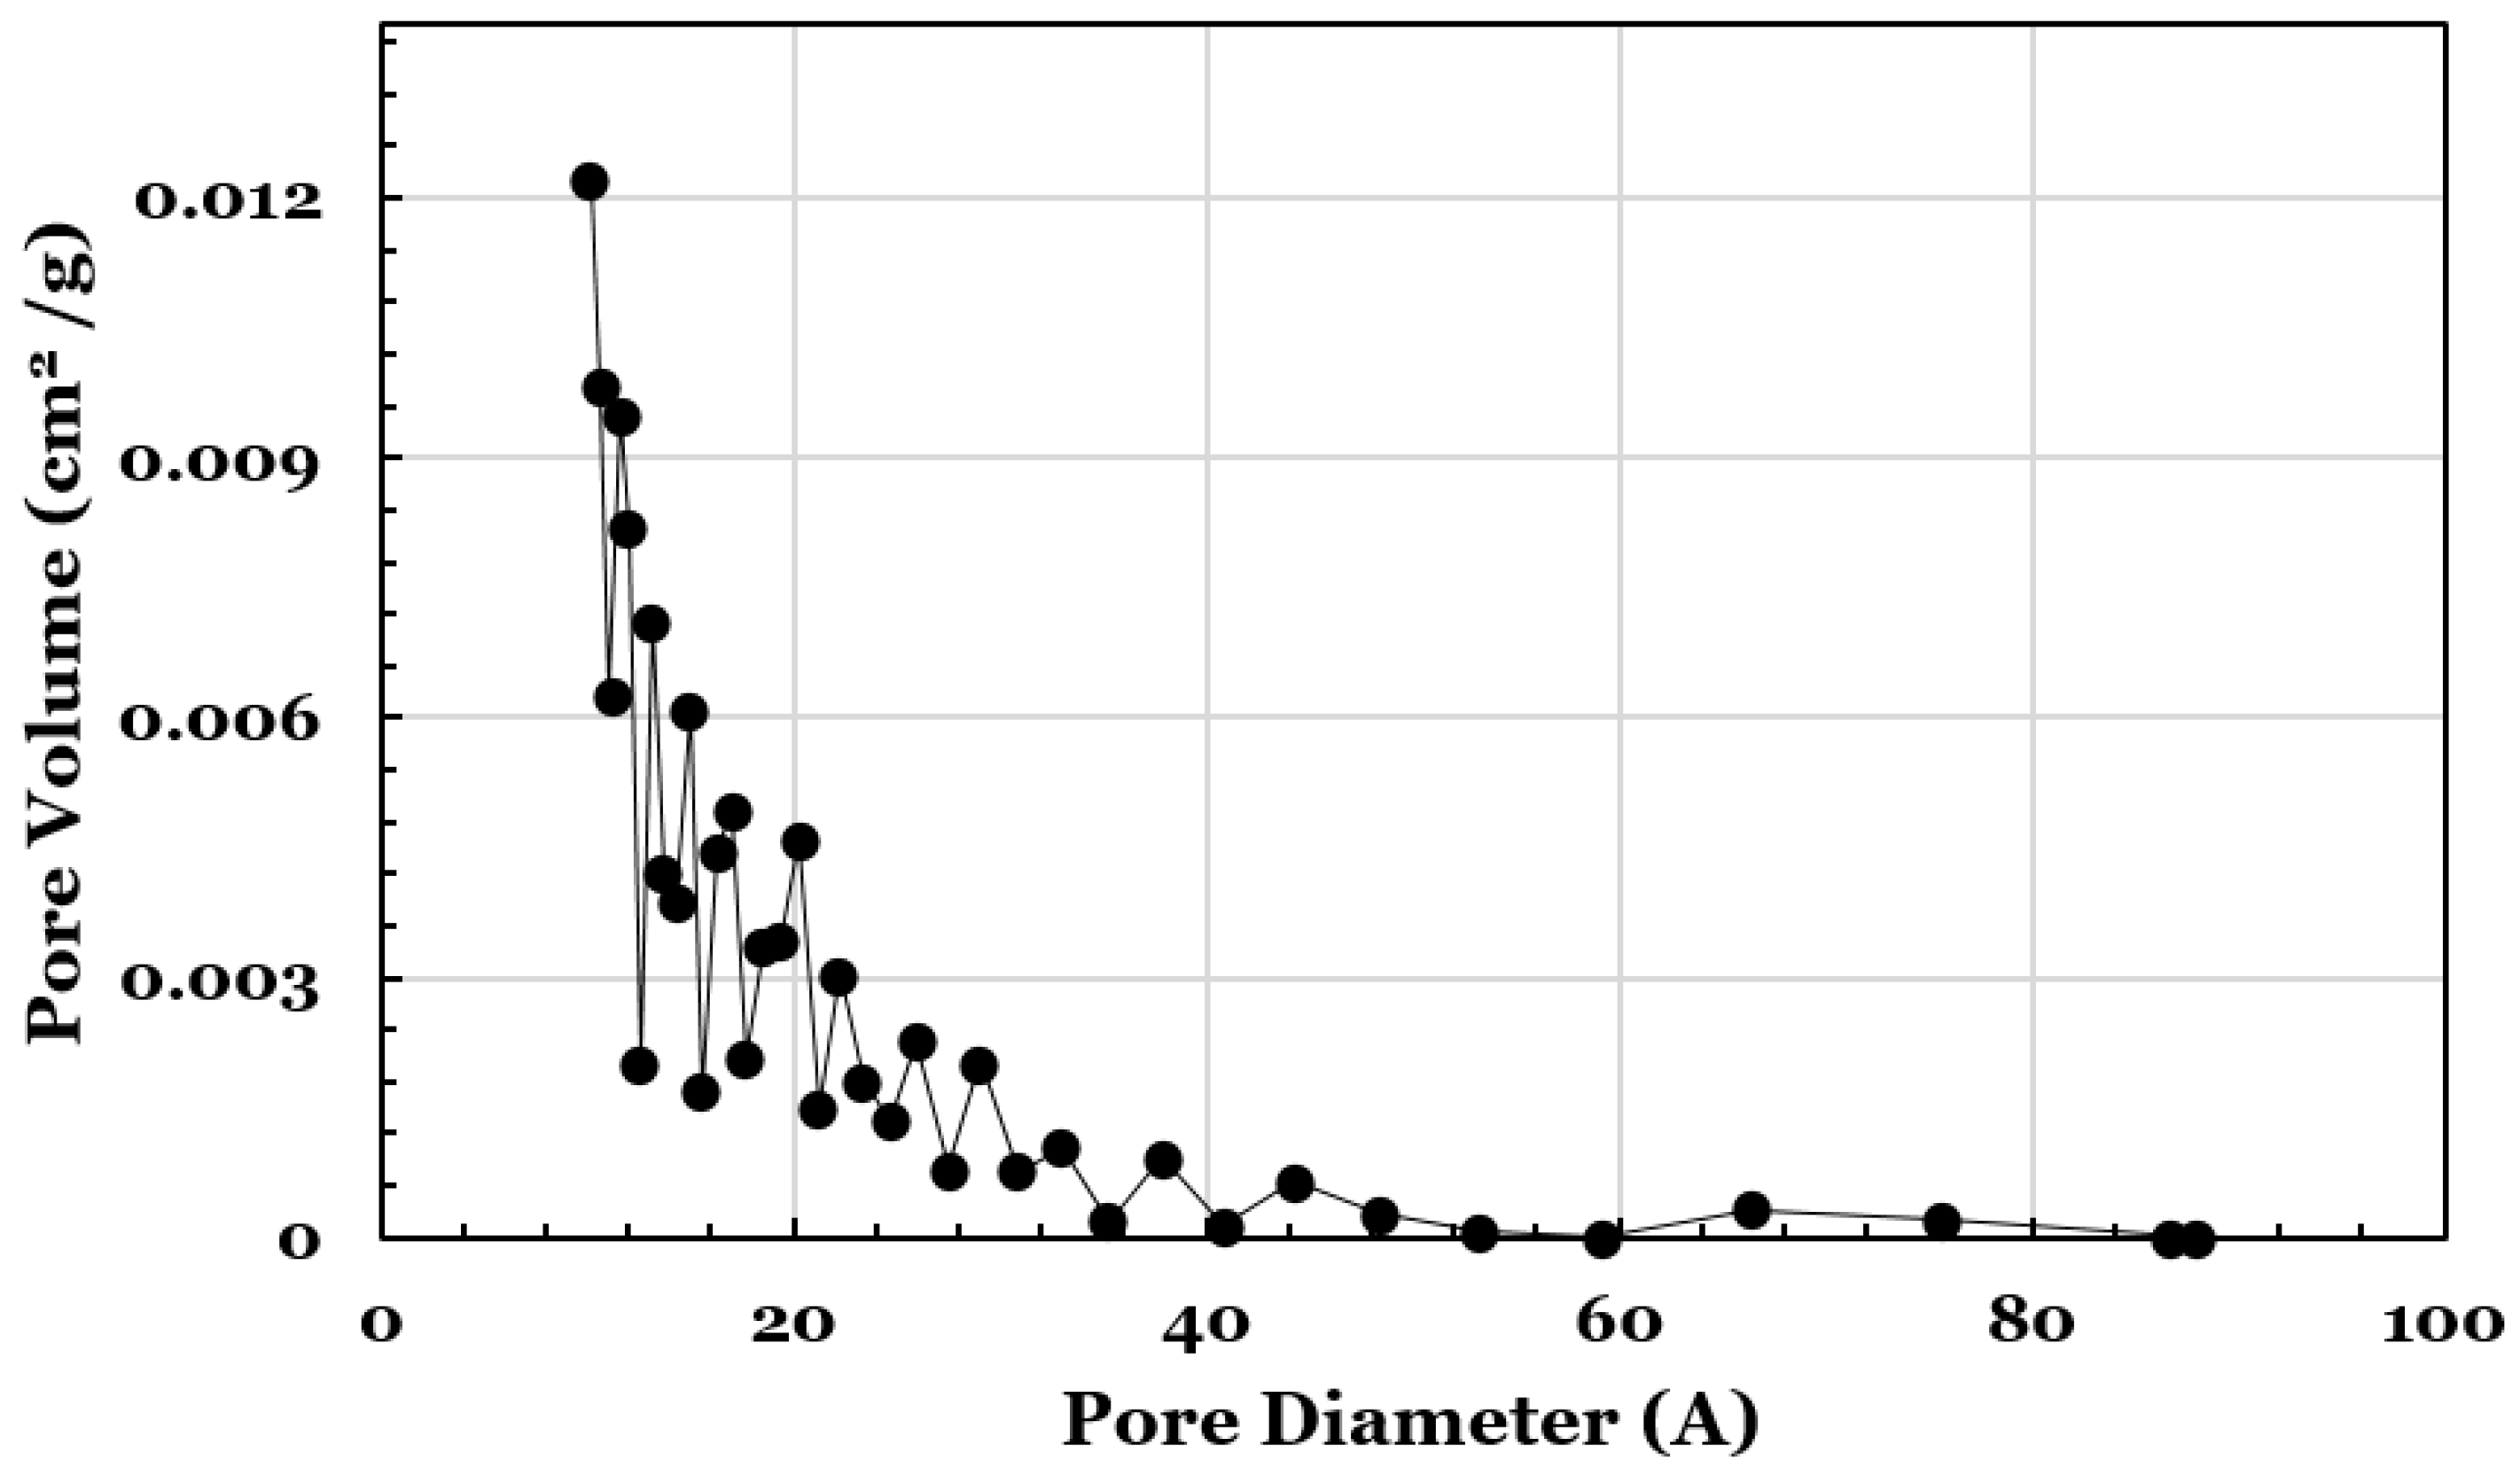
Figure 3. From this map, it is seen that the used ACF consists of 87.97, 10.08 and 1.95 wt% of carbon, oxygen and phosphorous, respectively. In addition to this, the BET analysis revealed a surface area of 1232.3 m2/g and BET average pore diameter of 21.4 A. The distribution of the BET pore volume is shown in Figure 4.

3.2. X-ray Diffraction Analysis (XRD)

In addition to the discussed ACF characteristic analysis above, the ACF has undergone an XRD analysis. The results from this analysis confirmed the characterization of this study’s adsorbent as fibrous activated carbon (ACF) when compared to the ACF XRD readings present in the literature [41,42]. The XRD reading in Figure 5 shows two broad diffraction peaks that correspond to 23° and 43.4°. These two peaks are representations of the 002 and 100 reflections of carbon that are observed in other studies [43,44]. These two planes confirm the presence of amorphous carbon in the adsorbent used in this study [45].

3.3. RSM Analysis of Statistical Model

RSM is a widely used method in the experimental field to design tests for obtaining desired optimized conditions using a set of experiments. These experimental sets are obtained through stating key variables, in which they are optimized to reach the maximum desirable response [46,47]. As stated in the methods section, the response here is the uptake of contaminants in GTL wastewater. Using the RSM results for the experiments, at the specified conditions, the maximum observed uptake was 111 mg/g while the minimum case was where no uptake took place. From these results and the proposed independent factors, the obtained mathematical equation is as shown below:
U p t a k e = 171.8 34.65   p H + 0.0975 C i 568 D o s a g e + 1.599 p H 2 0.000017 C i 2 + 436 D o s a g e 2 0.0035 p H   C i + 51.6 p H   D o s a g e 0.0402 C i D o s a g e    
To learn about the importance level of the model, ANOVA is utilized as a method that is generated after analyzing the RSM output. From the ANOVA, the p-value and F-value are obtained, in which they represent the adequacy of the model through being small and large in value, respectively [48]. As shown in Table 4, the metric to measure the significance of the variables was the p-value < 0.05 along with the F-value < 247.7 for DF 1 or <8.667 for DF 3. This shows that the model obtained poses a 95% level of confidence for the experimental data, hence its adequacy. Furthermore, for the three tested factors, the p-value and the F-value obtained showed that their effect on the uptake is significant. All the interactions in the model were observed to be significant as well. To determine the quality of the model, the correlation coefficient (R2) is used as an indication. For the model shown in Equation (11), the obtained R2 was 0.9341 and this shows the strength of the model in determining the uptake of GTL wastewater contaminants using the independent factors.
In order to obtain a comprehensive view of the RSM model using the stated experimental conditions, the three (Ci, pH and dosage) independent factors were examined in the form of plots. To determine the effect of each independent factor, the three-dimensional (3D) and contour plots were obtained as shown in Figure 6. From the plots and Table 4, it is observed that the three examined factors have a significant effect on the response, while their squares do not. This non-effect is also observed through the two-way interaction between the factors. This finding was based on the p-value and F-value obtained.
In this GTL wastewater system, pH showed influence over the uptake and was examined for the range of 2.6–9.4. To explain the behavior of the ACF under various pH conditions, it is essential to first gain an overview of the adsorption mechanism for AC. As suggested in the literature, the mechanism of adsorption occurs via multiple complex mechanisms. These adsorption mechanisms can take place due to: (1) accumulation of GTL wastewater on the surface of the ACF, (2) adsorption due to functional group polarity and (3) π–π interactions between the different layers of the adsorbent and the adsorbate [49]. As the nature of GTL wastewater consists of aliphatic compounds, the latter mechanism is not expected to take place in this study (mechanism 3). Due to this, electrostatic interactions are considered to be playing the major role between the ions in the GTL wastewater and the ACF surface [50]. As ACF is amphoteric in nature, adsorption is influenced by the pH of the system [51]. To examine the effect of pH on the interaction between GTL wastewater and ACF, drops of 0.1 M NaOH or 0.1 M HCl were used. From Figure 6, the effect of this modification can be observed, and it is concluded that at low pH, higher uptake is attained at different initial GTL wastewater concentrations and ACF dosages. The low performance of the adsorbent at high pH is explained by the competition on the ACF active sites that occurs between the OH ions present in the GTL wastewater and the added electrons. Furthermore, at high pH, the occurrence of soluble complexes is possible, which can also hinder the uptake capabilities of the ACF [52].
As pH was part of the RSM analysis, initial GTL wastewater concentration was also examined using the series of batch experiments. The effect of initial concentration on the GTL wastewater is as shown in Figure 6. From this figure, it is seen that uptake is mostly optimal at high concentrations. The reason for this is the presence of more OH groups from the GTL wastewater in the system at high concentrations. This increased presence of OH was reported in the literature to increase adsorption due to the increase of mass transfer forces [53]. Based on this, more uptake takes place under high concentrations in GTL wastewater using ACF and it is due to the increase in the driving force of the mass transfer.
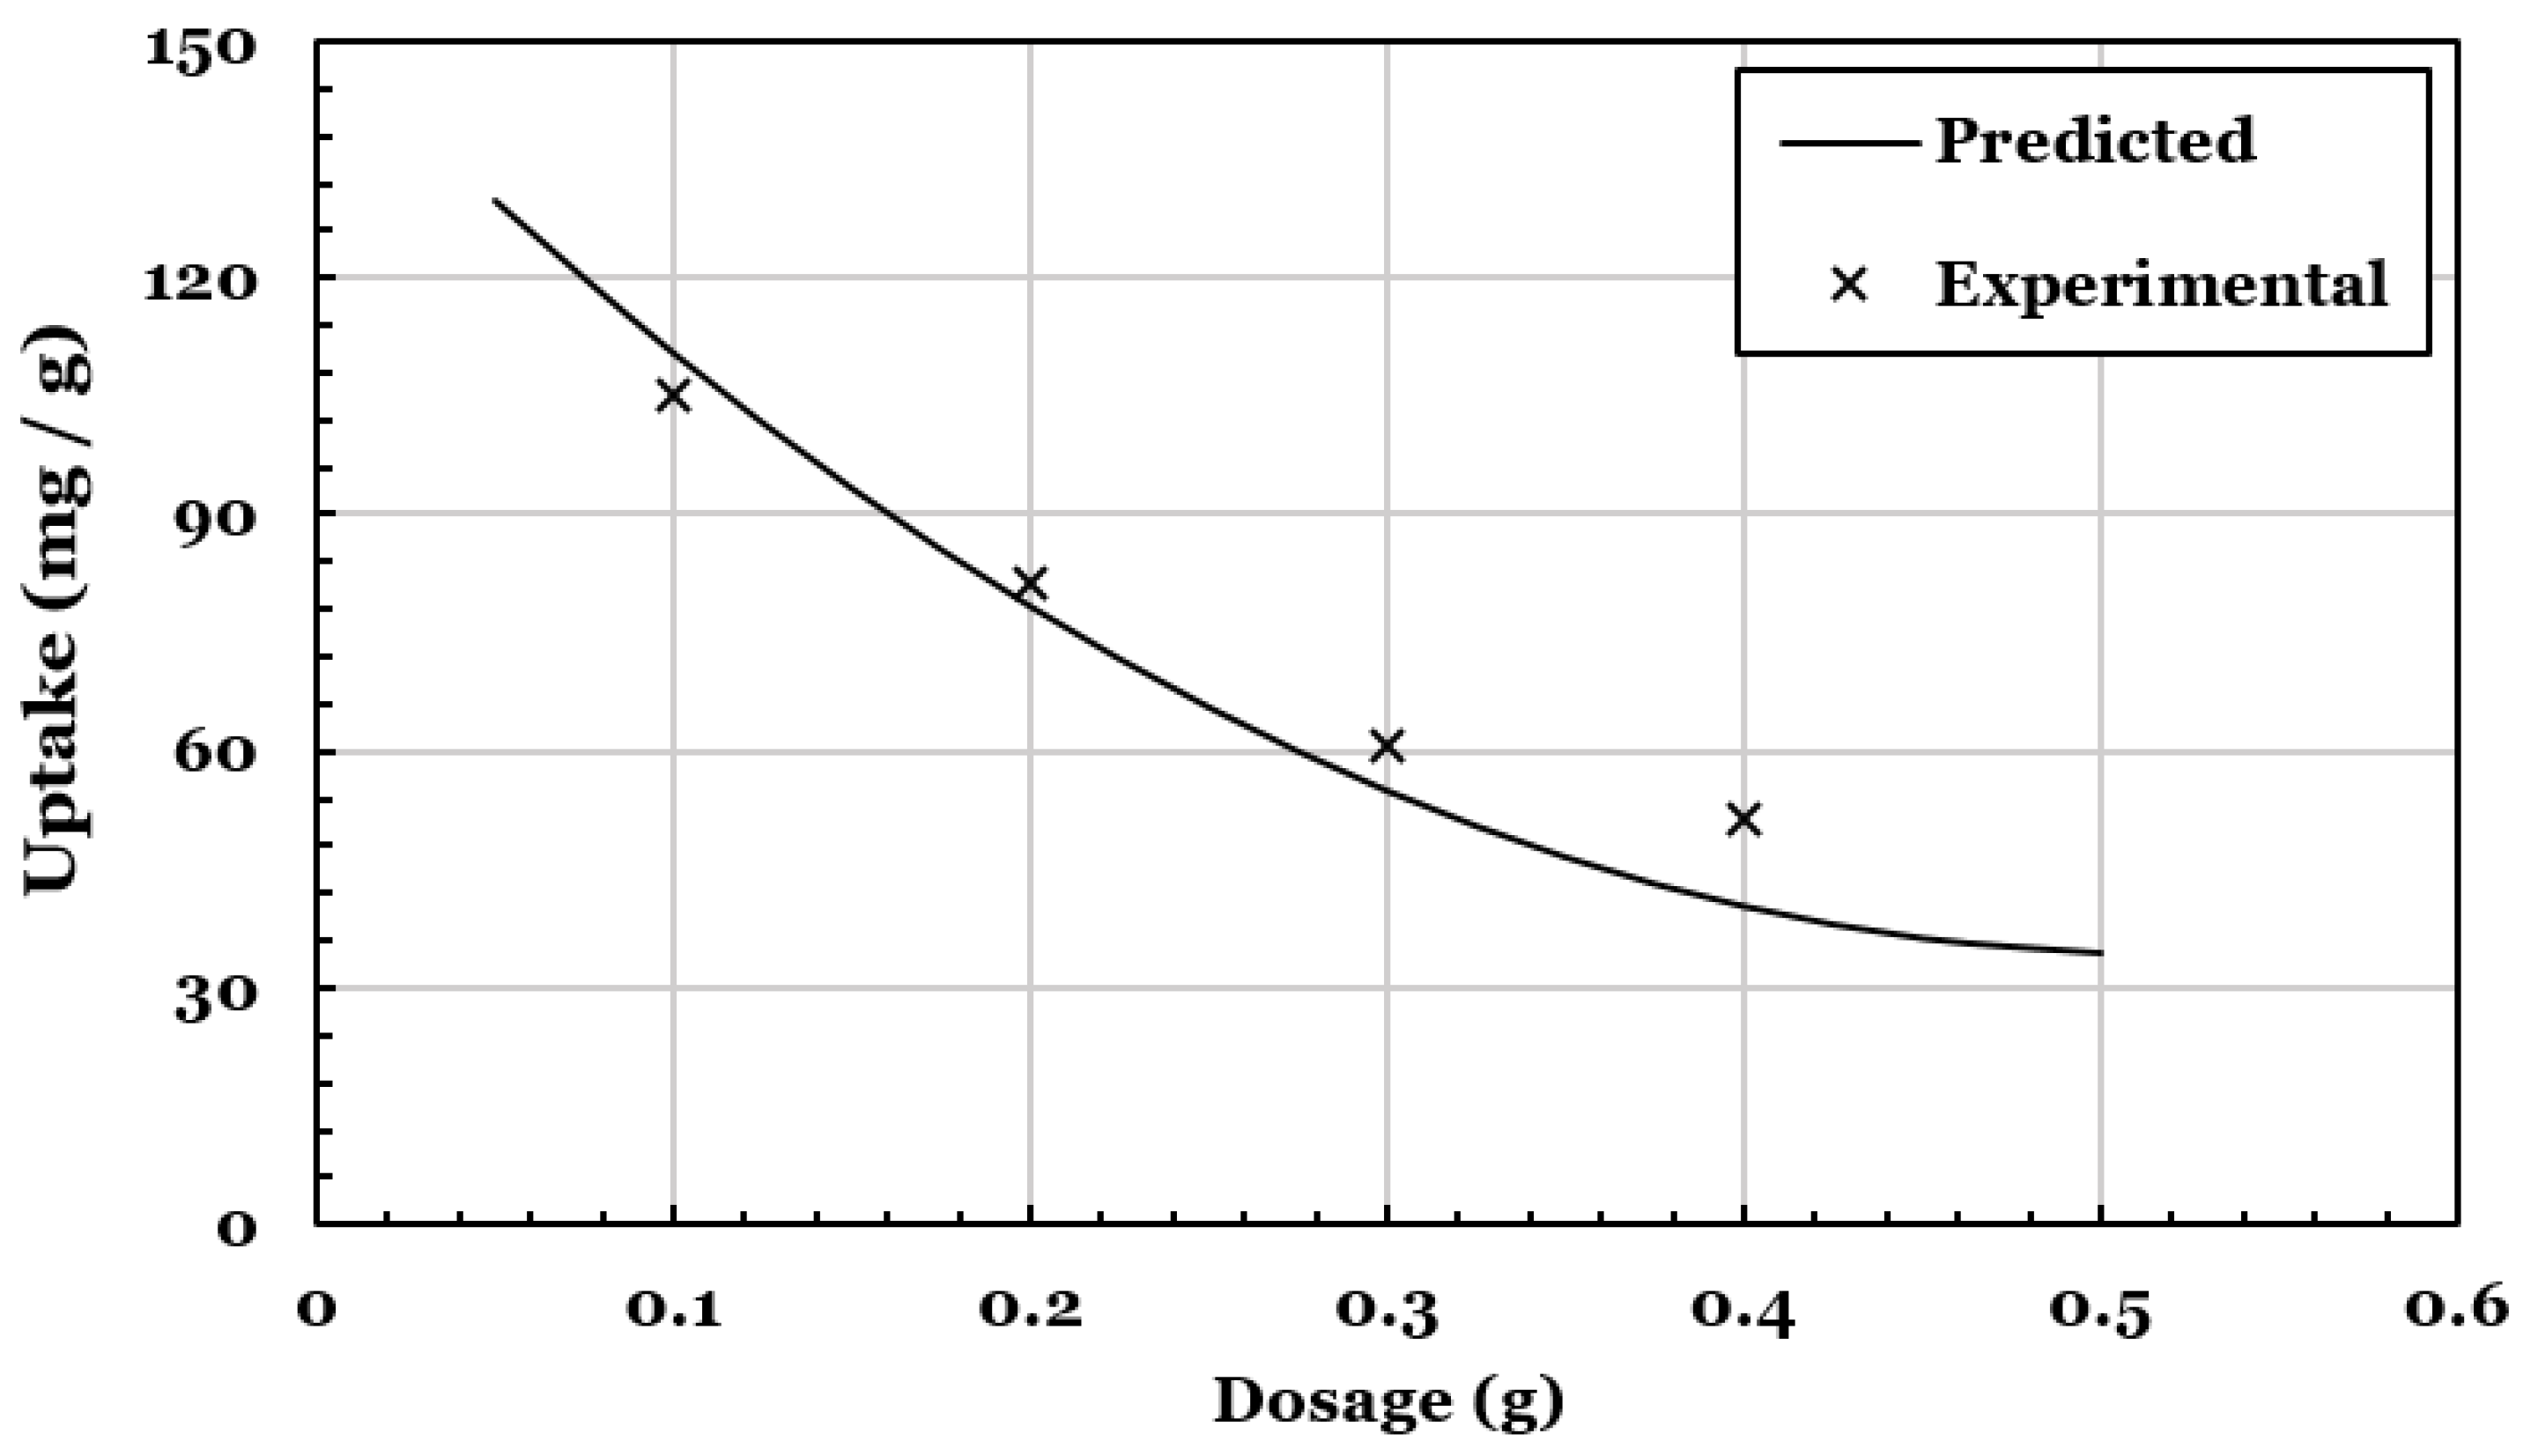
Similar to the initial concentration effect, dosage exhibited similar behavior in terms of uptake. As observed in Figure 6, the uptake of the GTL wastewater system increased with the increase of the dosage. This is simply explained by the presence of more active sites where more adsorption took place. However, this increase is expected to be hindered when a mass transfer limitation is faced [53].
As discussed above, GTL wastewater is favorable for treatment with ACF under acidic conditions. The most-favored conditions were around an optimum pH of 3 in the three-factor RSM, which is GTL wastewater’s pH without any modification. This optimum condition is ideal for the GTL wastewater, as it is acidic in nature and hence will not require pre-treatment prior to the adsorption process. Based on this, an economic benefit is introduced by the ACF adsorbent studied, as there will be no requirement for pH modification and extra treatment costs are avoided. Most adsorbents in the literature operate at basic or neutral pH [6,54,55], whereas the ACF used in this study can withstand acidic conditions. This shows the effectiveness of this adsorbent to handle and operate efficiently at acidic environments. The confirmation of this advantage was also shown through the two-factor RSM analysis (Figure 7), where the adsorption system was also optimal at pH close to 3, and this is due to the reasons explained previously.

3.4. Model Optimization and Validation

From the developed RSM model, the response was optimized to determine the best conditions for maximum uptake. The output of the optimization is shown in Table 5, where uptake is seen to be optimum at an acidic pH, high concentration and low dosage. These data were validated experimentally, where the obtained uptake was seen to be higher than expected. This better performance is expected due to the increase in mass driving force due to the high concentration and small dosage.
To assess the adequacy of the model, the response obtained from the model was validated experimentally. The assessment’s results are as shown in Figure 8, where can be seen that the experimental data are close to the uptake obtained from the model. With these results, it can be concluded that the obtained model to determine the uptake is adequate for GTL wastewater contaminant removal using ACF.

3.5. Kinetic and Isotherm Studies

To determine the adsorption rate, experimental data were collected at the identified conditions in the methods section. The collected data were fitted into three kinetic models: pseudo-first order, pseudo-second order and intraparticle diffusion. The choice of these models is based on their common presence in the literature. The data obtained from this analysis are shown in Figure 9, Figure 10 and Figure 11 and Table 6 using the kinetic models stated in the methods section. Using the R2 obtained via fitting the models, the fitting adequacy of each model was assessed. Figure 9 shows the linearized plotting of the pseudo-first order model where the slope and the intercept were used to obtain the equilibrium uptake Qe and rate constant k1. The R2 for this model was of 96%, which indicates that the kinetics of GTL wastewater follow the pseudo-first order model. Similarly, in Figure 10, the linearized pseudo-second order plot was constructed using t/Qt versus time. The experimental data in this plot were very close to the predicted values, and this is represented by the 98% R2 value. On the other hand, for the intraparticle diffusion in Figure 11, the linearized plot of Qt versus time0.5 showed a correlation of 84%. This low R2 indicates that the adsorption system of GTL wastewater and ACF do not follow the intraparticle model.
The illustration in Figure 11 of the intraparticle diffusion shows that multistage adsorption occurrs in the GTL wastewater/ACF system. The figure indicates the presence of two stages for how adsorption takes place. The first stage is the external diffusion of the adsorbate into the ACF surface where the adsorbate is instantaneously adsorbed. This is reflected in the steep slope observed at the beginning of the treatment time. The later stage is when the adsorption rate is slow, and this represents the slow motion of the adsorbate in the system from the large pore to the small ones. Overall, the observed behavior from Figure 11 indicates that the adsorption process for the GTL wastewater system into ACF is not only intraparticle controlled [56,57].
Out of all the examined models, the pseudo-second order model was observed to be the better representative of the kinetics of the GTL wastewater/ACF system. Based on this, the system’s adsorption mechanism follows chemisorption.
In addition to the kinetics, an isotherm analysis was conducted to assess the applicability of Langmuir (Equation (6)), Freundlich (Equation (7)), exponential (Equation (8)) and D-R (Equation (9)) isotherm models. Using the nonlinear regression approach—the sum of square errors (SSE), R2 and the Akaike Information Criterion (AIC) [35], the quality of fitting for each model was determined. The AIC is a method used for comparison between different models in which the lowest value yielded from the following formula is considered the best model:
A I C = 2 p + N l n S S E N
where p is the number of independent parameters in the tested model, N is the number of data points. For a small sample size (N/p < 40), the second-order AIC (AICc) is used. AICc is defined as follows:
A I C c = A I C + 2 p   p + 1 N p 1
The following difference in the AICc using the model’s AICc and minimum AICc (AICcmin) for all the models is used to find the Akaike weight (wi), where the highest value recommends the best model:
Δ A I C c = A I C c i A I C c m i n
w i = e x p 1 2 Δ A I C c i i = 1 e x p ( 1 2 Δ A I C c i )
Figure 12 shows the fitting of these models against experimental data with isotherm parameters of each model in Table 7. From this table, the best fit that is close to experimental data is seen to be exhibited by the Freundlich isotherm model, with R2 being at 97%, SSE being the lowest (228) and wi being the highest at 0.79. Overall, from the tested models, the Langmuir and Freundlich models best fitted the isotherm obtained experimentally. This can be reflected in Figure 12, as it shows that the adsorption mechanism is non-ideal, reversible, monolayer and multilayer. The maximum adsorbed contaminants on the monolayer (qm) were found to be 322 mg/g, while kF, representing the bond between GTL wastewater contaminants and the surface layer of the ACF, was 2.7 [6,58,59,60,61]. From these findings, it can be concluded that the ACF adsorbent is a desirable material for the treatment of GTL wastewater. Furthermore, the results obtained in the table were used to determine the mean free energy of sorption—E (Equation (9)). The value was found to be 6 kJ/mol, which is lower than the typical range of bonding energy for ion-exchange mechanisms, that is, between 8–16 kJ/mol [35,62,63]. This implies that ion exchange does not play a major role in the treatment of GTL wastewater using ACF and chemical/physical adsorption are the main followed adsorption mechanisms.
Studies related to GTL wastewater treatment using the adsorption technique are scarce in the literature. To make a comparison for where the ACF use in this study stands, similar industrial wastewater studies were used. Table 8 contains a summary of industrial wastewater studies using the adsorption technique. Through comparing the stipulated values in the table, the ACF used for GTL wastewater treatment shows a very competitive result in comparison to other adsorbents used in similar studies.

3.6. Regeneration Study

In order to examine the adsorbent’s reliability, three cycles of regeneration were conducted for the GTL wastewater/ACF system. As observed in Figure 13, adsorption stayed persistent through all the cycles, while two cycles showed a regeneration efficiency averaging around 85.5%. Regardless, the cycles showed that the adsorbent can withstand regeneration cycles, and this reflects on the resilience of this ACF for multiple adsorption cycles under acidic conditions for GTL wastewater treatment.

4. Conclusions

In this study, ACF was used for the removal of GTL wastewater contaminants using the adsorption technique. The feasibility of this technique was optimized through the RSM approach, where three factors were considered as independent variables: pH, Ci and dosage. From the performed analysis, it was concluded that the three factors affected the uptake significantly, while the RSM model was validated experimentally. In addition, the kinetics and isotherm modeling analysis showed that the ACF/GTL wastewater system followed pseudo-second order and Langmuir/Freundlich models, respectively. Following that, the potential of the ACF was shown through conducting a regeneration study, where the adsorbent showed resilience in terms of offering high efficiencies through multiple cycles, while operating in an acidic environment. Hence, the outcome of this study shows the ability of ACF to be an effective adsorbent to treat acidic GTL wastewater.

Author Contributions

Conceptualization, M.H.E.-N. and H.Q.; methodology, R.Y. and M.H.E.-N.; formal analysis, R.Y.; investigation, R.Y.; writing—original draft preparation, R.Y.; writing, reviewing and editing, H.Q. and M.H.E.-N.; visualization, R.Y.; supervision, H.Q. and M.H.E.-N.; funding acquisition, R.Y. and H.Q. All authors have read and agreed to the published version of the manuscript.

Funding

This publication was made possible by GSRA grant, ID# GSRA5-1-0531-18104, from the Qatar National Research Fund (a member of Qatar Foundation). The authors would like to thank the Central Laboratories Unit (CLU) at Qatar University for carrying out the TEM imaging.

Data Availability Statement

Not applicable.

Conflicts of Interest

The authors declare no conflict of interest.

References

  1. Schulz, H. Short history and present trends of Fischer–Tropsch synthesis. Appl. Catal. A Gen. 1999, 186, 3–12. [Google Scholar] [CrossRef]
  2. Knottenbelt, C. Mossgas “gas-to-liquid” diesel fuels—An environmentally friendly option. Catal. Today 2002, 71, 437–445. [Google Scholar] [CrossRef]
  3. Kim, Y.H.; Jun, K.-W.; Joo, H.; Han, C.; Song, I.K. A simulation study on gas-to-liquid (natural gas to Fischer–Tropsch synthetic fuel) process optimization. Chem. Eng. J. 2009, 155, 427–432. [Google Scholar] [CrossRef]
  4. Gard. Low-Sulphur Fuels Explained—GARD. 2013. Available online: https://www.gard.no/web/updates/content/20734083/low-sulphur-fuels-explained (accessed on 9 June 2022).
  5. Enyi, G.C.; Nasr, G.G.; Burby, M. Economics of wastewater treatment in GTL plant using spray technique. Int. J. Energy Environ. 2013, 4, 561–572. [Google Scholar]
  6. Yousef, R.; Qiblawey, H.; El-Naas, M.H. Adsorption as a process for produced water treatment: A review. Processes 2020, 8, 1657. [Google Scholar] [CrossRef]
  7. Pedenaud, P. TOTAL Experience to Reduce Discharge of Hydrocarbons Through Produced Water. In Proceedings of the SPE International Health, Safety & Environment Conference, Abu Dhabi, United Arab Emirates, 2–4 April 2006; p. SPE-98490-MS. [Google Scholar] [CrossRef]
  8. Surkatti, R.; El-Naas, M.H.; Van Loosdrecht, M.C.M.; Benamor, A.; Al-Naemi, F.; Onwusogh, U. Biotechnology for Gas-to-Liquid (GTL) Wastewater Treatment: A Review. Water 2020, 12, 2126. [Google Scholar] [CrossRef]
  9. Zacharia, R.; El-Naas, M.H.; Al-Marri, M.J. Photocatalytic Oxidation of Non-Acid Oxygenated Hydrocarbons. In Water Management; CRC Press: Boca Raton, FL, USA, 2018; pp. 287–302. [Google Scholar]
  10. Saravanan, N.P.; Van Vuuren, M.J. Process Wastewater Treatment and Management in Gas-to-Liquids Industries. In Proceedings of the SPE Oil and Gas India Conference and Exhibition, Mumbai, India, 20–22 January 2010; p. SPE-126526-MS. [Google Scholar] [CrossRef]
  11. Majone, M.; Aulenta, F.; Dionisi, D.; D’Addario, E.N.; Sbardellati, R.; Bolzonella, D.; Beccari, M. High-rate anaerobic treatment of Fischer–Tropsch wastewater in a packed-bed biofilm reactor. Water Res. 2010, 44, 2745–2752. [Google Scholar] [CrossRef]
  12. Kurniawan, T.A.; Chan, G.Y.; Lo, W.-H.; Babel, S. Physico–chemical treatment techniques for wastewater laden with heavy metals. Chem. Eng. J. 2006, 118, 83–98. [Google Scholar] [CrossRef]
  13. Damjanović, L.; Rakić, V.; Rac, V.; Stošić, D.; Auroux, A. The investigation of phenol removal from aqueous solutions by zeolites as solid adsorbents. J. Hazard. Mater. 2010, 184, 477–484. [Google Scholar] [CrossRef]
  14. Müller, N.; Worm, P.; Schink, B.; Stams, A.J.M.; Plugge, C.M. Syntrophic butyrate and propionate oxidation processes: From genomes to reaction mechanisms. Environ. Microbiol. Rep. 2010, 2, 489–499. [Google Scholar] [CrossRef] [Green Version]
  15. Veil, J.A.; Puder, M.G.; Elcock, D.; Redweik, R.J. A White Paper Describing Produced Water from Production of Crude Oil, Natural Gas, and Coal Bed Methane; Argonne National Lab: Lemont, IL, USA, 2004. [CrossRef] [Green Version]
  16. Judd, S.; Qiblawey, H.; Al-Marri, M.J.; Clarkin, C.; Watson, S.; Ahmed, A.; Bach, S. The size and performance of offshore produced water oil-removal technologies for reinjection. Sep. Purif. Technol. 2014, 134, 241–246. [Google Scholar] [CrossRef]
  17. Gebara, F. Activated sludge biofilm wastewater treatment system. Water Res. 1999, 33, 230–238. [Google Scholar] [CrossRef]
  18. Banerjee, A.; Ghoshal, A.K. Biodegradation of an actual petroleum wastewater in a packed bed reactor by an immobilized biomass of Bacillus cereus. J. Environ. Chem. Eng. 2017, 5, 1696–1702. [Google Scholar] [CrossRef]
  19. Dyal, A.; Loos, K.; Noto, M.; Chang, S.W.; Spagnoli, C.; Shafi, K.V.P.M.; Ulman, A.; Cowman, M.; Gross, R.A. Activity of Candida rugosa Lipase Immobilized on γ-Fe2O3 Magnetic Nanoparticles. J. Am. Chem. Soc. 2003, 125, 1684–1685. [Google Scholar] [CrossRef]
  20. Peng, Q.; Liu, Y.; Zeng, G.; Xu, W.; Yang, C.; Zhang, J. Biosorption of copper(II) by immobilizing Saccharomyces cerevisiae on the surface of chitosan-coated magnetic nanoparticles from aqueous solution. J. Hazard. Mater. 2010, 177, 676–682. [Google Scholar] [CrossRef]
  21. Campos, J.C.; Borges, R.M.H.; Filho, A.M.O.; Nobrega, R.; Sant’Anna, G.L., Jr. Oilfield wastewater treatment by combined microfiltration and biological processes. Water Res. 2002, 36, 95–104. [Google Scholar] [CrossRef]
  22. Jiménez, S.; Micó, M.; Arnaldos, M.; Medina, F.; Contreras, S. State of the art of produced water treatment. Chemosphere 2018, 192, 186–208. [Google Scholar] [CrossRef]
  23. Arthur, J.; Bruce, P.; Langhus, G.; Patel, C. Technical Summary of Oil & Gas Produced Water Treatment Technologies; All Consulting, LLC: Tulsa, OK, USA, 2005. [Google Scholar]
  24. Ahmaruzzaman, M. Adsorption of phenolic compounds on low-cost adsorbents: A review. Adv. Colloid Interface Sci. 2008, 143, 48–67. [Google Scholar] [CrossRef]
  25. Surkatti, R.; Al Disi, Z.A.; El-Naas, M.H.; Zouari, N.; Van Loosdrecht, M.C.M.; Onwusogh, U. Isolation and Identification of Organics-Degrading Bacteria From Gas-to-Liquid Process Water. Front. Bioeng. Biotechnol. 2021, 8, 603305. [Google Scholar] [CrossRef]
  26. Mochida, I.; Korai, Y.; Shirahama, M.; Kawano, S.; Hada, T.; Seo, Y.; Yoshikawa, M.; Yasutake, A. Removal of SOx and NOx over activated carbon fibers. Carbon 2000, 38, 227–239. [Google Scholar] [CrossRef]
  27. Reza, M.; Kontturi, E.; Jääskeläinen, A.-S.; Vuorinen, T.; Ruokolainen, J. Transmission Electron Microscopy for Wood and Fiber Analysis—A Review. Bioresources 2015, 10, 6230–6261. [Google Scholar] [CrossRef]
  28. YLiu, Y.; Hou, H.; He, X.; Yang, W. Mesporous 3C-SiC Hollow Fibers. Sci. Rep. 2017, 7, 1893. [Google Scholar] [CrossRef]
  29. Williams, D.B.; Carter, C.B. The Transmission Electron Microscope BT—Transmission Electron Microscopy: A Textbook for Materials Science; Williams, D.B., Carter, C.B., Eds.; Springer: Boston, MA, USA, 1996; pp. 3–17. [Google Scholar]
  30. Hirsch, P.B. Electron Microscopy of Thin Crystals; Butterworths: Oxfordshire, UK, 1965. [Google Scholar]
  31. Black, R.; Sartaj, M.; Mohammadian, A.; Qiblawey, H.A.M. Biosorption of Pb and Cu using fixed and suspended bacteria. J. Environ. Chem. Eng. 2014, 2, 1663–1671. [Google Scholar] [CrossRef]
  32. Ewis, D.; Benamor, A.; Ba-Abbad, M.M.; Nasser, M.; El-Naas, M.; Qiblawey, H. Removal of Oil Content from Oil-Water Emulsions Using Iron Oxide/Bentonite Nano Adsorbents. J. Water Process. Eng. 2020, 38, 101583. [Google Scholar] [CrossRef]
  33. Albatrni, H.; Qiblawey, H.; Al-Marri, M.J. Walnut shell based adsorbents: A review study on preparation, mechanism, and application. J. Water Process. Eng. 2022, 45, 102527. [Google Scholar] [CrossRef]
  34. Al-Ghouti, M.A.; Sayma, J.; Munira, N.; Mohamed, D.; Da’na, D.A.; Qiblawey, H.; Alkhouzaam, A. Effective removal of phenol from wastewater using a hybrid process of graphene oxide adsorption and UV-irradiation. Environ. Technol. Innov. 2022, 27, 102525. [Google Scholar] [CrossRef]
  35. El-Naas, M.H.; Al-Zuhair, S.; Alhaija, M.A. Removal of phenol from petroleum refinery wastewater through adsorption on date-pit activated carbon. Chem. Eng. J. 2010, 162, 997–1005. [Google Scholar] [CrossRef]
  36. Xu, C.; Niu, Y.; Popat, A.; Jambhrunkar, S.; Karmakar, S.; Yu, C. Rod-like mesoporous silica nanoparticles with rough surfaces for enhanced cellular delivery. J. Mater. Chem. B 2014, 2, 253–256. [Google Scholar] [CrossRef] [Green Version]
  37. Nakashima, Y.; Fukushima, M.; Hyuga, H. Fiber template approach toward preparing one-dimensional silica nanostructure with rough surface. Adv. Powder Technol. 2021, 32, 1099–1105. [Google Scholar] [CrossRef]
  38. Huang, L.; Zhang, X.; Xu, M.; Chen, J.; Shi, Y.; Huang, C.; Wang, S.; An, S.; Li, C. Preparation and mechanical properties of modified nanocellulose/PLA composites from cassava residue. AIP Adv. 2018, 8, 25116. [Google Scholar] [CrossRef] [Green Version]
  39. Qiao, W.; Yoon, S.; Korai, Y.; Mochida, I.; Inoue, S.; Sakurai, T.; Shimohara, T. Preparation of activated carbon fibers from polyvinyl chloride. Carbon 2004, 42, 1327–1331. [Google Scholar] [CrossRef]
  40. Beyene, D.; Chae, M.; Dai, J.; Danumah, C.; Tosto, F.; Demesa, A.G.; Bressler, D.C. Characterization of Cellulase-Treated Fibers and Resulting Cellulose Nanocrystals Generated through Acid Hydrolysis. Materials 2018, 11, 1272. [Google Scholar] [CrossRef] [Green Version]
  41. Li, Y.; Zhang, M. 6—Mechanical properties of activated carbon fibers. In Woodhead Publishing Series in Textiles; Chen, J.Y., Chen, T., Eds.; Woodhead Publishing: Oxford, UK, 2017; pp. 167–180. [Google Scholar]
  42. Shi, G.; Liu, C.; Wang, G.; Chen, X.; Li, L.; Jiang, X.; Zhang, P.; Dong, Y.; Jia, S.; Tian, H.; et al. Preparation and electrochemical performance of electrospun biomass-based activated carbon nanofibers. Ionics 2019, 25, 1805–1812. [Google Scholar] [CrossRef]
  43. Zhang, F.; Xie, F.; Xu, H.; Liu, J.; Oh, C.W. Characterization of Pd/TiO2 embedded in multi-walled carbon nanotube catalyst with a high photocatalytic activity. Kinet. Catal. 2013, 54, 297–306. [Google Scholar] [CrossRef]
  44. Jin, Z.; Yan, X.; Yu, Y.; Zhao, G. Sustainable activated carbon fibers from liquefied wood with controllable porosity for high-performance supercapacitors. J. Mater. Chem. A 2014, 2, 11706–11715. [Google Scholar] [CrossRef]
  45. Makarov, I.S.; Golova, L.K.; Vinogradov, M.I.; Levin, I.S.; Shandryuk, G.A.; Arkharova, N.A.; Golubev, Y.V.; Berkovich, A.K.; Eremin, T.V.; Obraztsova, E.D. The Effect of Alcohol Precipitants on Structural and Morphological Features and Thermal Properties of Lyocell Fibers. Fibers 2020, 8, 43. [Google Scholar] [CrossRef]
  46. Box, G.E.P.; Wilson, K.B. On the Experimental Attainment of Optimum Conditions BT—Breakthroughs in Statistics: Methodology and Distribution; Kotz, S., Johnson, N.L., Eds.; Springer: New York, NY, USA, 1992; pp. 270–310. [Google Scholar]
  47. Khuri, A.I. A general overview of response surface methodology. Biom. Biostat. Int. J. 2017, 5, 87–93. [Google Scholar] [CrossRef] [Green Version]
  48. Saini, S.; Chawla, J.; Kumar, R.; Kaur, I. Response surface methodology (RSM) for optimization of cadmium ions adsorption using C16-6-16 incorporated mesoporous MCM-41. SN Appl. Sci. 2019, 1, 894. [Google Scholar] [CrossRef] [Green Version]
  49. Ghani, Z.A.; Yusoff, M.S.; Zaman, N.Q.; Zamri, M.F.M.A.; Andas, J. Optimization of preparation conditions for activated carbon from banana pseudo-stem using response surface methodology on removal of color and COD from landfill leachate. Waste Manag. 2017, 62, 177–187. [Google Scholar] [CrossRef]
  50. Liu, L.; Yang, W.; Zhang, H.; Yan, X.; Liu, Y. Ultra-High Response Detection of Alcohols Based on CdS/MoS2 Composite. Nanoscale Res. Lett. 2022, 17, 7. [Google Scholar] [CrossRef]
  51. Biesheuvel, M. Activated carbon is an electron-conducting amphoteric ion adsorbent. arXiv 2015, arXiv:1509.06354. [Google Scholar]
  52. Timothy, A. Adsorption of Chromium Ion from Industrial Effluent Using Activated Carbon Derived from Plantain (Musa paradisiaca) Wastes. Am. J. Environ. Prot. 2016, 4, 7–20. [Google Scholar]
  53. Inglezakis, V.J.; Balsamo, M.; Montagnaro, F. Liquid–Solid Mass Transfer in Adsorption Systems—An Overlooked Resistance? Ind. Eng. Chem. Res. 2020, 59, 22007–22016. [Google Scholar] [CrossRef]
  54. Girish, C.R.; Murty, V.R. Mass Transfer Studies on Adsorption of Phenol from Wastewater Using Lantana camara, Forest Waste. Int. J. Chem. Eng. 2016, 2016, 5809505. [Google Scholar] [CrossRef] [Green Version]
  55. Pestman, R.; Chen, W.; Hensen, E. Insight into the Rate-Determining Step and Active Sites in the Fischer–Tropsch Reaction over Cobalt Catalysts. ACS Catal. 2019, 9, 4189–4195. [Google Scholar] [CrossRef] [Green Version]
  56. Pholosi, A.; Naidoo, E.B.; Ofomaja, A.E. Intraparticle diffusion of Cr(VI) through biomass and magnetite coated biomass: A comparative kinetic and diffusion study. South Afr. J. Chem. Eng. 2020, 32, 39–55. [Google Scholar] [CrossRef]
  57. Albatrni, H.; Qiblawey, H.; Almomani, F.; Adham, S.; Khraisheh, M. Polymeric adsorbents for oil removal from water. Chemosphere 2019, 233, 809–817. [Google Scholar] [CrossRef]
  58. Freundlich, H.M.F. Over the Adsorption in Solution. J. Phys. Chem. 1906, 57, 385–471. [Google Scholar]
  59. Bikerman, J.J.B.T.-P.C. (Ed.) CHAPTER II–Physical Chemistry of Liquid Surfaces. In Physical Surfaces; Elsevier: Amsterdam, The Netherlands, 1970; Volume 20, pp. 44–116. [Google Scholar]
  60. Foo, K.Y.; Hameed, B.H. Insights into the modeling of adsorption isotherm systems. Chem. Eng. J. 2010, 156, 2–10. [Google Scholar] [CrossRef]
  61. Langmuir, I. The constitution and fundamental properties of solids and liquids. II. liquids.1. J. Am. Chem. Soc. 1917, 39, 1848–1906. [Google Scholar] [CrossRef] [Green Version]
  62. Ho, Y.S.; Porter, J.F.; McKay, G. Equilibrium Isotherm Studies for the Sorption of Divalent Metal Ions onto Peat: Copper, Nickel and Lead Single Component Systems. Water Air Soil Pollut. 2002, 141, 1–33. [Google Scholar] [CrossRef]
  63. Ozcan, A.; Ozcan, A.S.; Tunali, S.; Akar, T.; Kiran, I. Determination of the equilibrium, kinetic and thermodynamic parameters of adsorption of copper(II) ions onto seeds of Capsicum annuum. J. Hazard. Mater. 2005, 124, 200–208. [Google Scholar] [CrossRef]
  64. de Caprariis, B.; De Filippis, P.; Hernandez, A.D.; Petrucci, E.; Petrullo, A.; Scarsella, M.; Turchi, M. Pyrolysis wastewater treatment by adsorption on biochars produced by poplar biomass. J. Environ. Manage. 2017, 197, 231–238. [Google Scholar] [CrossRef]
  65. Mohammad, Y.S.; Shaibu-Imodagbe, E.M.; Igboro, S.B.; Giwa, A.; Okuofu, C.A. Adsorption of Phenol from Refinery Wastewater Using Rice Husk Activated Carbon. Iran. J. Energy Environ. 2014, 5, 393–399. [Google Scholar] [CrossRef]
Figure 1. F-T wastewater compositions by COD readings [8].
Processes 11 01932 g001
Figure 2. TEM test for ACF (a) at 5000× magnification and (b) at 10,000× magnification.
Processes 11 01932 g002
Figure 3. Map—EDX for ACF.
Processes 11 01932 g003
Figure 4. BET performed on ACF to showcase the pore volume distribution.
Processes 11 01932 g004
Figure 5. XRD analysis of ACF used in this study.
Processes 11 01932 g005
Figure 6. 3D surface and contour plots for three-factor (pH, Ci and dosage) RSM.
Processes 11 01932 g006
Figure 7. 3D surface and contour plots for two factor (pH and Ci) RSM.
Processes 11 01932 g007
Figure 8. Model v at Ci 1000 mg/L and 3.0 pH.
Processes 11 01932 g008
Figure 9. First-order kinetic model for GTL wastewater treatment using ACF.
Processes 11 01932 g009
Figure 10. Second-order kinetic model for GTL wastewater treatment using ACF.
Processes 11 01932 g010
Figure 11. Intraparticle diffusion kinetic model for GTL wastewater treatment using ACF.
Processes 11 01932 g011
Figure 12. Nonlinear isotherm regression for GTL wastewater/ACF adsorption process.
Processes 11 01932 g012
Figure 13. Regeneration cycles for batch experiments of GTL wastewater treatment using ACF.
Processes 11 01932 g013
Table 1. Screened adsorbents for GTL wastewater treatment.
Sample Uptake (mg/g)Source
Powder ACND *Commercial
Fibrous AC81[26]
ACF116.5Zhejiang Xingda
Date-PitND *Produced in house
Steel Dust ND *Produced in house
WoodND *Produced in house
* ND: no detectable uptake was observed.
Table 2. Parameters for designing the 3-factor RSM for GTL wastewater treatment.
Independent Factor Factorial and Center LevelAxial Level
Low (−1)Center (0)High (+1)Lowest (−α)Highest (+α)
pH 2.6469.3648
Initial Concentration (mg/L)327.2810001672.76001400
ACF Dosage (g)0.0320.30.370.10.3
Table 3. Parameters for designing the 2-factor RSM for GTL wastewater treatment.
Independent Factor Factorial and Center LevelAxial Level
Low (−1)Center (0)High (+1)Lowest (−α)Highest (+α)
pH 1.792.53.2123
Initial Concentration (mg/L)434.3110001565.696001400
Table 4. Analysis of variance (ANOVA) for response quadratic model for adsorption uptake.
SourceDFAdj SSAdj MSF-Valuep-ValueRemarks
Model910,854.91206.1015.740.000
Linear38936.22978.7438.880.000
pH14077.14077.0853.210.000Significant
Ci12746.52746.4835.840.000Significant
Dosage12112.72112.6727.570.000Significant
Square3983.3327.774.280.035Significant
pH× pH1589.7589.737.700.020
Ci×Ci1100.5100.531.310.279
Dosage×Dosage1274.1274.053.580.088
2-Way Interaction3935.4311.794.070.040Significant
pH×Ci162.662.620.820.387
pH×Dosage1852.1852.0911.120.008
Ci×Dosage120.720.660.270.615
Error10766.276.62
Lack-of-Fit5755.6151.1271.130.000
Pure Error510.62.12
Table 5. RSM model validation using repeated experiments.
pH Ci (mg/L) Adsorbent (g) Actual Uptake (mg/g)Predicted (mg/g)
Trial 12.61672.70.03248.4177.5
Trial 22.61672.70.03250.0177.5
Table 6. Kinetic models fitted for ACF/GTL wastewater adsorption process.
Kinetic ModelParametersValue
Pseudo-first order qe (mg/g) 51.8
k1 (min−1)0.01
R2 0.96
Pseudo-second order qe (mg/g) 111
k2 (min−1)0
R2 0.98
Intraparticle diffusionKint (mg/g min0.5)5.66
I (mg/g)35.1
R2 0.84
Table 7. Isotherm models fitted for ACF/GTL wastewater adsorption process.
Isotherm Model Parameters Value R2SSEAICAICCwi
FreundlichkF (mg/g)2.690.97 228.323.129.10.79
N1.74
Langmuirqm (mg/g)322.250.95470.126.732.70.13
k1 (L/mg)0.0008
Exponentiala (mg/g)225.050.94569.127.733.70.08
b (g/mg)0.0011
D-R qe (mg/g)165.70.682791.335.641.60.002
β (mol2/kJ2)0.014
Table 8. Comparison of uptake capacities for various industrial wastewater.
Adsorbent ContaminantUptake (mg/g)Source
ACF GTL wastewater250This work
Commercial Activated Carbon Organic compounds from a Bio-Process 303[64]
Wood BiocharOrganic compounds from a Bio-Process 166.63[64]
Date-Pit Activated Carbon Industrial wastewater (Phenol)56.9[35]
Rice Husk Activated CarbonPetroleum refinery wastewater28[65]
Disclaimer/Publisher’s Note: The statements, opinions and data contained in all publications are solely those of the individual author(s) and contributor(s) and not of MDPI and/or the editor(s). MDPI and/or the editor(s) disclaim responsibility for any injury to people or property resulting from any ideas, methods, instructions or products referred to in the content.

