Article

Research on the Access Planning of SOP and ESS in Distribution Network Based on SOCP-SSGA

School of Information Engineering, Nanchang Hangkong University, Nanchang 330063, China
*
Author to whom correspondence should be addressed.
Processes 2023, 11(6), 1844; https://doi.org/10.3390/pr11061844
Submission received: 8 May 2023 / Revised: 16 June 2023 / Accepted: 17 June 2023 / Published: 19 June 2023
(This article belongs to the Topic Power System Dynamics and Stability)

Abstract

:
This paper proposes a two-stage planning model for soft open point (SOP) and energy storage system (ESS) that considers the cost of faults in response to the current issue of SOP and ESS systems not considering the impact of SOP access on load transfer in the event of a fault in the distribution network. Firstly, considering the uncertainty of “PV-load”, typical scenarios of PV and load are constructed based on the clustering algorithm. Secondly, aiming at the economic performance of the distribution network and the capacity of PV access, a two-stage optimization model is established for the joint integration of SOP and ESS into the distribution network (normal and fault operation) under typical scenarios. The model is solved by using the second-order cone programming algorithm and steady-state genetic algorithm (SOCP-SSGA). Stage one involves planning for the integration capacity and location of SOP and ESS into the distribution network under each scenario within a period based on SOCP with the goal of minimizing economic costs. In stage two, the PV access capacity of the distribution network is optimized using SSGA with the goal of enhancing the PV accommodation capability. Finally, verification and analysis are conducted on an improved IEEE33 node system. The results show that when the system optimizes access to a group of SOP and ESS, the total economic cost is reduced by RMB 61,729 compared to random access, and the accessible PV capacity is increased by 0.5278 MW. Moreover, optimizing access to two sets of SOP and ESS can further reduce the total economic cost by RMB 107,048 compared to the optimized access group and increase accessible PV capacity by 1.5751 MW. Therefore, the proposed plan for SOP and ESS planning in this paper can significantly reduce the economic cost of distribution networks, enhance the absorption capacity of distributed photovoltaics, improve the voltage level of power grid operation, and, thereby, improve the economic and reliability of distribution network operation.

1. Introduction

In recent years, with the continuous development and popularization of renewable energy, distributed photovoltaic power generation has become an important part of the distribution network. However, large-scale distributed photovoltaic access brings huge challenges to the distribution network, such as voltage instability, photovoltaic capacity limitation, and loss increase [1,2]. In order to solve these problems, SOP and ESS technologies have been widely applied in the distribution network [3,4]. Therefore, how to effectively plan the access of SOP and ESS to improve the reliability and economic benefits of the grid has become one of the hot spots of current research, and researchers at home and abroad have carried out a large number of studies on the access of SOP and ESS.
The literature [5] (2019) proved the feasibility and superiority of a flexible multistate switch in a power system by simulating and analyzing the mathematical model of a flexible multistate switch. The literature [6] (2019) expanded the functions and application scenarios of SOP, analyzed the positive role of SOP in improving the system energy-consumption rate, reducing loss and improving power quality, etc., and verified that SOP can achieve good results in the distribution network. Reference [7] (2020) discusses the active power and reactive power coordination operating conditions and influence mechanism when flexible multistate switches are connected to an active distribution network. A dynamic optimal operation model and scheduling architecture for active and reactive power coordination between flexible multistate switches and active distribution networks under multitime periods are established, and a model-solving method for second-order cone programming and nonlinear programming is proposed. The literature [8] (2020) proposes a reliability evaluation method for a multiterminal interconnected distribution system based on a flexible multistate switch, discusses the influence of FMSS access strategy on the system operation mode and network structure, and provides theoretical support for the planning of flexible interconnected distribution system. The literature [9] (2021) establishes the power flow model of an active distribution network, considers the influence of flexible multistate switch access, takes the comprehensive operation cost of the distribution network as the objective function, builds the second-order cone programming model of flexible multistate switch location in the active distribution network, and optimizes and solves it to obtain the optimal SOP planning scheme. The literature [10] (2020), aiming at the SOP site-selection problem, considering the diversity of SOP operation modes, a dynamic coding strategy suitable for two-port SOP in an interconnected distribution network is proposed, and the improved genetic algorithm is used to solve the complex mixed integer nonlinear programming problem. The literature [11] (2017) established a double-layer programming model for SOP siting with constant capacity with the goal of optimizing multiple economic indicators and used a simulated annealing algorithm and cone programming algorithm to solve the problem.
In response to the problem of reduced stability of active distribution networks caused by a high proportion of new energy generation, document [12] (2023) established an ESS multiobjective optimization model and used nondominated sorting genetic algorithm II (NSGA-II) to solve it. By configuring ESS, the stability of the active distribution network is improved. The literature [13] (2020) proposes a distributed hybrid energy storage optimization method based on distribution-network zoning, which effectively improves the utilization efficiency of energy storage and the economy of the configuration scheme. The literature [14] (2020) proposes a data-driven uncertainty modeling method and establishes a distributionally robust optimization model to determine the optimal energy storage-system planning strategy in high photovoltaic penetration distribution systems. The literature [15] (2020) established a multiobjective model for solving the optimal capacity and power of distributed energy storage, taking into account the uncertainties of economics, technical standards, and distributed power generation. The literature [16] (2022) considers the coupling between planning and operation. They established a multiobjective optimization model of an energy storage system in an active distribution network and proposed an improved multiobjective particle-swarm optimization algorithm to solve the model. This approach aims to improve the robustness and economics of active distribution networks to address their vulnerabilities. The literature [17] (2020) solves the problem of energy storage site selection and capacity by constructing a hybrid probability optimization algorithm, which combines the discretization method with the multiobjective particle-swarm optimization (MOPSO) algorithm and the nondominating ranking genetic algorithm, which can better realize the voltage distribution and reduce the network loss.
In the above studies, the configuration of the power grid was optimized in the case of the access of SOP or ESS itself, and the joint planning of SOP and ESS was not considered to control the power grid. In practical-application scenarios, the joint planning of SOP and ESS could better realize the control and regulation of the power grid. To solve this problem, the literature [18] (2018) considered the coordinated operation relationship between SOP and ESS and studied the role of SOP and ESS in improving the operation economy of an active distribution network from the perspective of optimal configuration. In the literature [19] (2021), a two-stage joint-interval optimization model of an intelligent soft switch and energy storage system of an active distribution network is established. Column and constraint generation algorithm is adopted to solve the model, so as to cope with the uncertainty of the output and load demand of the distributed power supply and effectively reduce the loss cost of the active distribution network. The literature [20] (2018) established a sequential optimization model for SOP and ESS, which was accurately solved using the primal–dual interior-point algorithm to reduce active distribution network losses. The literature [21] (2021) proposed SOP and ESS operating models in an active distribution network aiming at the optimization of operating cost, loss cost, and battery-degradation cost, converted a mixed-integer nonlinear programming model into a mixed-integer linear programming model and solved the model. The literature [22] (2022) established SOP and ESS two-layer programming models based on temporal and spatial characteristics. The minimum annual comprehensive operation cost of the distribution network and the minimum sum of network loss cost and voltage offset were taken as optimization objectives, and the planning scheme was determined by a community mining algorithm and improved load moment method. These research results provide some ideas and methods for SOP and ESS access in a distribution network.
The above research has the following shortcomings: (1) the transfer and support functions of SOP and ESS to loads during distribution network failures are not considered. Therefore, when the objective is to minimize the annual comprehensive cost of the distribution network, the cost of distribution network failures is usually not considered and the operating layer mainly calculates the distribution-network losses during normal operation. As a result, the adjustment potential of SOP in time and space is not fully utilized. (2) The reasonable planning of SOP and ESS plays an important role in improving the access of distributed photovoltaics, but it is also affected by the random fluctuations of distributed power sources and it is necessary to coordinate the planning of SOP, ESS, and distributed photovoltaics. Therefore, this paper considers the uncertainty of PV load and establishes a planning model with the goal of comprehensive economic cost and PV access capacity in the distribution network. The objective function takes into account not only the power loss during normal operation of the distribution network but also the benefits of SOP and ESS in supporting loads after faults occur and introduces a fault-cost index. A mixed-solving method based on SOCP-SSGA is used to solve the model and simulation verification is carried out in an improved IEEE33 node distribution network to analyze the economic and effective aspects of the planning model.

2. Flexible Distribution Network with SOP and ESS

2.1. SOP Basic Structure and Control Mode

The soft open point (SOP) is composed of high-power electronic components and has the characteristics of fast response speed, real-time continuous power control, and suitability for different scenarios. It can replace traditional tie switches and not only has the on/off function of traditional tie switches but also can transfer active power of feeders, improving the distribution of power flow in the distribution network [23]. In the event of a fault, SOP can provide some voltage support to improve feeder voltage levels, achieve uninterrupted power supply in nonfault areas, and, thereby, improve system operation safety. This paper uses a back-to-back voltage source converter (VSC) as the research model. SOP is mainly connected to the DC capacitor through the converter and plays a role in voltage support and smoothing DC voltage fluctuations. L is the filtering inductance and R is the equivalent resistance. The basic structure diagram of the back-to-back SOP is shown in Figure 1.
Take VSC1 as an example; where u s a 1 , u s b 1 , u s c 1 is the three-phase voltage at the AC side, i a 1 , i b 1 , i c 1 is the three-phase current at the AC side, u o a 1 , u o b 1 , u o c 1 is the three-phase voltage at the AC side of VSC, U d c is the voltage at the DC side of VSC, i d c is the current at the DC side of VSC, and P s , Q s is the active and reactive power input at the AC side. SOP mainly adjusts the power flow between systems through amplitude-phase or vector-control mode, and vector control can overcome the shortcoming of no current protection in amplitude-phase control. There are four operation modes for VSC [24,25]: fixed DC voltage control, fixed AC voltage control, fixed active power control, and fixed reactive power control. Under normal conditions, one VSC in the SOP controls the power transmission, while the other VSC controls the DC voltage. When a fault occurs, the fault detection VSC is adjusted to the fixed AC voltage control, and the nonfault side VSC is used to control the fluctuation of DC voltage. For detailed mathematical models and commutation principles of SOP, please refer to references [26,27].

2.2. Energy Storage-System Model

Energy storage systems (ESS) can be charged during the day when there is sufficient sunlight and the load electricity consumption is less than the output electricity from photovoltaics. They can then discharge during periods of low output, such as rainy days or nighttime, to meet the demand of the load. ESS not only enhances the absorption level of photovoltaic power generation by the distribution network but also increases the load level of distribution transformers [28]. In a flexible distribution network, distributed energy storage is mainly electrochemical energy storage. The model is shown as follows:
When charging, the energy storage-system power can be expressed as follows:
E E S S ( t ) = E E S S ( t Δ t ) + P E S S c ( t ) Δ t η c
when discharging, the energy storage-system electricity can be expressed as follows:
E E S S ( t ) = E E S S ( t Δ t ) + P E S S d i s ( t ) Δ t η d
where E E S S ( t ) is the electricity stored in the energy storage system at time t , Δ t is the time interval, P E S S c ( t ) is the charging power of energy storage at time t , P E S S d i s ( t ) is the discharge power at time t , η c is the charging efficiency, and η d is the discharge efficiency.

3. Two-Stage Planning Model for SOP and ESS Access

The main purpose of this paper is to optimize the power flow of the distribution network by SOP and ESS, and to minimize the economic cost of the distribution network, and maximize the absorption capacity of the photovoltaic under the premise of safety and reliability. Therefore, the stage-one planning model in this paper integrated various scenarios and took the minimum economic cost within the cycle as the objective function to determine the site capacity of SOP and ESS, while the objective function of the stage-two optimize model was to improve the PV absorption capacity in the distribution network.

3.1. Stage-One Planning Model

3.1.1. Objective Function

The objective function of the stage-one planning model is to find the access capacity of SOP and ESS under the condition that the economic cost of the distribution network is minimal in the period, and the economic cost in this document consists of four parts, which are expressed as follows:
min F = C I N V + C O P E + C L O S S s + C F a u l t s
where F is the economic cost in the distribution network, C I N V is the investment cost of SOP and ESS, C O P E is the operation and maintenance cost of SOP and ESS in the cycle, C L O S S s is the cost of power loss in the distribution network, and C F a u l t s is the loss cost in the event of a failure in the distribution network. The cost expressions are as follows:
  • SOP and ESS investment costs C I N V
C I N V = d ( 1 + d ) y S O P ( 1 + d ) y S O P 1 k = 1 N S O P ( C S O P S S O P ) + d ( 1 + d ) y E S S ( 1 + d ) y E S S 1 k = 1 N E S S ( C E S S S E S S )
where d is the discount rate; y S O P , y E S S and y S O P are the economic service life of SOP, ESS, and PV, N S O P and N E S S are the number of SOP and ESS to be installed, C S O P and C E S S are the unit-capacity investment costs corresponding to SOP and ESS, and S S O P s and S E S S s are the installed capacity of SOP and ESS.
2.
SOP and ESS operation and maintenance costs C O P E s
C O P E = λ E S S k = 1 N E S S ( C E S S S E S S ) + λ S O P k = 1 N S O P ( C S O P S S O P )
where λ E S S and λ S O P are the operating and maintenance cost coefficients of SOP and ESS, respectively.
3.
The cost of loss of electrical energy in the distribution network C L O S S s
C L O S S s = P s s = 1 K [ φ t = 1 n ( R i j I i j , t s 2 + P i j , t s , L , S O P + P i j , t s , L , E S S ) Δ t ]
where φ is the economic cost coefficient of power loss in the distribution network, R i j is the resistance value on the branch i j , I i j , t s 2 is the current value of the branch i j at a time t , P i j , t s , L , S O P is the active power loss of the SOP installed on the branch, P i j , t s , L , E S S is the active power loss of the ESS installed on the branch, Δ t is the time interval, P s is the probability corresponding to scenario s , and K is the number of clustered scenarios.
4.
TCost of fault loss in the distribution network C f a u l t s
C f a u l t s = P s s = 1 K [ C E P t s , L , L O A D P f a u l t ]
where C E is the electricity price, P t s , L , L O A D is the lost power of the load in the event of a line failure, and P f a u l t is the probability of line failure.

3.1.2. Constraints

  • SOP operation constraints
P i S O P + P j S O P + P i S O P , L + P j S O P , L = 0
{ P i S O P , L = A i S O P ( P i S O P ) 2 + ( Q i S O P ) 2 P j S O P , L = A j S O P ( P j S O P ) 2 + ( Q j S O P ) 2
{ μ S i , j S O P Q i S O P μ S i , j S O P μ S i , j S O P Q j S O P μ S i , j S O P
{ ( P i S O P ) 2 + ( Q i S O P ) 2 S i S O P ( P j S O P ) 2 + ( Q j S O P ) 2 S j S O P
where P i S O P and P j S O P are the active power transmitted by the flexible switch at nodes i and j , Q i S O P and Q j S O P are the reactive power transmitted by the flexible switch at nodes i and j , P i S O P and P j S O P are the loss of SOP, A i S O P and A j S O P are the loss coefficient of the flexible switch at nodes i and j , the value is 0.02, μ is the absolute value of the power factor angle sinusoid, and S i , j S O P is the capacity of SOP between nodes.
2.
ESS operating constraints
The injection of energy storage into the grid is defined as positive and the operational constraints are expressed as follows:
P i , t E S S = { η d i c P i , t d i s P i , t E S S 0 η c P i , t c P i , t E S S < 0
Q i E S S , min Q i , t E S S Q i E S S , max
( P i , t E S S ) 2 + ( Q i , t E S S ) 2 S i E S S
E i , t + 1 E S S , min = E i , t E S S + P i , t E S S Δ t
E t E S S , min E t E S S E t E S S , max
E N T , i E S S = E 0 , i E S S
where P i , t c and P i , t d i s are the charging power and discharge power of the energy storage at the t moment i node, η c and η d i c are the charge and discharge efficiency of the energy storage reset, E i , t E S S is the electricity stored by the energy storage device of the i node at the t moment, Q i E S S , min and Q i E S S , max are the upper and lower limits of the reactive power that the energy storage device can output on the i node, E t E S S , min and E t E S S , max are the upper and lower limits of the amount of energy that can be stored by the energy storage device, and S i E S S is the capacity of the energy storage device of the i node. The amount of electricity stored by the energy storage device in the time series is continuous and the cumulative calculation is carried out according to the power of charge and discharge, and the energy storage capacity at each moment needs to meet the requirements of the upper and lower limits, and the initial power and the final power need to remain equal in one operating cycle.
3.
System operating power-flow constraint
{ i j Ω i ( P i j , t r i j I i j , t 2 ) + P i , t = j k Ψ i P j k , t i j Ω i ( Q i j , t x i j I i j , t 2 ) + Q i , t = j k Ψ i Q j k , t
{ P i , t = P i , t P V + P i , t S O P + P i , t E S S P i , t L O A D Q i , t = Q i , t S O P + Q i , t E S S Q i , t L O A D
U t , i 2 U t , j 2 + ( r i j 2 + x i j 2 ) I i j , t 2 2 ( r i j P i j , t + x i j Q i j , t ) = 0
U t , i 2 I i j , t 2 = P i j , t 2 + Q i j , t 2
where P i j , t and Q i j , t are the active and reactive power of the branch i j flowing from node i to node j at the t moment, r i j and x i j are the resistance and reactance of the branch i j , I i j , t is the current of the branch i j at the t moment, U i , t and U j , t are the voltage of nodes i and j at time t , P i , t and Q i , t are the active and reactive power flowing into node i at the t moment, P i , t P V , P i , t S O P , P i , t E S S and P i , t L O A D are the active power of PV, SOP, ESS, and LOAD at t moment, Q i , t S O P , Q i , t E S S and Q i , t L O A D are the reactive power of t moment SOP, ESS, and LOAD, Ω i is the collection of the first node of the branch with node i as the end node, and Ψ i is the collection of branch end nodes of the first end node.

3.2. Stage-Two Optimize the Model

3.2.1. Objective Function

The optimization model of stage two has the largest access to distributed photovoltaic capacity under various constraints of the distribution network and the objective function of the model can be expressed as follows:
F = max S P V
where S P V is the photovoltaic capacity of the access system.

3.2.2. Constraints

In addition to the constraints of stage one, the following constraints must be met.
  • Distributed photovoltaic operating power constraints:
S P V 2 P P V , t 2 Q P V , t S P V 2 P P V , t 2
where P P V , t s is the active power of the access PV at the t moment and Q P V , t s is the reactive power of the access PV at the t moment.
2.
Distribution network safe operation constraints:
{ U min U j U max | I i | I i max
where U j is the voltage amplitude of the first node j , U min is the minimum allowable value of voltage amplitude, and the maximum allowable value of U max voltage amplitude; I i is the current on branch i , and I i max is the maximum current that branch i is allowed to carry.

4. The Solution Method of the Model

The model constructed in this paper is a mixed-integer nonlinear programming model. The access location and capacity of SOP and ESS are determined at the first stage and the model is solved by second-order cone programming (SOCP). In the second stage, a steady-state genetic algorithm (SSGA) is used to calculate the distributed PV access capacity. In order to achieve an efficient solution, a hybrid algorithm of second-order cone programming and steady-state genetic algorithm (SOCP-SSGA) is proposed in this paper to solve the two-stage programming model.

4.1. Second-Order Cone Programming Algorithm and Transformation

SOCP is a mathematical programming on a convex cone in linear space, which has been widely used in power-system problems [29]. Based on the second-order cone programming algorithm, this paper transforms the objective function and constraints into the second-order cone model, which can transform the nonlinear equation into a linear expression [30].
Distribution network stage-one planning model (8), (20), (22), (23) with quadratic terms; replacing I t , i j 2 with I 2 , t , i j , and U 2 , t , i with U 2 , t , i 2 yields expressions (25), (26), (27), (28):
C l o s s = φ t = 1 n ( R i j I 2 , t , i j + P i j , t L , S O P + P i j , t E S S ) Δ t
{ i j Ω i ( P i j , t r i j I 2 , t , i j ) + P i , t = j k Ψ i P j k , t i j Ω i ( Q i j , t x i j I 2 , t , i j ) + Q i , t = j k Ψ i Q j k , t
U 2 , t , i U 2 , t , j + ( r i j 2 + x i j 2 ) I 2 , t , i j 2 ( r i j P i j , t + x i j Q i j , t ) = 0
U 2 , t , i I 2 , t , i j = P i j , t 2 + Q i j , t 2
Convex relaxation of Equations (9), (11), (14) and (28) yields the following second-order conical constraint:
{ [ P i S O P Q i S O P ] T 2 P i S O P , L A i S O P [ P j S O P Q j S O P ] T 2 P j S O P , L A j S O P
{ [ P i S O P Q i S O P ] T 2 S i S O P [ P j S O P Q j S O P ] T 2 S j S O P
[ P i , t E S S Q i , t E S S ] T 2 S i E S S
[ 2 P i j , t 2 Q i j , t I 2 , t , i j U 2 , t , i ] T 2 I 2 , t , i j + U 2 , t , i
After the above cone transformation, the nonlinear expression in the stage-one programming model is converted into a linear or second-order cone expression.

4.2. Steady-State Genetic Algorithm

In this paper, the SSGA is used to solve the stage-two optimization model and the SSGA can effectively maintain population diversity because only a small number of individuals are updated in each generation so as to reduce the risk of falling into the local optimal solution, and the SSGA has the characteristics of fast convergence, high operation efficiency, and adaptation to large-scale datasets, and the execution steps are as follows:
  • Population initialization and coding: take the photovoltaic capacity as the population chromosome, set the decision variables upper bound u b and lower bound l b , determine the number of individuals, and generate initialized population [ x 1 , x 2 , x n ] T after binary coding;
  • Calculate population-fitness value: the objective function in this paper is the maximum access capacity of the photovoltaic in a flexible distribution network and the objective function value F is used as the fitness value f i t , and a set of fitness value F i t n V is generated after each generation of calculation, F i t n V = [ f i t 1 , f i t 2 , f i t n ] T ;
  • Perform the selection operation: this operation is based on individual fitness to determine the individuals who carry out crossover and mutation; this paper uses roulette selection, individuals in the population are mapped to successive fragments of the interval, and the length of the fragment in which each individual is located is proportional to its fitness, the corresponding individual is selected according to the fragment in which it falls, and the process is repeated until the required number of individuals is obtained;
  • Perform crossover and mutation operations: in this paper, two intersections are randomly set in two individuals, and some genes are exchanged according to the crossover probability, and binary mutation operators are used in this paper;
  • Set the number of iterations and repeat steps 2–4 above until the end of evolution to obtain the optimal capacity of a node connected to the PV.

4.3. SOCP-SSGA Solution Flow

By using SOCP-SSGA to solve the two-stage planning model, firstly, typical scenarios for photovoltaic and load are constructed. In the first stage, the SOCP algorithm is used to optimize the positions and capacities of SOP and ESS in all typical scenarios and the comprehensive installation locations and capacities of SOP and ESS under various typical scenarios are obtained. The location and capacity information are then transmitted to stage two. In the second stage, the distributed photovoltaic capacity in the distribution network is optimized based on the SSGA algorithm and the optimized PV capacity results are returned to stage one. Stage one continues to use the data transmitted from stage two to calculate the objective function value and this cycle continues until the minimum economic cost and optimal photovoltaic capacity are obtained. The process of using the SOCP-SSGA hybrid algorithm to solve the two-stage planning model is shown in Figure 2.

5. Example Analysis

5.1. Optimization Schemes and Parameters

In this paper, the improved IEEE33 node is selected to analyze and verify the SOP and ESS access planning in the distribution network. The improved voltage level of the IEEE33 node is 12.66 KV, the total active load is 3175 KW, and the fault lines are between nodes 6 and 7 and between nodes 15 and 16. The system-structure diagram of the improved IEEE33 nodes is shown in 
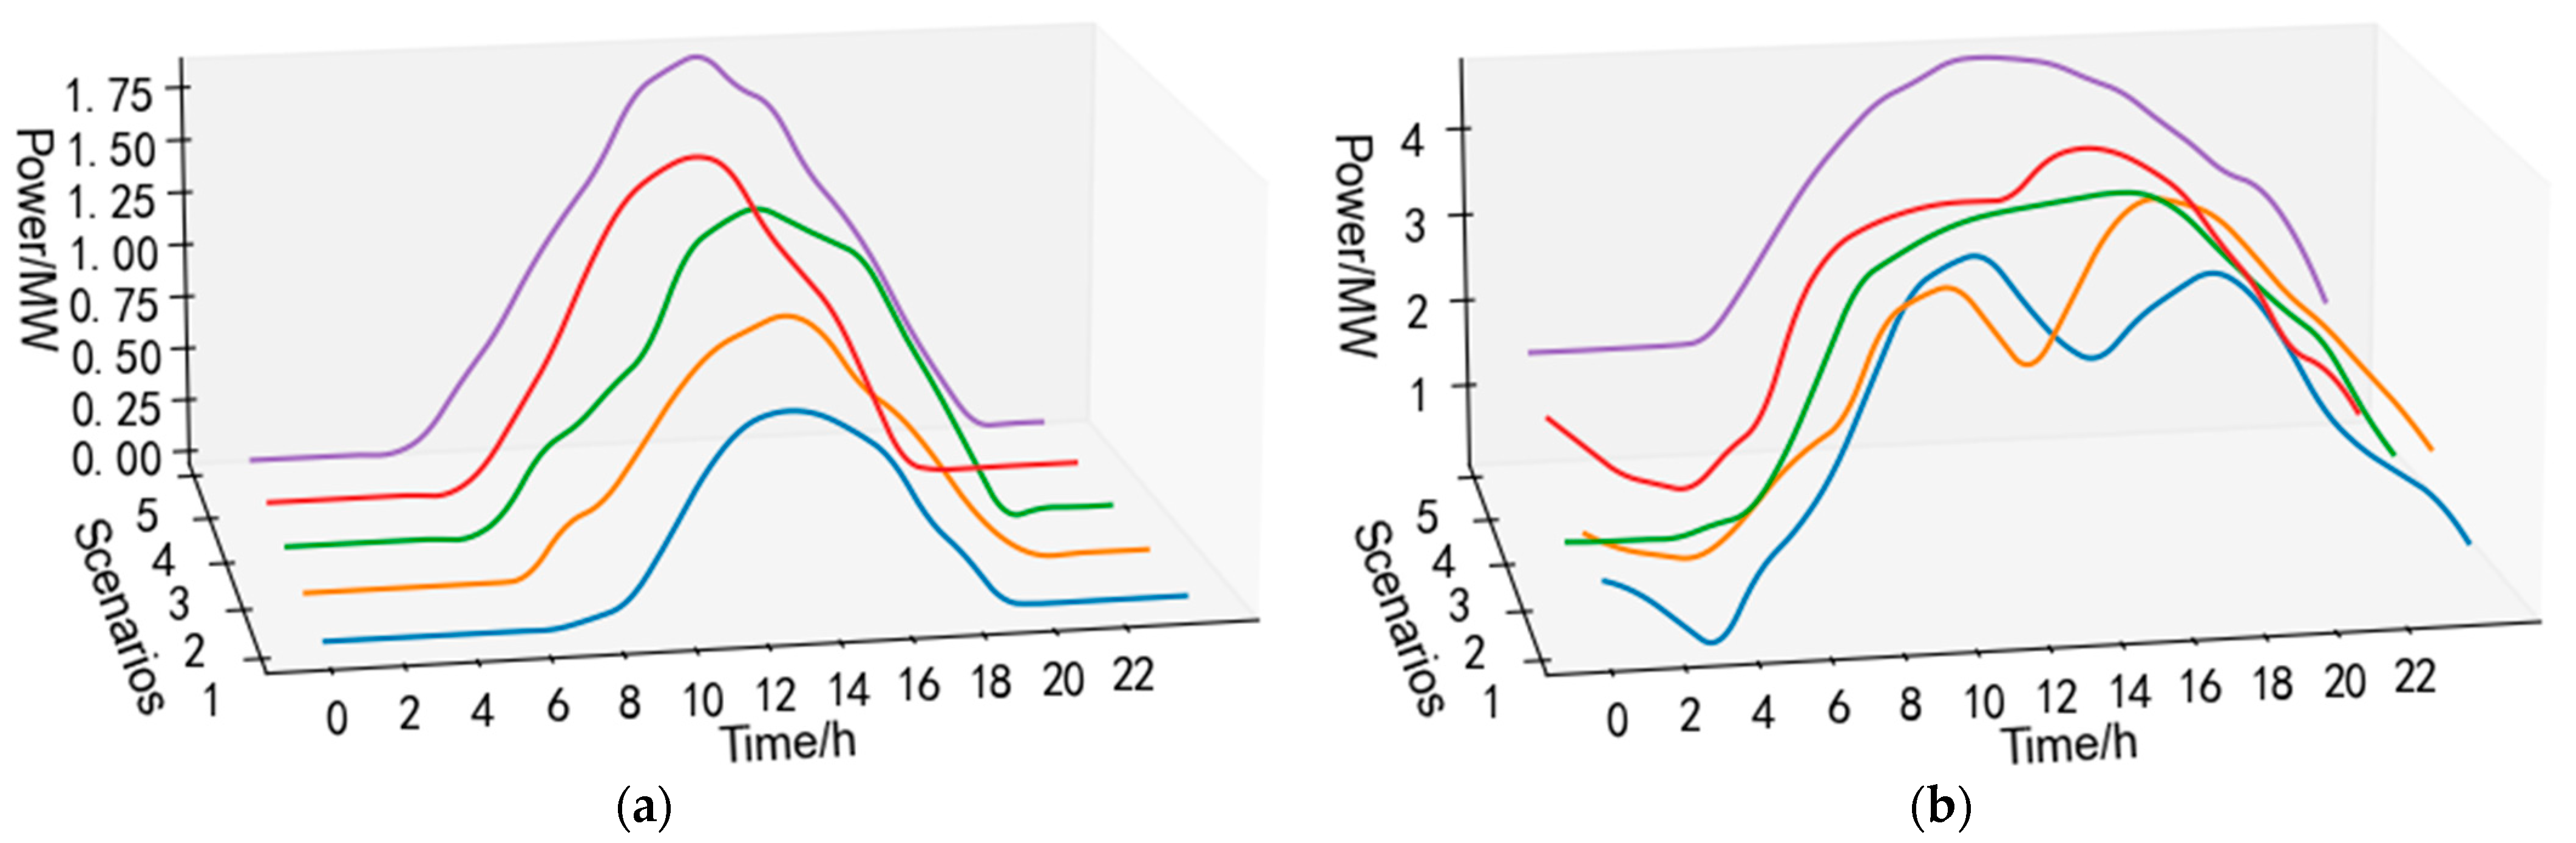
Figure 3. According to the annual photovoltaic output and load power in a certain place in Jiangxi, the joint distribution scenario of five photovoltaic power-generation scenarios and five load scenarios was obtained by scene reduction, and the distribution of each scene is shown in Table 1 and Figure 4. In Figure 4, the 5 lines represent PV and load power changes throughout the day under 5 different scenarios. The initial PV units with 450 kVA, 500 kVA, 450 kVA, and 400 kVA capacities are connected to nodes 14, 22, 24, and 31, respectively. Considering that the installation of SOP is limited by geographic location, the installation location for SOP is selected at the connection switch. Additionally, one photovoltaic unit is planned to be installed at node 11. The optimization of SOP, ESS, and PV is conducted based on all typical scenarios, and, finally, the optimized results are validated under a specific scenario of photovoltaic (scenario 3) and load (scenario 1).
In this example, the four access comparison schemes are set as follows:
Scheme 1: Do not install any SOP and ESS;
Scheme 2: Install a set of SOP and ESS at random locations;
Scheme 3: The system optimizes access to one set of SOP and one set of ESS.
Scheme 4: The system optimizes access to two sets of SOP and two sets of ESS.
The four schemes are progressively advanced and compared with each other. Scheme 1 directly uses the SSGA algorithm to solve the access photovoltaic capacity. Scheme 2 randomly selects the installation positions of SOP and ESS to determine the installation capacity of each device. Scheme 3 and Scheme 4 use the SOCP-SSGA hybrid algorithm to optimize the installation of SOP, ESS, and PV, resulting in optimal economic cost and access to distributed photovoltaic capacity for each scenario in the distribution network cycle. Finally, draw the voltage diagram of each node and the running-state diagram of each device in a typical scenario (photovoltaic scenario 3 and load scenario 1). Table 2 shows the parameters in the distribution network system planning.

5.2. Comparative Analysis of Optimization Schemes

  • Scheme 1
No SOP and ESS were installed in the system and a photovoltaic unit was connected at node 11. The SSGA algorithm was used to optimize the photovoltaic access capacity and calculate the economic components. The optimized PV capacity and economic costs are shown in Table 3 and 
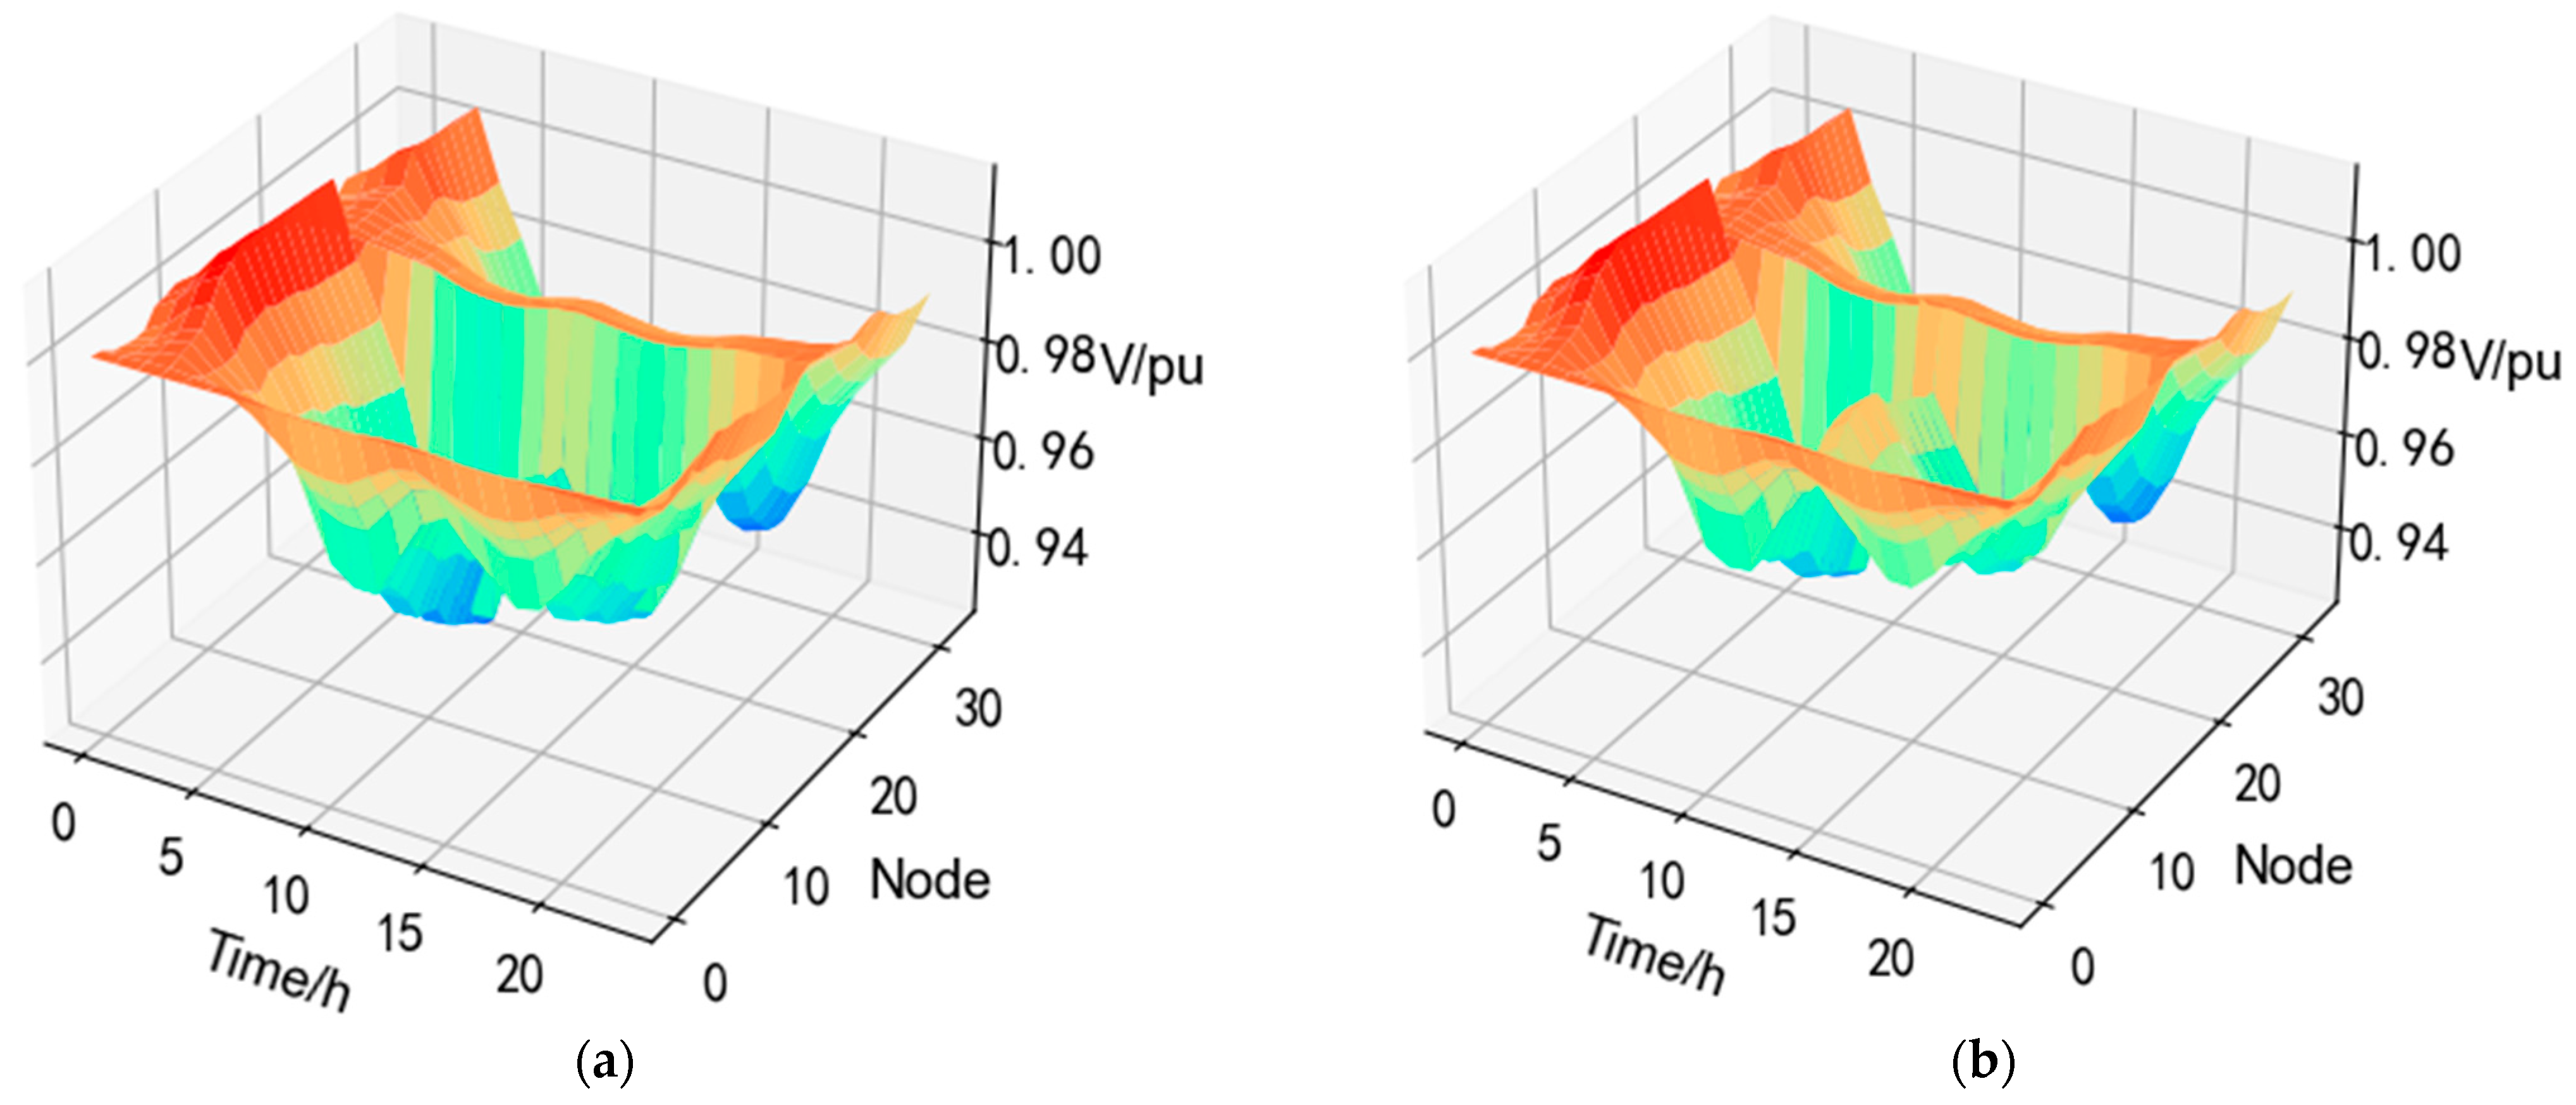
Table 4, respectively. The voltage changes at each node throughout the day before and after the optimization of PV are shown in Figure 5a,b.
As can be seen from Figure 5, PV access raises the voltage near the access node, but the overall voltage value is low.
2.
Scheme 2
A set of SOP and ESS are installed at random locations. The random installation location of SOP is between nodes 12 and 22; the random access to ESS is node 15; and a group of photovoltaic units are connected at node 11, and the access capacity of each component is solved by the optimization algorithm optimization. The configuration and economic cost of each capacity after optimization are shown in Table 5 and Table 6. The voltage changes at each node throughout the day before and after the optimization of PV are shown in 
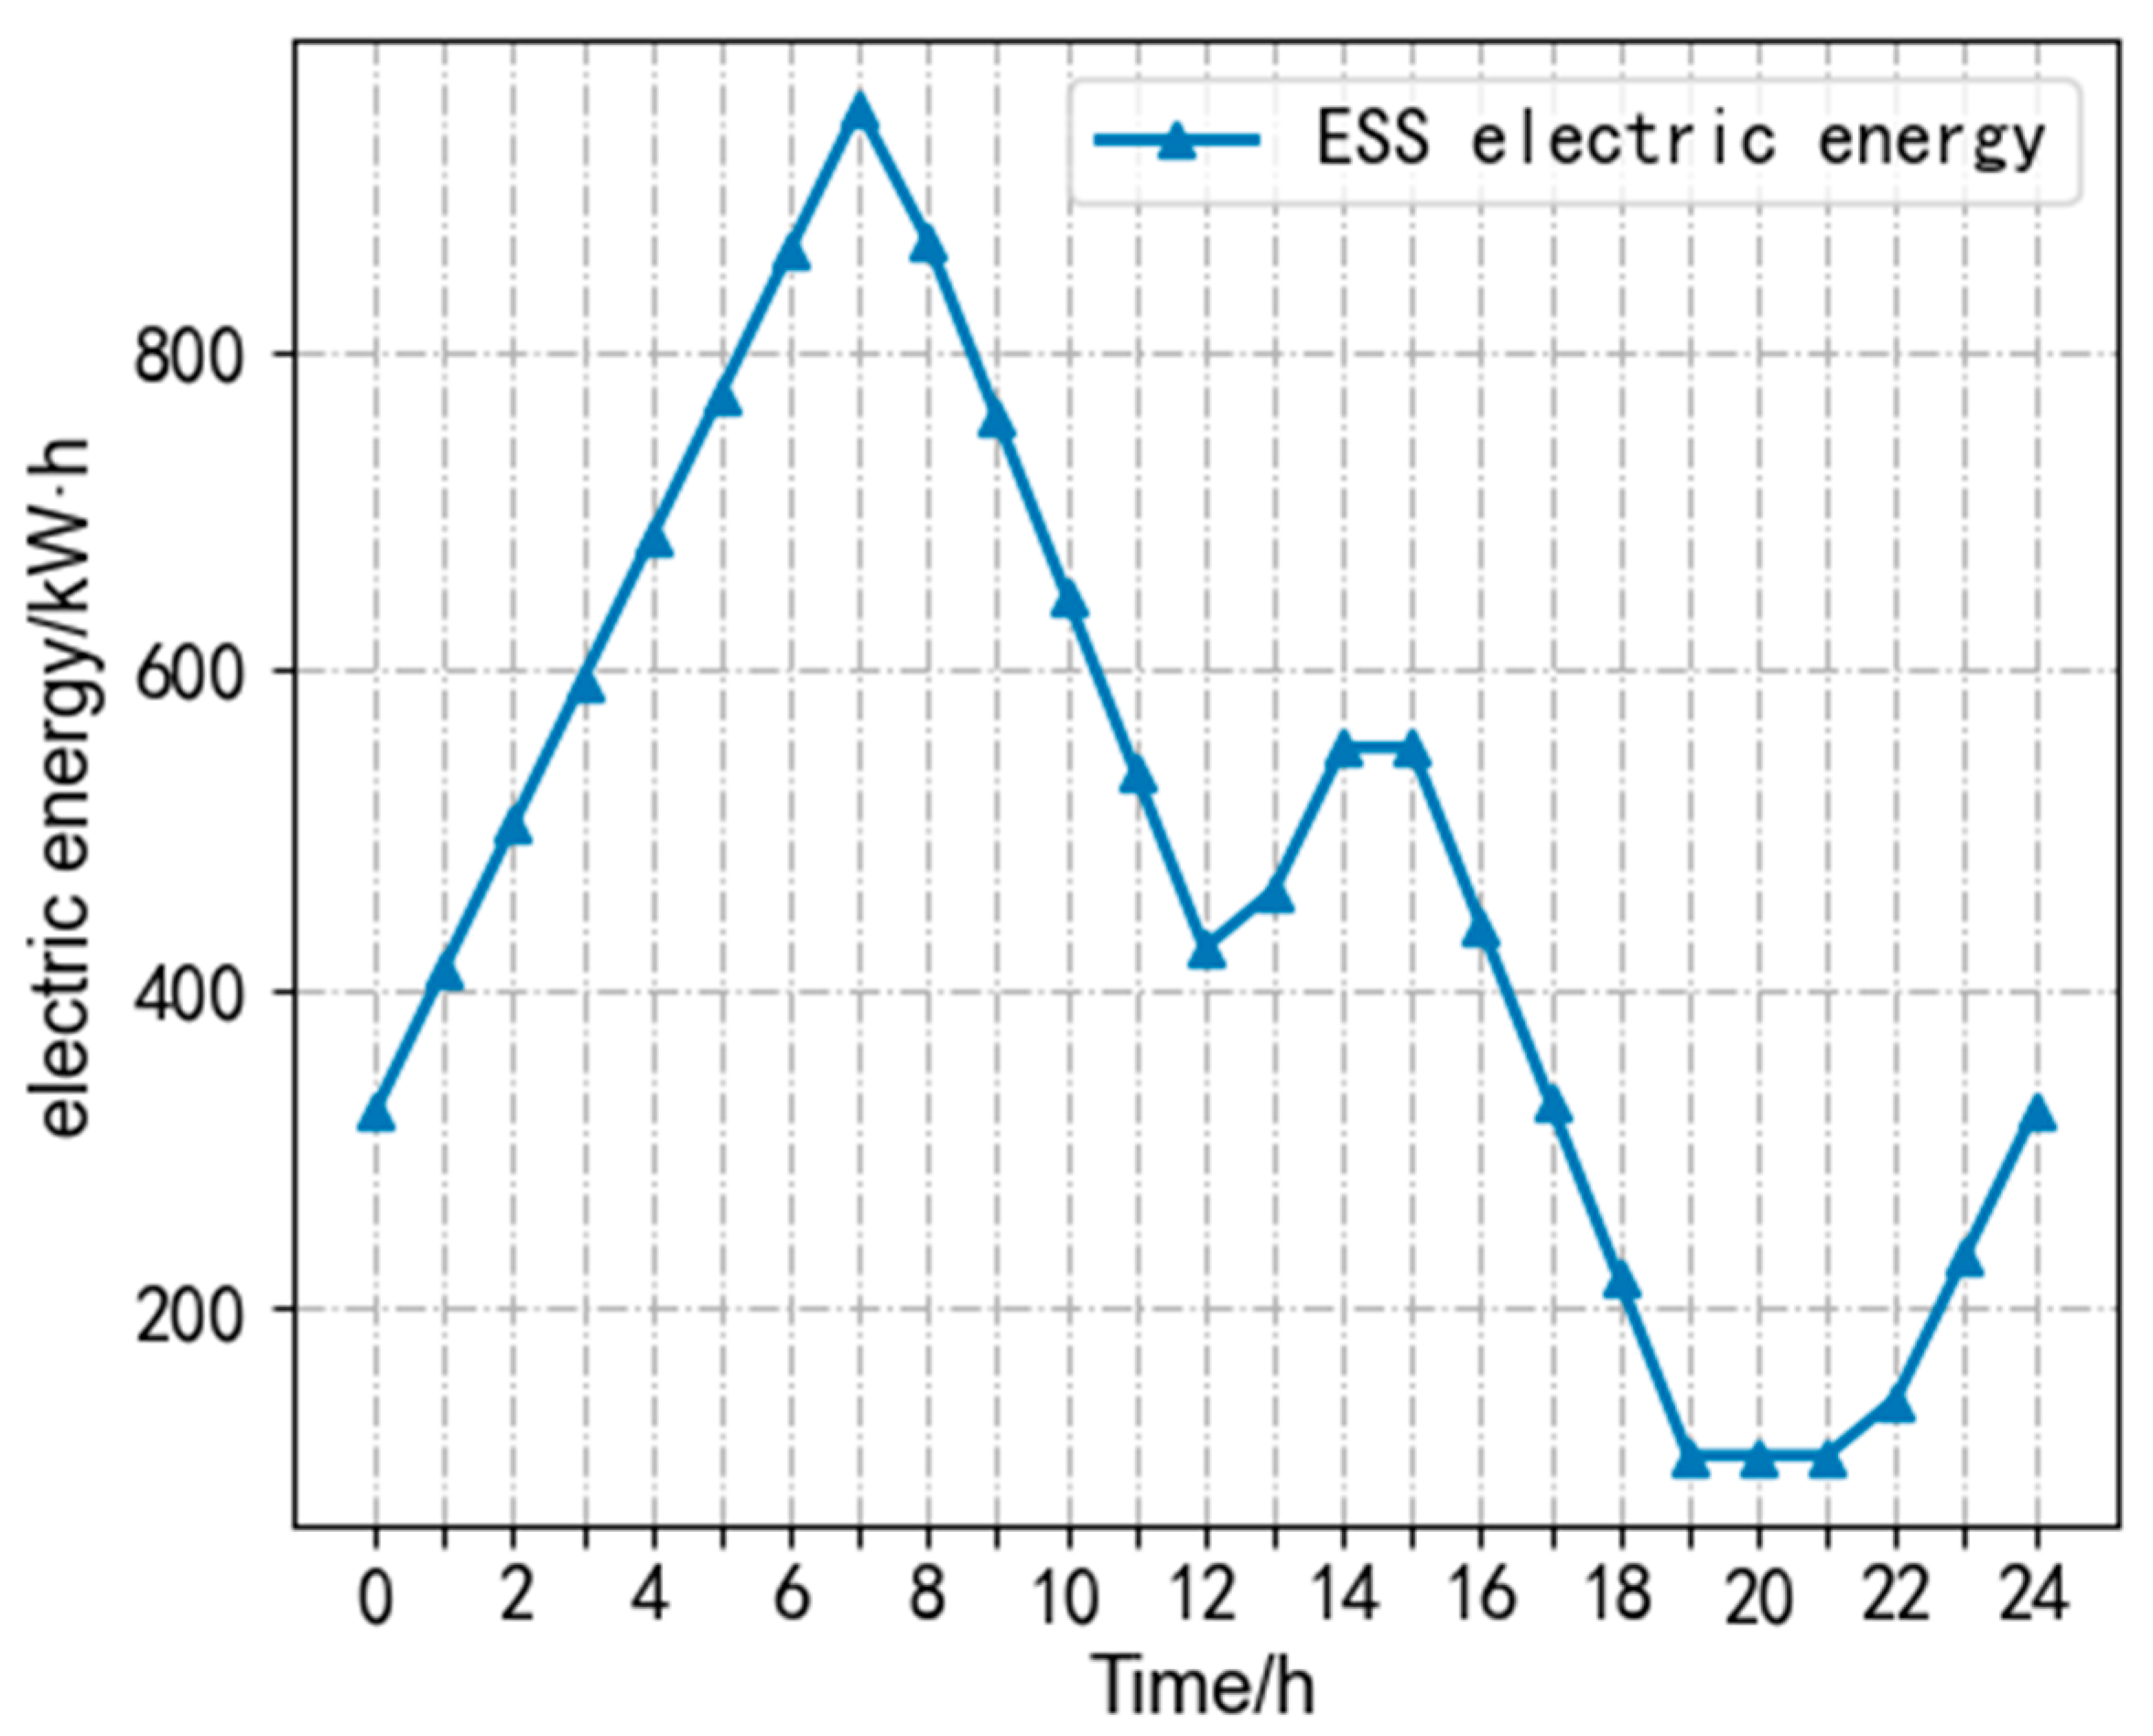
Figure 6a,b. The active power output and reactive power compensation of the SOP during daily operation after optimization are shown in Figure 7a,b, and the daily operating energy of the ESS is shown in Figure 8.
From Figure 6, it can be seen that the installation of SOP and ESS changes the voltage distribution at each node, while the installation of photovoltaic units raises the voltage at each node. From Figure 4 and Figure 7, it can be seen that during the time periods of 6:00–11:00 and 14:00–19:00, when the system load is high, SOP provides reactive power compensation to balance the power distribution in the system. As can be seen from Figure 8, ESS will charge before the peak load, and supply power to the grid after the peak to balance the load burden. The charging power is low at 14:00 because the PV output power is high at this time and the load is lower than in the morning session, therefore, the demand for ESS power is correspondingly reduced.
3.
Scheme 3
The system installed one set of SOP and ESS each and a set of photovoltaic units was installed at node 11. After optimization using the SOCP-SSGA algorithm, the optimal positions for SOP and ESS were determined to be between nodes 8 and 21 and at node 13, respectively. After optimization, the configuration and economic cost of each capacity are shown in Table 7 and Table 8. The voltage changes at each node before and after PV optimization are shown in 
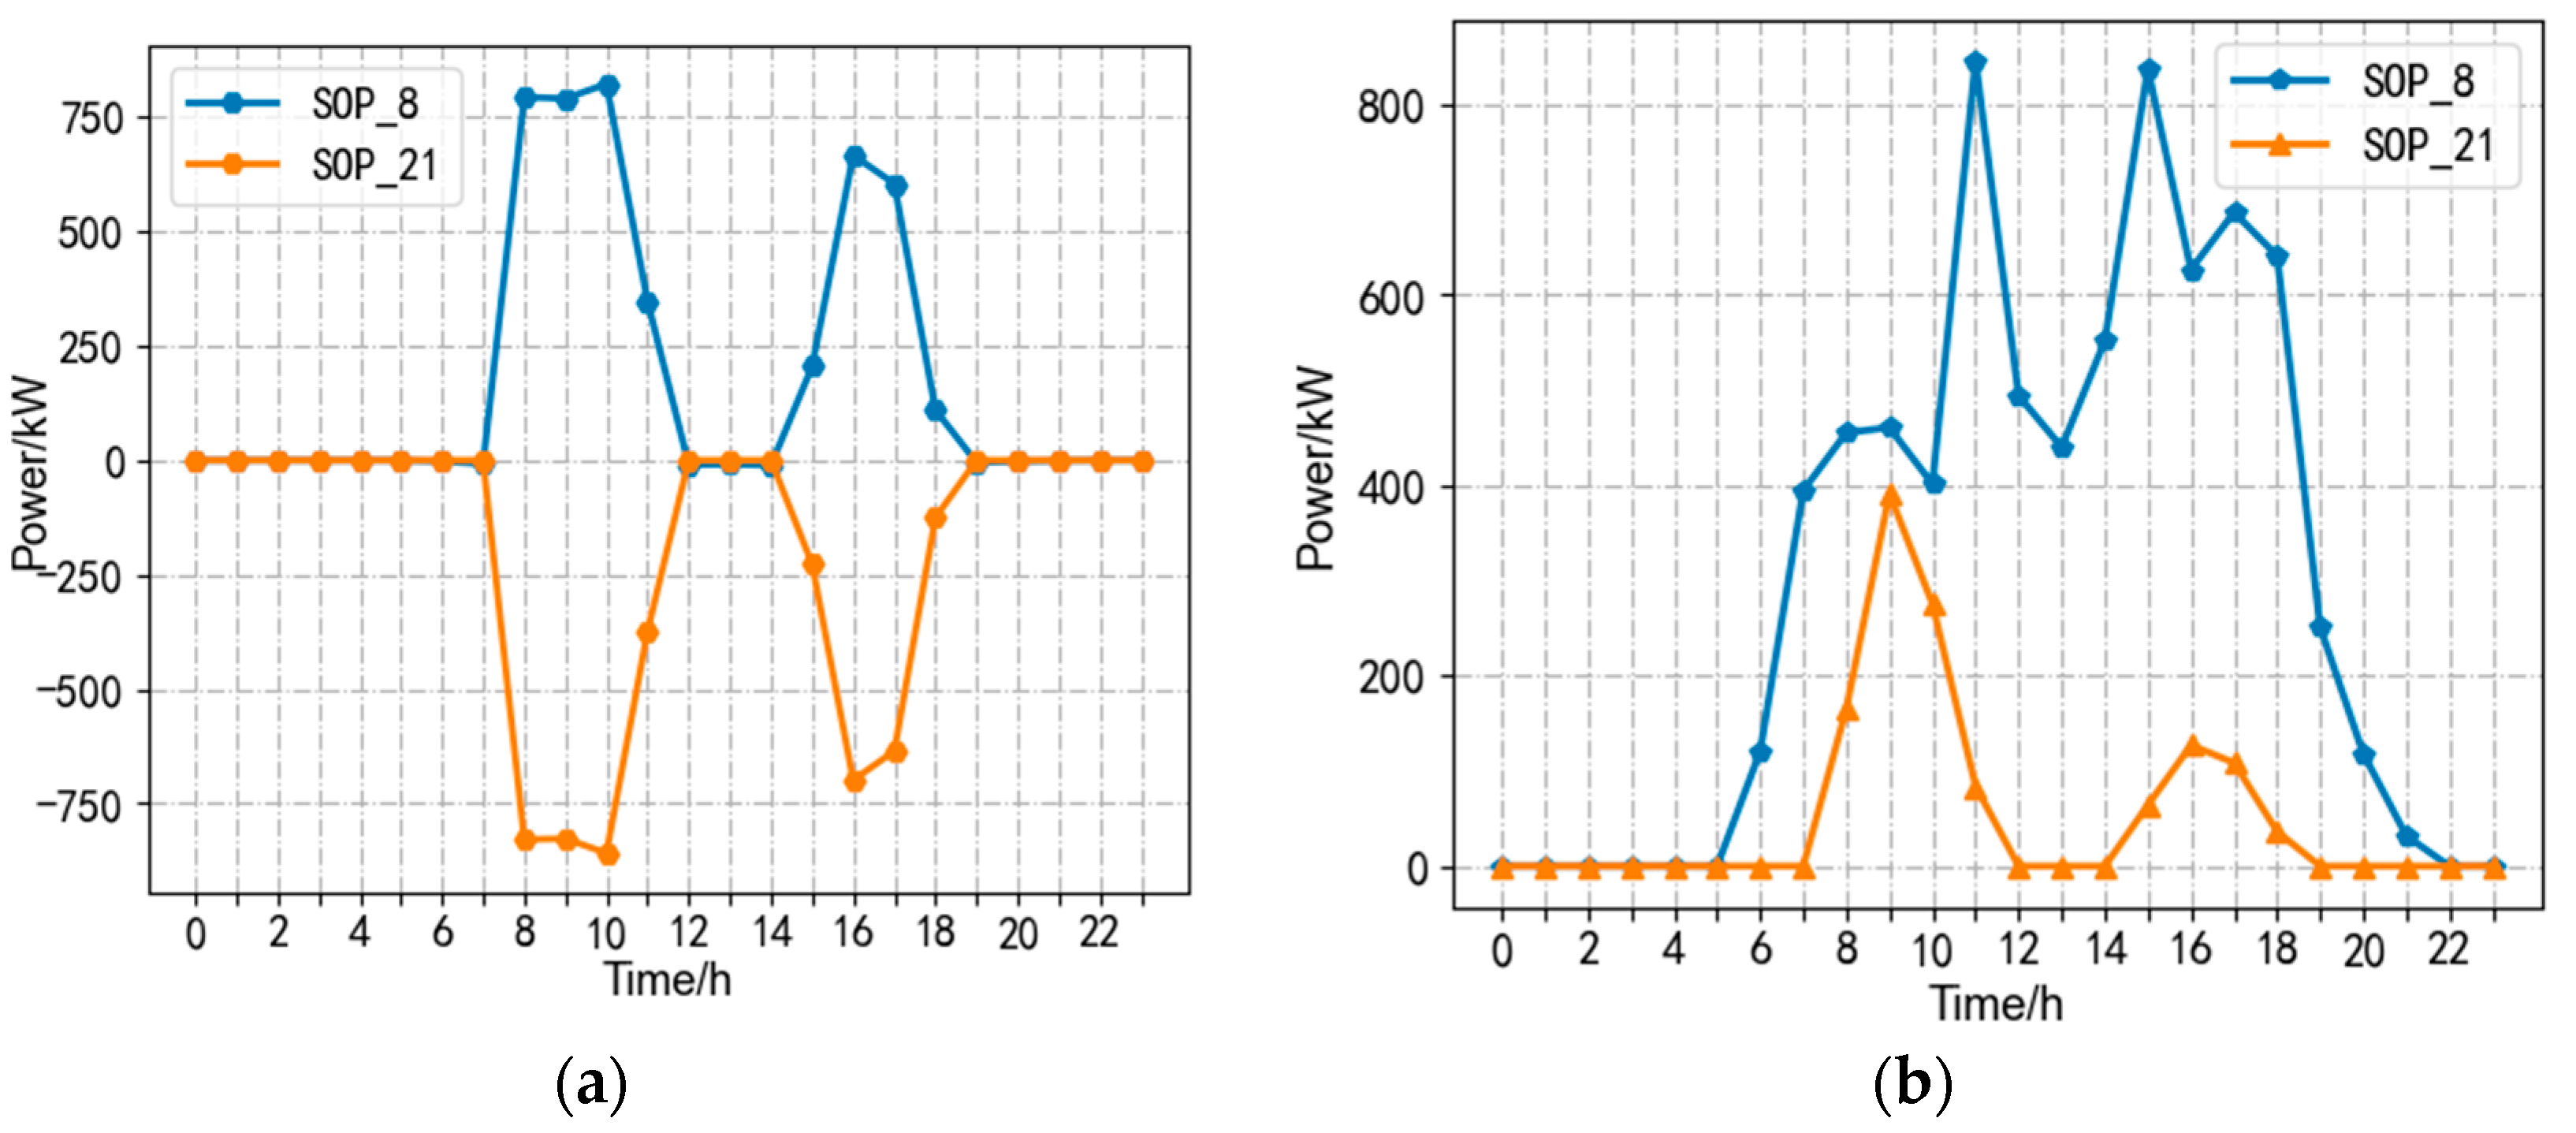
Figure 9a,b, respectively. The daily active power output and reactive power compensation of SOP after optimization are shown in Figure 10a,b, respectively, and the daily operation of ESS is shown in Figure 11.
After SOCP-SSGA is used to optimize the position and capacity in Scheme 3, the operation trend of various system indicators is roughly the same as that in Scheme 2. Moreover, due to reasonable access of SOP and ESS, SOP can provide more accurate reactive power compensation for the system, and after PV is connected to the system, the system voltage fluctuation is small, and various economic indicators of the system are better after optimization.
4.
Scheme 4
Two sets of SOP and ESS were installed in the system and one set of PV units was installed at node 11. Based on the optimized location in Scheme 3, the SOCP-SSGA algorithm was used for further optimization. The results showed that the new SOP access points were between nodes 18 and 33, while the ESS access point was at node 25. The optimized capacity configuration and economic cost are shown in Table 9 and Table 10, respectively. The voltage changes over a day at each node before and after PV optimization are shown in Figure 12a,b, respectively. The active power output and reactive power compensation of the optimized SOP are shown in Figure 13a,b and the ESS operating power is shown in Figure 14.
From Figure 12, it can be seen that as the number of SOP increases, Scheme 4 significantly improves the voltage quality of the distribution network, with voltage values at each node closer to the per-unit value. It can be observed from Figure 12 that the addition of SOP leads to a wider range of reactive power regulation time for Node 33. This is because the new PV is connected to a different feeder than Node 33, and Node 33 has a higher demand for load in the system. Therefore, SOP provides reactive power compensation to better utilize solar energy to regulate voltage and improve system stability.
From the ESS operating energy diagram in each scheme, it can be seen that the distribution network will store energy in the ESS during low load power, and as the load power increases, the ESS releases energy to balance the power load and improve power quality. With the increase of the number of ESS, the new ESS added will share the power system demand with the initial ESS so the installation capacity of the initial ESS can be appropriately reduced, and with the increase of the number of SOP, the regulating ability of the system by SOP becomes more prominent so the ESS access capacity can be further reduced. Similarly, with the increase in the number of SOP, adding a new SOP will reduce the initial SOP capacity, and multiple SOPs can cooperate to regulate the distribution-network system, and the voltage level is significantly improved.
Four schemes were compared and analyzed. In Scheme 1, the SOP and ESS are not connected to the system. When compared with this scheme, it was found that in Scheme 2, after the SOP and ESS were randomly connected, the PV capacity of the distribution network was increased from 3.7865 MW to 4.3254 MW, while the fault-loss cost decreased from RMB 78,965 to RMB 56,928. Therefore, it can be concluded that connecting the SOP and ESS significantly increases the PV access capacity and reduces the fault-loss cost.
In Scheme 3, the system optimizes access to a set of SOP and ESS and, compared with the random access of the Scheme 2 system, it can be found that the installation location and capacity of SOP and ESS after the optimization of Scheme 3 are better, mainly reflected in the fact that the system-failure loss cost after optimization is reduced from RMB 56,928 to RMB 30,117, the total economic cost is reduced from RMB 447,988 to RMB 386,259, and the PV capacity is increased from 4.3254 MW to 4.8532 MW.
With the increase in the number of Sops and ESS installed in Scheme 4, compared with the single access Sops and ESS in Scheme 3, the investment, operation, and maintenance cost of multiple Sops and ESS is lower than the investment and operation and maintenance cost of single access Sops and ESS. The fundamental reason is that multiple Sops and ESS can coordinate different locations of the distribution network, thus easing the adjustment pressure required for a single access. In addition, with the increase in the number of ESS and SOP access, the fault-loss cost and power-loss cost of the distribution network decreased significantly, the fault loss cost decreased from RMB 30,117 to RMB 23,506, and the power loss cost decreased from RMB 42,150 in the single optimized access to RMB 18,000. The PV access capacity increased from 4.3254 MW to 6.4283 MW and the access capacity was significantly improved.

5.3. Discussion

The results of the two-stage optimization model constructed in this article are influenced by several factors. Firstly, the type and severity of faults are important factors that affect the model results. Different types of faults may have different impacts on the load transfer after SOP access, which will directly affect the calculation results of the model. Secondly, the characteristics of the storage system also affect the model results. Different sizes, types, and technologies of ESS may have different performances, leading to differences in the model’s solution results. In addition, market factors such as market competition, price changes, and policy changes are also important factors. With the continuous development of technology, the performance and cost of SOP, ESS, and PV may change, which may affect the model. Therefore, in future research, it is necessary to conduct experiments on the model under different fault scenarios, consider market factors, and test and analyze the specific characteristics of different SOPs, ESS, and PVs to better evaluate the reliability of the model.

6. Conclusions

In this paper, considering the uncertainty of distributed PV and load, the scenario reduction was carried out to form a typical PV-load output scenario, the location and capacity-planning model of two-stage SOP, ESS, and PV under multiple scenarios was established, and the SOCP-SSGA hybrid optimization algorithm was used to solve the problem. Simulation analysis and verification are carried out on the improved IEEE33-node distribution network, and the results of different access schemes are compared. The following conclusions are drawn:
(1)
The SOP and ESS siting-capacity model proposed in this paper introduces fault-cost indexes under multiple scenarios into the planning objective function, which not only considers the network loss during normal operation of the distribution network but also considers the load-supporting role of SOP and ESS after faults, so as to further reduce the comprehensive operation cost of the distribution network.
(2)
The SOCP-SSGA hybrid optimization algorithm was adopted to solve the problem. The planning model proposed in this paper integrated all typical scenarios and calculated the access location and capacity of SOP and ESS. The application of this planning model makes the access scheme applicable to various scenarios so as to improve the accuracy and reliability of distribution-network planning and better meet the actual needs.
(3)
The two-stage scale model proposed in this paper improves the maximum access capacity of distributed photovoltaics in the distribution network by fully exploring the regulating role of SOP and ESS and improves the economic benefits of the distribution network on the basis of ensuring the safe operation of the system, improves the flexibility and operation efficiency of the distribution network, and makes better use of the advantages of SOP and ESS.

Author Contributions

Conceptualization, Y.J. and Q.L.; methodology, Y.J. and Q.L.; validation, J.W.; Project administration, Q.L.; data curation, X.L. and L.L.; writing—original draft preparation, Y.J.; writing—review and editing, Q.L.; supervision, Y.J. and Q.L.; All authors have read and agreed to the published version of the manuscript.

Funding

This research was funded by the National Natural Science Foundation of China, grant number 52267008.

Institutional Review Board Statement

Not applicable.

Informed Consent Statement

Not applicable.

Data Availability Statement

Not applicable.

Conflicts of Interest

The authors declare no conflict of interest.

References

  1. Lai, C.; Li, J.; Chen, B.; Huang, Y.; Wei, S. Review of Photovoltaic Power Output Prediction Technology. Trans. China Electrotech. Soc. 2019, 34, 1201–1217. [Google Scholar] [CrossRef]
  2. Chai, Y.; Guo, L.; Wang, C.; Liu, Y.; Zhao, Z. Hierarchical Distributed Voltage Optimization Method for HV and MV Distribution Networks. IEEE Trans. Smart Grid 2020, 11, 968–980. [Google Scholar] [CrossRef]
  3. Lin, X.; Li, Z.; Ye, Y.; Ma, X.; Wang, Z.; Xu, F.; Wang, C. Sizing method of flexible multi-state switches based on union-find set. Electr. Power Autom. Equip. 2020, 40, 1–8. [Google Scholar] [CrossRef]
  4. Yang, W.; Tu, C.; Lan, Z.; Xiao, F.; Guo, Q.; Wang, X. Flexible interconnection strategy between DC microgrid and AC distribution grid based on energy storage flexible multi-state switch. Electr. Power Autom. Equip. 2021, 41, 254–260. [Google Scholar] [CrossRef]
  5. Jia, G.; Chen, M.; Zhao, B.; Lu, Y.; Yang, Y. Application of Flexible Multi-State Switch in Intelligent Distribution Network. Trans. China Electrotech. Soc. 2019, 34, 1760–1768. [Google Scholar] [CrossRef]
  6. Ji, H.; Wang, C.; Li, P.; Ding, F.; Wu, J. Robust operation of soft open points in active distribution networks with high penetration of photovoltaic integration. IEEE Trans. Sustain. Energy 2019, 10, 280–289. [Google Scholar] [CrossRef]
  7. Peng, Y.; Mai, Z.; Ai, W.; Li, M.; Yan, H.; Dong, J. Active and Reactive Power Coordinated Dynamic Optimization for Active Distribution Network with Flexible Distribution Switch. Autom. Electr. Power Syst. 2020, 44, 54–61. [Google Scholar] [CrossRef]
  8. Liu, W.; Huang, Y.; Yang, Y.; Liu, X. Reliability evaluation and analysis of multi-terminal interconnect power distribution system with flexible multi-state switch. ET Gener. Transm. Distrib. 2020, 14, 4746–4754. [Google Scholar] [CrossRef]
  9. Li, Z.; Ye, Y.; Wang, Z.; Wu, Y.; Xu, H. Integrated Planning and Operation Evaluation of Micro-Distribution Network Based on Flexible Multi-State Switch Interconnection. Trans. China Electrotech. Soc. 2021, 36, 487–495+516. [Google Scholar] [CrossRef]
  10. Ye, Y.; Ma, X.; Lin, X.; Li, Z.; Lu, Y.; Ding, C. Study on Site Selection of Soft Open Points Based on Dynamic GA Coding Strategy. High Volt. Eng. 2020, 46, 1171–1181. [Google Scholar] [CrossRef]
  11. Wang, C.; Song, G.; Li, P.; Ji, H.; Zhao, J.; Wu, J. Optimal Configuration of Soft Open Point for Active Distribution Network Considering the Characteristics of Distributed Generation. Proc. CSEE 2017, 37, 1889–1897. [Google Scholar] [CrossRef]
  12. Su, R.; He, G.; Su, S.; Duan, Y.; Cheng, J.; Chen, H.; Wang, K.; Zhang, C. Optimal placement and capacity sizing of energy storage systems via NSGA-II in active distribution network. Front. Energy Res. 2023, 10, 1073194. [Google Scholar] [CrossRef]
  13. Liu, H.; Xu, L.; Hao, S.; Zhang, X.; Zhang, C. Optimization method of distributed hybrid energy storage based on distribution network partition. Electr. Power Autom. Equip. 2020, 40, 137–145. [Google Scholar] [CrossRef]
  14. Lu, Z.; Xu, X.; Yan, Z. Data-driven stochastic programming for energy storage system planning in high PV-penetrated distribution network. Int. J. Electr. Power Energy Syst. 2020, 123, 106326. [Google Scholar] [CrossRef]
  15. Rasoul, G.; Mojtaba, M.; Yang, F.; Evan, G.; Lu, J. Multi-objective energy storage capacity optimization considering Microgrid generation uncertainties. Int. J. Electr. Power Energy Syst. 2020, 119, 105908. [Google Scholar] [CrossRef]
  16. Yan, Q.; Dong, X.; Mu, J.; Ma, Y. Optimal configuration of energy storage in an active distribution network based on improved multi-objective particle swarm optimization. Power Syst. Prot. Control 2022, 50, 11–19. [Google Scholar] [CrossRef]
  17. Ahmad, A.; Sirjani, R. Optimal Allocation of Energy Storage System in Transmission System Considering Wind Power. In Proceedings of the 2020 7th International Conference on Electrical and Electronics Engineering (ICEEE), Antalya, Turkey, 14–16 April 2020. [Google Scholar] [CrossRef]
  18. Bai, L.; Jiang, T.; Li, F.; Chen, H.; Li, X. Distributed energy storage planning in soft open point based active distribution networks incorporating network reconfiguration and DG reactive power capability. Appl. Energy 2018, 210, 1082–1091. [Google Scholar] [CrossRef]
  19. Sun, C.; Li, J.; Yuan, K.; Song, G.; Ji, J.; Li, P. Two-stage Optimization Method of Soft Open Point and Energy Storage System in Distribution Network Based on Interval Optimization. High Volt. Eng. 2021, 47, 45–54. [Google Scholar] [CrossRef]
  20. Yao, C.; Zhou, C.; Yu, J.; Xu, K.; Li, P.; Song, G. A Sequential Optimization Method for Soft Open Point Integrated with Energy Storage in Active Distribution Networks. Energy Procedia 2018, 145, 528–533. [Google Scholar] [CrossRef]
  21. Wang, J.; Zhou, N.; Tao, A.; Wang, Q. Optimal Operation of Soft Open Points-Based Energy Storage in Active Distribution Networks by Considering the Battery Lifetime. Front. Energy Res. 2021, 10, 633401. [Google Scholar] [CrossRef]
  22. Huang, Z.; Chen, Y.; Mao, Z.; Sun, J.; Cha, X. Joint Access Planning of Soft Open Point and Distributed Energy Storage System. Autom. Electr. Power Syst. 2022, 46, 29–37. [Google Scholar]
  23. Su., M.; Huo, Q.; Wei, T.; Guo, X. Flexible Multi-State Switch Application Scenario Analysis. In Proceedings of the 2019 14th IEEE Conference on Industrial Electronics and Applications (ICIEA), Xi’an, China, 19–21 June 2019. [Google Scholar] [CrossRef]
  24. Wang, C.; Sun, C.; Li, P.; Xing, F.; Yu, Y. SNOP- based Operation Optimization and Analysis of Distribution Networks. Autom. Electr. Power Syst. 2015, 39, 82–87. [Google Scholar]
  25. Li, P.; Ji, H.; Wang, C.; Zhao, J.; Song, G.; Ding, F.; Wu, J. Coordinated Control Method of Voltage and Reactive Power for Active Distribution Networks Based on Soft Open Point. IEEE Trans. Sustain. Energy 2017, 8, 1430–1442. [Google Scholar] [CrossRef] [Green Version]
  26. Su, M.; Wei, T.; Huo, Q.; Guo, X. Research on Feeder Interconnect Flexible Multi-State Switch. In Proceedings of the 2019 IEEE Innovative Smart Grid Technologies—Asia (ISGT Asia), Chengdu, China, 21–24 May 2019. [Google Scholar] [CrossRef]
  27. Yu, C.; Zhang, G.; Peng, B.; Xie, R.; Shen, C.; Xu, K. Feeder Power Flow Control Strategy for Flexible Multi-state Switch with Joint Access to the Distributed Generation. In Proceedings of the 2020 5th Asia Conference on Power and Electrical Engineering (ACPEE), Chengdu, China, 4–7 June 2020. [Google Scholar] [CrossRef]
  28. Wu, S.; Li, Q.; Liu, J.; Zhou, Q.; Wang, C. Bi-level Optimal Configuration for Combined Cooling Heating and Power Multi-microgrids Based on Energy Storage Station Service. Power Syst. Technol. 2021, 45, 3822–3832. [Google Scholar] [CrossRef]
  29. Huang, C.; Li, F.; Ding, T.; Jin, Z.; Ma, X. Second-Order Cone Programming-Based Optimal Control Strategy for Wind Energy Conversion Systems Over Complete Operating Regions. IEEE Trans. Sustain. Energy 2015, 6, 263–271. [Google Scholar] [CrossRef]
  30. Sun, Y.; Zhang, B.; Ge, L.; Denis, S.; Wang, J.; Xu, Z. Day-ahead optimization schedule for gas-electric integrated energy system based on second-order cone programming. CSEE J. Power Energy Syst. 2020, 6, 142–151. [Google Scholar] [CrossRef]
Figure 1. The basic structure of back-to-back SOP.
Processes 11 01844 g001
Figure 2. Two-stage programming-model solution flowchart.
Processes 11 01844 g002
Figure 3. Improving the IEEE33 node distribution-network system.
Processes 11 01844 g003
Figure 4. Photovoltaic and load scenarios with daily output curves: (a) photovoltaic; (b) load.
Processes 11 01844 g004
Figure 5. Voltage change chart of each node: (a) PV not connected; (b) Access PV.
Processes 11 01844 g005
Figure 6. Voltage change chart of each node: (a) PV not connected; (b) Access PV.
Processes 11 01844 g006
Figure 7. SOP running active and reactive power: (a) SOP active power; (b) SOP reactive power.
Processes 11 01844 g007
Figure 8. The operating power of ESS.
Processes 11 01844 g008
Figure 9. Voltage change chart of each node: (a) PV not connected; (b) Access PV.
Processes 11 01844 g009
Figure 10. SOP running active and reactive power: (a) SOP active power; (b) SOP reactive power.
Processes 11 01844 g010
Figure 11. Operating power of ESS.
Processes 11 01844 g011
Figure 12. Voltage change chart of each node: (a) PV not connected; (b) Access PV.
Processes 11 01844 g012
Figure 13. SOP running active and reactive power: (a) SOP active power; (b) SOP reactive power.
Processes 11 01844 g013
Figure 14. Operating power of ESS.
Processes 11 01844 g014
Table 1. PV-load scenario probability.
P P V P L O A D
Scenario 1Scenario 2Scenario 3Scenario 4Scenario 5
Scenario 10.01420.0460.04170.06810.0412
Scenario 20.04730.02550.05630.03480.0384
Scenario 30.07710.00730.01810.06730.0219
Scenario 40.06930.05350.00840.01120.0049
Scenario 50.01820.04240.06290.06570.0581
Table 2. Parameters in system planning.
ParameterNumeric Value
SOP life/year20
ESS life/year
PV life/year
9
25
SOP investment cost per unit capacity/(RMB/kVA)1000
ESS investment cost per capacity/(RMB/kVA)800
PV unit-capacity investment cost/(RMB/kVA)2000
SOP, ESS, and PV operating maintenance factors0.01
Cost factor for loss0.08
electrovalence0.6
Discount rate d
Converter loss factor
0.08
0.02
Probability of line failure2.19%
Steady-state genetic algorithm population size50
Number of steady-state genetic algorithm iterations200
Table 3. PV capacity after optimization in Scheme 1.
Access DevicePV
Access Capacity (MW)3.7865
Table 4. Economic cost after optimization of Scheme 1.
Economic ComponentFee (RMB 10,000)
Failure loss7.8965
Electrical energy loss4.3496
total12.2461
Table 5. Optimized capacity configuration in Scheme 2.
Access DeviceSOPESSPV
Access Capacity (MW)1.11939 × 20.921684.3254
Table 6. Optimized economic costs of Scheme 3.
Economic ComponentFee (RMB 10,000)
SOP investment22.8025
SOP operation and maintenance2.2388
ESS Investment8.6144
ESS operation and maintenance0.7373
Failure loss5.6928
Electrical energy loss4.7130
total44.7988
Table 7. Optimized capacity configuration in Scheme 3.
Access DeviceSOPESSPV
Access Capacity (MW)0.91479 × 21.077714.8532
Table 8. Economic cost after optimization of Scheme 3.
Economic ComponentFee (RMB 10,000)
SOP investment18.6347
SOP operation and maintenance1.8296
ESS Investment10.0727
ESS operation and maintenance0.8622
Failure loss3.0117
Electrical energy loss4.2150
total38.6259
Table 9. Optimized capacity configuration in Scheme 4.
Access DeviceSOP1SOP1ESS1ESS2PV
Access Capacity (MW)0.42591 × 20.28113 × 20.42640.35756.4283
Table 10. Economic cost after optimization of Scheme 4.
Economic ComponentFee (RMB 10,000)
SOP investment14.4028
SOP operation and maintenance1.4141
ESS Investment7.3266
ESS operation and maintenance0. 6271
Failure loss2.3506
Electrical energy loss1.8000
total27.9211
Disclaimer/Publisher’s Note: The statements, opinions and data contained in all publications are solely those of the individual author(s) and contributor(s) and not of MDPI and/or the editor(s). MDPI and/or the editor(s) disclaim responsibility for any injury to people or property resulting from any ideas, methods, instructions or products referred to in the content.

