1. Introduction
Drying foods is an essential process for food security and sustainability [
1] that depends on the heat and mass transfer process to reduce the moisture content of the final dried products below the critical level and induce physicochemical changes [
2].
The issue of dried food quality has recently received a lot of attention. Most fresh fruits and vegetables are classified as highly perishable because their moisture content ranges between 80 and 95% [
3]. Improper processing, in particular, causes extensive wastage of seasonal fruits in many countries, with estimates ranging from 30 to 40% in developing countries [
4]. During the drying process, foods undergo numerous physical and chemical changes. The quality of the dehydrated product is affected by the raw material quality, preparation method, processing treatments, and drying conditions [
5,
6]. The simplest and oldest method of food drying is hot air or convection drying [
7].
Conventional food drying techniques are associated with issues such as case hardening, prolonged drying time, and high energy consumption [
8]. Therefore, constant temperature hot-air drying has been used to dry a variety of food materials, including lemon [
9], pumpkin [
10], pepper [
11], and ginger [
12]. Heat and mass transfer, moisture diffusivity, and activation energy have all been extensively investigated for a better understanding of the physical properties and thermal mechanisms that could be used to improve drying efficiency and food product quality [
13,
14].
Moreover, hot air drying is widely preferred over novel methods for drying various agricultural products in the field, industrial, and commercial applications due to its simplicity, lower operating costs, and uniform and higher drying rates under varying temperature conditions [
15,
16]. For regulating the standard quality of dried products, optimizing drying conditions is a critical and difficult task [
17,
18]. As a result, drying and color kinetics modeling is essential for understanding drying behavior, mechanism of moisture transfer, product characteristics, the effect of pre-treatment on drying kinetics, dryer design, and optimizing the parameters of the drying process [
15,
19,
20].
Studying the drying kinetic of foods is critical for analyzing the product’s drying behavior, as was mentioned in the following research.
Silva et al. [
21] calculated the drying using three different diffusion models. The researchers used boundary conditions to solve the diffusion equations analytically and compared the results to the experimental study.
By incorporating the shrinkage effect, Saha et al. [
22] created two diffusion models. For better drying results, the authors suggested that the shrinkage effect be added to thin-layer dehydration models. They also looked at the food’s quality during dehydration. Moreover, they studied the effect of drying air temperature on the drying process.
Numerous factors influence the drying rate of agricultural products, according to [
23,
24]. The most influential factors are the drying air temperature, relative humidity, and velocity, as well as the initial moisture content of the product.
To represent and explain the single-layer drying of fruits and vegetables, the researchers created theoretical, semi-theoretical, and empirical equations [
4] for bananas [
25,
26,
27], tomatoes [
28], and garlic [
29].
Dried fruits are commonly used as sinks for both adults and children [
30]. They are also used in desserts and cakes. Dried bananas are one type of dried fruit that is also useful, and we recommend drying them to extend their life without deterioration.
Ripe banana is very perishable and deteriorates quickly after harvesting, so some attempts have been made to investigate the air-drying behavior of ripe banana in sliced form, such as [
31,
32] studied banana slices 2 mm at temperatures ranging from 40 °C to 70 °C. The slices were pre-treated with ascorbic acid before being dried to reduce browning. The initial moisture content of the tested banana fruit was between 75 and 82 % (wet basis).
Silva et al. [
33] dried whole Brazilian bananas in a convective dryer at temperatures ranging from 40 °C to 70 °C to study the drying rate at temperatures of 40 °C, 50 °C, 60 °C, and 70 °C. It was determined that the maximum drying rate occurs at the beginning of the process, and the drying constant varied between 1.95 × 10
−3 min
−1 at 40 °C and 3.60 × 10
−3 min
−1 at 70 °C.
Omolola et al. [
34] calculated the effective diffusivity by modeling the drying characteristics of a thin layer of Luvhele banana in an oven. Their developed model was compared to six mathematical drying models, and it was discovered that the two-term model predicted the best results for drying Luvhele banana.
Dandamrongrak et al. [
25] conducted numerous experimental studies to determine the drying kinetics of thin-layer banana slices.
The banana drying rate is strongly related to drying air temperature, relative humidity, and air velocity. Color is an important quality criterion for food. Unwanted changes in food color can reduce consumer acceptance as well as market value. In order to produce a high-quality dried product, bananas must be dried in an appropriate environment.
The drying process analysis can help to improve the drying system’s efficiency. Computer simulation can greatly speed up the drying system analysis. A generalized single-layer banana drying equation is thus required for this purpose. Moreover, an infrared camera (IR) is currently used as a good way to monitor and examine the thin layer of fruits during drying [
35,
36,
37].
As artificial drying is the main source to produce dried fruits such as banana slices, it is necessary to study the factors affecting the drying process under controlled conditions, as in the artificial process. It will help to determine the best values of these factors to use on a large scale to produce good-quality dried bananas. Furthermore, it will assist researchers and engineers working in the drying industry for sustainable development.
Convective drying is a popular food processing method that involves transferring moisture from the product to heated air [
38]. In addition, convective drying in a tray dryer is a simple and low-cost process that can even be used by small producers, increasing family income and reducing fruit waste while providing a new banana-derived product. As a result, determining the best temperature for drying banana slices is important and can help producers and researchers make future decisions.
Therefore, this research was carried out to predict the effect of the drying characteristics of thin-layer banana slices on the drying time to aid researchers and engineers who work in the drying industry in achieving sustainable development. The research aimed to investigate the drying profile using an infrared camera and predict the effect of the characteristics of banana slices in a single layer on the drying time, to assess the suitability of some thin-layer drying models for mass transfer, and to optimize the drying conditions in terms of air temperature, air velocity, moisture content, and thickness of the thin layer.
2. Materials and Methods
2.1. Sample Preparation
The fresh and dried moisture content of banana slices (Musa cavendish L.) was measured by a moisture analyzer with a stainless-steel platform (Model: ADAM EQUIPMENT PMB 53). The fresh bananas were acquired from a local market. The bananas were stored in the refrigerator for 24 h at 4 °C. They were then left outside until they reached room temperature. The bananas were peeled by hand, cut into slices with a sharp stainless steel knife perpendicular to the vertical axis direction, and their measuring values were recorded using a caliper (Mitutoyo Corp. Model no SC-6, Tokyo, Japan).
Each banana’s diameter was measured with a slide caliper, and its mass was weighed with an electronic balance. The banana chosen was medium in size (diameter; 28–36 mm). The banana slices’ moisture content was immediately measured and recorded. The samples’ initial moisture content ranged from 75.85% to 79.92% (w.b.). The mass of the fresh banana slices was recorded according to their thickness, as mentioned in
Table 1.
It was proposed that the readings for the decreasing weight of the banana slices as time passed through the drying process were the most important data in the numerous experiments conducted. The results dealing with moisture loss, the new moisture content of the banana slices, and the instantaneous drying rate could all be calculated and related to time using these data. The work procedures of monitoring for drying kinetics are expressed in
Figure 1.
2.2. Convection Laboratory Dryer
A convection tray dryer was used for drying (UOP 8 Tray Dryer with max. electric current 40 A, Armfield, London, UK). The thermogravimetric principle is used by the dryer. The dryer (
Figure 2) is outfitted with temperature and airflow velocity controllers. The dryer’s main components included a blower, heating unit, drying chamber, sample container, digital balance, infrared camera (IR), and data logger. The air temperature in the drying chamber was measured by a thermostat. The air velocity in the drying chamber was controlled by a manual controller unit. In the drying chamber, a series of sensors were installed to measure the air temperature and relative humidity. In order to record real-time data, the sensors were connected to a PC via a data logger, as shown in
Figure 2.
The dryer is made up of a floor-standing tunnel with an axial flow fan mounted at one end. A diffuser was used to draw air into the duct via a motor-driven axial flow fan impeller. Furthermore, the moisture flow in the dryer was removed by airflow, which was forced by the fan to the outlet. However, the outlet air was not recycled again to the dryer. The air flowing into the drying chamber is heated by a bank of electrically heated elements downstream of the fan. A rack of sample trays is suspended from a balance mounted on top of the dryer in the transparent access door chamber. The balance was continuously determined, and displayed the sample weight. To adjust the temperature in the dryer, use controls mounted on a panel at the fan end of the tunnel to change the airspeed and heater power. The power of the heater can be adjusted up to 1 kW. A thermocouples type K were used to measure the temperature of the air with an accuracy of 0.1 °C. It was used to measure the temperature of the drying air just before it entered the drying tray, where the fruits were placed to dry. The drying air’s relative humidity ranged from 4% to 13%. Air humidity was measured using a digital thermo-hygrometer with 1.5% accuracy. The velocity of drying air was measured using a digital Anemometer “BESANTEK–BST-AFM05” connected to a velocity Vane probe with an accuracy of 0.01 m/s. The velocity of the drying air was measured just before it entered the drying tray.
Temperature and humidity can be measured before and after the dryer chamber using an aspirated wet and dry bulb psychrometer. Bi-metal thermostats protect the heating elements from overheating, and heating circuits can only be activated when the fan is running. The minimum fan speed is set. The fan can be adjusted to provide the desired air velocities. Air flowed parallel to the samples’ horizontal drying surfaces. When drying conditions were met, the drying process began (constant air temperature and air velocity). Three samples were chosen at random to measure the initial and final moisture content of the banana slices with the “Moisture Analyzer”. The banana samples were distributed with a near-uniform distribution density (single layer). The banana slice samples were placed on trays and into the dryer’s tunnel, and the measurement began there. The temperature profile of drying air temperature was continuously recorded by thermocouples connected to a PC during the drying process. The relative humidity, drying air temperature, and temperature of the dried samples were all measured using “Testo 350” probes placed inside the drying chamber prior to the experiments. During the experiments, sample weight loss was measured using a digital balance (with a precision of 0.01 g).
A ThermaCAM SC640 IR Camera, Flir Systems Inc. (IR) (Wilsonville, OR, USA) was used to determine the temperature profile during the drying process for the banana surface. This thermal imaging (thermometry) uses an electronic infrared camera and is a method to determine the drying process when drying off the moisture from a banana layer surface. This infrared camera was used in this research to monitor the temperature profile and shrinkage behavior for thin-layer banana slices through the forced convection drying experiments at different values of air temperature.
2.3. Drying Procedure
A total of 48 experiments (3 reduplications for each experiment) on single-layer banana fruit drying at various air temperatures and air velocities were carried out in a laboratory-scale dryer at the Department of Agricultural System Engineering, College of Agricultural & Food Sciences, King Faisal University, from September 2022 to December 2022. Different drying air temperature values of 40 °C, 50 °C, 60 °C, and 70 °C were tested. Several drying air velocity levels were tested, including 0.2 m/s, 0.5 m/s, and 0.75 m/s. In addition, the following thicknesses of banana slices were studied: 2 mm, 4 mm, 6 mm, and 8 mm.
Throughout the drying process, the values of the drying air parameters that affect the drying kinetics were checked regularly to ensure that they were close to the values chosen for the experiment. When a minor deviation in any value occurred, the necessary adjustments were made immediately to maintain values that were identical to those assigned.
The weight was recorded every 5 min for a short period of 30 s until the sample reached a constant weight. Every 30 min, the airflow velocity was measured using a digital anemometer at the tunnel’s end. The drying test was terminated when the weight loss of the samples had nearly stopped, which was called final or equilibrium moisture content (M
eq). The value of M
eq is considered to be the final moisture content when the moisture loss from banana slices was stable for three readings by balance. The same technique was used by [
14,
32,
33]. The procedures for the methodology of the research attribute are shown in
Figure 3.
Where: T, rh, v are the air temperature, relative humidity and velocity, Tp, M, Mf, Meq, z are the product temperature, moisture content, final moisture content, equilibrium moisture content and thickness, and t is the drying time.
2.4. Measurement of Color
A Minolta CR-300 Chromameter (Minolta Co., Tokyo, Japan) was used to measure the color of fresh and dried banana surfaces in L* (luminance), a* (red–green), and b* (yellow–blue) chromaticity coordinates. At D65 (Daylight-Neutral) illuminant, the color was measured using the CIELAB scale. It is used to measure the values of these items L*, a*, and b*. Furthermore, it could determine the value of Chroma (C*) [
18,
39] and the total color division (ΔE) [
40] from the following equations:
where Δ
E is the total color difference of the thawed samples,
L*,
a*, and
b* are the color readings of lightness, redness, and yellowness of the samples, respectively, and
L*
0,
a*
0, and
b*
0 are the average color readings of fresh samples.
2.5. Measurement of Total Soluble Solids (TSS)
It was estimated using a refractometer that the juice was extracted from three banana slices. It was computed using the following equation [
41]:
2.6. Measurement of Tratiable Acidity (TA)
It was calculated using the methods described by [
41], in which 5 mL of diluted banana juice (30 mL water: 1 g chopped fruit) was placed in a conical flask, and points from the phenolphthalein guide were calibrated with 0.1 N NaOH until the color turned pink, and the following equation was used to express acidity (% citric acid):
2.7. Measurement of Hardness
The hardness was measured in Newton. It was estimated by a compression test using the TA. XT-plus Texture Analyzer, manufactured by Stable Micro Systems, Vienna Court, Surrey, United Kingdom [
18].
2.8. Measurement of Shrinkage
To determine shrinkage (
Figure 4), the diameter and thickness of sliced bananas were measured with a slide caliper before and after drying. The diameter and thickness were measured at various points, and the averages were computed. The fresh and dried mass of the banana slice was also determined using an electronic balance. The banana shape is assumed to be cylindrical for our purposes.
According to Thuwapanichayanan et al. [
42], the diameter and thickness shrinkage for banana slices were defined as:
where
d is the diameter of the banana slice after drying, (mm),
di is the banana slice diameter before drying (mm),
z is the thickness of the banana slice after drying, (mm), and
zi is the thickness of banana slice before drying (mm). The methodology to measure and calculate the geometry and the dimensions of the banana slices in
Figure 4 by [
43].
2.9. Measurement of Water Activity
The water activity of dried bananas was measured at 25 °C, using a water activity meter (
LabTouch-aw, version CM-2 Sensor, CM-3 Sensor, measuring range 0.030–1.00 aw and 5–45 °C, adjustment range 0.110–0.970 aw, resolution 0.001 aw and 0.1 °C, accuracy ±0.005 aw and ±0.10 °C, Novasina, Lachen, Switzerland) [
40].
2.10. Measurement of Moisture Content
The moisture content of the initial sample was determined by drying them in a Moisture Analyzer, Model: PMB 53 (max. 50 g, d = 0.001 g) [
44]. The amount of moisture in a material can be expressed as a decimal on a wet basis. The moisture content on a wet basis of bananas is the weight of moisture per unit weight of fresh banana slices, denoted as
Mwi:
While moisture content, dry basis (
Mdi) is the weight of moisture present in the product per unit weight of dry matter
where
Mwi is the moisture content wet basis of banana slices at any time
ti,
Wd is the mass of the dried sample (kg), and
Wi is the mass of banana slices at time
ti, (kg). The determination of the banana slices’ mass was done by weighing the samples during the drying process.
2.11. Drying Rate and Moisture Ratio
The drying rate
(DR) of banana slices was calculated using the following definition [
40]:
However, the moisture ratio
(MR) of banana slices was calculated using the following equation [
18]:
where
DR is expressed as the amount of moisture evaporated over time (g
water/g
dry matter.s),
MR stands for moisture ratio,
Mt stands for moisture content at a specific time (g
water/g
dry base),
Mo stands for initial moisture content (g
water/g
dry base),
Me stands for equilibrium moisture content (g
water/g
dry base),
Mt+dt stands for moisture content at
t + dt (g
water/g
dry base), k stands for drying constant (s
−1), and
t stands for drying time (s).
The drying curves (
MR versus time) were fitted with the selected thin-layer drying models, which are detailed in
Table 2 [
40,
45]. The non-linear analysis was used to determine the model parameters. The coefficient of determination (
R2), reduced chi-square (
χ2), and root mean square error (
RMSE) between the experimental and predicted moisture values were used to assess the goodness of fit. The following formulas can be used to calculate
χ2 and
RMSE:
where
MRexp,i and
MRpre,i denotes the experimental and predicted dimensionless moisture ratios, respectively, N denotes the number of observations, and n denotes the number of constants. The best model for describing the drying characteristics of the samples was determined to have the highest
R2, the lowest
χ2, and the lowest
RMSE [
18,
40,
45].
2.12. Moisture Diffusivity and Activation Energy
Fick’s second law of unsteady state diffusion can be used to describe the drying behavior of fruits and vegetables while ignoring the effects of temperature and total pressure gradient [
42,
45]:
t denotes the drying time (s), Deff denotes the effective moisture diffusivity (m2 s−1), M denotes moisture content (kgw/kgd), and Div is a mathematical differentiation.
By assuming uniform initial moisture distribution, negligible external resistance, constant diffusivity, and negligible shrinkage, the diffusion equation for slab geometry was solved [
46,
47]. For the sliced materials of the drying material, this equation can be solved as follows:
where
n denotes the order number (0, 1, 2, 3, …),
MR denotes a dimensionless moisture ratio,
Deff denotes the effective moisture diffusivity (m
2 s
−1),
t denotes the time (s), and
L denotes the sample half-thickness (m). This model assumes no volume change, no external mass transfer resistance (mass transfer has an infinite Biot number), and an isothermal process.
Assuming that the diffusivity is constant, the diffusion equation developed for slab particles is applicable, and the equation is thus simplified and linearized as follows. For
n = 1, Equation (15) becomes:
Equations (16) and (17) for modified thickness were fitted to banana slice experimental data, and diffusivity can be calculated by minimizing the sum of squares of the deviations between predicted and experimental data.
The effective moisture diffusivity
Deff for a banana slice was determined from the plot of ln (
MR) against drying time (
t), considering the following equation:
Moreover, applying Equations (16) and (17) by plotting ln (
MR) versus drying time (
t), the slope of the plot is the value of rate constant (
K), and thus the diffusion coefficient
Deff could be determined from the slope of the straight line.
The effective moisture diffusivity can be expressed as a function of time using the Arrhenius equation:
where
Do denote the effective diffusivity at an infinite high temperature (m
2 s
−1),
Ea denotes the activation energy (kJ kg
−1),
R denotes the gas constant (kJ kmol
−1K
−1), and
T denotes the temperature of air (K).
Equation (20) could be rewritten as the following to determine the activation energy:
where
TC denotes the temperature of air (°C). The slope of the plot is [−10
3 (E
a/R)], while the interest is
ln Deff.
2.13. Statistical Analysis
The experiment was carried out three times. The statistical analyses for the color of fresh and dried banana slices were carried out in triplicate by SPSS 26. The analysis of variance with a significance level of 5%. Moreover, the statistical analyses for Hardness, TA, TSS, and water activity were conducted for the dried banana slices.
3. Results and Discussion
In general, the experimental results revealed that the drying process consists of only two stages: constant drying rate and falling drying rate periods. However, the major stage for drying thin-layer banana slices was the falling drying rate for the convection drying experiments which were run with drying air temperatures of 40 °C, 50 °C, 60 °C, and 70 °C (dry bulb temperature), and air velocity of 0.2 m/s, 0.5 m/s, and 0.75 m/s. Therefore, it was decided to focus this research work solely on the falling drying stage.
3.1. Effect of Air Temperature on the Shrinkage and the Drying Time
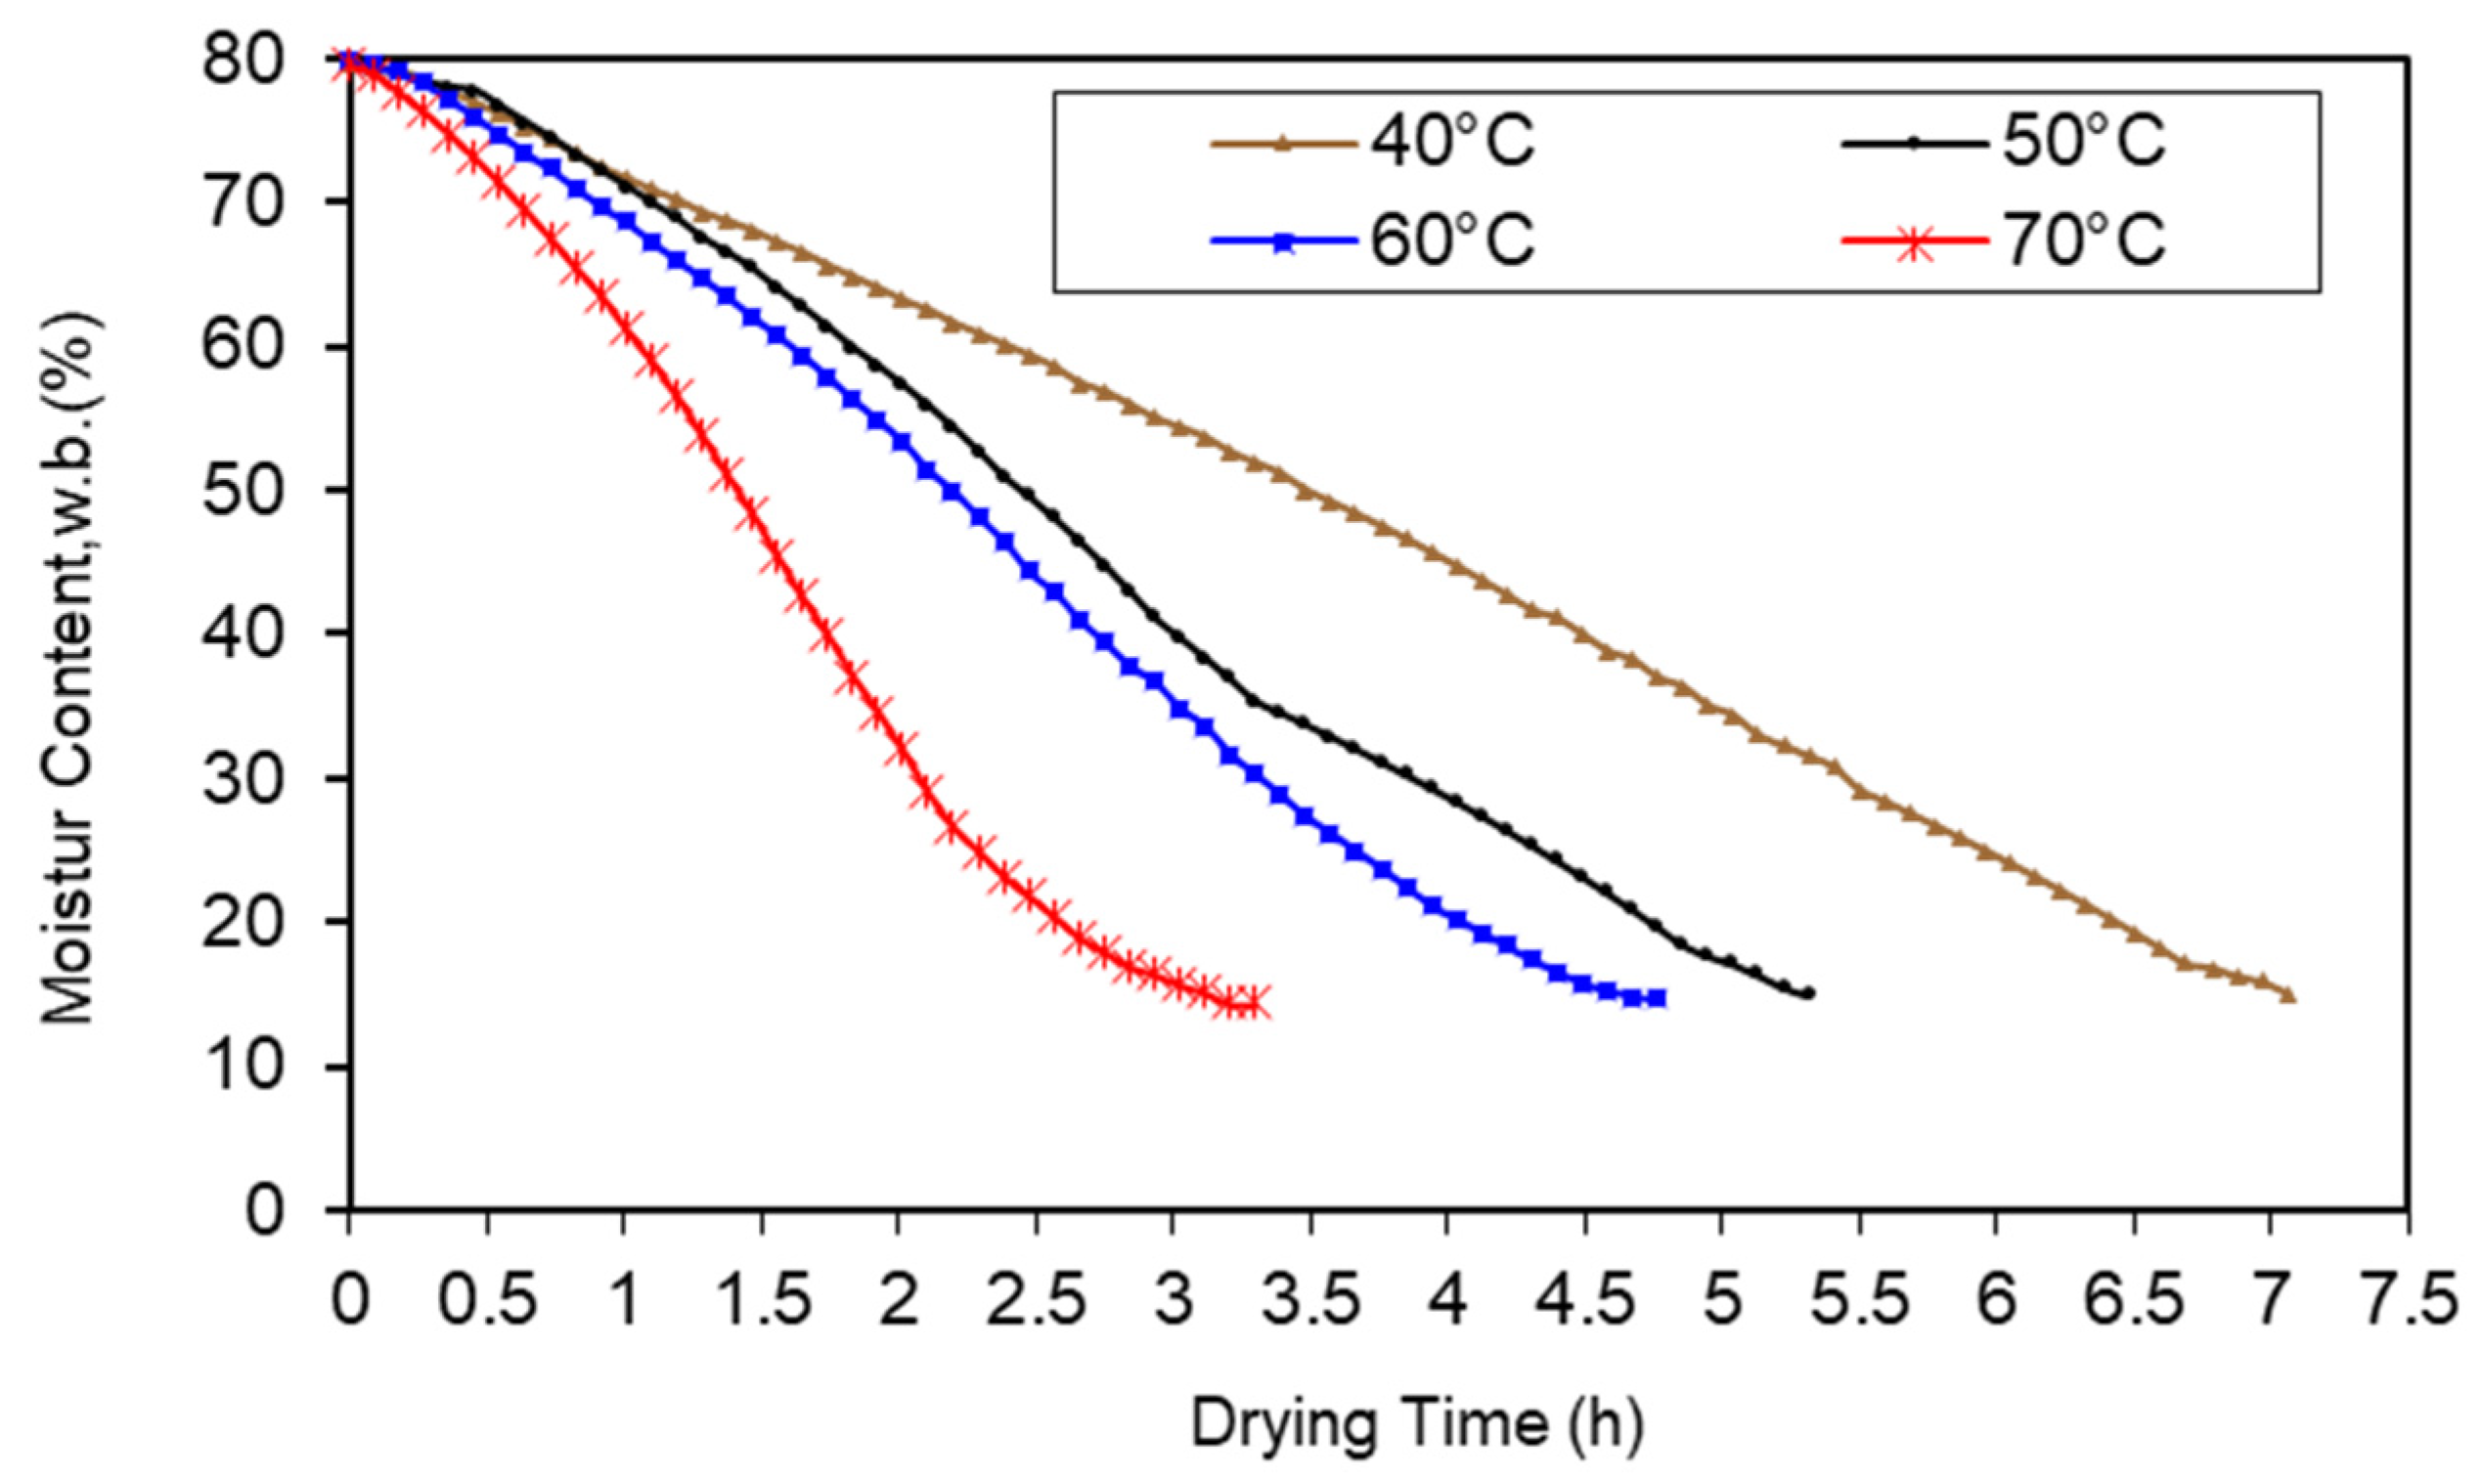
Figure 5 depicts the effect of air temperature on the thin-layer drying of banana slices. Moisture loss increased as the drying air temperature increased. Although the drying time at 50 °C was not significantly shorter than at 40 °C, this was due to the initial moisture content for banana being higher at 50 °C than at 40 °C. The time required to dry a banana slice sample at constant air velocity (0.75 m/s) and air temperatures of 40 °C, 50 °C, 60 °C, and 70 °C was approximately 7.2 h, 5.4 h, 4.8 h, and 3.3 h, respectively.
Figure 5 depicts there was no constant rate of drying and drying occurred only during the falling rate period. From
Figure 5, it is noticed that the slice warms up in a short time with a small amount decreasing in the moisture content. Afterward, the moisture evaporated from the banana slices at a higher drying rate with still warming up. However, the drying rate decreased when the slice temperature was close to the temperature of the drying air. Due to the temperature gradients and less considerable, the drying rate of the banana slice kept going more slowly. Finally, it can be observed that the process ends up when the moisture steam pressure inside the slice becomes equivalent to the drying air. These results agreed with [
42] for dried banana slices from 70 °C to 100 °C.
Furthermore, from
Figure 5, the results show that the derived equation to predict the average moisture content, w.b. (Mw), during the drying time (t) of banana slices for the experiments was found to be:
where A and B are constants. The values of these constants were applied in
Table 3.
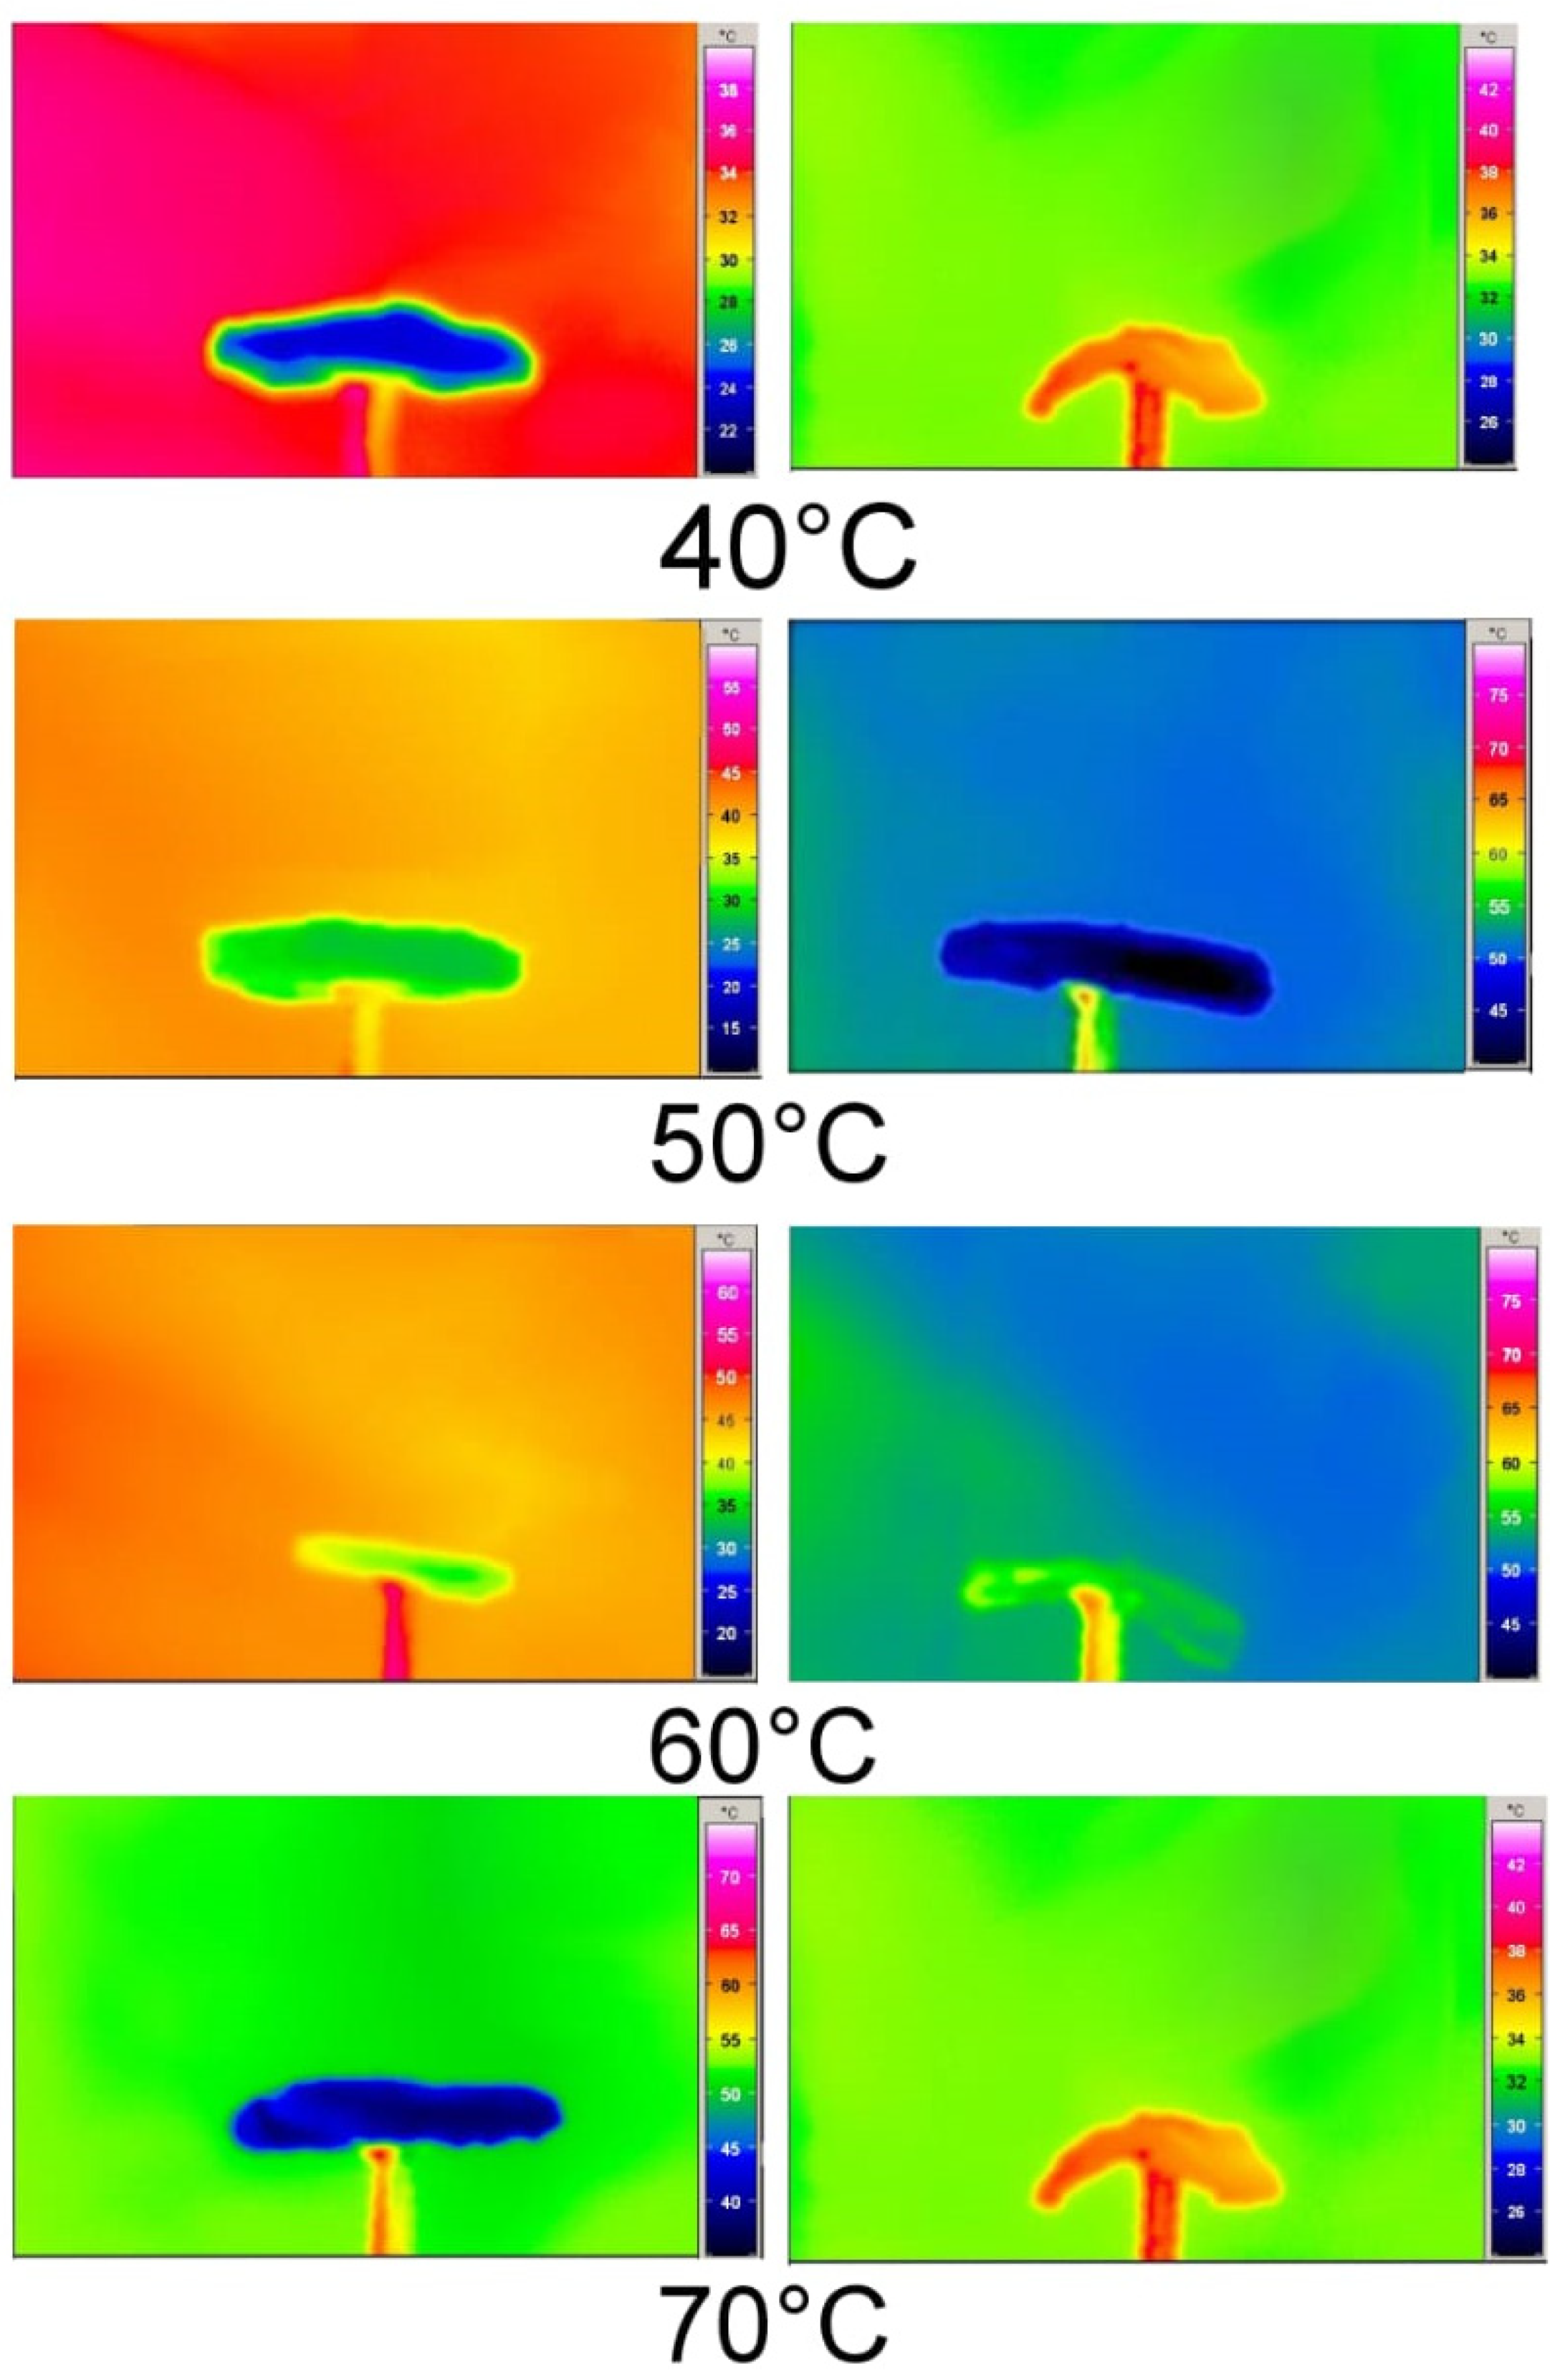
To understand the effect of temperature on a dried banana during the beginning and end of the drying process, an IR camera was used to monitor the behavior of the slices under different drying temperatures (40 °C, 50 °C, 60 °C, and 70°C) (
Figure 6). Moreover,
Figure 6 shows the temperature distribution maps of banana slices at different drying temperatures with a constant air flow rate of 0.75 m/s.
It can be clearly seen from
Figure 6 that the external boundary of banana slices was higher temperature than the pulp. This result was agreed with in [
43]. The reason for this may be that the external layer is exposed to the higher air temperature for a long time: however, the moisture removed from the pulp takes a long time to be completely removed at the end of drying period and then the temperature increases to a higher level than the beginning time of drying. It was also observed that the highest air temperature of 70 °C increased the drying rate and gave the shortest value of drying time for banana slices.
All samples had similar moisture distribution patterns, demonstrating the uniform drying characteristics of drying process. However, some moisture variation was observed in sample slices, and a higher temperature was measured at the center of heated samples. There was an increase in shrinkage related to the acceleration in moisture evaporation by the increased temperature, as shown in
Figure 6.
Figure 6 shows the banana slices had a low value temperature at the beginning of the drying process and the temperature increased gradually until the desired temperature was reached at the end of drying process. At the end of drying, a minimal moisture variation was observed in the final dried banana slices. This result may be due to removing the moisture totally from the slice. Generally, the temperature of the banana slice increased gradually from the beginning to the end of the dying process. Due to exposing the banana slices to the air temperature, the moisture was removed from it and was curved from the external sides, therefore, the appearance of shrinkage was noticed. This result agrees with the results of [
36,
37,
38].
The results show that the area and thickness shrinkages of banana samples were calculated using direct measurements before and after drying according to Equations (5) and (6). Banana shrinkage occurred during drying time, and it was noticed that the air temperature has the greatest effect on shrinkage. It found that shrinkage varies concerning moisture loss through the drying time and the reduction in radial dimension of banana slices was around 17–23% from the original slice before drying, as depicted in
Figure 7.
3.2. Effect of Air Velocity on the Drying Time
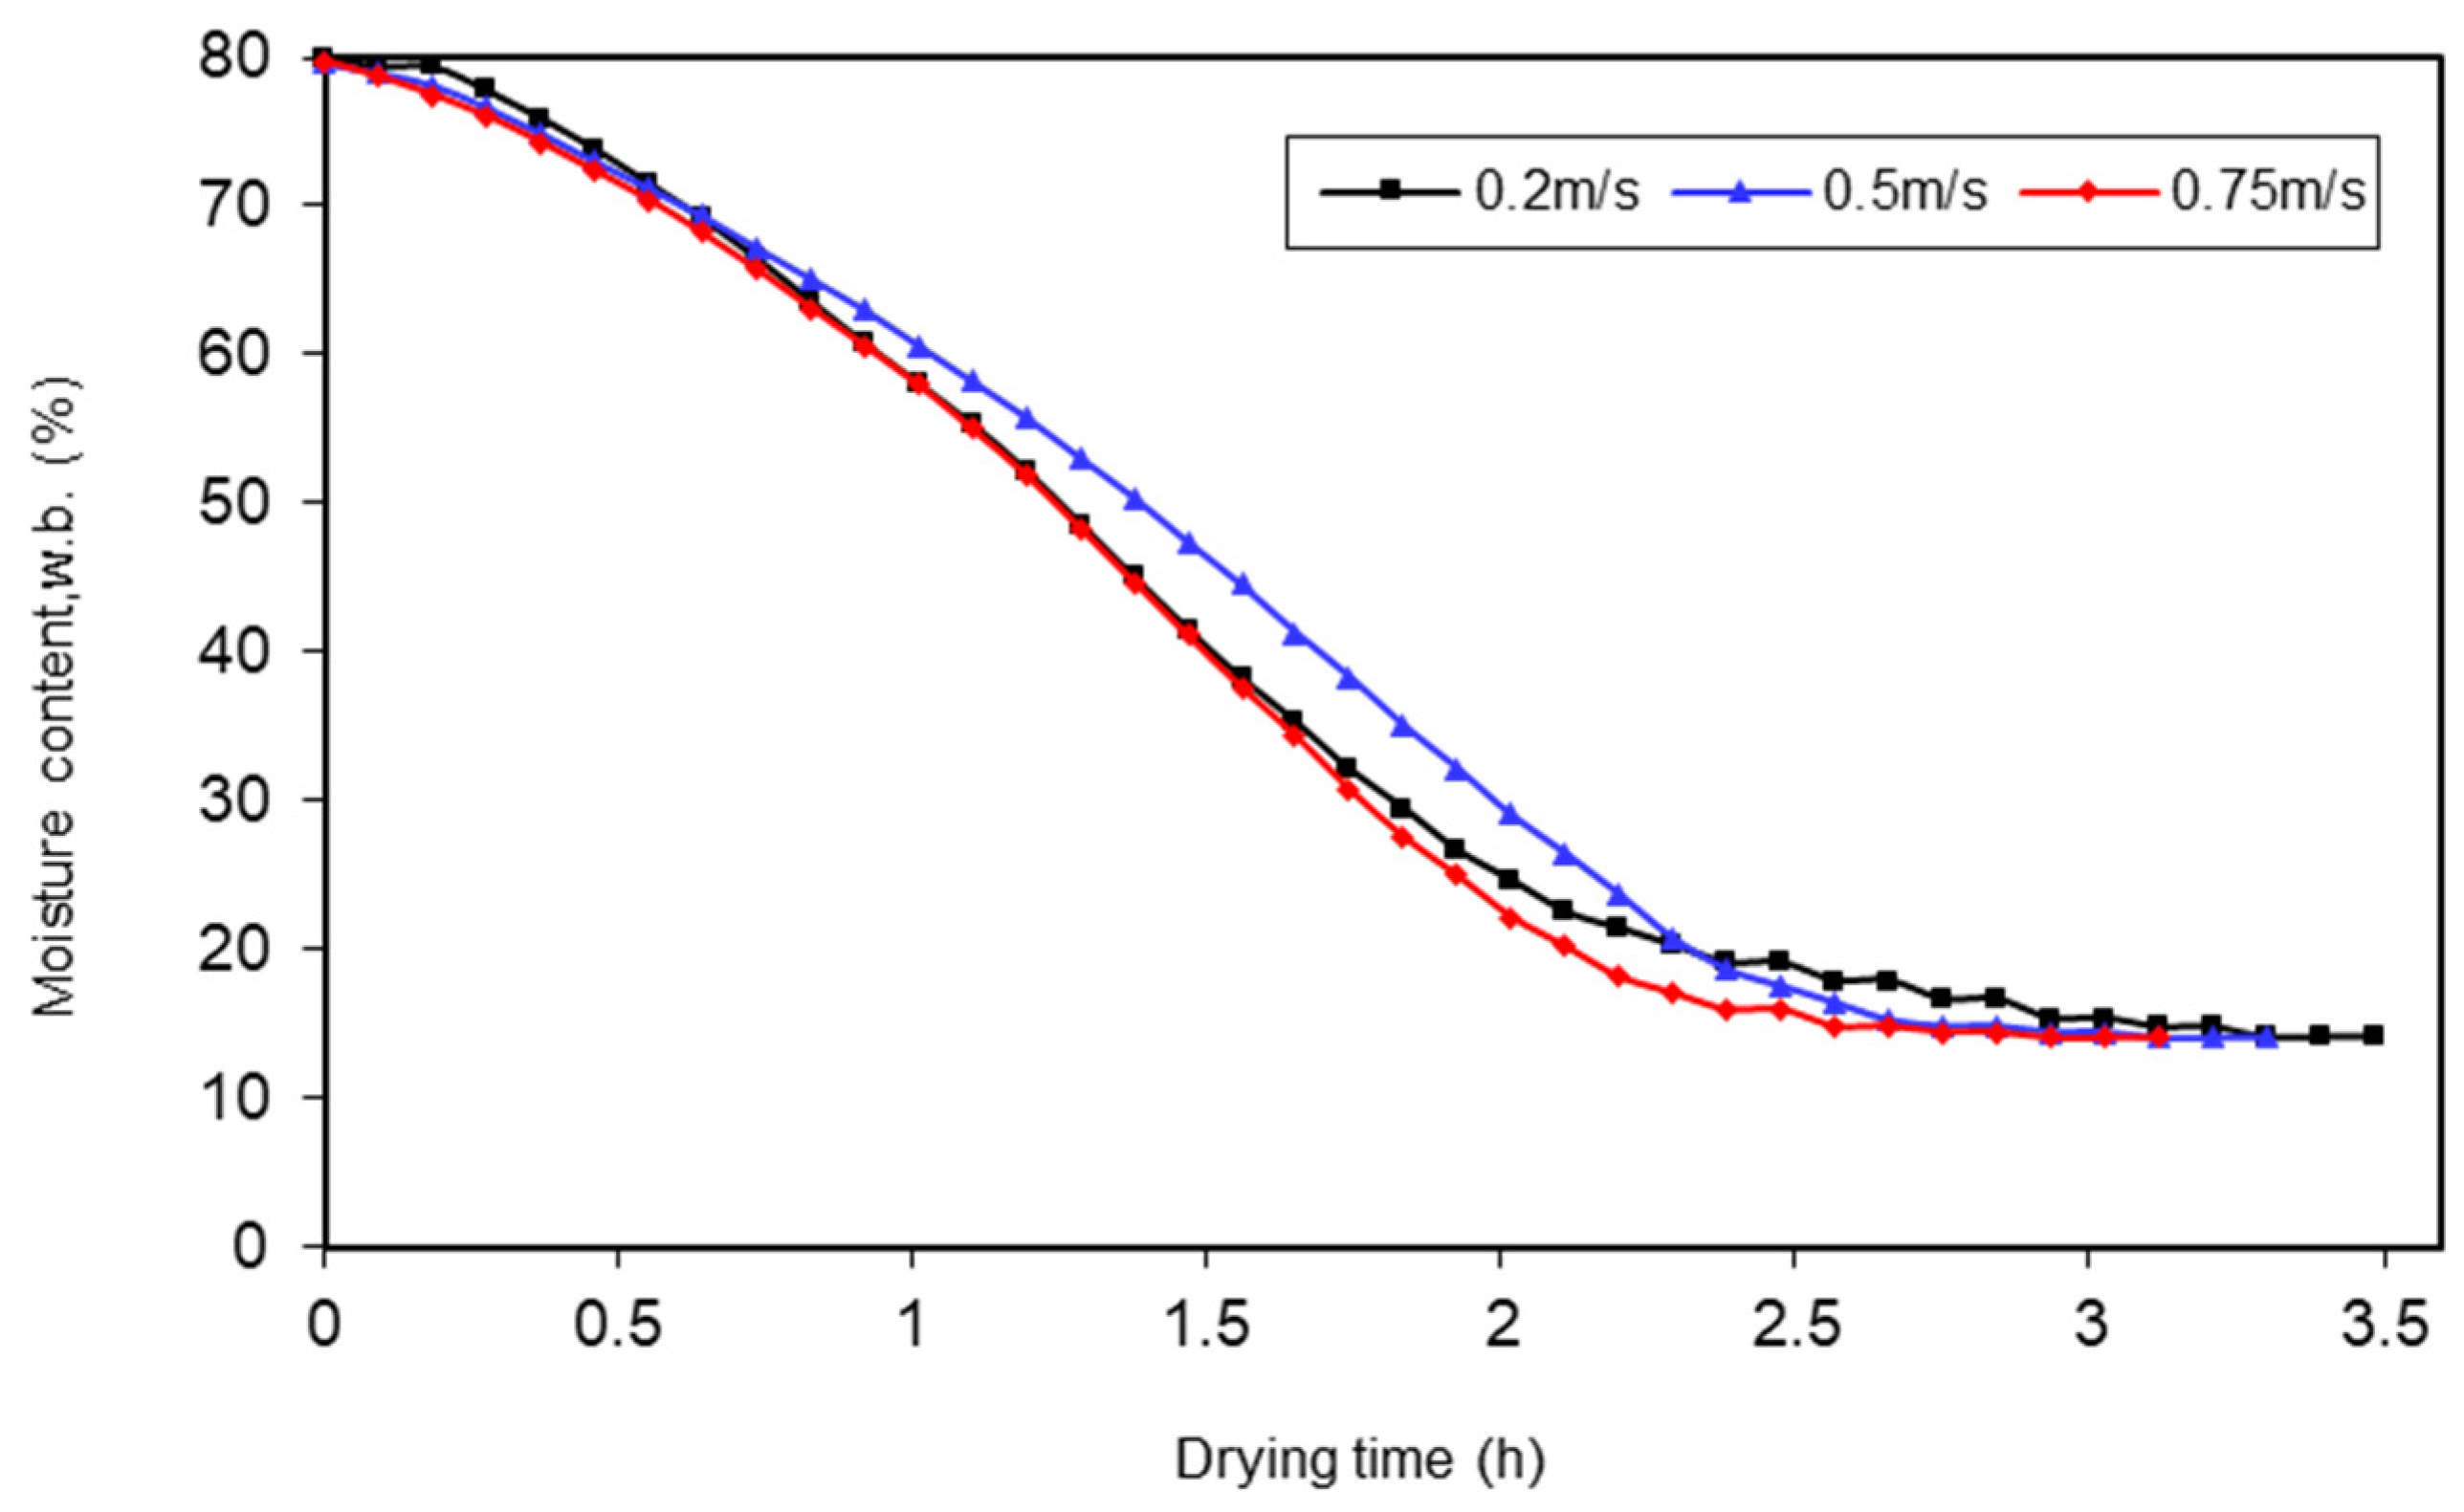
Figure 8 depicts the effect of air velocity on the drying of banana slices in a thin layer. Its moisture loss was faster and increased with air velocity, but the effect was not as strong as the effect of air temperature.
Figure 8 showed the effect of the drying air velocity on the drying banana slices 2 mm under the same conditions (initial moisture content, w.b. 80%, air temperature 70 °C, and air relative humidity at 5–7%).
The moisture loss of banana slices increased as air velocity increased from 0.2 m/s, 0.5 m/s, and 0.75 m/s; the drying rate was nearly constant. The drying times for banana slice samples at a constant air temperature of 70 °C and air velocity of 0.2 m/s, 0.5 m/s, and 0.75 m/s were approximately 3.5 h, 3.4 h, and 3.3 h, respectively.
As shown in
Figure 5 and
Figure 8, the difference in drying time requirements was thought to be primarily due to differences in drying rates. According to these results, the main stage of drying rates for thin-layer banana slices is the falling rate period, depending on the drying conditions.
3.3. Effect of Banana Slices’ Thickness on the Drying Time
The results in
Figure 9 demonstrate the effect of banana slices on drying time at the drying air temperature range of 70 °C and the relative humidity of the drying air range from 5 to 7% using a constant value of the air velocity, 0.75 m/s, for different thicknesses of 2 mm, 4 mm, 6 mm, and 8 mm respectively. The shortest drying time was 3.2 h for 2 mm thickness, and the highest drying time was 6.7 h for 8 mm thickness. The results showed that the drying time decreased with the smaller thickness of banana slices.
3.4. Effect of Moisture Content on the Drying Time
Figure 10 shows that the increasing initial moisture content wet basis of banana slices at constant air temperatures increased the drying time. However, the drying time of banana slices of initial moisture content w.b. 77.6% and 79.7% at 50 °C was 5.3 h and 5.6 h, respectively, whereas the drying time of banana slices of initial moisture content w.b. 76.16% and 78.23% at 60 °C was 4.3 h and 5.0 h, respectively.
Due to the initial moisture content of banana slices, the increase in air temperature to accelerate the drying process was limited in some cases.
As a result, to determine the drop of banana slices moisture content in this dryer, the drying conditions must be applied in the dryer and the drying time. The banana slices in the dryer are expected to reach the desired moisture content “Mwf” in a shorter time when the loss of moisture is stable for a period to consider as equal with the equilibrium moisture content “Meq”.
3.5. Derivied Equation for Factors Affecting the Drying Time of Banana Slices
An empirical mathematical equation was derived by applying the multiple linear regression analysis technique using SPSS 26 to the whole data used for the many experiments of the experimental work. The mathematical equation was derived with “R
2” values range is 0.998. This equation gave the values of the total time for the drying rate period (t):
where:
t: the total time for the drying rate period, (h).
C: the overall constant for the equation, its value (5.41).
C1: constant of drying air temperature (°C), its value (−0.137).
C2: constant of the drying air velocity (m/s), its value (−0.04).
C3: constant for the initial moisture content, w.b. for banana (%), its value (0.09).
C4: the constant for the thickness of the banana slices (mm), its value (0.095).
Equation (23) shows that the increasing of air temperature (°C) decreased the drying time in great effect. Moreover, the air velocity in m/s has a lower effect in the drying time. However, the thickness of the banana slice in mm has the highest positive effect (0.095) on the drying time, followed by the moisture content, w.b. (0.09).
3.6. Color Parameter Evaluation
To assess the extent of color change, the individual color parameters of fresh banana slices were used as a reference.
Table 4 shows these values as well as the statistical results of the color measurements of banana slices dried under various conditions. According to the statistical analysis, the color of fresh fruits differed significantly from that of dried banana slices.
The color of the banana slices’ external surface parameters (L* [brightness/darkness], a* [redness/greenness], and b* [yellowness/blueness]) were measured and are listed in
Table 2. All color parameter values increased as drying time was extended, then decreased.
During drying conditions, the interaction between water treatments and drying time was insignificant. To assess the extent of color change, the individual color parameters of fresh banana slices were used as a reference.
Table 4 shows these values as well as the statistical results of the color measurements of banana slices dried under various conditions. According to the statistical analysis, the color of fresh fruits differed significantly from that of dried banana slices.
Table 4 shows how the measured color parameter values L*, a*, b*, and C* vary with moisture content for four different air temperatures (40 °C, 50 °C, 60 °C, and 70 °C). According to these findings, the brightness (L*) value of food decreases dramatically as air temperature rises and moisture content falls.
Table 3 shows that for each air temperature, the value a* of the food increased while the value b* decreased. During the drying process, the redness (a*) of the food increased while the yellowness (b*) decreased. In the literature, equivalent results for increasing air temperature in banana drying were obtained [
48]. When the value of a* (redness) parameter exceeds, the food begins to lose yellow and greenness. The redness of the food increases if drying is continued. The separation of chlorophyll and carotenoid pigments is responsible for this phenomenon [
42]. In the literature, it was observed that the L* value decreased, and a* and b* increased with temperature, and discovered that the L*, a*, b*, and C* values decreased during the drying of date palm and tomato [
49]. According to these findings, the color change value rises as the drying air temperature rises. The L* parameter increases with temperature due to the browning effect. The increase in total color changes can be attributed primarily to changes in the brightness and redness parameters [
50]. As a result, the air temperature is particularly effective on the L*, a*, b*, and C* color parameters in the tunnel-type convective dryer.
Color is regarded as a distinct parameter that appears to be one of the most important determinants of product quality and consumer preference. The following were the average values for the color parameters of fresh banana slices: L* ranged from 60.63 to 65.73, a* from 6.64 to 7.36, and b* from 26.41 to 27.85. It was clear that the dried banana slices had lower L* values than the fresh samples. The L* values, which indicate the product’s lightness, ranged from 39.15 to 36.05 at 40–70 °C, and the dried product had the lowest L* value. Baini and Langrish [
51] reported that there was no effect on the browning rate in bananas by the drying temperatures ranging from 50 °C to 80 °C. However, it was significant at the drying temperature of 100 °C.
Table 4 clearly shows that the values increased as the drying temperature increased. As a result, as the drying time progressed, the samples’ redness values increased. On the other hand, the production of brown pigments during the drying process by non-enzymatic processes (Maillard reaction) may play an important role in the production of the red color [
3]. As the drying temperature increased, the b* values decreased from 19.11 to 16.92 from 40 °C to 70 °C, respectively. The chroma is a measure of chromaticity (C*), which refers to the color’s purity or saturation. During the process, the chroma (C*) values decreased. The chroma (C*) values ranged from 24.04 to 22.19 depending on the drying temperature from 40 to 70 °C. These results agreed with [
51] for a dried banana slice at the drying temperature of 50 °C, 60 °C, 80 °C, and 100 °C, where the L* values were 48, 50, 44, and 33; a* values were 5, 4, 6, and 8; and b* values were 16, 17, 17, and 13, respectively. The total color ΔE can be estimated from Equation (2). It was observed that the changes for the banana color due to drying at 40 °C, 50 °C, 60 °C and 70 °C were calculated to be 23.10 ± 1.23, 26.01 ± 1.90, 28.45 ± 2.13 and 31.30 ± 2.37, respectively. This result suggests that the best sample in color terms is at 70 °C because it is the biggest value of ΔE.
3.7. Hardness
The effects of air temperature treatments on hardness varied significantly depending on the characteristic.
Table 5 shows that the hardness for the dried banana slices under drying air temperatures 40 °C, 50 °C, 60 °C, and 70 °C were 20.33 N, 21.35 N, 23.56 N, and 26.05 N, respectively. This result was closed to [
40] which was for banana slices 21.833 N, 25.157 N, and 28.187 N at drying air temperatures 40 °C, 60 °C, and 80 °C, respectively. Drying banana slices at different air temperature treatments differed significantly with the hardness. It was found that increasing the air temperature led to an increase in the hardness of the dried banana slices.
3.8. Water Activity (aw)
Dried banana slices had a water activity (a
w) ranging between 0.703 and 0.768 in
Table 5. The temperature of 40 °C produced a higher a
w than the other temperatures, and these results agreed with [
40], which ranged between 0.706 and 0.762. They discovered that lower temperatures resulted in samples with higher a
w. The a
w of the in natura banana cv Prata for fresh banana was found to be 0.981 [
52]. The reduction of a
w minimizes deterioration reactions and microorganism growth, contributing to the conservation and extension of fruit shelf life.
3.9. Measurement of Total Soluble Solids (TSS) and Tratiable Acidity (TA)
The TSS and TA were 22.72° Brix and 0.3 g/100 g, respectively, which were quite comparable with the results of [
53], who reported 25.30° Brix and 0.29 g/100 g, respectively for their tested banana samples. The reducing sugars in the fresh banana was 6.92%, while the total sugars content was 15.26%. Those values were in close agreement with 7.39% of reducing sugars and 15.65% of total sugars given by [
54] for banana.
The obtained data set for TSS and TA of the dried banana for different air temperatures 40 °C, 50 °C, 60 °C, and 70 °C presented in
Table 5. There was a significant influence (
p < 0.05) of all treatments on TSS and TA of the dried banana.
However, the TSS was found to be 61.02, 61.89, 62.97, and 64.34 for dried banana slices at air temperature from 40 °C, 50 °C, 60 °C, and 70 °C, respectively. According to [
55], a lower moisture content was usually related to a greater TSS in products, because the main component of dry matter was TSS content.
Moreover, the TA was found to be 1.013, 1.274, 1.395, and 1.542 for dried banana slices at air temperature from 40 °C, 50 °C, 60 °C, and 70 °C, respectively. It was observed that the TA increased by increasing the value of the drying air temperature. It could be related to the lower moisture content also.
3.10. Banana Drying Characteristics
The moisture contents of the eight drying models were fitted of dried banana slices 2 mm thickness at air temperatures 40 °C, 50 °C, 60 °C, and 70 °C.
Table 6 summarizes the statistical outcomes obtained from these models for
p < 0.05.
Table 6 shows that the Midilli–Kucuk is the best model due to it displaying the highest average value of R
2, and the lowest RMSE and χ
2. This result is agreed with in [
45]. The values of R
2, RMSE, and χ
2 in the Midilli models for 40 °C air temperature were calculated to be 0.9976 and 0.0142. However, it was 0.00002 and 0.9984, 0.0146, and 0.00008 for R
2, RMSE, and χ
2 at 50 °C, respectively. In the Midilli model, the R
2, RMSE, and χ
2 values for 60 °C air temperature was calculated to be 0.9987, 0.01618, and 0.00002, respectively. In the Midilli model, the R
2, RMSE, and χ
2 values for 70 °C were calculated to be 0.9996, 0.01524, and 0.00003, respectively.
3.11. Moisture Diffusivity and Activation Energy
The effective moisture diffusivity values at 40 °C, 50 °C, 60 °C, and 70 °C were calculated using Equation (20). The effective moisture diffusivity was calculated while banana slices were drying and the shape of it was assumed to be slab shape.
Table 6 shows the calculated rate constant of moisture loss (K) and effective moisture diffusivity of banana slices related to the drying air temperature.
Table 7 depicts the calculated rate constant of moisture loss K of dried banana slices were ranged between 0.058 h
−1 at 40 °C, 0.097 at 50 °C, 0.224 at 60 °C, and 0.281 h
−1 at 70 °C for these different values of drying air temperature. As the air temperature increased, the K values increased as well as the effective moisture diffusivity
Deff. It is noticed that the highest value of K was obtained when drying at 70 °C, and the lowest value was obtained when drying at 40 °C.
It shows in
Table 7 that at the drying air temperature 70 °C, the
Deff values ranged from 7.88 × 10
−10 to 6.03 × 10
−10 m
2/s as drying air velocity ranged from 0.2 to 0.75 m/s. It increased at 60 °C drying air temperature from 5.92 × 10
−10 to 4.59 × 10
−10 m
2/s, at 50 °C drying air temperature from 2.31 × 10
−10 to 1.52 × 10
−10 m
2/s and at 40 °C drying air temperature ranged from 1.35 × 10
−10 m
2/s to 1.04 × 10
−10 m
2/s, respectively. Data are expressed as the average ± standard deviation for three replicates.
The values of
Deff ranged from 10
−12 to 10
−8 for the biological materials [
56] and were comparable to the values reported for dehydrated banana slices: 1.29 × 10
−10 to 3.91 × 10
−9 m
2/s [
57], 1.0 × 10
−10 to 2.1 × 10
−10 m
2/s [
22], 9.13 × 10
−10 to 2.03 × 10
−9 m
2/s [
58], and 7.37 × 10
−11 m
2/s to 2.14 × 10
−10 m
2/s [
59]. Differences in results could be attributed to initial moisture content, shape, and material composition, as well as drying temperature, pre-treatments, and drying equipment. Because the first phenomenon is more significant, an increase in air temperature causes moisture diffusion to increase, increasing the drying rate. The activation energy can be calculated using Equation (21) from the slope of the Arrhenius plot, ln (
Deff) versus 1/(T
C + 273.15).
Figure 11 depicts the ln
Deff as a function of the reciprocal of absolute temperature. The line has a slope of (−Ea/R) and an intercept of ln (
D0).
The effective moisture diffusivity was calculated taking into account banana shrinkage during drying and the shape of the fruit banana being assumed to be slab shape. As the drying air temperature increased from 40 °C to 70 °C, the effective moisture diffusivity of banana increased linearly from 7.88 × 10
−10 to 1.04 × 10
−10 m
2/s,
Figure 11. These results were agreed with [
60].
When drying banana slices, increasing the air temperature increased both diffusion and shrinkage, but shrinkage reduces diffusion [
21]. Because the first phenomenon is more significant, an increase in air temperature causes moisture diffusion to increase, increasing the drying rate. The activated energy of the banana was determined using Equation (21) on average to be 34.29 kJ/mol. The activation energy values measured in this study were in good agreement with those reported of most foods 12.7–110 kJ/mol [
56]. The effect of banana type, slice thickness, composition, and tissue characteristics can explain the differences in the results.
Figure 11 shows a linear relationship energy between ln (
Deff) versus 1/(T
C + 273.15) to determine the activation due to Arrhenius-type dependence, with R
2 = 0.954. The activated energy of banana slices was determined to be between 32.16 kJ/mol and 36.42 kJ/mol. Doymaz [
59] reported that the banana sample’s effective diffusivity ranged from 7.37 × 10
−11 to 2.14 × 10
−10 m
2/s, with an activation energy of 32.65 kJ/mol when investigating the drying characteristics of bananas in a hot air dryer at rated air temperatures at 50 °C, 60 °C, 70 °C, and 80 °C, air velocity of 2.4 m/s and relative humidity of 4–25%.
3.12. Optimisation of the Best Condition for Drying Banana Slices
Since it is desired that bananas be lighter, yellower, and more chromatic, the parameters L*, b*, and C* have been maximized [
61]. Moreover, higher total soluble solids (TSS) and lower tratiable acidity (TA) are recommended by customers.
The lower hardness of dried bananas is associated with higher sensory acceptance by consumers, and hardness was reduced [
62].
Therefore, as a result, when drying time and color were considered, the overall drying conditions for banana slices at an air temperature of 70 °C and an air velocity of 0.75 m/s with 2 mm thickness of banana slices were the best treatment.
4. Conclusions
The values of color parameters (L*, a*, b*, and C*) increased as the drying temperature increased, and as the drying time progressed, the samples’ redness values increased. The best sample in color terms was at 70 °C because it is the biggest value of ΔE.
However, it was found that higher air temperature and lower moisture content was usually related to a greater TSS and TA in dried products. Reducing the water activity by increasing air temperature reduces deterioration reactions and microorganism growth, which contributes to the preservation and extension of fruit shelf life.
The shrinkage of banana slices increased as the temperature of the drying air rose. As air velocity increased, there was no change in shrinkage observed. The diffusivity of moisture for banana slices ranged between 7.88 × 10⁻¹⁰ to 1.04 × 10⁻¹⁰ m2/s. The effective moisture diffusivity of the banana increased linearly as the drying air temperature increased. The activated energy of the banana was calculated to be on average to be 34.29 kJ/mol.
The Midilli–Kucuk model was chosen as the best of the eight thin-layer drying models studied based on its R2, RMSE and χ2 values. The drying time and model constant for various model regressions for MR calculations were determined and reported.
As a result of this research, the single layer banana slices can be dried in a good quality at an air temperature of 70 °C and an air velocity of 0.75 m/s at 2 mm thickness of banana slices. These results showed that these high temperatures could be used up to 70 °C with moderate air velocity 0.75 m/s and a thin thickness of 2 mm is the best condition to produce dried bananas for commercial scale according to the shorter drying time, and the final good quality in terms of color, hardness, water activity, TSS and TA.
The results of this study are applicable to future validation studies with other products because they describe an analytical technique for banana slices. Moreover, this result and technique could be applied by both researchers and producers to improve the conditions of drying other products.


