
Production of Kojic Acid by Aspergillus niger M4 with Different Concentrations of Yeast Extract as a Nitrogen Source

 , , ,
, , ,  ,
, 
Abstract
:1. Introduction
2. Materials and Methods
2.1. Microorganism
2.2. Fermentation Conditions
2.3. Analytical Determinations
2.4. Calculations of Parameters Associated with the Fermentative Process
2.5. Statistical Analysis
3. Results
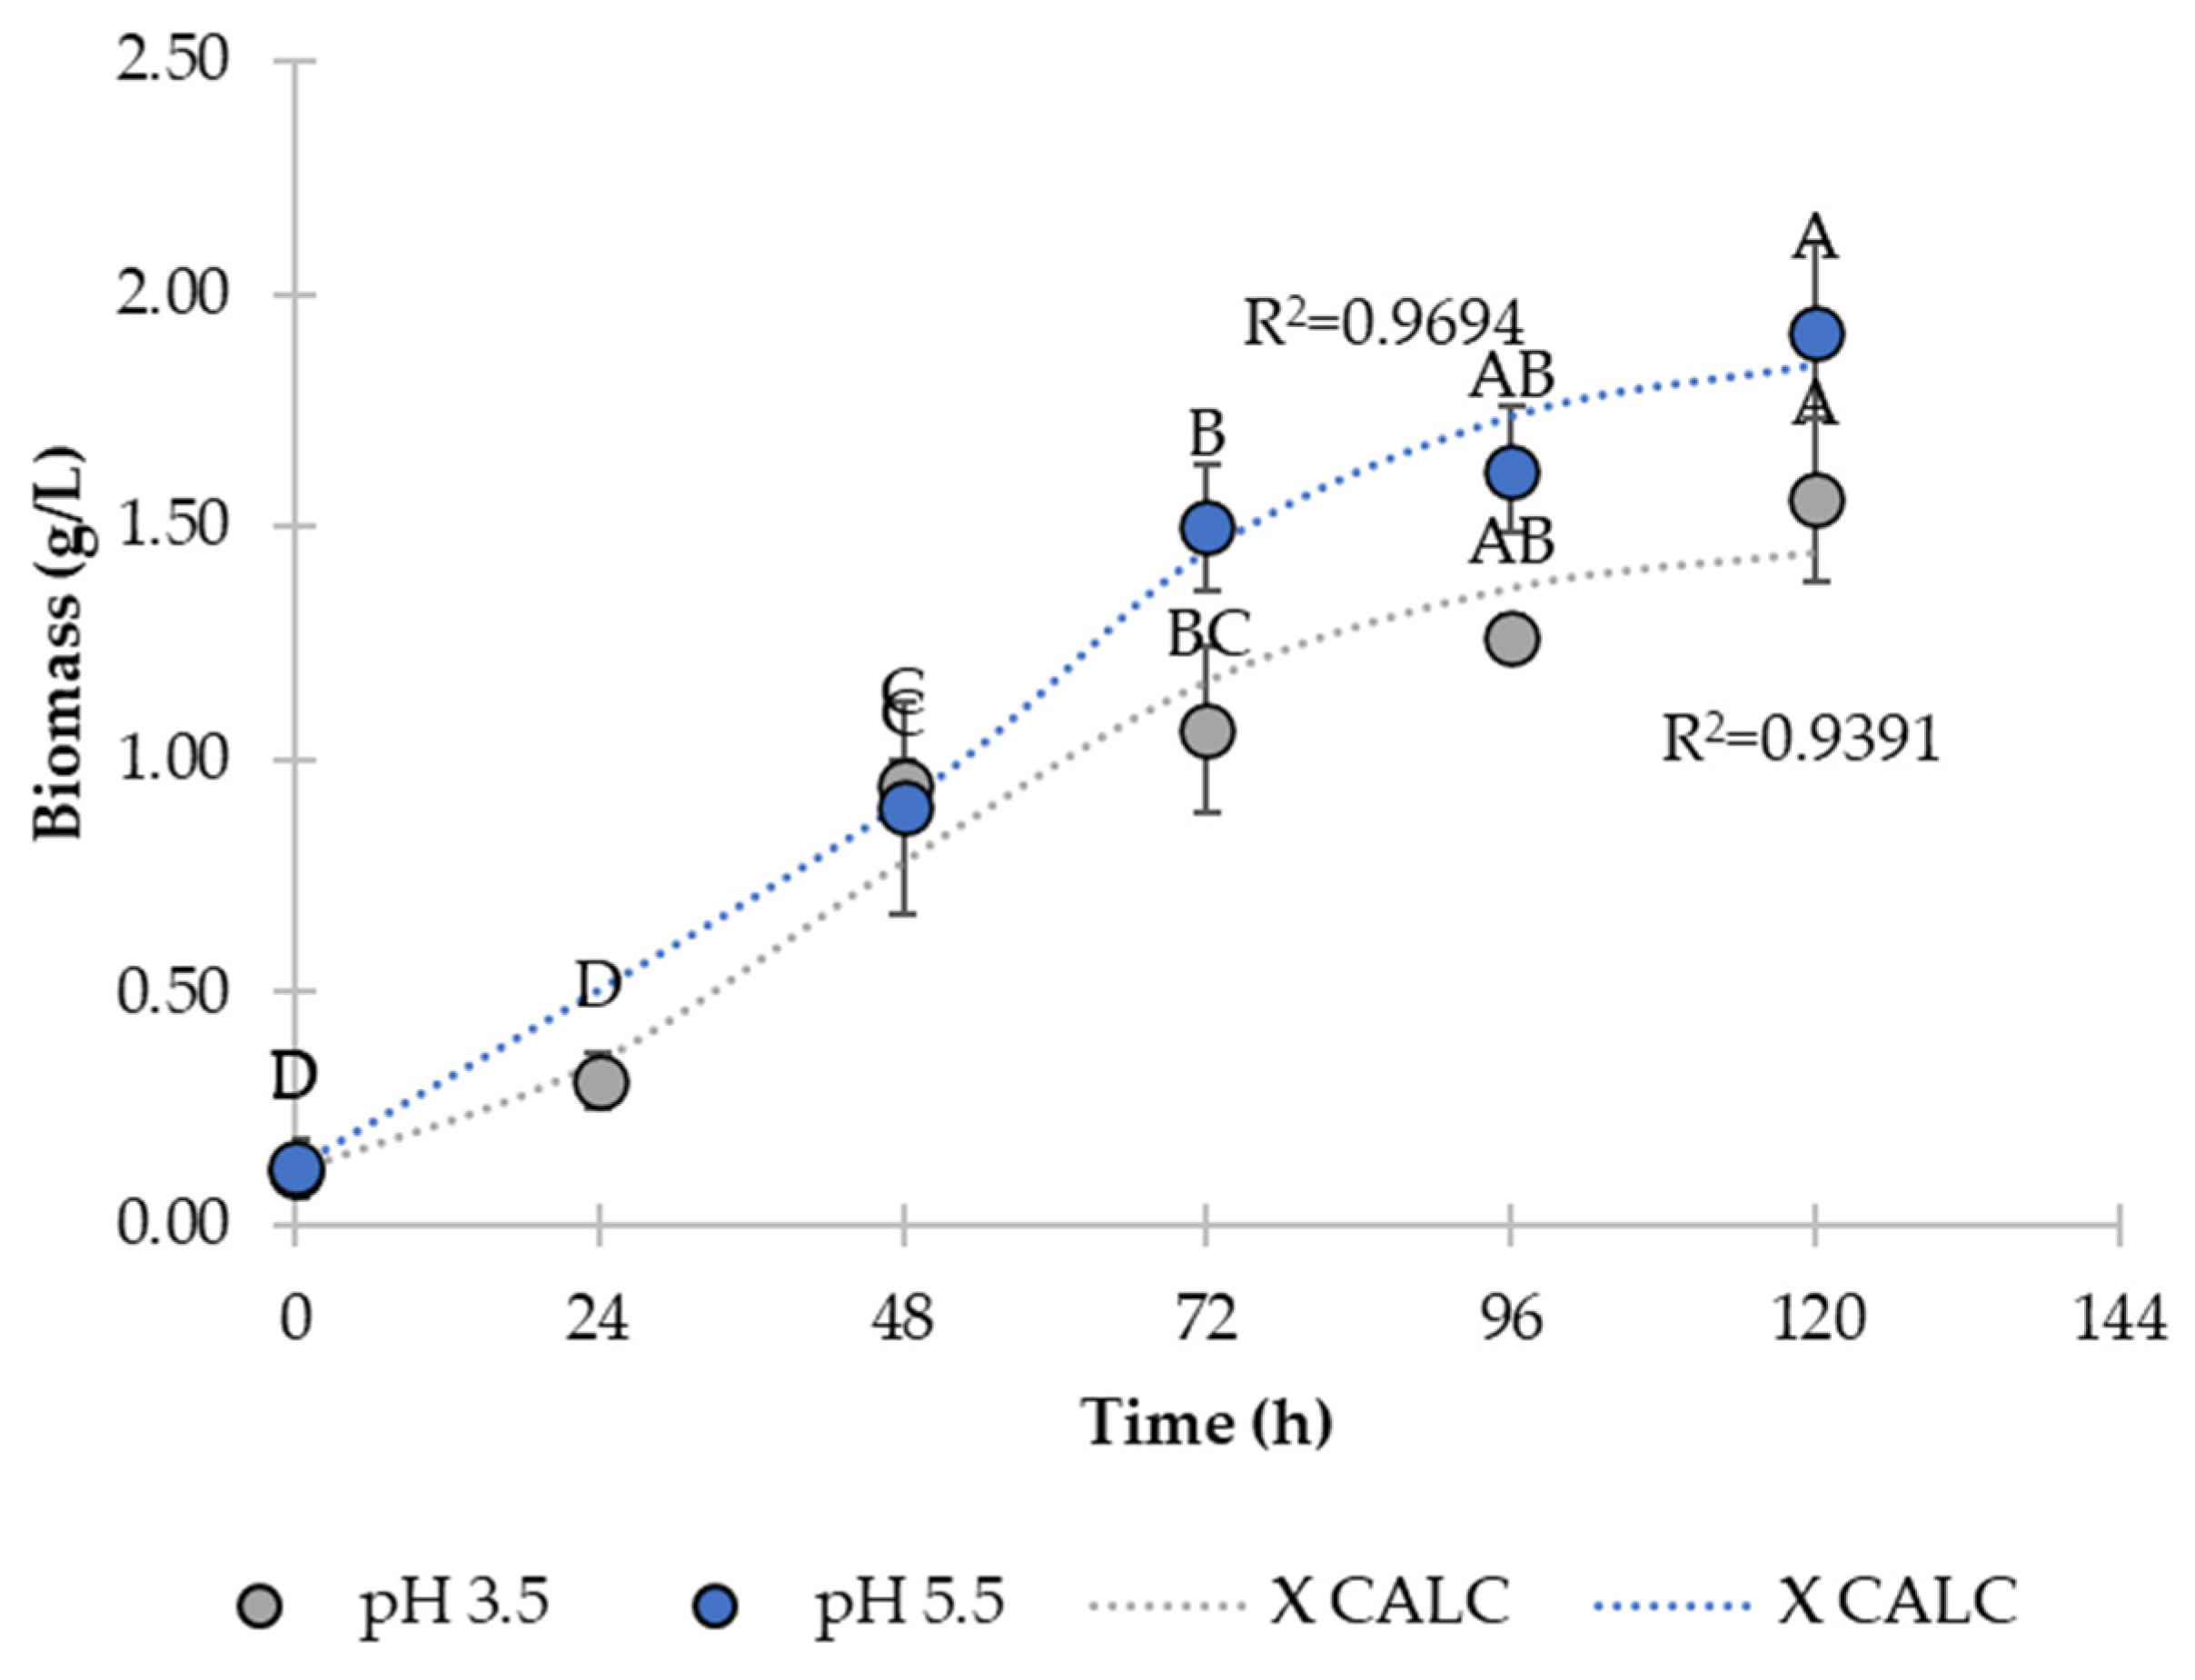
3.1. Effect of pH on Kinetic Parameters
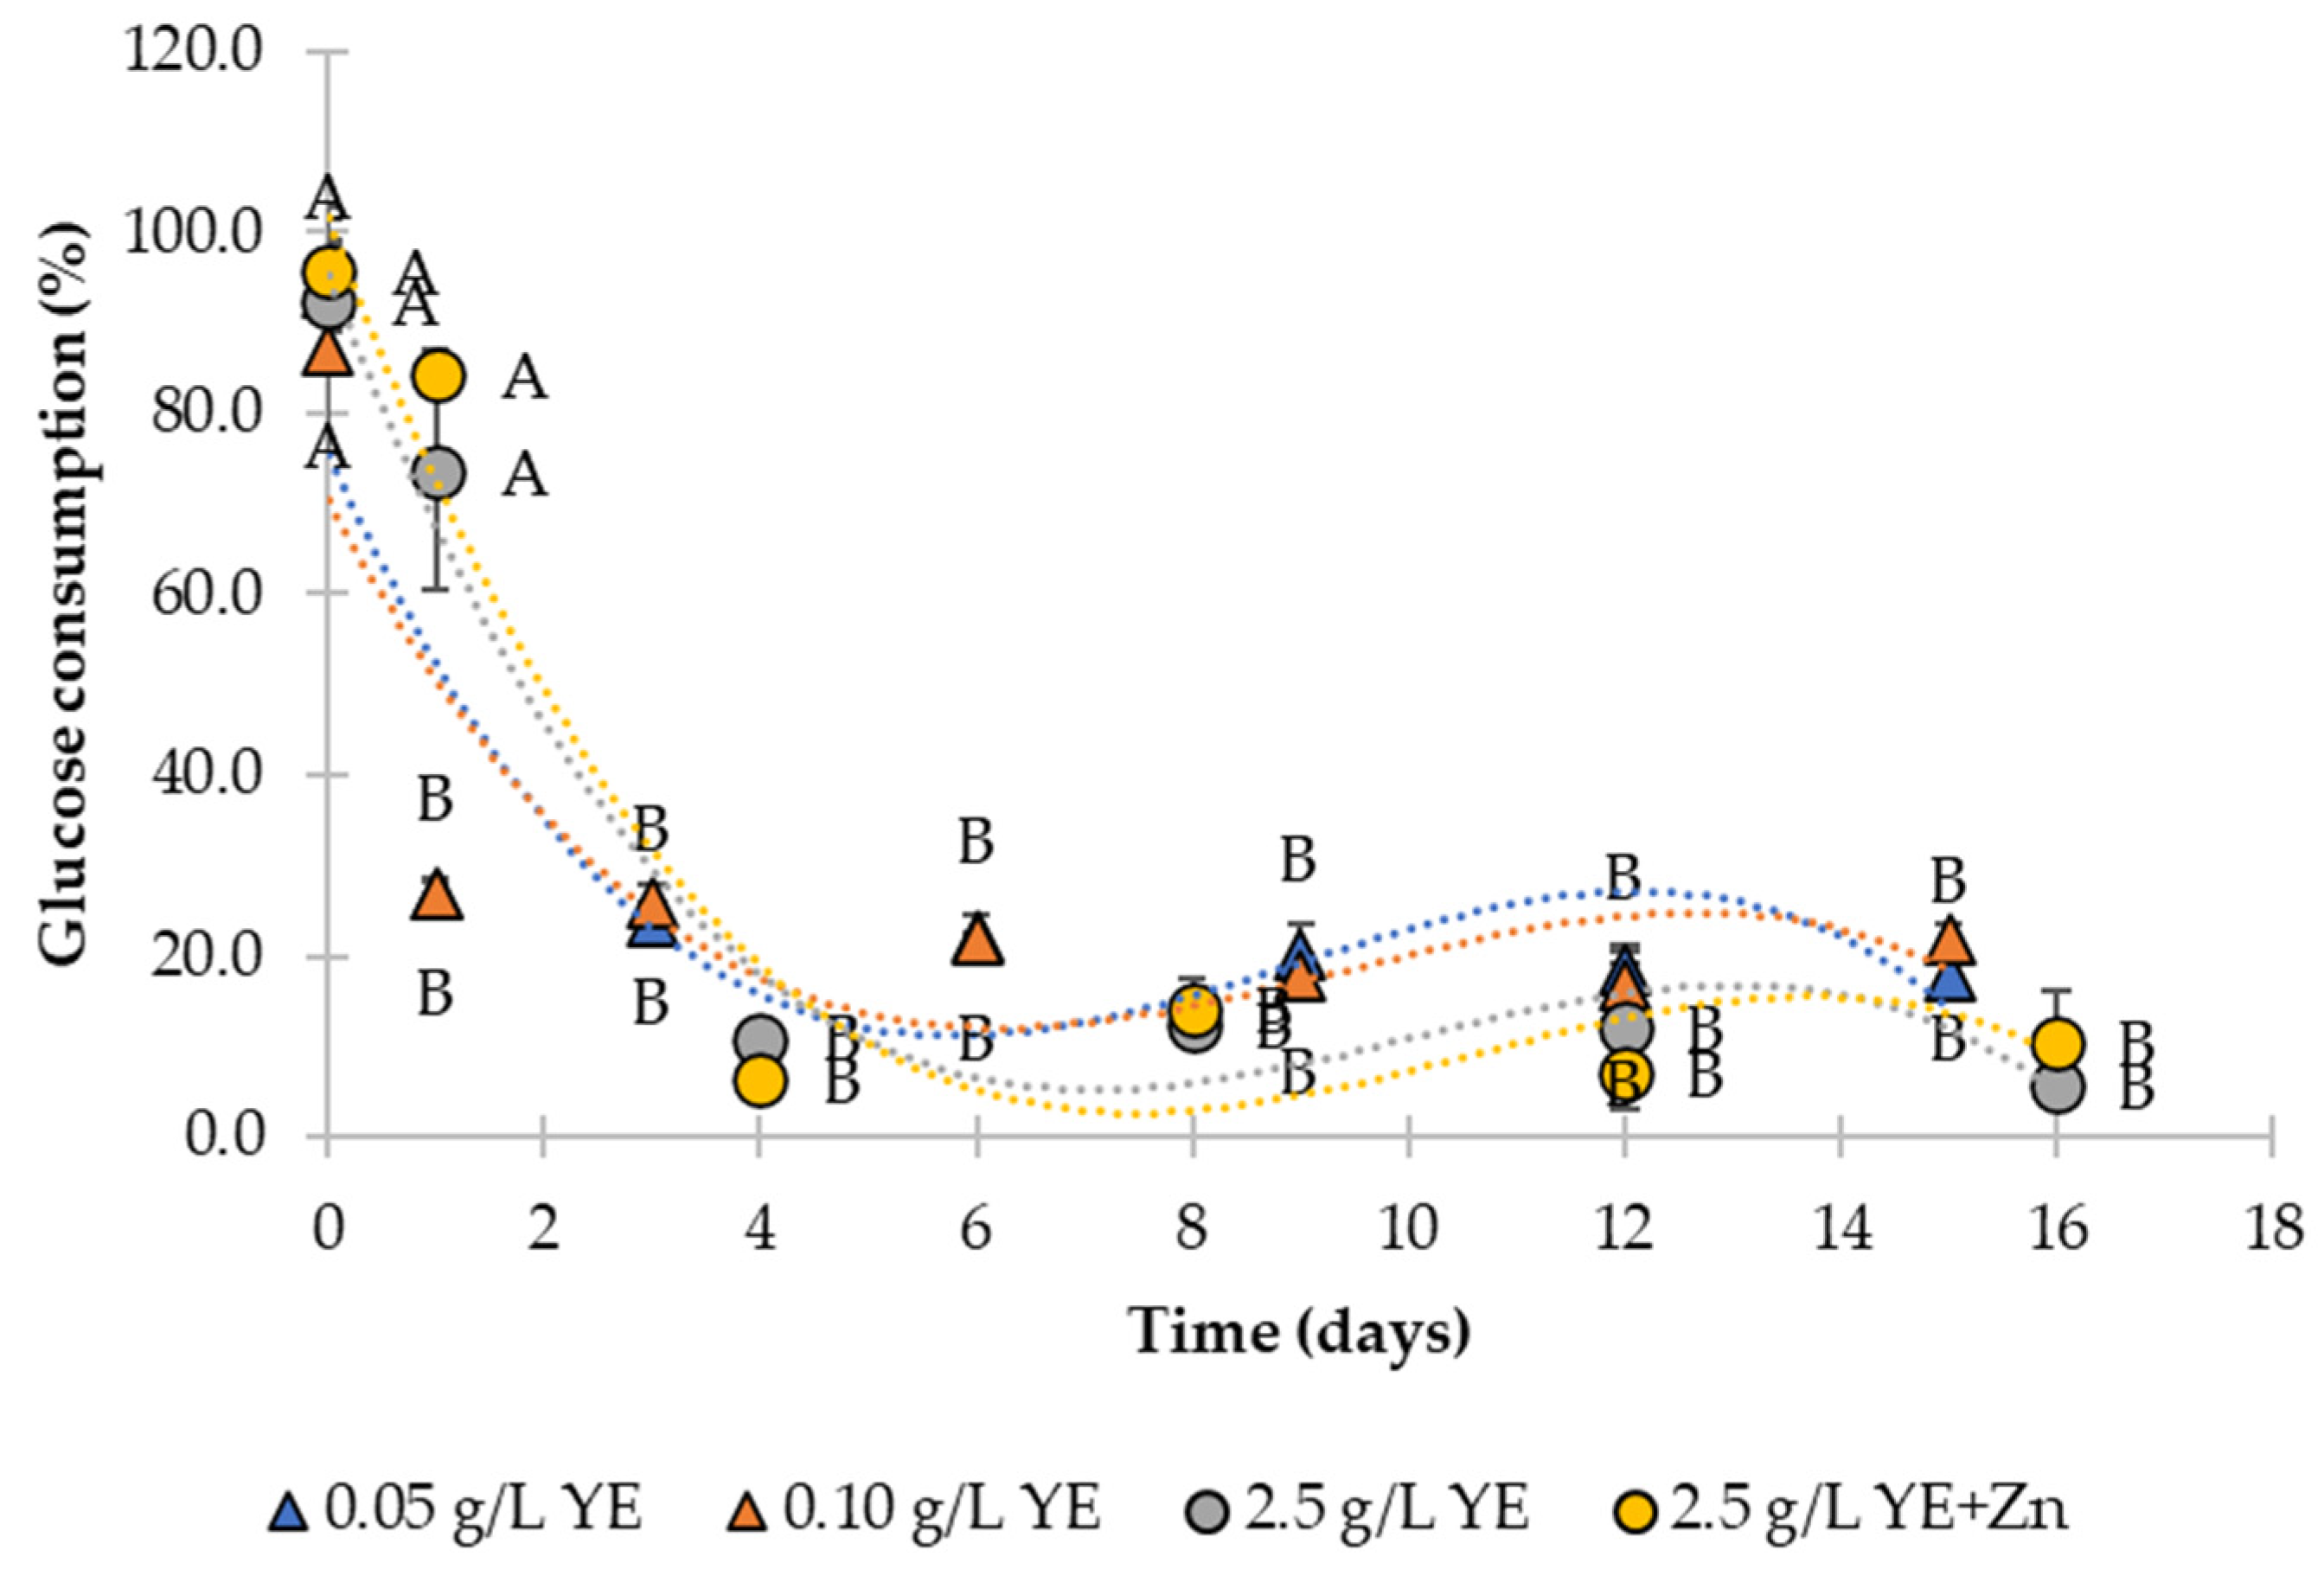
3.2. Substrate
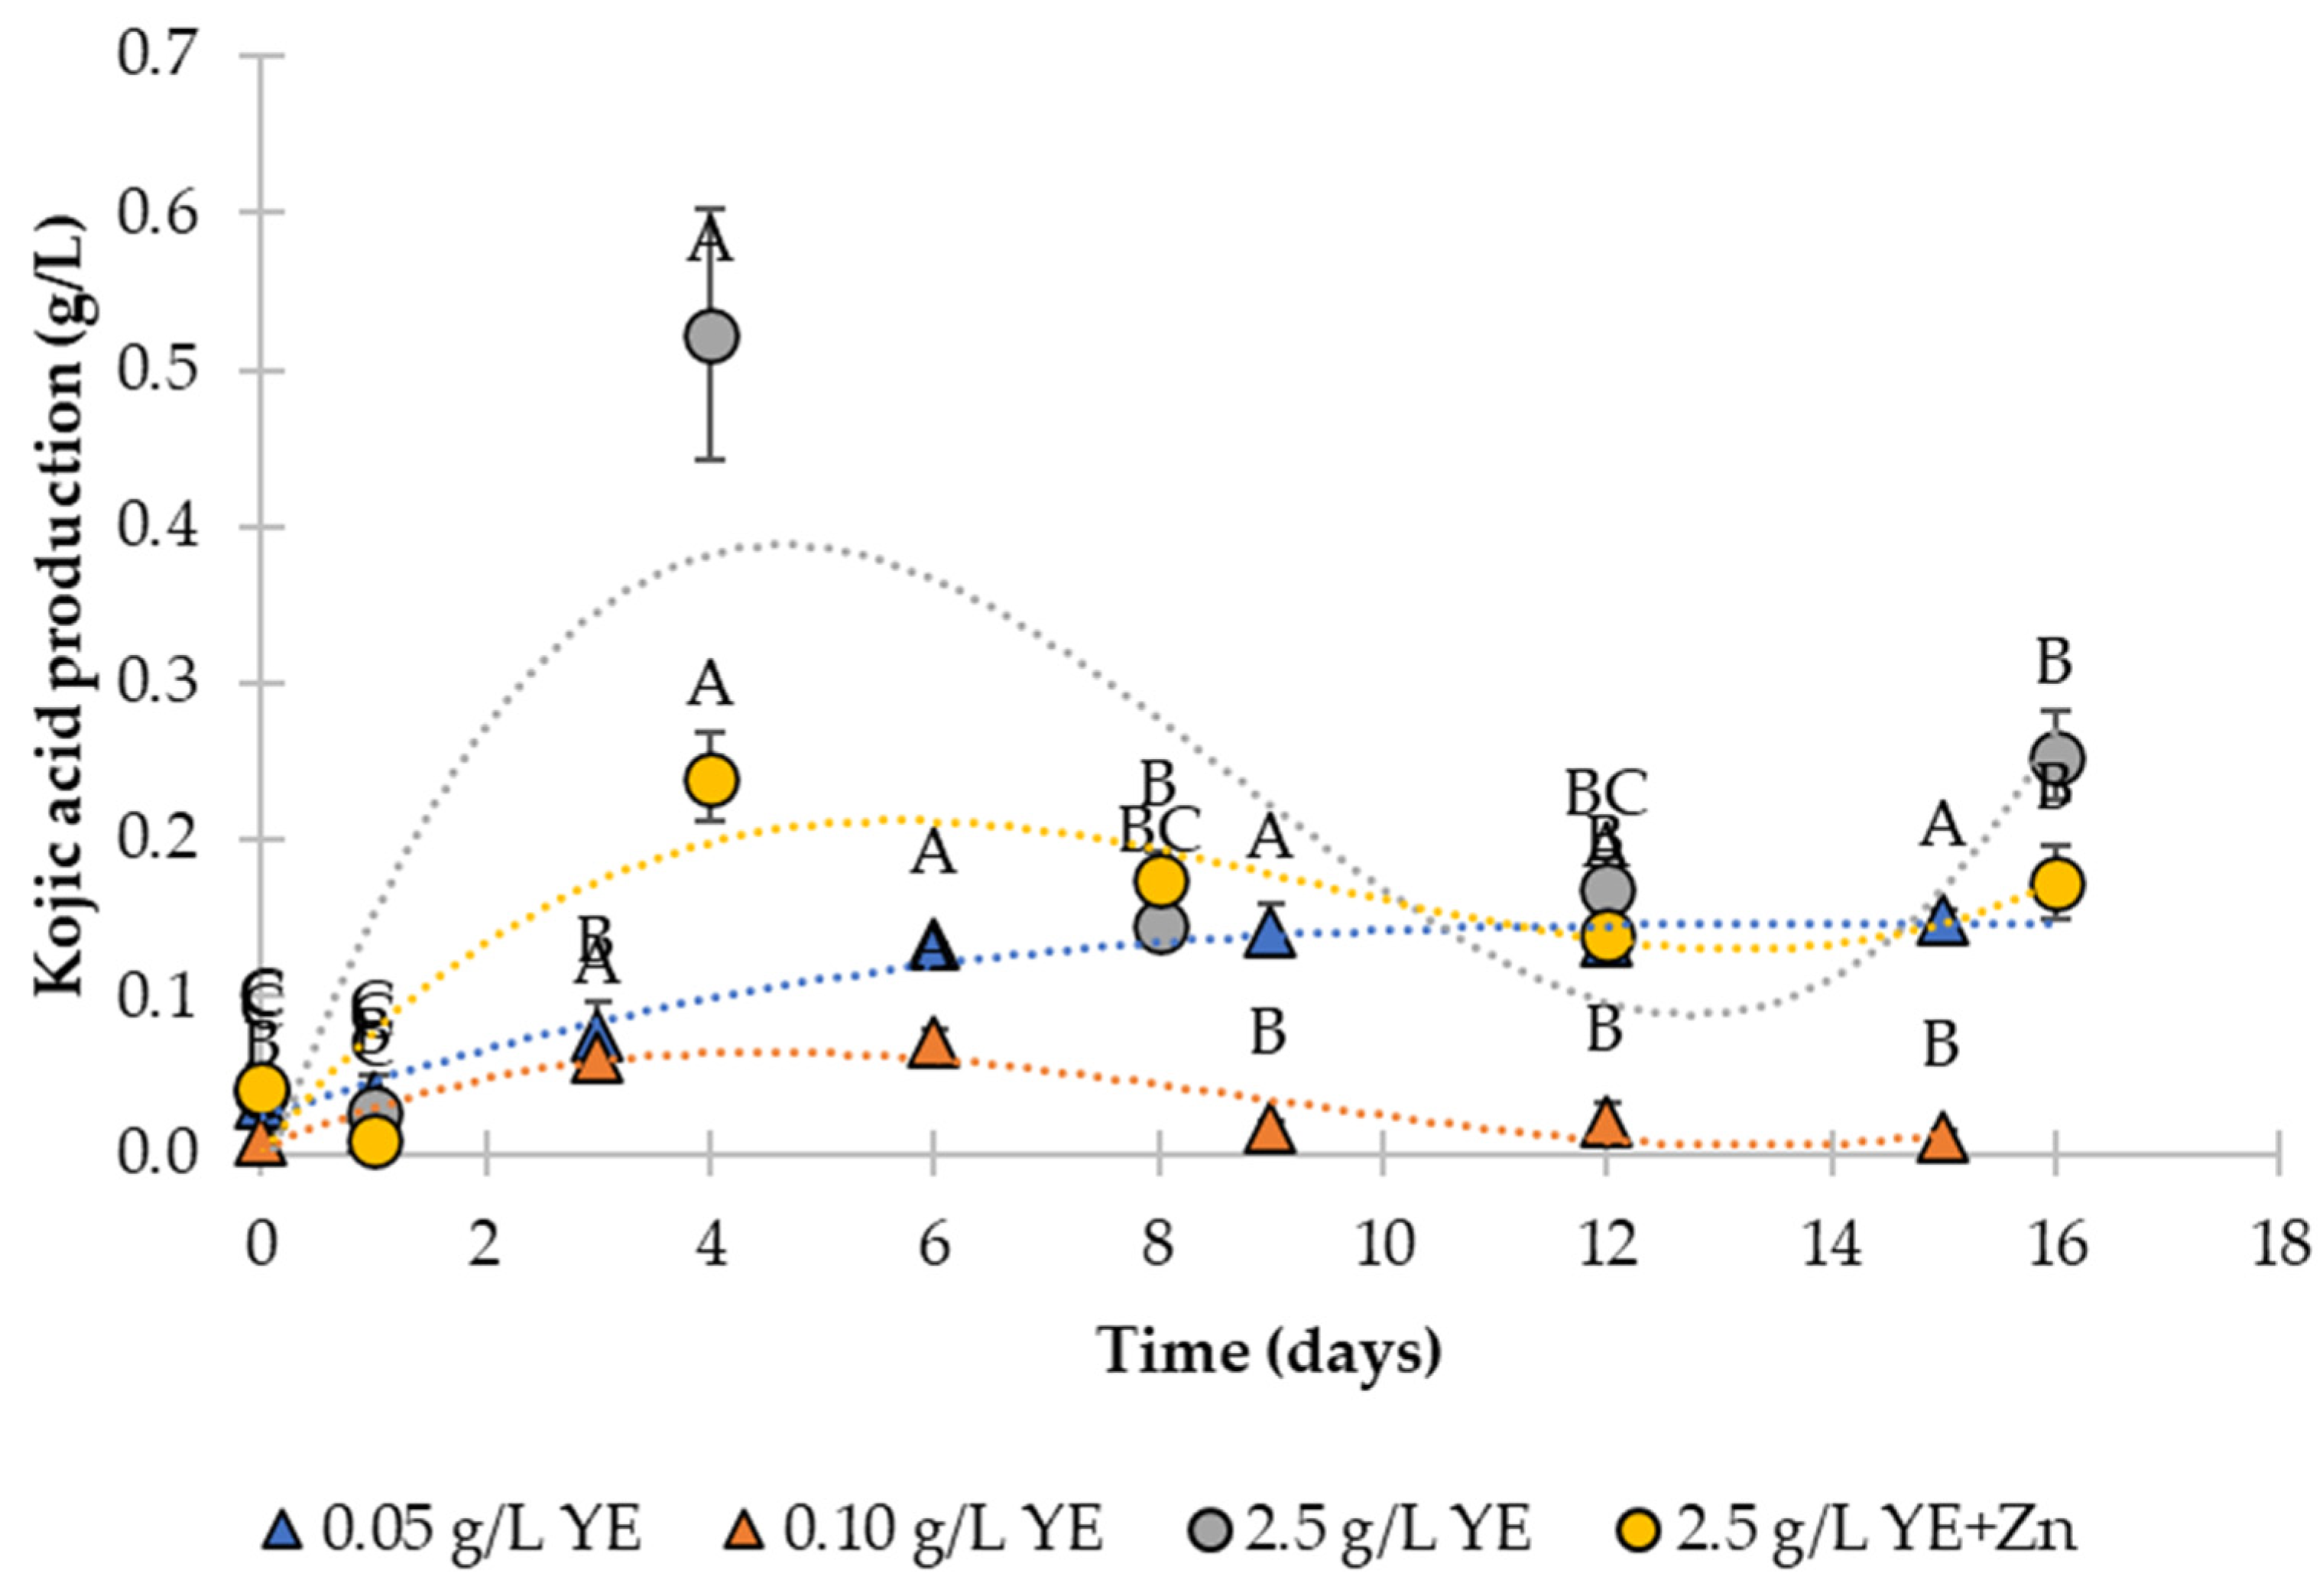
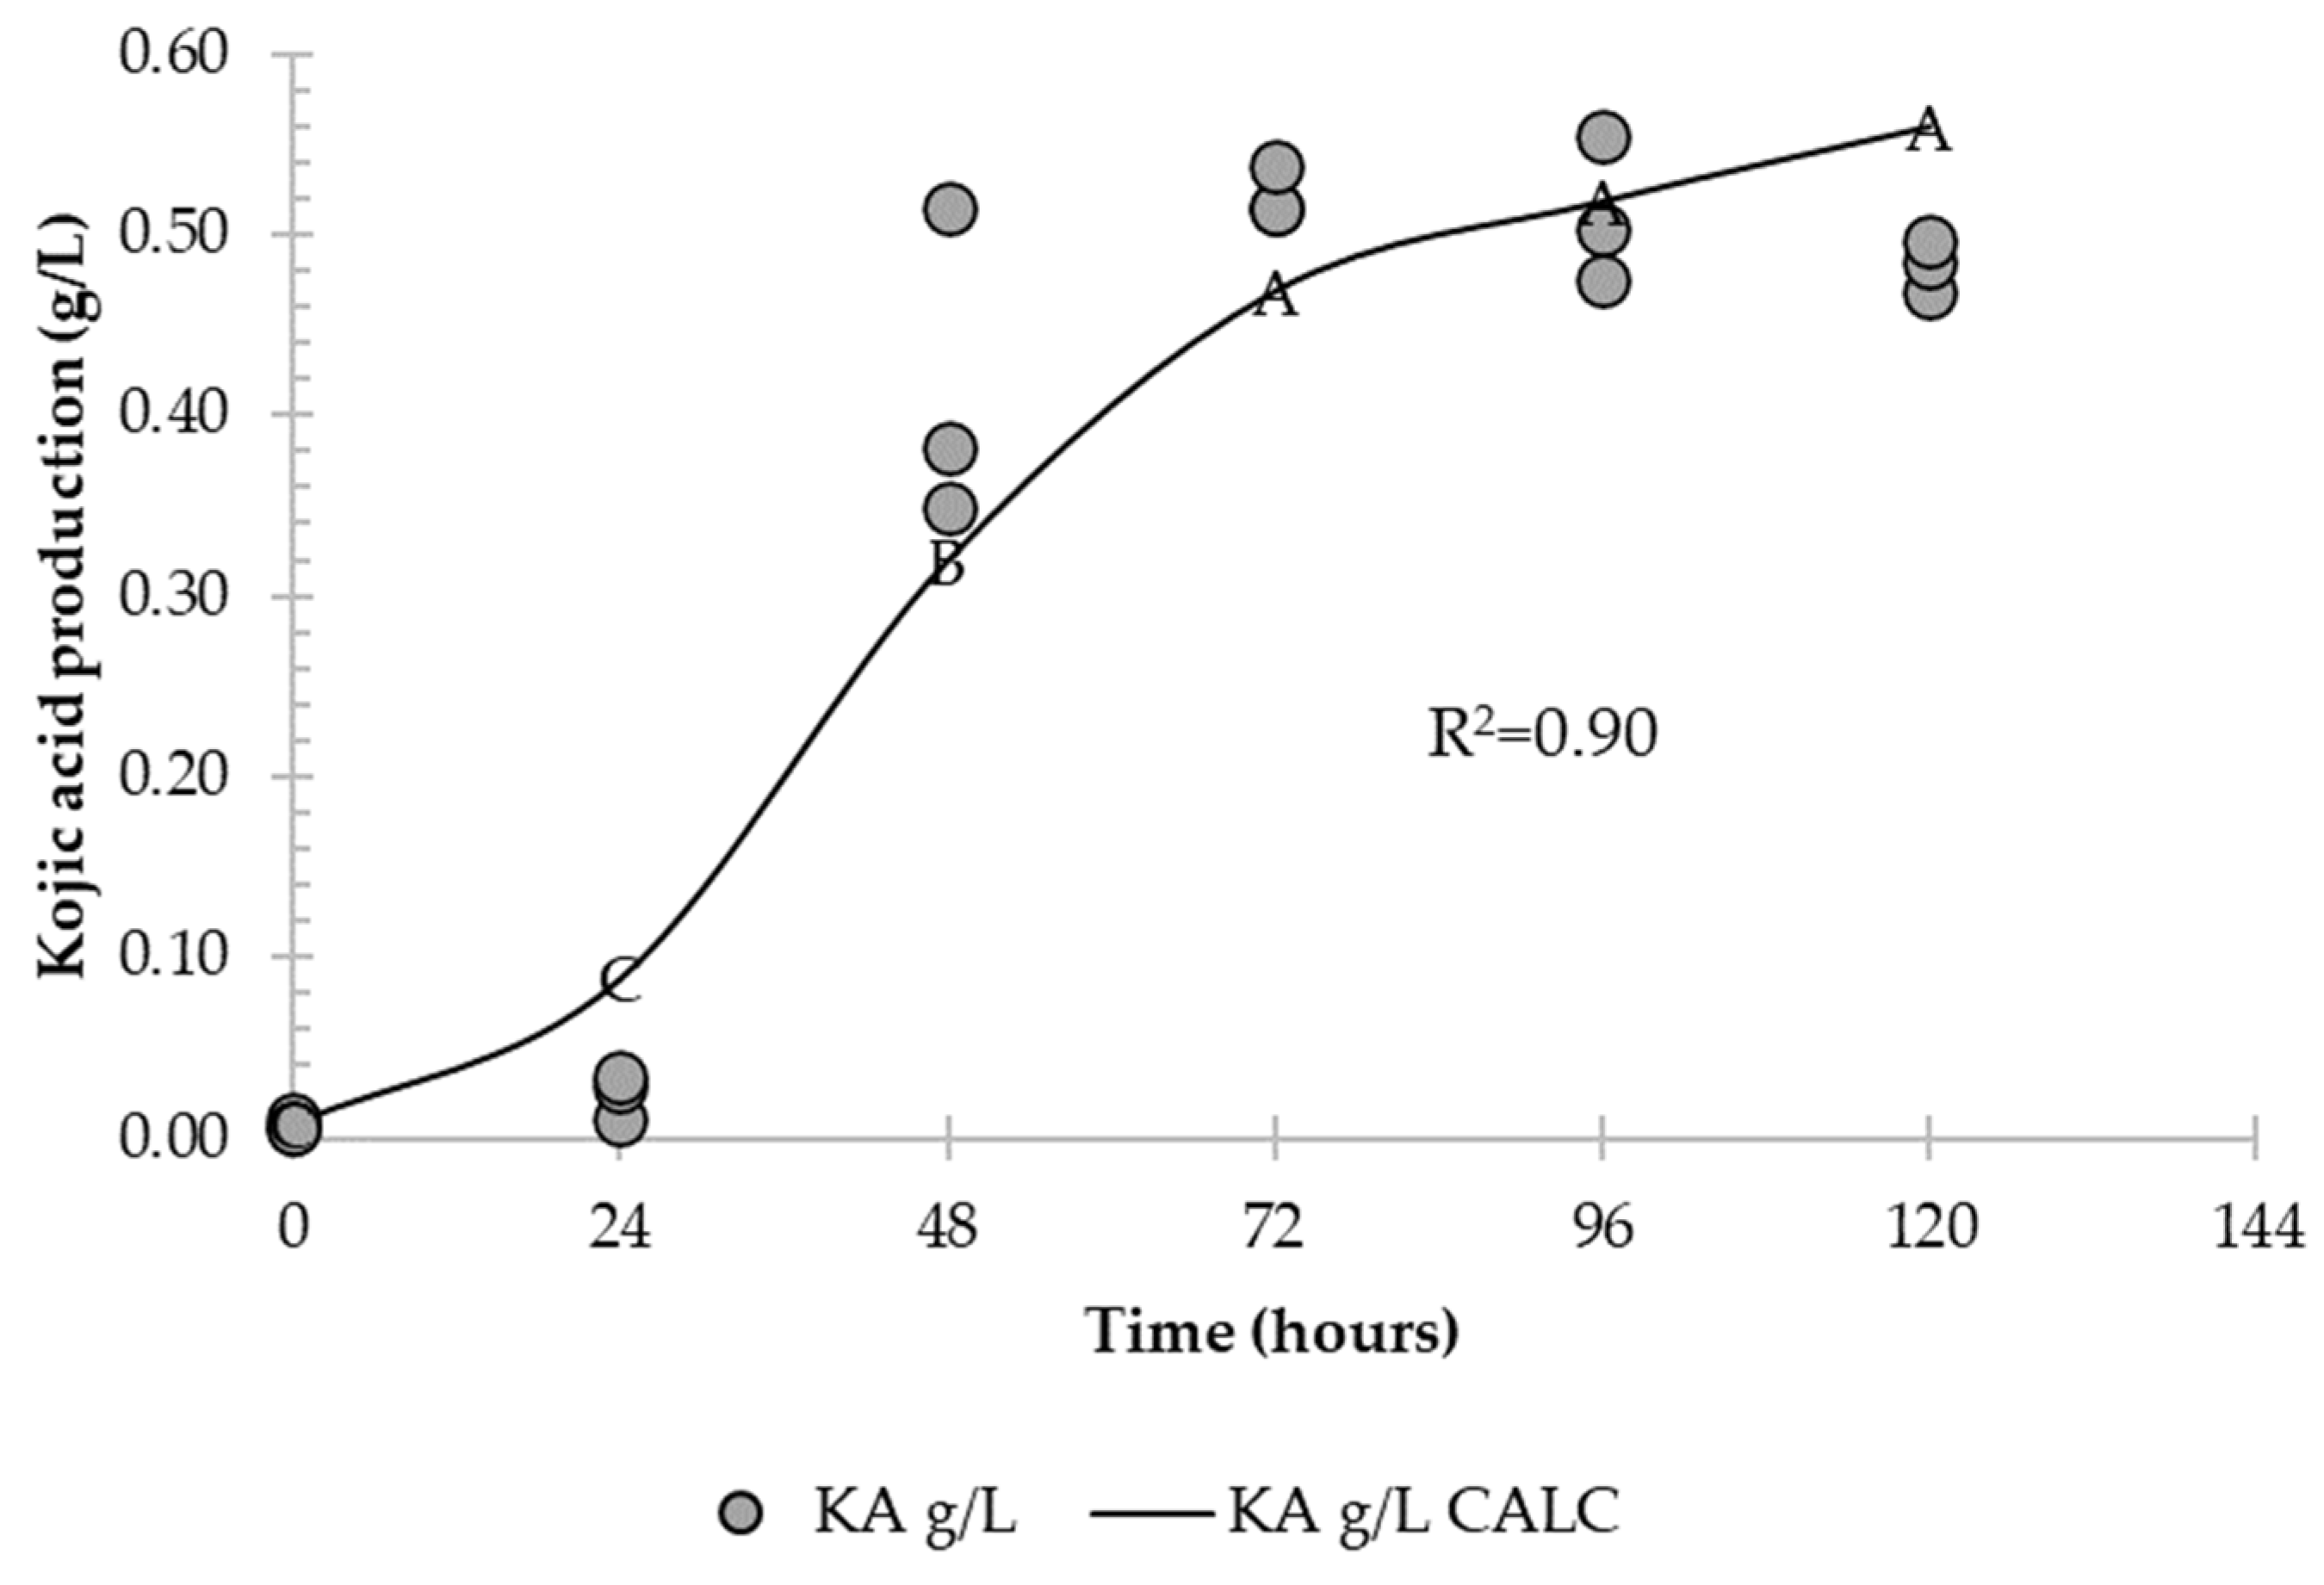
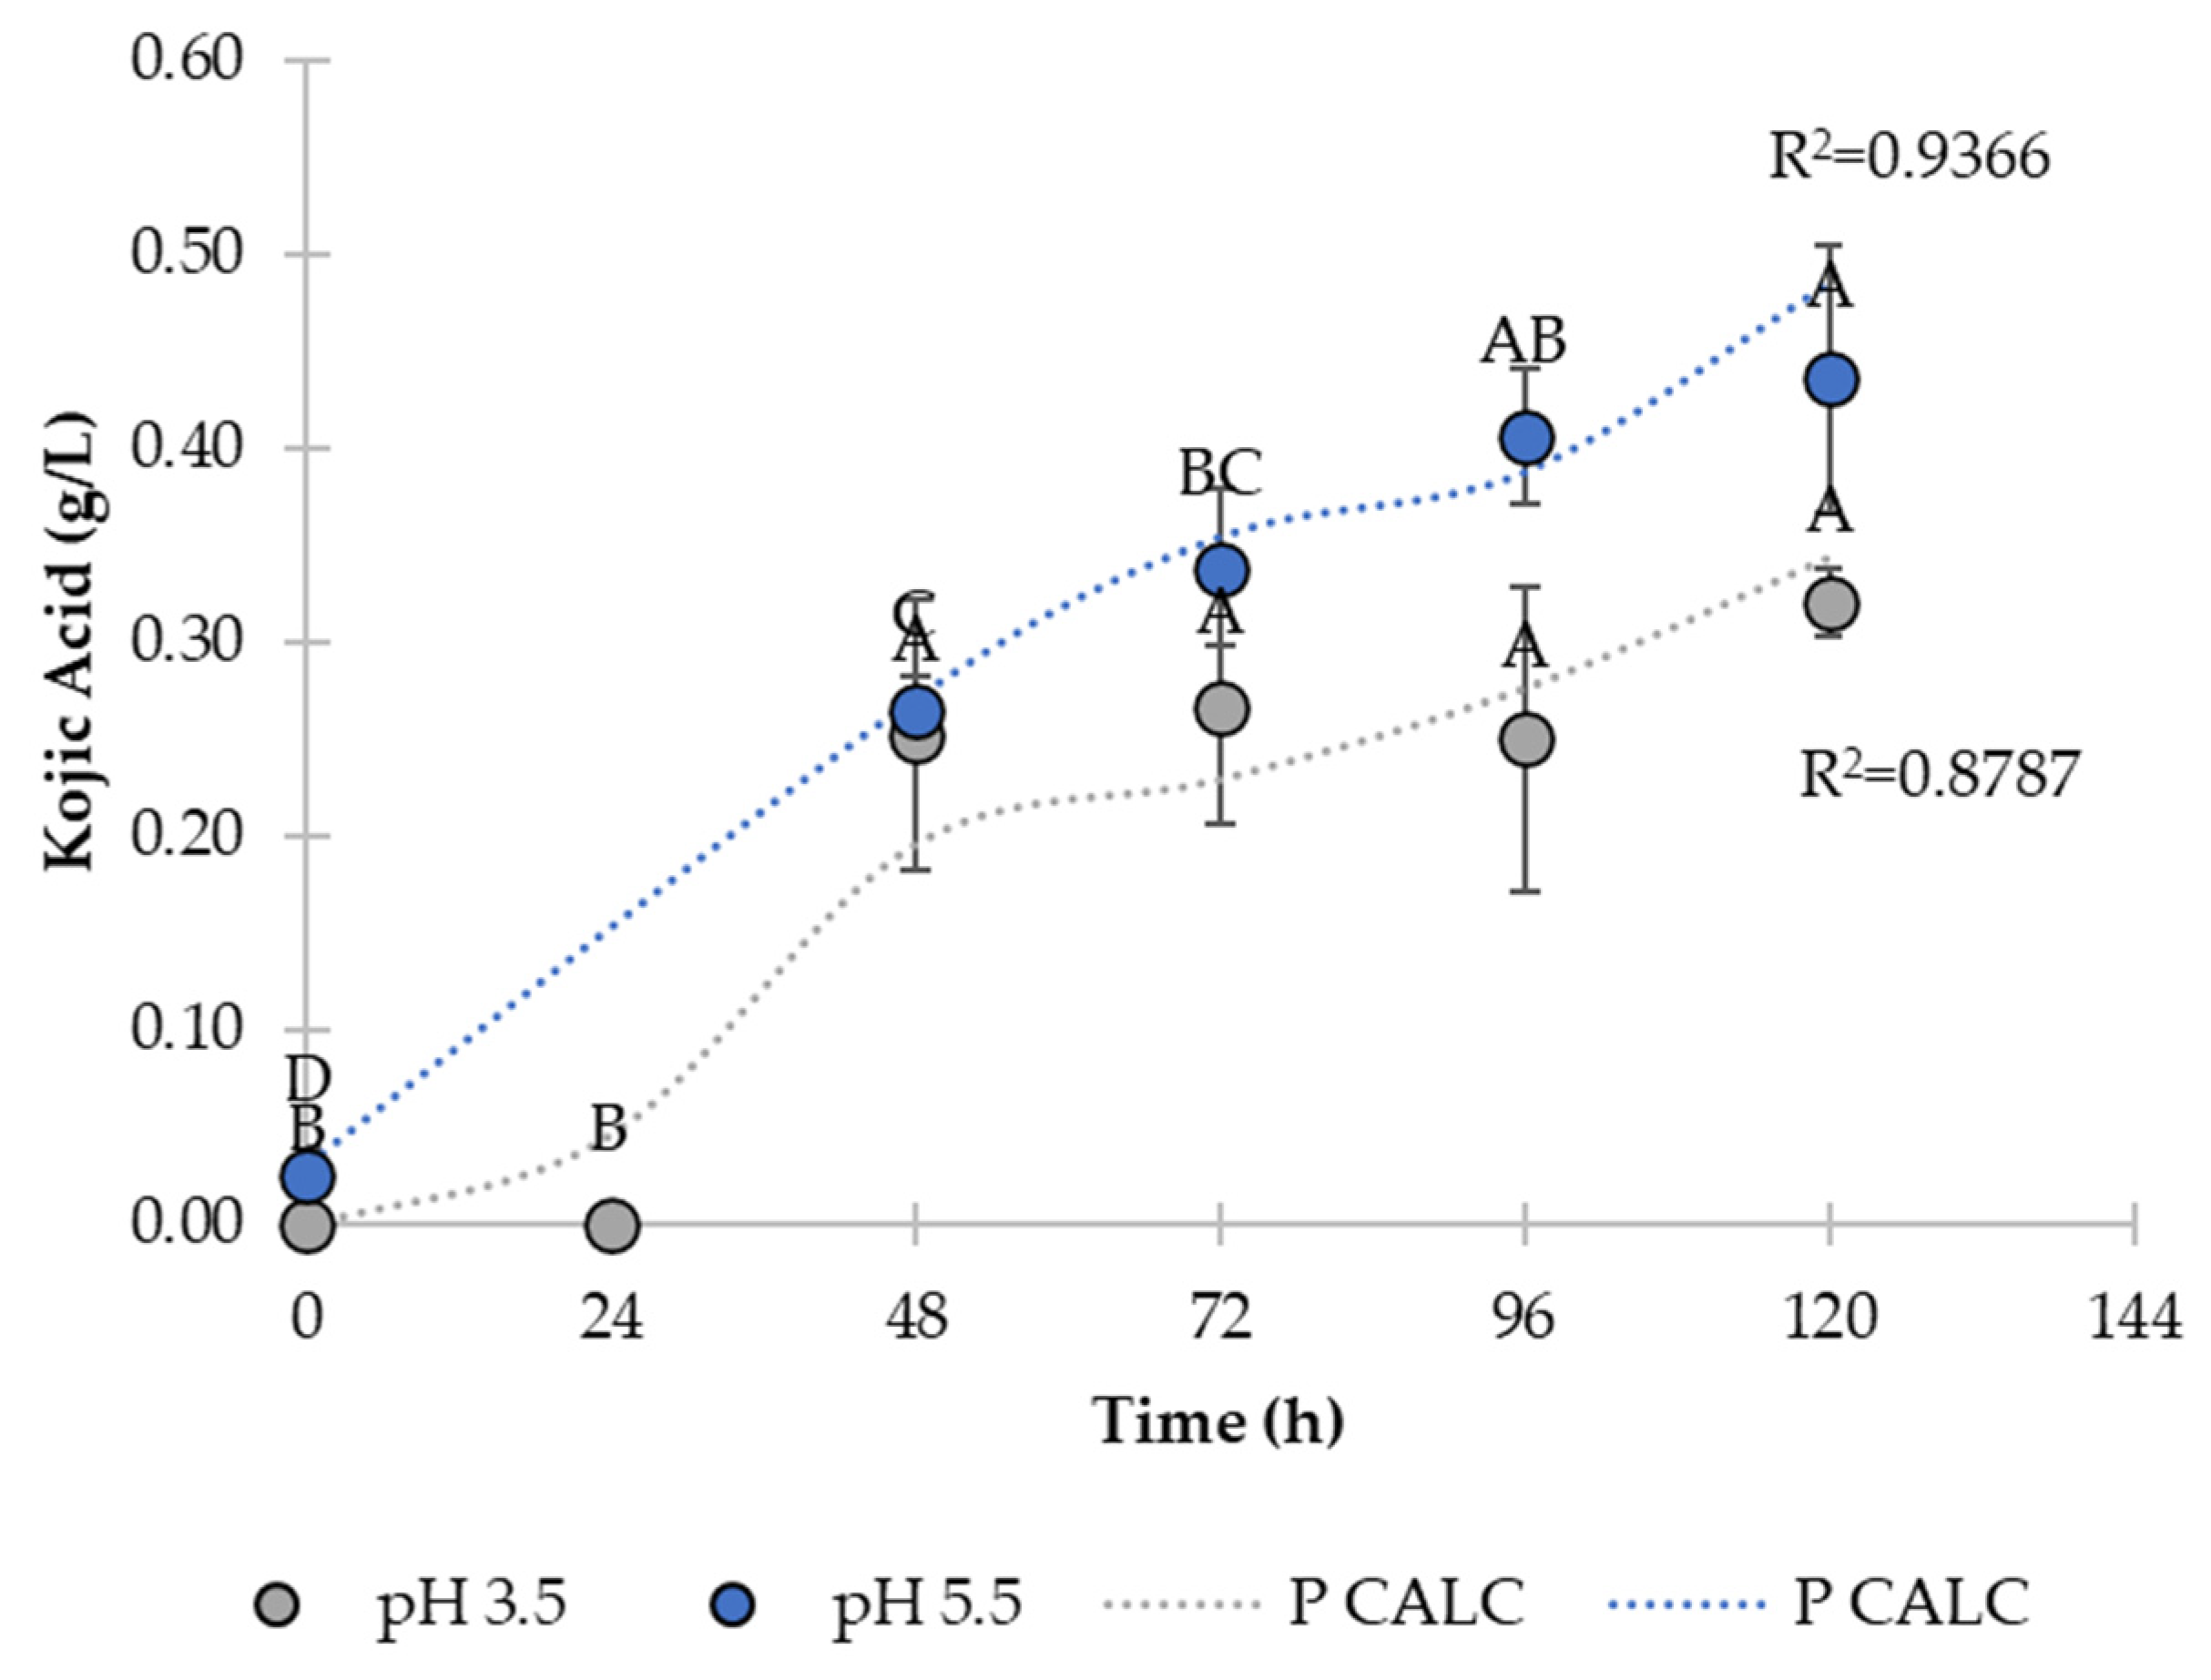
3.3. Product
3.4. Antioxidant Capacity by DPPH and ABTS
4. Discussion
5. Conclusions
Author Contributions
Funding
Data Availability Statement
Acknowledgments
Conflicts of Interest
References
- Hu, H.C.; Li, C.Y.; Tsai, Y.H.; Yang, D.Y.; Wu, Y.C.; Hwang, T.L.; Chen, S.L.; Fülöp, F.; Hunyadi, A.; Yen, C.H.; et al. Secondary metabolites and bioactivities of Aspergillus ochraceopetaliformis isolated from Anthurium brownii. ACS Omega 2020, 5, 20991–20999. [Google Scholar] [CrossRef]
- Xie, H.; Ma, Q.; Wei, D.Z.; Wang, F.Q. Transcriptomic analysis of Aspergillus niger strains reveals the mechanism underlying high citric acid productivity. Bioresour. Bioprocess. 2018, 5, 21. [Google Scholar] [CrossRef] [Green Version]
- Lu, Y.; Zheng, X.; Wang, Y.; Zhang, L.; Wang, L.; Lei, Y.; Zhang, T.; Zheng, P.; Sun, J. Evaluation of Aspergillus niger Six Constitutive Strong Promoters by Fluorescent-Auxotrophic Selection Coupled with Flow Cytometry: A Case for Citric Acid Production. J. Fungi 2022, 8, 568. [Google Scholar] [CrossRef]
- Happi, G.M.; Kouam, S.F.; Talontsi, F.M.; Nkenfou, C.N.; Longo, F.; Zühlke, S.; Douanla-Meli, C.; Spiteller, M. A new dimeric naphtho-γ-pyrone from an endophytic fungus Aspergillus niger AKRN associated with the roots of Entandrophragma congoense collected in Cameroon. Z. Nat.-Sect. B J. Chem. Sci. 2015, 70, 625–630. [Google Scholar] [CrossRef]
- Yu, R.; Liu, J.; Wang, Y.; Wang, H.; Zhang, H. Aspergillus niger as a Secondary Metabolite Factory. Front. Chem. 2021, 9, 701022. [Google Scholar] [CrossRef]
- Saeedi, M.; Eslamifar, M.; Khezri, K. Kojic acid applications in cosmetic and pharmaceutical preparations. Biomed. Pharmacother. 2019, 110, 582–593. [Google Scholar] [CrossRef]
- Kim, J.H.; Chan, K.L. Augmenting the Antifungal Activity of an Oxidizing Agent with Kojic Acid: Control of Penicillium Strains Infecting Crops. Molecules 2014, 19, 18448–18464. [Google Scholar] [CrossRef] [Green Version]
- Zhu, G.Y.; Shi, X.C.; Wang, S.Y.; Wang, B.; Laborda, P. Antifungal Mechanism and Efficacy of Kojic Acid for the Control of Sclerotinia sclerotiorum in Soybean. Front. Plant Sci. 2022, 13, 845698. [Google Scholar] [CrossRef]
- Chen, Y.H.; Lu, P.J.; Hulme, C.; Shaw, A.Y. Synthesis of kojic acid-derived copper-chelating apoptosis inducing agents. Med. Chem. Res. 2013, 22, 995–1003. [Google Scholar] [CrossRef]
- Shah, H.M.S.; Khan, A.S.; Ali, S. Pre-storage kojic acid application delays pericarp browning and maintains antioxidant activities of litchi fruit. Postharvest Biol. Technol. 2017, 132, 154–161. [Google Scholar] [CrossRef]
- Shakibaie, M.; Ameri, A.; Ghazanfarian, R.; Adeli-Sardou, M.; Amirpour-Rostami, S.; Torkzadeh-Mahani, M.; Imani, M.; Forootanfar, H. Statistical optimization of kojic acid production by a UV-induced mutant strain of Aspergillus terreus. Braz. J. Microbiol. 2018, 49, 865–871. [Google Scholar] [CrossRef] [PubMed]
- Rosfarizan, M.; Ariff, A.; Hassan, A.; Karim, M. Influence of pH on Kojic Acid Fermentation by Aspergillus flavus. Pak. J. Biol. Sci. 2000, 3, 977–982. [Google Scholar] [CrossRef] [Green Version]
- Karkeszová, K.; Mastihubová, M.; Mastihuba, V. Regioselective enzymatic synthesis of kojic acid monoesters. Catalysts 2021, 11, 1430. [Google Scholar] [CrossRef]
- Liu, J.M.; Yu, T.C.; Lin, S.P.; Hsu, R.J.; Hsu, K.D.; Cheng, K.C. Evaluation of kojic acid production in a repeated-batch PCS biofilm reactor. J. Biotechnol. 2016, 218, 41–48. [Google Scholar] [CrossRef] [PubMed]
- Sauer, M.; Mattanovich, D.; Marx, H. 12 - Microbial production of organic acids for use in food. In Microbial Production of Food Ingredients, Enzymes and Nutraceuticals; McNeil, B., Archer, D., Giavasis, I., Harvey, L., Eds.; Woodhead Publishing: Cambridge, UK, 2013; pp. 288–320. [Google Scholar] [CrossRef]
- Li, X.; Pan, L.; Wang, B.; Pan, L. The histone deacetylases HosA and HdaA affect the phenotype and transcriptomic and metabolic profiles of Aspergillus niger. Toxins 2019, 11, 520. [Google Scholar] [CrossRef] [PubMed] [Green Version]
- Rosfarizan, M.; Ariff, A.B. Kinetics of kojic acid fermentation by Aspergillus flavus using different types and concentrations of carbon and nitrogen sources. J. Ind. Microbiol. Biotechnol. 2000, 25, 20–24. [Google Scholar] [CrossRef]
- Terabayashi, Y.; Sano, M.; Yamane, N.; Marui, J.; Tamano, K.; Sagara, J.; Dohmoto, M.; Oda, K.; Ohshima, E.; Tachibana, K. Identification and characterization of genes responsible for biosynthesis of kojic acid, an industrially important compound from Aspergillus oryzae. Fungal Genet. Biol. 2010, 47, 953–961. [Google Scholar] [CrossRef]
- Chib, S.; Dogra, A.; Nandi, U.; Saran, S. Consistent production of kojic acid from Aspergillus sojae SSC-3 isolated from rice husk. Mol. Biol. Rep. 2019, 46, 5995–6002. [Google Scholar] [CrossRef] [PubMed]
- Ariff, A.B.; Salleh, M.S.; Ghani, B.; Hassan, M.A.; Rusul, G.; Karim, M.I.A. Aeration and yeast extract requirements for kojic acid production by Aspergillus flavus link. Enzym. Microb. Technol. 1996, 19, 545–550. [Google Scholar] [CrossRef]
- Rosfarizan, M.; Ariff, A.; Hassan, M.; Karim, M. Kojic acid production by Aspergillus flavus using gelatinized and hydrolyzed sago starch as carbon sources. Folia Microbiol. 1998, 43, 459–464. [Google Scholar] [CrossRef] [PubMed]
- Badar, R.; Yaqoob, S.; Ahmed, A.; Shaoor, Q. Screening and optimization of submerged fermentation of Aspergillus species for kojic acid production. Res. Sq. 2021; PREPRINT. [Google Scholar] [CrossRef]
- Promsang, A.; Rungsardthong, V.; Thumthanaruk, B.; Puttanlek, C.; Uttapap, D.; Foophow, T.; Phalathanaporn, V.; Vatanyoopaisarn, S. Effect of culture conditions and medium compositions on kojic acid production by Aspergillus oryzae ATCC 10124. In Proceedings of the IOP Conference Series: Earth and Environmental Science, Macau, China, 21–24 July 2019; p. 012047. [Google Scholar]
- Ammar, H.A.M.; Ezzat, S.M.; Houseny, A.M. Improved production of kojic acid by mutagenesis of Aspergillus flavus HAk1 and Aspergillus oryzae HAk2 and their potential antioxidant activity. 3 Biotech 2017, 7, 276. [Google Scholar] [CrossRef] [PubMed]
- Mahmoud, G.A.E.; Zohri, A.N.A. Amendment stable kojic acid produced by non-toxicogenic Aspergillus oryzae using five levels central composite design of response surface methodology: Stable kojic acid production. J. Microbiol. Biotechnol. Food Sci. 2021, 10, e2683. [Google Scholar] [CrossRef]
- Kwak, M.Y.; Rhee, J.S. Cultivation characteristics of immobilized Aspergillus oryzae for kojic acid production. Biotechnol. Bioeng. 1992, 39, 903–906. [Google Scholar] [CrossRef] [PubMed]
- Wan, C.; Zhang, M.; Fang, Q.; Xiong, L.; Zhao, X.; Hasunuma, T.; Bai, F.; Kondo, A. The impact of zinc sulfate addition on the dynamic metabolic profiling of Saccharomyces cerevisiae subjected to long term acetic acid stress treatment and identification of key metabolites involved in the antioxidant effect of zinc. Metallomics 2015, 7, 322–332. [Google Scholar] [CrossRef] [PubMed]
- Coupland, K.; Niehaus, W.G., Jr. Effect of nitrogen supply, Zn2+, and salt concentration on kojic acid and versicolorin biosynthesis byAspergillus parasiticus. Exp. Mycol. 1987, 11, 206–213. [Google Scholar] [CrossRef]
- Miller, G.L. Use of Dinitrosalicylic Acid Reagent for Determination of Reducing Sugar. Anal. Chem. 1959, 31, 426–428. [Google Scholar] [CrossRef]
- Bentley, R. Preparation and analysis of Kojic acid. In Methods in Enzymology; Academic Press: Cambridge, MA, USA, 1957; Volume 3, pp. 238–241. [Google Scholar]
- Brand-Williams, W.; Cuvelier, M.E.; Berset, C. Use of a free radical method to evaluate antioxidant activity. LWT-Food Sci. Technol. 1995, 28, 25–30. [Google Scholar] [CrossRef]
- Re, R.; Pellegrini, N.; Proteggente, A.; Pannala, A.; Yang, M.; Rice-Evans, C. Antioxidant activity applying an improved ABTS radical cation decolorization assay. Free Radic. Biol. Med. 1999, 26, 1231–1237. [Google Scholar] [CrossRef]
- Robledo, A.; Aguilera-Carbo, A.F.; Prado-Barragan, A.; Sepulveda-Torre, L.; Rodríguez-Herrera, R.; Contreras-Esquivel, J.C.; Aguilar, C.N. Kinetics of Ellagic Acid Accumulation By Solid-State Fermentation. In Theoretical Models and Experimental Approaches in Physical Chemistry; Apple Academic Press: Boca Raton, FL, USA, 2019; pp. 267–280. [Google Scholar]
- De Caldas Felipe, M.T.; do Nascimento Barbosa, R.; Bezerra, J.D.P.; de Souza-Motta, C.M. Production of kojic acid by Aspergillus species: Trends and applications. Fungal Biol. Rev. 2023, 45, 100313. [Google Scholar] [CrossRef]
- Apak, R.; Güçlü, K.; Demirata, B.; Özyürek, M.; Çelik, S.E.; Bektaşoğlu, B.; Berker, K.I.; Özyurt, D. Comparative evaluation of various total antioxidant capacity assays applied to phenolic compounds with the CUPRAC assay. Molecules 2007, 12, 1496–1547. [Google Scholar] [CrossRef] [Green Version]
- Sridhar, K.; Charles, A.L. In vitro antioxidant activity of Kyoho grape extracts in DPPH and ABTS assays: Estimation methods for EC50 using advanced statistical programs. Food Chem. 2019, 275, 41–49. [Google Scholar] [CrossRef] [PubMed]
- Ola, A.R.B.; Metboki, G.; Lay, C.S.; Sugi, Y.; De Rozari, P.; Darmakusuma, D.; Hakim, E.H. Single Production of Kojic Acid by Aspergillus flavus and the Revision of Flufuran. Molecules 2019, 24, 4200. [Google Scholar] [CrossRef] [Green Version]
- Copetti, M.V. Fungi as industrial producers of food ingredients. Curr. Opin. Food Sci. 2019, 25, 52–56. [Google Scholar] [CrossRef]
- Lassfolk, R.; Suonpaä, A.; Birikh, K.; Leino, R. Chemo-enzymatic three-step conversion of glucose to kojic acid. Chem. Commun. 2019, 55, 14737–14740. [Google Scholar] [CrossRef] [PubMed] [Green Version]
- Mohamad, R.; Mohamed, M.S.; Suhaili, N.; Salleh, M.M.; Ariff, A.B. Kojic acid: Applications and development of fermentation process for production. Biotechnol. Mol. Biol. Rev. 2010, 5, 24–37. [Google Scholar]
- Hassan, H.; Saad, A.; Hazzaa, M.; Ibrahim, E. Optimization study for the production of kojic acid crystals by Aspergillus oryzae var. effusus NRC 14 isolate. Int. J. Curr. Microbiol. Appl. Sci. 2014, 3, 133–142. [Google Scholar]
- Chang, P.-K.; Scharfenstein, L.L.; Mahoney, N.; Kong, Q. Kojic Acid Gene Clusters and the Transcriptional Activation Mechanism of Aspergillus flavus KojR on Expression of Clustered Genes. J. Fungi 2023, 9, 259. [Google Scholar] [CrossRef]
- Rasmey, A.-H.M.; Abdel-Kareem, M. Optimization of culture conditions for Kojic acid production in surface fermentation by Aspergillus oryzae isolated from wheat grains. Bull. Pharm. Sci. Assiut 2021, 44, 201–211. [Google Scholar] [CrossRef]
- Sanjotha, G.; Shivasharana, C.T.; Manawadi, S.I. An in vitro approach for evaluating antimicrobial activity and production of kojic acid by Aspergillus flavus isolated from Karwar region. J. Pure Appl. Microbiol. 2019, 13, 2261–2272. [Google Scholar] [CrossRef] [Green Version]
- Saraphanchotiwitthaya, A.; Sripalakit, P. Kojic acid production from rice by Amylomyces rouxii TISTR 3182 and Aspergillus oryzae TISTR 3259 and its cosmeceutical potential. ScienceAsia 2019, 45, 525–531. [Google Scholar] [CrossRef] [Green Version]
- Hazzaa, M.; Saad, A.; Hassan, H.; Ibrahim, E. High production of kojic acid crystals by isolated Aspergillus oryzae var. effusus NRC14. J. Appl. Sci. Res. 2013, 9, 1714–1723. [Google Scholar]
- Futamura, T.; Okabe, M.; Tamura, T.; Toda, K.; Matsunobu, T.; Park, Y.S. Improvement of production of kojic acid by a mutant strain Aspergillus oryzae, MK107-39. J. Biosci. Bioeng. 2001, 91, 272–276. [Google Scholar] [CrossRef]
- Ariff, A.; Rosfarizan, M.; Herng, L.; Madihah, S.; Karim, M. Kinetics and modelling of kojic acid production by Aspergillus flavus Link in batch fermentation and resuspended mycelial system. World J. Microbiol. Biotechnol. 1997, 13, 195–201. [Google Scholar] [CrossRef]
- Rosfarizan, M.; Ariff, A.B. Kinetic of kojic acid fermentation by Aspergillus flavus Link S44-1 using sucrose as a carbon source under different pH conditions. Biotechnol. Bioprocess Eng. 2006, 11, 72–79. [Google Scholar] [CrossRef]
- El-Kady, I.A.; Zohri, A.N.A.; Hamed, S.R. Kojic Acid Production from Agro-Industrial By-Products Using Fungi. Biotechnol. Res. Int. 2014, 2014, 642385. [Google Scholar] [CrossRef] [Green Version]
- Bala, K.; Devi, D.; Vijayalakshmi, P.; Shilpa, V.; Prasad, V.; Veerendra Kumar, B. Response Surface Methodology for the Optimization of Kojic Acid Production by Aspergillus Flavus using Muntingia Calabura Fruits as a Carbon Source. Indian J. Sci. Technol. 2015, 8, 556–561. [Google Scholar] [CrossRef]
- Ramesh, T.; Kalaiselvam, M. An Experimental Study on Citric Acid Production by Aspergillus niger Using Gelidiella acerosa as a Substrate. Indian J. Microbiol. 2011, 51, 289–293. [Google Scholar] [CrossRef] [Green Version]
- Katagiri, H.; Kitahara, K. The formation of kojic acid by aspergillus oryzae part i. the formation of kojic acid from pentoses, sugar alcohols and gluconic acid. Bull. Agric. Chem. Soc. Jpn. 1929, 5, 38–47. [Google Scholar]
- Show, P.L.; Oladele, K.O.; Siew, Q.Y.; Aziz Zakry, F.A.; Lan, J.C.W.; Ling, T.C. Overview of citric acid production from Aspergillus niger. Front. Life Sci. 2015, 8, 271–283. [Google Scholar] [CrossRef] [Green Version]
- Marui, J.; Yamane, N.; Ohashi-Kunihiro, S.; Ando, T.; Terabayashi, Y.; Sano, M.; Ohashi, S.; Ohshima, E.; Tachibana, K.; Higa, Y. Kojic acid biosynthesis in Aspergillus oryzae is regulated by a Zn (II) 2Cys6 transcriptional activator and induced by kojic acid at the transcriptional level. J. Biosci. Bioeng. 2011, 112, 40–43. [Google Scholar] [CrossRef]
- Ellena, V.; Steiger, M.G. The importance of complete and high-quality genome sequences in Aspergillus niger research. Front. Fungal Biol. 2022, 3, 935993. [Google Scholar] [CrossRef]


| Parameter | 0.05 g/L YE | 0.10 g/L YE | 2.5 g/L YE | 2.5 g/L YE + Zn |
|---|---|---|---|---|
| µmax (h−1) | 0.006 ± 0.001 c | 0.004 ± 0.001 c | 0.035 ± 0.001 a | 0.024 ± 0.002 b |
| YX/S (g X/g S) | 0.019 ± 0.001 c | 0.020 ± 0.003 c | 0.082 ± 0.001 a | 0.052 ± 0.004 b |
| m (g X/g S h) | 0.000 ± 0 b | 0.000 ± 0 b | 0.000 ± 0 a | 0.000 ± 0 b |
| YP/X (g KA/g X) | 0.000 ± 0 b | 0.007 ± 0.006 b | 0.032 ± 0.004 a | 0.029 ± 0.001 a |
| k (g KA/g X h) | 0.000 ± 0 a | 0.000 ± 0 a | 0.000 ± 0 a | 0.000 ± 0 a |
| qS (g glu/g X h) | 0.296 ± 0.062 ab | 0.199 ± 0.051 b | 0.430 ± 0.001 ab | 0.460 ± 0.084 a |
| qP (g KA/g X h) | 0.0000 ± 0 c | 0.0000 ± 0 c | 0.0011 ± 0.0001 a | 0.0007 ± 0.0001 b |
| Parameters (Units) | pH 3.5 | pH 5.5 |
|---|---|---|
| µmax (h−1) | 0.049 ± 0.001 | 0.065 ± 0.004 |
| YX/S (g X/g S) | 0.345 ± 0.010 | 0.173 ± 0.068 |
| m (g X/g S h) | 0.135 ± 0.015 * | 0.108 ± 0.016 * |
| YP/X (g KA/g X) | 0.231 ± 0.005 | 0.246 ± 0.005 |
| k (g KA/g X h) | 0 | 0 |
| qS (g glucose/g X h−1) | 0.276 ± 0.017 | 0.347 ± 0.005 |
| qP (g KA/g X h−1) | 0.015 ± 0.003 * | 0.016 ± 0.001 * |
| Time (h) | pH 3.5 | pH 5.5 | ||
|---|---|---|---|---|
| DPPH (% Inhibition) | ABTS (% Inhibition) | DPPH (% Inhibition) | ABTS (% Inhibition) | |
| 0 | 1.89 ± 1.32 b | 0.062 ± 0.91 b | 8.42 ± 1.07 c | 12.88 ± 1.25 b |
| 24 | 15.64 ± 095 a | 9.92 ± 1.03 a | nd | nd |
| 48 | 17.25 ± 1.38 a | 14.36 ± 3.99 a | 14.37 ± 0.82 b | 18.04 ± 2.54 a |
| 72 | 16.37 ± 2.64 a | 13.71 ± 1.84 a | 17.12 ± 7.41 ab | 15.45 ± 1.18 ab |
| 96 | 18.44 ± 0.27 a | 11.68 ± 3.96 a | 16.59 ± 6.11 ab | 16.18 ± 0.99 a |
| 120 | 18.41 ± 0.51 a | 14.48 ± 2.28 a | 18.73 ± 4.93 a | 17.56 ± 1.53 a |
| CV | 8.76 | 23.98 | 12.64 | 9.96 |
Disclaimer/Publisher’s Note: The statements, opinions and data contained in all publications are solely those of the individual author(s) and contributor(s) and not of MDPI and/or the editor(s). MDPI and/or the editor(s) disclaim responsibility for any injury to people or property resulting from any ideas, methods, instructions or products referred to in the content. |
© 2023 by the authors. Licensee MDPI, Basel, Switzerland. This article is an open access article distributed under the terms and conditions of the Creative Commons Attribution (CC BY) license (https://creativecommons.org/licenses/by/4.0/).
Share and Cite
Quiterio-Gutiérrez, T.; González-Morales, S.; González-Fuentes, J.A.; Benavides-Mendoza, A.; Fernández-Luqueño, F.; Medrano-Macías, J.; Robledo-Olivo, A. Production of Kojic Acid by Aspergillus niger M4 with Different Concentrations of Yeast Extract as a Nitrogen Source. Processes 2023, 11, 1724. https://doi.org/10.3390/pr11061724
Quiterio-Gutiérrez T, González-Morales S, González-Fuentes JA, Benavides-Mendoza A, Fernández-Luqueño F, Medrano-Macías J, Robledo-Olivo A. Production of Kojic Acid by Aspergillus niger M4 with Different Concentrations of Yeast Extract as a Nitrogen Source. Processes. 2023; 11(6):1724. https://doi.org/10.3390/pr11061724
Chicago/Turabian StyleQuiterio-Gutiérrez, Tomasa, Susana González-Morales, José Antonio González-Fuentes, Adalberto Benavides-Mendoza, Fabián Fernández-Luqueño, Julia Medrano-Macías, and Armando Robledo-Olivo. 2023. "Production of Kojic Acid by Aspergillus niger M4 with Different Concentrations of Yeast Extract as a Nitrogen Source" Processes 11, no. 6: 1724. https://doi.org/10.3390/pr11061724