Article

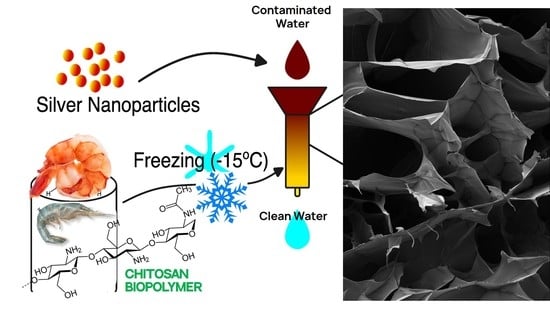
Chitosan Glutaraldegyde Cryogels for Wastewater Treatment and Extraction of Silver Nanoparticles

by
Dmitriy Berillo
1,2,* and
Aknazar Arysbek
3
1
School of Applied Sciences, University of Brighton, Huxley Building, Lewes Road, Brighton BN2 4GJ, UK
2
Department of Chemistry and Chemical Engineering, Institute of Chemical and Biological Technologies (IHBT), Satbayev University, Almaty 050013, Kazakhstan
3
Tufts University, 419 Boston Ave, Medford, MA 02155, USA
*
Author to whom correspondence should be addressed.
Processes 2023, 11(6), 1661; https://doi.org/10.3390/pr11061661
Submission received: 25 April 2023 / Revised: 19 May 2023 / Accepted: 22 May 2023 / Published: 30 May 2023

Abstract

:

Highlights

What are the main findings:
  • Covalently crosslinked chitosan-based cryogel for removal of AgNPs
  • AgNPs suspension stabilized by plant extract a model water contaminant having complex composition
  • Water permeability of cryogels significantly affects AgNP adsorption efficiency and adsorption capacity
What is the implication of the main finding?
  • Maximum capacity for chitosan based cryogel prepared at −15 °C is 82 mg/g
  • Low-cost adsorbent with high adsorption capacities to metal nanoparticles

Abstract

The discharge of nanoparticles into the environment, such as through industrial plants and municipal wastewater treatment plants, can pose a hazard to aquatic life. This study demonstrates the effective removal of silver nanoparticles (AgNPs) using a chitosan-based cryogel, which has potential applications in agriculture, as well as in water treatment or in industrial plants that discharge into environmentally sensitive water bodies. The adsorbent is economically viable, has high affinity toward metal nanoparticles, is biodegradable and biocompatible, and displays a good removal of nanoparticles. AgNP adsorption was monitored using UV/Vis spectroscopy and TEM analysis. SEM, nitrogen adsorption, TGA, and FTIR analysis were used for cryogel characterization. The BET model of nitrogen adsorption revealed a specific surface area of 7.7 m2/g for chitosan–glutaraldehyde (CHI–GA) cryogels. The elasticity modulus of the CHI–GA cryogel was estimated as 543 ± 54 kPa. The AgNPs were characterized by a negative charge (−38 ± 17 mV) and an average diameter of 64 nm with a polydispersity index of 0.16. The mechanism of AgNP adsorption involved electrostatic interactions between the oppositely charged surfaces of the cryogel and particles. The temperature of the cryogel preparation affected the water permeability and adsorption efficiency. CHI–GA illustrated a capacity of 63 mg/g at a flow rate of 0.8 mL/min under a solution pressure of 500–970 Pa. The increase in pressure of the model plant extract-stabilized AgNP suspension (14 mg/L AgNPs) to 3.42–3.9 kPa led to an increase in the water permeability rate to 10 mL/min and a significant decrease in the efficiency of particle removal. The CHI–GA adsorbent demonstrated up to 96.5% AgNP removal until the breakthrough point due to adsorbent saturation. The CHI–GA cryogel adsorbent (1 g) can be used for efficient filtering of about 4.5 L of contaminated water.

Graphical Abstract

1. Introduction

Nanoparticles (NPs) represent the 10–100 nm size region of the particle spectrum. Engineered nanoparticles have been and are being extensively used in many technological, medical, and consumer applications. This is due to some exceptional properties that arise on such scales including the large surface area-to-mass ratio, which makes them a highly reactive species that is widely utilized in catalysis [1,2,3]. The most recognized property of silver nanoparticles (AgNPs) is its antimicrobial activity [4,5]. Silver has been used for wound treatments and sterilization for centuries, and its nanoparticles exhibit the same characteristic, mainly facilitated through the release of active Ag+ ions [6,7,8,9]. The excellent antimicrobial and antiviral activity of silver has been an irreplaceable feature in the development of many disinfectants, wound dressings, and sterile surgical applications [8,9,10,11]. The estimated annual production of AgNPs is 135–420 tons, represented by 443 products listed on the Consumer Products Inventory [12]. This relates only to an intentional manufacturing of AgNPs and their incorporation into products. Nevertheless, greater danger may lie in the unintentional release of ionic silver into aquatic systems, where it might transform into nanoparticles. It was reported that AgNPs occurred naturally in the vicinity of silver mines in Texas and Mexico [13,14]. Many compounds in nature have easily oxidizable functional groups present in their structure, which facilitate a reducing activity toward AgNPs.
A relatively high concentration of metallic silver in dissolved organic matter-rich waters results in the formation of AgNPs under direct sunlight. Their reduction is mediated by the presence of humic acids via photochemical reduction with dissolved organic matter [15]. These findings suggest a different framework to assess the occurrence of AgNPs in the environment. Thus, it is evident that not all NPs are manmade, and further investigation of naturally produced NPs is required to grasp the full picture. The global demand for silver in industrial applications in 2020 was reported by the Silver Institute to be 16,000 tons, of which 3100 tons were for photovoltaics in solar power technology [16]. With the demand being so much higher for nanoparticles, it is necessary to account for the use of metallic silver on an industrial scale when assessing the environmental concerns of AgNPs. Inspecting wastewater discharges around sewage treatment plants and surrounding rivers revealed that the concentration of AgNPs at peak events can reach 15–20 mg/L in the vicinity of industrial plants and 9–10 mg/L in residential rivers [17]. AgNPs were illustrated to affect the early growth of zebrafish embryos at a concentration of 0.19 nM3. There are several strategies known for nanoparticle removal such as bioremediation using aquatic plants (Elodea canadensis, Najas guadelupensis, Vallisneria spiralis L., Riccia fluitans L., Limnobium laevigatum, etc.); however, this may not be applicable for all varieties of nanoparticles, along with an additional step of plant utilization [18]. AgNPs and chitosan have found applications ranging from antimicrobial agents to sensors for medical application. N/S-doped carbon-supported AgNPs showed a wide linear response for glucose in the range of 5 μM to 3000 μM, as well as a low detection limit of 0.046 mM and long-term durability of approximately 30 days [19]. Furthermore, a thiol-modified chitosan scaffold with porosity up to 99% supplied with mercaptosuccinic acid was utilized for AgNP immobilization to obtain composite sponges for preventing various wound infections generated by strains of Staphylococcus aureus, Escherichia coli, and Pseudomonas aeruginosa [20]. Another study exhibited the high efficiency of a physical hydrogel consisting of a multifunctional chitosan/carboxymethyl chitosan/silver nanoparticle polyelectrolyte composite against S. aureus and P. aeruginosa [21,22]. It is worth mentioning that the combined and synergistic effects of chitosan-impregnated CsNP/AgNP nanocomposite provided an antimicrobial effect, preventing infections caused by pathogens resistant to widely applied antibiotics [23]. An analogous study of AgNPs@chitosan and Co3O4-NPs@chitosan stabilized by Salvia hispanica revealed minimal inhibitory zones of 5 and 30 mm for Co3O4-NPs and AgNPs@chitosan against S. aureus, and 15 and 21 mm against E. coli, respectively [11]. Another study indicated the use of a dynamic Schiff base bond formation as a basis for a self-healing CHI hydrogel dressed with AgNPs, which automatically adapts to irregular wounds under natural conditions [24]. CHI-stabilized AgNPs with a spherical shape and a size distribution within 17–50 nm had an IC50 of 48 μg/mL for HepG2 cell inhibition, showing a potential use for carcinoma treatment [25]. Furthermore, extensive attention has recently been paid to biodegradable polymeric films with antimicrobial activity for food packaging applications. Films consisting of CHI and silver nanoparticles (AgNPs) stabilized using fruit waste grape seed extracts illustrated significantly reduced decay percentage and weight loss [26]. This wide range of AgNP applications has eventually contributed to environment contamination. There are limited cost-effective technologies to tackle the issue.
A 20 μg/L aqueous solution of silver nanoparticles achieved a sequestration rate of 83.0% when using chitosan support in water. In comparison, supported 2-hydroxyethylcellulose (HEC) achieved a sequestration rate of 64.0% in synthetic seawater within a 2 h period. The use of supported polymers demonstrated excellent effectiveness in sequestering ionic silver [27]. Even though Fe3O4@polydopamine nanocomposite revealed excellent results for efficient AgNP removal, the synthesis is sophisticated, and the cost of adsorbent is high [28]. PVA/gluten hybrid nanofibers exhibited an adsorptive capacity of 31.8 and 36.5 mg/g for citrate-stabilized AgNPs and AuNPs, respectively [29]. A particle suspension of activated carbon with polyethylenimine was tested for AgNP removal; nevertheless, this approach required post-treatment [30]. In spite of the great attention to the application of nanocomposite devices for water and wastewater treatment, their safety assessment is frequently overlooked. In order to transfer these research advances closer to real applications, the following issues should be addressed: more data are required on the acute and chronic toxicity of NPs; more reliable protocols for toxicity estimation of NP devices should be developed and validated; different conditions of the NP operation should be considered during risk assessment, including end of life [31]. The use of dynamic membranes for particle removal from water has some drawbacks, such as blocking of pores, an increase in back pressure following overexploitation, and the necessity of recycling.
Previously, a CHI–GA-based cryogel illustrated a maximum adsorption capacity of 160.82 mg·g−1 for Fastac 10EC pesticide removal, as well as good recyclability at room temperature [32]. The advantages of cryogels over other materials are the possibility of one-step adsorbent preparation, the efficiency of water filtration in flowthrough mode, and the cost of the process. Chitosan (CHI)- and modified chitosan-based cryogels have illustrated good adsorption properties for the removal of various heavy-metal ions and organic contaminants [33,34,35]. CHI-functionalized AgNP membranes illustrated the possibility of 85% removal of pesticide imidacloprid compared to 40% removal using chitosan based membranes [36]. AgNP/GO/chitosan nanocomposites with a particle size of 20–35 nm were adapted for the removal of Fe(III) and Cr(VI) ions, revealing a chromium adsorption capacity of 40–44 mg·g−1 [37]. Thus, Clevasol® CHI–glutaraldehyde cryogels revealed the in situ deployment of an ion exchanger with rapid uptake kinetics for radioactive elements; the uptake capacities for Cs+ and Sr2+ in groundwater simulant were 298 and 128 mg/g, respectively [38]. Nevertheless, there are limited reports about the application of macroporous adsorbents for the removal of AgNPs, metal nanoparticles, or metal oxides. Therefore, the aim of this study is to illustrate AgNP removal from an aqueous solution in different experimental settings.

2. Materials and Methods

Medium-viscosity chitosan with an 85% degree of acetylation (Mw 180 kDa), silver nitrate (AgNO3) 99.5%, and an aqueous solution of glutaraldehyde (GA) 25% v/v CAS 111-30-8 were purchased from Sigma Aldrich (Steinheim, Germany). On the other hand, 0.01 M aqueous ammonia solution (NH4OH) 5% and sodium hydroxide (NaOH) 99.8% were purchased from Merck (Darmstadt, Germany). The ethanol (70%) tincture of Calendula off. flowers was manufactured by LLP “Pharmacy 2010” (Karaganda, Kazakhstan).

2.1. Preparation of CHI–GA Cryogel

The pH of the chitosan solution (2%) with an average molecular weight of 180 kDa in 2% acetic acid was 4.1. The degree of protonation of amino groups at this pH was 90%, indicating that only 10% of the amino units were capable of engaging in reactions of nucleophilic addition. To prepare the cryogel, 10 mL of CHI (1.5% w/v) in acetic acid (2 vol.%) and 0.525 mL of GA (5 vol.%) were added and mixed to final concentrations of CHI 1.4% and GA 0.25%. The reaction mixture was frozen in polypropylene Falcon tubes (15 mL) at −15 °C in a cryostat for 3–4 h. To complete the crosslinking reaction, the CHI–GA-1 cryogel was then incubated in a freezer at −22 °C for 48 h. The samples were then thawed at room temperature, washed with distilled water, and finally washed in degassed water [38]. Cryogel CHI–GA-2 was prepared analogously. The mixture of CHI 1.4% and GA 0.25% was frozen in a freezer at −20 to −23 °C without freezing control, kept frozen over 48 h, and then thawed at 4 °C.

2.2. Characterization of AgNPs

The Malvern Zetasizer Nanoparticle Characterization System (Zetasizer 3000, Malvern Instruments, Warriewood, Australia) was used to estimate the hydrodynamic diameter of AgNPs and the zeta potential (ζ) following a standard procedure. Disposable plastic cuvettes were used to determine the size distribution, while the DIP Cell was used to measure the zeta potential. For the zeta potential measurement, five scans were performed for each sample run, and three runs were carried out. The experiment was repeated at least three times.

2.3. Cryogel Characterization

2.3.1. Scanning Electron Microscopy (SEM)

First, 1 mm thick slices of the CHI–GA cryogels were cut using a blade and washed with deionized water. Wet cryogels were frozen in the freezer for 3 h before placing them into a Christ ALPHA 2-4 freeze-dryer for 24 h. The freeze-dried samples were coated with a layer of gold using a Quorum (Q150TES) coater [39]. The sputtered samples were then examined using a JEOL JSM-5000LV scanning electron microscope.

2.3.2. Transmission Electron Microscopy (TEM)

Structural morphology analysis of AgNPs on the cryogel structure was performed using an ARM200F transmission electron microscope TEM, JEOL Ltd., Akishima, Tokyo, Japan) operated at 200 kV, analogously to a previous report [36]. Slices of cryogel with a thickness of 1 mm were obtained using a blade, with no subsequent sample preparation.

2.3.3. FTIR Spectroscopy

Freeze-dried solutions of CHI in acetic acid and CHI–GA were used without additional sample preparation, applying a Universal ATR-FTIR spectrometer (Perkin Elmer, Spectrum 650, Waltham, MA, USA). FTIR spectra were obtained in the range of 4000–650 cm−1 over 64 scans, with 2 cm−1 resolution.

2.3.4. Study of Mechanical Properties (Stress–Strain Regime and Young’s Modulus)

The stress–strain regimes and Young’s moduli of CHI–GA cryogels were determined at room temperature using a TA-XT2 instrument (Stable Micro Systems, Surrey, UK). Experimental settings included a compression rate of 0.05 mm·s−1 and a 50 mm diameter plunger at up to 35–40% sample compression. Young’s modulus was determined from the linear region of the stress–strain regime of cryogel samples at >5 % compression [38].

2.3.5. Surface Area Evaluation (Nitrogen Adsorption)

Low-temperature nitrogen adsorption analysis of cryogels was performed. CHI–GA cryogels were washed properly with water, frozen, and freeze-dried. To ensure that there was no water present during analysis, a dry cryogel sample weighing 40 + 5 mg was degassed at 100 °C overnight prior to analysis using an Autosorb-1 gas sorption analyzer from Quantachrome Instruments in the USA. The relatively low temperature of 100 °C was applied in order to avoid chemical modification of the cryogel. The nitrogen adsorption/desorption measurements were carried out at relative pressures and at a temperature of 77.4 K. Isotherm curves were analyzed using Quantachrome data analysis software. The specific surface area was estimated using the BET method; the pore size distributions of the materials were estimated using both the BJH and the DFT methods [38].

2.3.6. Thermogravimetric Analysis (TGA)

TGA of cryogels was determined using a Q500 analyzer from TA Instruments. The samples were analyzed in air during heating in gradient mode at a rate of 10 °C/min in the range of 40 to 500 °C.

2.4. AgNP Adsorption Experiments

Adsorption experiments were performed in a 12 mm × 60 mm glass column. CHI–GA cryogel with dimensions of 30 mm × 10 mm and a dry weight of 0.13–0.16 g was fitted in the column. The stock solution of AgNPs with a known concentration of 14 mg/L was fed in the column via the force of gravity; the flow rate was 0.8 mL/min under a solution pressure of 500–970 Pa.
The solution pressure of the cryogel was determined as follows:
P(Pa) = ρxhxg,
where ρ is the solution density (kg/m3), g is the acceleration due to gravity at the surface of the overlaying material, and h is the height of the liquid column.
At specific time intervals, samples were taken and analyzed using UV/Vis spectra absorbance values from the surface plasmon resonance (SPR) of AgNPs and a calibration curve, using a Beckman-Coulter DU 720 spectrophotometer (shown in Figure S10). This is a commonly used method to study the adsorption of compounds by measuring changes in optical density (OD) at a specific wavelength, which is suitable for both organic compounds and individual metalorganic complexes. A total of 700 mL of the stock solution was fed into the system over a period of 880 min; the initial pH of the AgNP suspension was 5, with no further pH adjustments made as the optimal adsorption was achieved at this pH level.

2.5. Adsorption Capacity

The adsorption capacity was calculated using the UV/Vis spectra absorbance from the peak SPR of AgNP and a calibration curve. The breakthrough curve represents the relationship between adsorbed (area above the curve) and effluent (area under the curve) species. The total mass of AgNPs in the fed solution until the breakthrough point is represented by a rectangle at points 0—breakthrough point (min) and 0—initial concentration (mg/L). Additionally, the ratio between the surface area under the breakthrough curve and the AgNP concentration was established (Figure S10).

2.6. AgNP Concentration Evaluation

The AgNP suspension was diluted using a concentrated solution of nitric acid and incubated for several hours. The Ag+ ion solutions were determined using an atomic absorption spectrophotometer (AA-6200 instrument, Shimadzu, Kyoto, Japan). These data were then used for the establishment of a correlation between the metal ion concentration and AgNP concentration determined via measurements of optical density from the peak SPR, as well as measurements of the relative SPR surface area under the peak in the range of 350–750 nm. Note that not all compounds in the plant extract participate in AgNP stabilization; therefore, the simulated wastewater contained some other organic compounds along with the AgNP suspension. However, the UV spectrum of the plant extract did not reveal any compounds with absorption in the visible spectrum. This experiment confirms the absence of interference for AgNP concentration.

2.7. Freundlich Isotherm

The Freundlich isotherm was used to model multilayer adsorption as expressed in Equation (1).
l o g q e = l o g a F + b F l o g C e q .
Numerical values of a F and b F can be found from the intercept and slope of the linear form of the plot [40]. The value of q e , maximum capacity at time t, was calculated by plugging the value of C e q (equilibrium concentration) at time t into the equation.

2.8. Langmuir Isotherm

As an alternative to the Freundlich model, the Langmuir isotherm describes a simpler adsorption mechanism. The following assumptions are made in the Langmuir model [31]:
  • The energy is uniform over the entire area.
  • Deposited molecules are inert with respect to each other.
  • Adsorbed molecules are fixed at the adsorption sites.
  • The monolayer is formed only at the point of peak adsorption.
  • The molecules of the sorbate are deposited only on the free surface of the adsorbent.
The Langmuir model is represented by Equation (2).
q e = q e , m a x b C e q 1 + b C e q .
Adsorption Capacity by Concentration
The adsorption capacity of the sorbent, q e , at time t was calculated from the difference between the initial single nanoparticle concentration in the stock solution, C 0 (mg/L), and the equilibrium concentration, C e q (mg/L), at time t, as given by Equation (3).
q e = C 0 C e q V t W ,
where Vt is the volume of the stock solution fed at a time t (L), and W is the dry mass of the cryogel (g).

2.9. Adsorption Kinetics: Pseudo-First-Order Equation

Sorption in a system of liquid and solid components is based on the capacity of the solid [41]. The linearized Equation (4) was used to model the pseudo-first-order kinetics.
log q e q t = log ( q e ) k 2.303 t ,
where q e and q t (mg·g−1) are the adsorption capacities at equilibrium and at time t, respectively, and k (min−1) is the rate constant of pseudo-first-order adsorption.
Pseudo-Second-Order Equation
The pseudo-second-order kinetic rate is expressed in Equation (5).
d q t d t = k 2 ( q e q t ) 2 .
The linear form of the pseudo-second-order equation is given by Equation (6).
t q ( t ) = 1 k 2 q e 2 + 1 q e t .
q e and k 2 can be obtained from the slope and intercept of the plot of t / q ( t ) vs. t [42].

2.10. Thomas Isotherm

The Thomas model is one of the most widely used models in describing column performance and in predicting a breakthrough curve [43]. It assumes plug flow behavior in the bed and follows the Langmuir kinetics of adsorption [44].
The suitability of the Thomas model may be explained by the assumption of negligible axial dispersion in column adsorption [45]; it considers that sorption is not limited by the chemical reaction, but is controlled by the mass transfer at the interface [46]. The linearized form of the model is given as
ln C 0 C t 1 = K T q 0 m Q K T C 0 V e f f Q ,
where K T is the Thomas rate constant (mL·min‒1·mg‒1), q 0 is the equilibrium adsorbate uptake (mg·g‒1), m is the amount of adsorbent in the column (g), C 0 is the inlet concentration (mg·L‒1), C t is the effluent concentration (mg·L‒1), Q is the flow rate (mL·min‒1), and V e f f is the effluent volume (mL).
A linear plot of ln [(Co/Ct)− 1] against time (t) can be employed to determine the values of K T and q 0 from the intercept and slope of the plot.

3. Results

3.1. Cryogel Characterization

Previously, some research has been conducted regarding the application of CHI–GA cryogel for oil recovery from an aqueous suspension. It was stated that the gel yields reached only 80% and were independent of crosslinking agent content (0.1–0.5%) for 2.0 vol.% chitosan loading [47]. In the current study, the process of AgNP removal with the help of CHI–GA cryogel was studied. The cryogel was synthesized via a condensation reaction between CHI and glutaraldehyde below the freezing point at −15 °C (cryogelation). SEM of the CHI–GA cryogel displayed a high-quality interconnected pore structure, with pore sizes ranging from 10–100 µm (Figure 1). According to the BET model of the nitrogen adsorption test, a relatively high specific surface area of 7.7 m2/g for CHI–GA-1 cryogels was detected (Figures S6–S9). The DFT and BJH models for CHI–GA cryogel proposed specific surface areas of 6.7 and 13 m2/g (Figure S9). These data correlate well with the previously reported CHI–GA 2.0 and 0.5% cryogel prepared at ‒18 °C with a surface area of 8.8 m2/g evaluated using mercury porosimetry [47].
The elasticity modulus of the CHI–GA 0.25% cryogel was equal to 543 ± 54 kPa. A large proportion of GA after cryogel preparation does not enhance the elasticity modulus, as illustrated previously, whereby CHI–GA–AuNP cryogels had an elastic modulus in the range 41–50 ± 9 kPa [39]. The CHI–GA 0.25% and CHI–GA 0.5% cryogels could withstand stress up to 0.2 N and 10 N without breaking the structure, respectively (Figure S3). The CHI–GA 0.25% cryogel obtained at ‒15 °C revealed a swelling ratio, water uptake level, and porosity parameter of 3300% ± 43%, 3200% ± 55%, and 99% ± 1.2% (Equations (S1)–(S3)), respectively.
The FTIR spectra of CHI–GA cryogels and freeze-dried CHI–HAc solution did not differ significantly in the region of 2800 to 3400 cm‒1. The shift in Schiff’s base bond overlapped with the amide II bond frequency at 1593 cm‒1 for CHI–GA (Figure S1). As expected, the amino group bond at 1634 cm‒1 disappeared in the CHI–GA cryogel due to conversion to Schiff’s base (Figure S1). A frequency appeared at 1404 cm‒1 in CHI–GA due to the methylene backbone of the crosslinking agent. The characteristic C–O–C and C–O bonds were present in all samples at 1064 and 1027 cm‒1, respectively [39].
TGA of the CHI–GA cryogel and initial chitosan was carried out. The primary degradation of pure CHI started at about 234 °C, and the CHI was completely degraded at 450 °C with a weight loss of about 78%. The reduction in Schiff’s base groups apparently affected the mechanism of oxidation of secondary amino groups compared to Schiff’s base, leading to a weight loss of 89% and a relatively lower decomposition temperature (208 °C) compared to the nonreduced base (Figure S4B). The DSC diagram of the CHI aerogel had an endothermic peak at 93 °C with a heat capacity of 229.1 J/g (50.4 °C) (Figure S5A), which was attributed to the evaporation of weakly bonded water. The Tg of CHI was 149 °C, followed by the crystallization of the amorphous fraction (Figure S5A). According to the DCS profile, the CHI–GA cryogel had less weakly bound and more strongly bound water with water evaporation at 114 °C and heat capacity of 132 J/g (74 °C). The maximum endothermic peak at 114 °C was most probably related to the dehydrogenation of the amino group intermediate with aldehyde, resulting in Schiff’s base. A moderate heating of the sample led to a destruction of the hydrogen bonds in the polymeric chains, obtaining additional flexibility and elasticity, which led to rearrangement, i.e., substitution of acetic acid into the carboxyl group of glutaraldehyde partially oxidized to glutaric acid, thus generating free acetic acid (Figure S5B). These data are in agreement with the DSC data for pure CHI–HAc, due to the absence of a possible condensation reaction (Figure S5A).

3.2. AgNP Characterization

The past decade has seen a great number of papers devoted to plant extract-stabilized AgNPs [8,9]. In order to model the water-containing AgNPs stabilized by plant extract, Calendula flowers were used as a stabilizing agent [8]. It is well known that plant extracts have different classes of compounds; therefore, the surface of AgNPs would be diversely decorated by compounds with a wide size distribution (Figure 2). The AgNPs were characterized by an average negative charge in the range of −38 ± 17 mV (Figure S2) with an average diameter of 64 nm, a polydispersity index of 0.16, and a solution conductivity of 0.12 mSm/cm3 (Figure S2). Utilization of the plant extract-stabilized AgNPs made water purification even more challenging compared to the model citrate-stabilized AgNP suspension.

3.3. AgNP Adsorption Kinetics

The kinetics of AgNPs adsorption in flowthrough mode were characterized by an increase in the SPR characteristic band (wavelengths 400–450 nm for AgNPs) over time (Figure 3). The flowrate of the suspension via the cryogel was about 0.8 mL/min.
Some research reports have indicated a reduction in AgNP concentration from 0.32–3.05 μg/L to 0.18–1.30 μg/L in the filtered influent after purification, as a result of the association of silver with organic compounds larger than 0.45 μm in size. The mechanical treatment of the suspension indicated a reduction in AgNPs in wastewater samples with an average removal efficiency of 35%, with a subsequent bioremediation treatment improving removal to 72% [3]. In the dynamic adsorption experiment, the AgNP concentration in the effluent solution started at zero and gradually increased with saturation of the CHI–GA cryogel (Figure 4A). The breakthrough curve for the CHI–GA cryogel plots effluent concentration against time (Figure 4B). The breakthrough point was chosen at the concentration of 1 mg/L (1 ppm), after which a continuous increase in the effluent concentration was observed. The point at 600 min is a proper point of reference for the efficacy analysis (Figure 4B). The standard approach of using the breakthrough curve to characterize the adsorption process was used to calculate the adsorption capacity. The area under the curve represents the amount of adsorbate in the effluent, while the area above the curve represents the amount adsorbed onto the sorbent. The graphical analysis of curves for the CHI–GA cryogels revealed that 96.5% ± 1.87% of the AgNPs were adsorbed onto the cryogel surface (Figure 4B), and the adsorption capacity was equal to 63 ± 17 mg/g. Some deviations in the adsorption capacity data were attributed to the microporous and microfluidic properties of the cryogels. Small differences in the freezing of the reaction mixture and the shape of the ice crystals can affect the microstructure of the adsorbent. It is known that, at relatively high solute concentrations, a solution can stay in a supercool state for some time. Therefore, in order to achieve better reproducibility, the freezing process must be controlled. Further research on the effect of different parameters on the micromorphology of the samples is desired.
Langmuir and Freundlich isotherms were used to model the adsorption process (Figure 5). Approximations of maximum sorption capacity, Qmax, were calculated from the model parameters (Table 1). The fitting of the Freundlich isotherm did not correlate well with the experimental data. This suggests that adsorption likely did not occur on multiple layers (Figure 5C). The Langmuir isotherm proved to be the best-fitting model for the adsorption of AgNPs onto the CHI–GA cryogel (Figure 5A). The parameters q e , m a x and b were obtained from the linearized fitting of the model. Qmax (adsorption capacity) calculated using the linear Langmuir model (47.2 mg/g) fit the breakthrough curve’s approximation (48.3 mg/g) particularly well. The R2 coefficient and alignment of the graphs were indicative of a good fit.
Langmuir nonlinear fitting was also used to model the adsorption isotherm, showing a good correlation (Figure 5B). Qmax obtained via nonlinear fit of the Langmuir model (55 mg/g) differed from the adsorption capacity approximation (48.3 mg/g) obtained from the breakthrough curve. On the other hand, correlated well with the experimental data of the adsorption isotherm, where the maximum capacity (calculated from concentration differences) reached up to 50 mg/g. The reason for such a disparity was presumed to be a slight desorption. As shown in Figure 5B, the experimental isotherm reached above 50 mg/g after the breakthrough point (Ce 1 mg/L) and then decreased over time. These data illustrate that CHI–GA cryogels had superior properties compared to previously published research. For example, the adsorption of AgNPs onto chitin/chitosan nano/micro powders indicated a maximum capacity of 26 mg/g with a mean of 2 mg/g [48]. Another study performed immobilization of AgNPs onto chitosan–PVA gel, reaching an adsorption capacity of <1 mg/g of dry gel [49]. Moreover, immobilization of AgNPs onto cellulose carbamate revealed a maximum capacity of 12 mg/g [50]. Fe3O4 NPs illustrated sphere like morphology with an average diameter of 13.0 ± 3.0 nm and then following PEI functionalization, the Fe3O4@SiO2 NPs reserved the spherical shape and the core–shell structure with an average diameter of 14.4 ± 3.0 nm indicated AgNPs adsorption capacity of 0.9g/g [51]. Nevertheless, this approach requires following filtration of nanoparticles, that may be quite expensive.
The Thomas model provides an estimate for the maximum sorption capacity of a sorbent in dynamic conditions. Previously, the Thomas model was successfully used for evaluating the adsorption capacity of CTAB-modified carboxymethyl cellulose/bagasse cryogels for the efficient removal of bisphenol A (C0 = 109 mg·L−1), as well as methylene blue and Cr(VI) ions (C0 = 66 mg·L−1) [45]. This model was also applied for APCA-functionalized chitosan clinoptilolite cryogel, illustrating a maximum heavy-metal sorption capacity of 145 mg·g−1 [33]. However, the fitting of the Thomas model correlated poorly with the linear approximation (Figure S12), which could be attributed to the difference in adsorption mechanism of AgNPs (electrostatic and chelation interactions) with respect to previous investigations (ionic interactions). It was assumed that there was a significant axial dispersion within the column, and that the adsorption was primarily of chemical origin. In this case, the mass concentration of the AgNP stock solution was found to be 16 mg/L. The slope and intercept of this plot allowed calculating the maximum adsorbate uptake, indicating an adsorption capacity of 132 mg/g (Equation (7)) (Table S1). The comparison of various methods of solutions purification from AgNPs and silver ions and adsorption capacity of the adsorbent is shown on Table 2.

3.4. AgNP Adsorption Mechanism

The adsorption experiment was carried out at pH 5.2. It is known that, in mildly acidic media, the amino groups of CHI are protonated in water, and the surface is partially positively charged [39]. The kinetics were modeled using pseudo-first- and second-order Equations (4)–(6). The pseudo-second-order model appropriately fit the data (Figure 6). Pseudo-first-order kinetics implies sorption via diffusion through the interface, which is directly proportional to the saturation concentration gradient. Pseudo-second-order kinetics assumes that the rate-limiting factor is chemisorption [54]. This is in further agreement with the assumption that the sorption is primarily chemical. The zeta potential of AgNPs was negative, and electrostatic interactions with the positively charged surface of CHI took place (Figure S2). Therefore, the mechanism of AgNP adsorption was most probably due to electrostatic interactions between oppositely charged groups (phenolic, sulfo, and carboxyl) [8]. It can be assumed that some plant extract-derived nanoparticles contain a quinone group; therefore, there was the possibility of covalent interaction between AgNPs and their surface due to Schiff base formation [8]. Furthermore, this result could be attributed to the formation of Ag–catechol bonds [55]. Moreover, the adsorption mechanism on the surface was thermodynamically favorable due to the increase in entropy. SEM and TEM analysis confirmed the adsorption of particles onto the cryogel surface (Figure 1 and Figure 2). The mechanisms of silver, palladium, and gold nanoparticle stabilization using a plant extract (CHI) were discussed in [8,39].

3.5. Effect of Flow Rate on Adsorption Efficiency

To estimate the effect of high flow rate on the filtration efficiency, an additional experiment was performed. The CHI–GA–2 cryogels obtained in a conventional freezer at −22 °C and without freezing control were studied. It is known that the moment of freezing is quite crucial for the microstructure of a material [31,38,56] due to the condensation reaction taking place; at some point, a frozen hydrogel may be formed, resulting in the formation of closed pores, which in turn results in decreases in adsorption capacity and filtration efficiency. The cryogel obtained in freezer was characterized by a significantly higher water permeability rate (10 mL/min) compared to CHI–GA–1. The AgNP removal efficiency of the CHI–GA–2 cryogel after the first, second, and third cycles of filtration was 20%, 22%, and 14%, respectively (Figure 7). The AgNP concentration in the filtrate after the third cycle of recirculation via the cryogel decreased from 24 mg/L to 13.7 mg/L. As expected, the rapid rate of filtration resulted in a decrease in adsorption capacity due to the decrease in contact time. Thus, the recommended water filtration design involves a water permeability rate of ~1 mL/min or less. To obtain reproducible material from batch to batch, other important factors should be taken into account, such as the quality of glutaraldehyde solution, as it can participate in aldol condensation and partially oxidize during storage [39].

4. Conclusions

CHI can be used to filter heavily contaminated water for agricultural or other purposes, or as an immobilization matrix for metallic particles. To address the problem of contamination with silver nanoparticles (AgNPs), a biodegradable and biocompatible adsorbent based on chitosan (CHI) cryogel was developed. Adsorption studies were conducted in columns using a stabilized suspension of AgNPs extracted from plants to control the parameters. Column adsorption allows for a controlled gradient of immobilized particles, which may be necessary for certain applications. This cryogel displayed a high affinity toward silver with excellent porosity, illustrating a pore diameter of 16 nm according to the BJH model. A significant AgNP adsorption capacity of 63 mg/g for cryogels compared to other previous studies using chitosan-based adsorbents was confirmed. Upon application of model wastewater containing 14 mg/L AgNPs under a pressure of 0.5 kPa with a flowrate of 0.8 mL/min, a removal efficiency of up to 94% was recorded. The breakthrough point and maximum capacity for CHI-GA prepared at −15 °C were found to be 82 mg/g. When the CHI–GA cryogels were synthesized without temperature control (20–23 °C), their adsorption efficiency was significantly lower compared to cryogels synthesized at −15 °C using rapid freezing. This is because the difference in preparation resulted in varying cryogel morphologies, leading to a tenfold higher flow rate and lower AgNP adsorption capacity. This indicates that CHI–GA cryogels are suitable for both AgNP adsorption and immobilization on the surface for wound-dressing applications. In the future, the effect of freezing temperature on the adsorption capacity will be evaluated.

Supplementary Materials

The following supporting information can be downloaded at https://www.mdpi.com/article/10.3390/pr11061661/s1: Figure S1. FTIR spectrum of dry samples of CHI, freeze-dried CHI–acetic acid, and CHI–GA cryogel; Figure S2. AgNPs stabilized by Calendula plant extract: (A) size distribution; (B) zeta potential; Figure S3. Compression test of cryogels (average data, n = 4): (A) CHI-GA 0.25%; (B) comparison of CHI-GA 0.5% and CHI-GA 0.25%; Figure S4. TGA of freeze-dried cryogels in an atmosphere of air: (a) CHI-GA; CHI-GA reduced by NaBH4; Figure S5. DSC diagram of freeze-dried samples: (A) solution of CHI-HAc; (B) CHI-GA cryogel; Figure S6. Isotherm of low-temperature nitrogen adsorption SBET (red) and desorption (blue) by cryogels: (A) CHI–GA 0.25%; Figures S7–S9. Low-temperature nitrogen adsorption data using BJH method for CHI–GA 0.25%; low temperature nitrogen adsorption data using DFT method for CHI–GA 0.25%; Figure S10. Calibration curve of (A) OD420 vs. concentration of AgNPs stabilized using Calendula extract, with concentration confirmed using AAS; (B) breakthrough area vs. concentration of AgNPs stabilized using Calendula extract; Figure S11: Dynamic adsorption breakthrough curve for CHI–GA cryogel with AgNP SPR absorption peak at 420 nm and a flowrate of 0.8 mL/min: (A,B) 18mg/L AgNP stock solution; (C,D) 14 mg/L AgNP stock solution.

Author Contributions

Conceptualization, D.B.; methodology, D.B. and A.A.; AgNP adsorption analysis, A.A.; adsorbent characterization, D.B. All authors have read and agreed to the published version of the manuscript.

Funding

This research was partly supported by the European Union’s Horizon 2020 Research and Innovation Program (under the Marie Skłodowska-Curie Fellowship grant agreement N 701289) 2016–2018.

Acknowledgments

The authors thank students Dusenova Alina and Peredey Ulyana from the School of Pharmacy at Asfendiyarov KazNMU for some assistance in the laboratory.

Conflicts of Interest

The authors declare no conflict of interest.

References

  1. Xing, B.; Vecitis, C.D.; Senesi, N. (Eds.) Engineered Nanoparticles and the Environment: Biophysicochemical Processes and Toxicity; John Wiley & Sons: Hoboken, NJ, USA, 2016; Volume 4. [Google Scholar]
  2. Lv, H.; Cui, S.; Yang, Q.; Song, X.; Wang, D.; Hu, J.; Zhou, Y.; Liu, Y. AgNPs-Incorporated Nanofiber Mats: Relationship between AgNPs Size/Content, Silver Release, Cytotoxicity, and Antibacterial Activity. Mater. Sci. Eng. C 2021, 118, 111331. [Google Scholar] [CrossRef] [PubMed]
  3. Liu, J.; Jiang, G. (Eds.) Silver Nanoparticles in the Environment; Springer: Heidelberg, Germany, 2015; Available online: https://www.springerprofessional.de/en/silver-nanoparticles-in-the-environment/4399802 (accessed on 18 May 2023).
  4. Kalwar, K.; Shen, M. Electrospun Cellulose Acetate Nanofibers and Au@AgNPs for Antimicrobial Activity—A Mini Review. Nanotechnol. Rev. 2019, 8, 246–257. [Google Scholar] [CrossRef]
  5. Velgosova, O.; Mudra, E.; Vojtko, M. Preparing, Characterization and Anti-Biofilm Activity of Polymer Fibers Doped by Green Synthesized AgNPs. Polymers 2021, 13, 605. [Google Scholar] [CrossRef] [PubMed]
  6. Khoshnamvand, M.; Hao, Z.; Fadare, O.O.; Hanachi, P.; Chen, Y.; Liu, J. Toxicity of Biosynthesized Silver Nanoparticles to Aquatic Organisms of Different Trophic Levels. Chemosphere 2020, 258, 127346. [Google Scholar] [CrossRef]
  7. Lapresta-Fernández, A.; Fernández, A.; Blasco, J. Nanoecotoxicity Effects of Engineered Silver and Gold Nanoparticles in Aquatic Organisms. TrAC Trends Anal. Chem. 2012, 32, 40–59. [Google Scholar] [CrossRef]
  8. Zhangabay, Z.; Berillo, D. Antimicrobial and antioxidant activity of AgNPs stabilized with Calendula officinalis flower extract. Results Surf. Interfaces 2023, 11, 100109. [Google Scholar] [CrossRef]
  9. Balachandar, R.; Navaneethan, R.; Biruntha, M.; Ashok Kumar, K.K.; Govarthanan, M.; Karmegam, N. Antibacterial Activity of Silver Nanoparticles Phytosynthesized from Glochidion Candolleanum Leaves. Mater. Lett. 2022, 311, 131572. [Google Scholar] [CrossRef]
  10. Cohen, M.S.; Stern, J.M.; Vanni, A.J.; Kelley, R.S.; Baumgart, E.; Field, D.; Libertino, J.A.; Summerhayes, I.C. In Vitro Analysis of a Nanocrystalline Silver-Coated Surgical Mesh. Surg. Infect. 2007, 8, 397–404. [Google Scholar] [CrossRef]
  11. Kiani, M.; Rabiee, N.; Bagherzadeh, M.; Ghadiri, A.M.; Fatahi, Y.; Dinarvand, R.; Webster, T.J. Improved green biosynthesis of chitosan decorated Ag-and Co3O4-nanoparticles: A relationship between surface morphology, photocatalytic and biomedical applications. Nanomed. Nanotechnol. Biol. Med. 2021, 32, 102331. [Google Scholar] [CrossRef]
  12. Consumer Products Inventory. Available online: https://www.nanotechproject.tech/cpi/browse/nanomaterials/silver-nanoparticle/ (accessed on 18 May 2023).
  13. Wen, L.-S.; Santschi, P.H.; Gill, G.A.; Paternostro, C.L.; Lehman, R.D. Colloidal and Particulate Silver in River and Estuarine Waters of Texas. Environ. Sci. Technol. 1997, 31, 723–731. [Google Scholar] [CrossRef]
  14. Gomez-Caballero, J.A.; Villasenor-Cabral, M.G.; Santiago-Jacinto, P.; Ponce-Abad, F. hypogene Ba rich todokite and associated nanometric native silver in the San Miguel Tenango mining area, Zacatlan, Puebla, Mexico. Can. Mineral. 2010, 48, 1237–1253. [Google Scholar] [CrossRef]
  15. Yin, Y.; Liu, J.; Jiang, G. Sunlight-Induced Reduction of Ionic Ag and Au to Metallic Nanoparticles by Dissolved Organic Matter. ACS Nano 2012, 6, 7910–7919. [Google Scholar] [CrossRef]
  16. Silver: Supply and Demand. Available online: https://www.silverinstitute.org/silver-supply-demand/ (accessed on 18 May 2023).
  17. Syafiuddin, A.; Salmiati, S.; Hadibarata, T.; Kueh, A.B.H.; Salim, M.R.; Zaini, M.A.A. Silver Nanoparticles in the Water Environment in Malaysia: Inspection, Characterization, Removal, Modeling, and Future Perspective. Sci. Rep. 2018, 8, 986. [Google Scholar] [CrossRef]
  18. Olkhovych, O.; Svietlova, N.; Konotop, Y.; Karaushu, O.; Hrechishkina, S. Removal of metal nanoparticles colloidal solutions by water plants. Nanoscale Res. Lett. 2016, 11, 518. [Google Scholar] [CrossRef]
  19. Khalaf, N.; Ahamad, T.; Naushad, M.; Al-Hokbany, N.; Al-Saeedi, S.I.; Almotairi, S.; Alshehri, S.M. Chitosan polymer complex derived nanocomposite (AgNPs/NSC) for electrochemical non-enzymatic glucose sensor. Int. J. Biol. Macromol. 2020, 146, 763–772. [Google Scholar] [CrossRef]
  20. Wu, Z.; Zhou, W.; Deng, W.; Xu, C.; Cai, Y.; Wang, X. Antibacterial and hemostatic thiol-modified chitosan-immobilized AgNPs composite sponges. ACS Appl. Mater. Interfaces 2020, 12, 20307–20320. [Google Scholar] [CrossRef]
  21. Yang, J.; Chen, Y.; Zhao, L.; Feng, Z.; Peng, K.; Wei, A.; Wang, Y.; Tong, Z.; Cheng, B. Preparation of a chitosan/carboxymethyl chitosan/AgNPs polyelectrolyte composite physical hydrogel with self-healing ability, antibacterial properties, and good biosafety simultaneously, and its application as a wound dressing. Compos. Part B Eng. 2020, 197, 108139. [Google Scholar] [CrossRef]
  22. Jiang, Y.; Huang, J.; Wu, X.; Ren, Y.; Li, Z.; Ren, J. Controlled release of silver ions from AgNPs using a hydrogel based on konjac glucomannan and chitosan for infected wounds. Int. J. Biol. Macromol. 2020, 149, 148–157. [Google Scholar] [CrossRef]
  23. Polinarski, M.A.; Beal, A.L.; Silva, F.E.; Bernardi-Wenzel, J.; Burin, G.R.; de Muniz, G.I.; Alves, H.J. New Perspectives of Using Chitosan, Silver, and Chitosan–Silver Nanoparticles against Multidrug-Resistant Bacteria. Part. Part. Syst. Charact. 2021, 38, 2100009. [Google Scholar] [CrossRef]
  24. Wang, Y.; Xie, R.; Li, Q.; Dai, F.; Lan, G.; Shang, S.; Lu, F. A self-adapting hydrogel based on chitosan/oxidized konjac glucomannan/AgNPs for repairing irregular wounds. Biomater. Sci. 2020, 8, 1910–1922. [Google Scholar] [CrossRef]
  25. Priya, K.; Vijayakumar, M.; Janani, B. Chitosan-mediated synthesis of biogenic silver nanoparticles (AgNPs), nanoparticle characterisation and in vitro assessment of anticancer activity in human hepatocellular carcinoma HepG2 cells. Int. J. Biol. Macromol. 2020, 149, 844–852. [Google Scholar] [CrossRef] [PubMed]
  26. Zhao, X.; Tian, R.; Zhou, J.; Liu, Y. Multifunctional chitosan/grape seed extract/silver nanoparticle composite for food packaging application. Int. J. Biol. Macromol. 2022, 207, 152–160. [Google Scholar] [CrossRef] [PubMed]
  27. Kibeche, A.; Dionne, A.; Brion-Roby, R.; Gagnon, C.; Gagnon, J. Simple and green technique for sequestration and concentration of silver nanoparticles by polysaccharides immobilized on glass beads in aqueous media. Chem. Cent. J. 2015, 9, 1. [Google Scholar] [CrossRef] [PubMed]
  28. Wu, M.; Li, Y.; Yue, R.; Zhang, X.; Huang, Y. Removal of silver nanoparticles by mussel-inspired Fe3O4@ polydopamine core-shell microspheres and its use as efficient catalyst for methylene blue reduction. Sci. Rep. 2017, 7, 1–9. [Google Scholar] [CrossRef]
  29. Dhandayuthapani, B.; Mallampati, R.; Sriramulu, D.; Dsouza, R.F.; Valiyaveettil, S. PVA/gluten hybrid nanofibers for removal of nanoparticles from water. ACS Sustain. Chem. Eng. 2014, 2, 1014–1021. [Google Scholar] [CrossRef]
  30. Kumar, J.; Mallampati, R.; Adin, A.; Valiyaveettil, S. Functionalized carbon spheres for extraction of nanoparticles and catalyst support in water. ACS Sustain. Chem. Eng. 2014, 2, 2675–2682. [Google Scholar] [CrossRef]
  31. Savina, I.N.; Otero-Gonzalez, L.; Berillo, D. Macroporous Cryogel-Based Systems for Water Treatment Applications and Safety: Nanocomposite-Based Cryogels and Bacteria-Based Bioreactors. In Biomedical Applications and Toxicity of Nanomaterials; Mohanan, P.V., Kappalli, S., Eds.; Springer: Singapore, 2023. [Google Scholar] [CrossRef]
  32. Dinu, I.A.; Ghimici, L.; Raschip, I.E. Macroporous 3D Chitosan Cryogels for Fastac 10EC Pesticide Adsorption and Antibacterial Applications. Polymers 2022, 14, 3145. [Google Scholar] [CrossRef]
  33. Dinu, M.V.; Humelnicu, I.; Ghiorghita, C.A.; Humelnicu, D. Aminopolycarboxylic Acids-Functionalized Chitosan-Based Composite Cryogels as Valuable Heavy Metal Ions Sorbents: Fixed-Bed Column Studies and Theoretical Analysis. Gels 2022, 8, 221. [Google Scholar] [CrossRef]
  34. Yin, M.; Li, X.; Liu, Y.; Ren, X. Functional Chitosan/Glycidyl Methacrylate-Based Cryogels for Efficient Removal of Cationic and Anionic Dyes and Antibacterial Applications. Carbohydr. Polym. 2021, 266, 118129. [Google Scholar] [CrossRef]
  35. Bratskaya, S.; Privar, Y.; Slobodyuk, A.; Shashura, D.; Marinin, D.; Mironenko, A.; Zheleznov, V.; Pestov, A. Cryogels of Carboxyalkylchitosans as a Universal Platform for the Fabrication of Composite Materials. Carbohydr. Polym. 2019, 209, 1–9. [Google Scholar] [CrossRef]
  36. Moustafa, M.; Abu-Saied, M.; Taha, T.; Elnouby, M.; El-Shafeey, M.; Alshehri, A.G.; Alamri, S.; Shati, A.; Alrumman, S.; Alghamdii, H.; et al. Chitosan functionalized AgNPs for efficient removal of Imidacloprid pesticide through a pressure-free design. Int. J. Biol. Macromol. 2021, 168, 116–123. [Google Scholar] [CrossRef]
  37. El Shahawy, A.; Mubarak, M.F.; El Shafie, M.; Abdulla, H.M. Fe (III) and Cr (VI) ions’ removal using AgNPs/GO/chitosan nanocomposite as an adsorbent for wastewater treatment. RSC Adv. 2022, 12, 17065–17084. [Google Scholar] [CrossRef]
  38. Chaplin, J.D.; Berillo, D.; Purkis, J.M.; Byrne, M.L.; Tribolet, A.D.C.C.M.; Warwick, P.E.; Cundy, A.B. Effective 137Cs+ and 90Sr2+ Immobilisation from Groundwater by Inorganic Polymer Resin Clevasol® Embedded within a Macroporous Cryogel Host Matrix. Mater. Today Sustain. 2022, 19, 100190. [Google Scholar] [CrossRef]
  39. Berillo, D. Gold Nanoparticles Incorporated into Cryogel Walls for Efficient Nitrophenol Conversion. J. Clean. Prod. 2020, 247, 119089. [Google Scholar] [CrossRef]
  40. VanLoon, G.W.; Duffy, S.J. Environmental Chemistry: A Global Perspective, 3rd ed.; Oxford University Press: Oxford, NY, USA, 2011. [Google Scholar]
  41. Yuh-Shan, H. Citation Review of Lagergren Kinetic Rate Equation on Adsorption Reactions. Scientometrics 2004, 59, 171–177. [Google Scholar] [CrossRef]
  42. Gerente, C.; Lee, V.K.C.; Cloirec, P.L.; McKay, G. Application of Chitosan for the Removal of Metals from Wastewaters by Adsorption—Mechanisms and Models Review. Crit. Rev. Environ. Sci. Technol. 2007, 37, 41–127. [Google Scholar] [CrossRef]
  43. Thomas, H.C. Heterogeneous ion exchange in a flowing system. J. Am. Chem. Soc. 1944, 66, 1664–1666. [Google Scholar] [CrossRef]
  44. Futalan, C.M.; Kan, C.C.; Dalida, M.L.; Pascua, C.; Wan, M.W. Fixed-bed column studies on the removal of copper using chitosan immobilized on bentonite. Carbohydr. Polym. 2011, 83, 697–704. [Google Scholar] [CrossRef]
  45. Meneses, I.P.; Novaes, S.D.; Dezotti, R.S.; Oliveira, P.V.; Petri, D.F.S. CTAB-modified carboxymethyl cellulose/bagasse cryogels for the efficient removal of bisphenol A, methylene blue and Cr (VI) ions: Batch and column adsorption studies. J. Hazard. Mater. 2022, 421, 126804. [Google Scholar] [CrossRef]
  46. Chowdhury, Z.Z.; Zain, S.M.; Rashid, A.K.; Rafique, R.F.; Khalid, K. Breakthrough Curve Analysis for Column Dynamics Sorption of Mn(II) Ions from Wastewater by Using Mangostana garcinia Peel-Based Granular-Activated Carbon. J. Chem. 2013, 2013, 959761. [Google Scholar] [CrossRef]
  47. Gao, C.; Wang, Y.; Shi, J.; Wang, Y.; Huang, X.; Chen, X.; Chen, Z.; Xie, Y.; Yang, Y. Superamphiphilic Chitosan Cryogels for Continuous Flow Separation of Oil-In-Water Emulsions. ACS Omega 2022, 7, 5937–5945. [Google Scholar] [CrossRef] [PubMed]
  48. Ishihara, M.; Nguyen, V.; Mori, Y.; Nakamura, S.; Hattori, H. Adsorption of Silver Nanoparticles onto Different Surface Structures of Chitin/Chitosan and Correlations with Antimicrobial Activities. Int. J. Mol. Sci. 2015, 16, 13973–13988. [Google Scholar] [CrossRef] [PubMed]
  49. Agnihotri, S.; Mukherji, S.; Mukherji, S. Antimicrobial Chitosan–PVA Hydrogel as a Nanoreactor and Immobilizing Matrix for Silver Nanoparticles. Appl. Nanosci. 2012, 2, 179–188. [Google Scholar] [CrossRef]
  50. Bundjaja, V.; Santoso, S.P.; Angkawijaya, A.E.; Yuliana, M.; Soetaredjo, F.E.; Ismadji, S.; Ayucitra, A.; Gunarto, C.; Ju, Y.-H.; Ho, M.-H. Fabrication of Cellulose Carbamate Hydrogel-Dressing with Rarasaponin Surfactant for Enhancing Adsorption of Silver Nanoparticles and Antibacterial Activity. Mater. Sci. Eng. C 2021, 118, 111542. [Google Scholar] [CrossRef]
  51. Zhang, X.; Zhang, Y.; Zhang, X.; Li, S.; Huang, Y. Nitrogen rich core–shell magnetic mesoporous silica as an effective adsorbent for removal of silver nanoparticles from water. J. Hazard. Mater. 2017, 337, 1–9. [Google Scholar] [CrossRef] [PubMed]
  52. Yaychi, R.F.; Manteghian, M. Investigation of effect of electric field on silver nanoparticles in order to separation of them from aqueous medium using electrocoagulation process. Sep. Purif. Technol. 2018, 193, 155–164. [Google Scholar] [CrossRef]
  53. Sousa, V.S.; Teixeira, M.R. Silver nanoparticles separation from the water using nanofiltration membranes: The role of mono-divalent salts and NOM. Sep. Purif. Technol. 2015, 149, 165–173. [Google Scholar] [CrossRef]
  54. Wan Ngah, W.S.; Ariff, N.F.M.; Hanafiah, M.A.K.M. Preparation, characterization, and environmental application of crosslinked chitosan-coated bentonite for tartrazine adsorption from aqueous solutions. Water Air Soil Pollut. 2010, 206, 225–236. [Google Scholar] [CrossRef]
  55. Lin, Y.; Chen, C.; Wang, C.; Pu, F.; Ren, J.; Qu, X. Silver nanoprobe for sensitive and selective colorimetric detection of dopamine via robust Ag-catechol interaction. Chem. Commun. 2011, 47, 1181–1183. [Google Scholar] [CrossRef]
  56. Berillo, D.A.; Savina, I.N. Cryogels with Noble Metal Nanoparticles as Catalyst for “Green” Decomposition of Chlorophenols. Inorganics 2023, 11, 23. [Google Scholar] [CrossRef]
Figure 1. (A) Photo of CHI–GA cryogels before adsorption process; (B) experimental setup of the flowthrough AgNP filtration process; (C) CHI–GA cryogels after adsorption process. SEM images of the CHI–GA-1 cryogel prepared at −15 °C at different magnifications: (D) before filtration 200×; (E) before filtration 1000×, (F) after filtration 200×; (G) after filtration 1000×.
Processes 11 01661 g001
Figure 2. TEM images of the CHI–GA-1 cryogel: (AF) after adsorption study at different magnifications.
Processes 11 01661 g002
Figure 3. Monitoring of water filtration process by UV/Vis spectroscopy of the filtrate containing AgNPs after passing through the CHI–GA-1 cryogel (0.136 mg dry weight) at a water permeability rate of 0.8 mL/min over time. Arrow indicate spectra of samples from 1st, 2nd, 3rd to the last sample.
Processes 11 01661 g003
Figure 4. Dynamic adsorption breakthrough curve for CHI–GA-1 cryogel at a flowrate of 0.8 mL/min AgNP stock solution: (A) SPR absorption; (B) graphical calculation of areas performed using Inkscape v 1.1. Blue area indicates purified water and red area is attributed to trace concentration of AgNPs after filtration process.
Processes 11 01661 g004
Figure 5. Different AgNP adsorption isotherms for CHI–GA-1 cryogel: (A) linear Langmuir; (B) nonlinear Langmuir; (C) nonlinear Freundlich.
Processes 11 01661 g005
Figure 6. AgNP adsorption kinetics for CHI–GA–1 cryogels: (A) pseudo-first-order model; (B) pseudo-second-order model.
Processes 11 01661 g006
Figure 7. Change in UV/Vis of spectra of the filtrate containing AgNPs after passing through the CHI–GA-2 cryogel (2 g wet weight) at a flowrate of 10 ± 2 mL/ min. Concentration of AgNP stock suspension: 24 mg/L; first cycle—120 mL of AgNP suspension passed via cryogel; second cycle—120 mL of AgNP suspension after first cycle passed via cryogel; third cycle—120 mL of AgNP suspension after second cycle passed via cryogel; fourth cycle—120 mL of AgNP suspension after third cycle passed via cryogel; fifth cycle—120 mL of AgNP suspension after fourth cycle passed via cryogel. Arrow indicate UV-vis spectra of samples after filtration from 1st, 2nd, 3rd to the last sample.
Processes 11 01661 g007
Table 1. Various adsorption isotherm parameters for CHI–GA–1 cryogel.
Langmuir LinearLangmuir Non-LinearFreundlich
q e , m a x b R 2 q e , m a x KL R 2 nKF R 2
47.255.4410.92553.33980.9514.51137.41250.934
Table 2. Comparative analysis of AgNP removal methods.
Type of AgNPsRemoval Efficiency or Adsorption CapacityMethodReference
Negatively charged sodium citrate AgNPs, neutral AgNPs, and polyvinylpyrrolidone AgNPs99.91%in the solElectrocoagulation process in electric field for 90 min[52]
AgNPs not specified92% of AgNPs and Ag+ released from NPsSeparation from water using nanofiltration membranes[53]
Negatively charged gum arabic-capped AgNPsEquilibrium of sorption process for Fe3O4@PDA at about 26 h with capacity for AgNPs of 169.5 mg/gFe3O4@polydopamine nanocomposite[28]
Citrate-stabilized AgNPs and AuNPsAdsorption capacity of 31.8 and 36.5 mg/gPVA/gluten hybrid nanofibers, filtration[29]
In situ immobilized AgNPsLoading capacity of 1 mg/gChitosan–PVA gel for antimicrobial purposes[49]
AgNPs not specified Mechanical treatment of AgNPs led to a decrease in wastewater samples with an average removal efficiency of 35%, with a subsequent bioremediation treatment increasing removal to 72%[3]
Glucose-stabilized
negatively charged AgNPs
Adsorption capacity of 2.2–26 mg/gChitin/chitosan nano/micro powders
10–31 μm, batch experiment
[48]
Plant-stabilized negatively charged AgNPsAdsorption capacity of 48.3 mg/g with 94% efficiencyRapid filtration via cryogel at flowrate of 0.8 mL/min Current study
Disclaimer/Publisher’s Note: The statements, opinions and data contained in all publications are solely those of the individual author(s) and contributor(s) and not of MDPI and/or the editor(s). MDPI and/or the editor(s) disclaim responsibility for any injury to people or property resulting from any ideas, methods, instructions or products referred to in the content.

