

Performance Evaluation of Ingenious Crow Search Optimization Algorithm for Protein Structure Prediction

 , , and
Abstract
:1. Introduction
- The protein folding problem has been discussed, and the problem is formulated by keeping the AB-off lattice model in consideration.
- An application of the newly proposed ICSA has been explored on a predefined bench of mathematical functions and proteins, and evaluation of the algorithm has been conducted.
- A meaningful comparison between the performance of various crow search variants and crow search itself has been conducted on the basis of statistical attribute analysis, box plot analysis and execution time analysis.
2. Problem Formulation
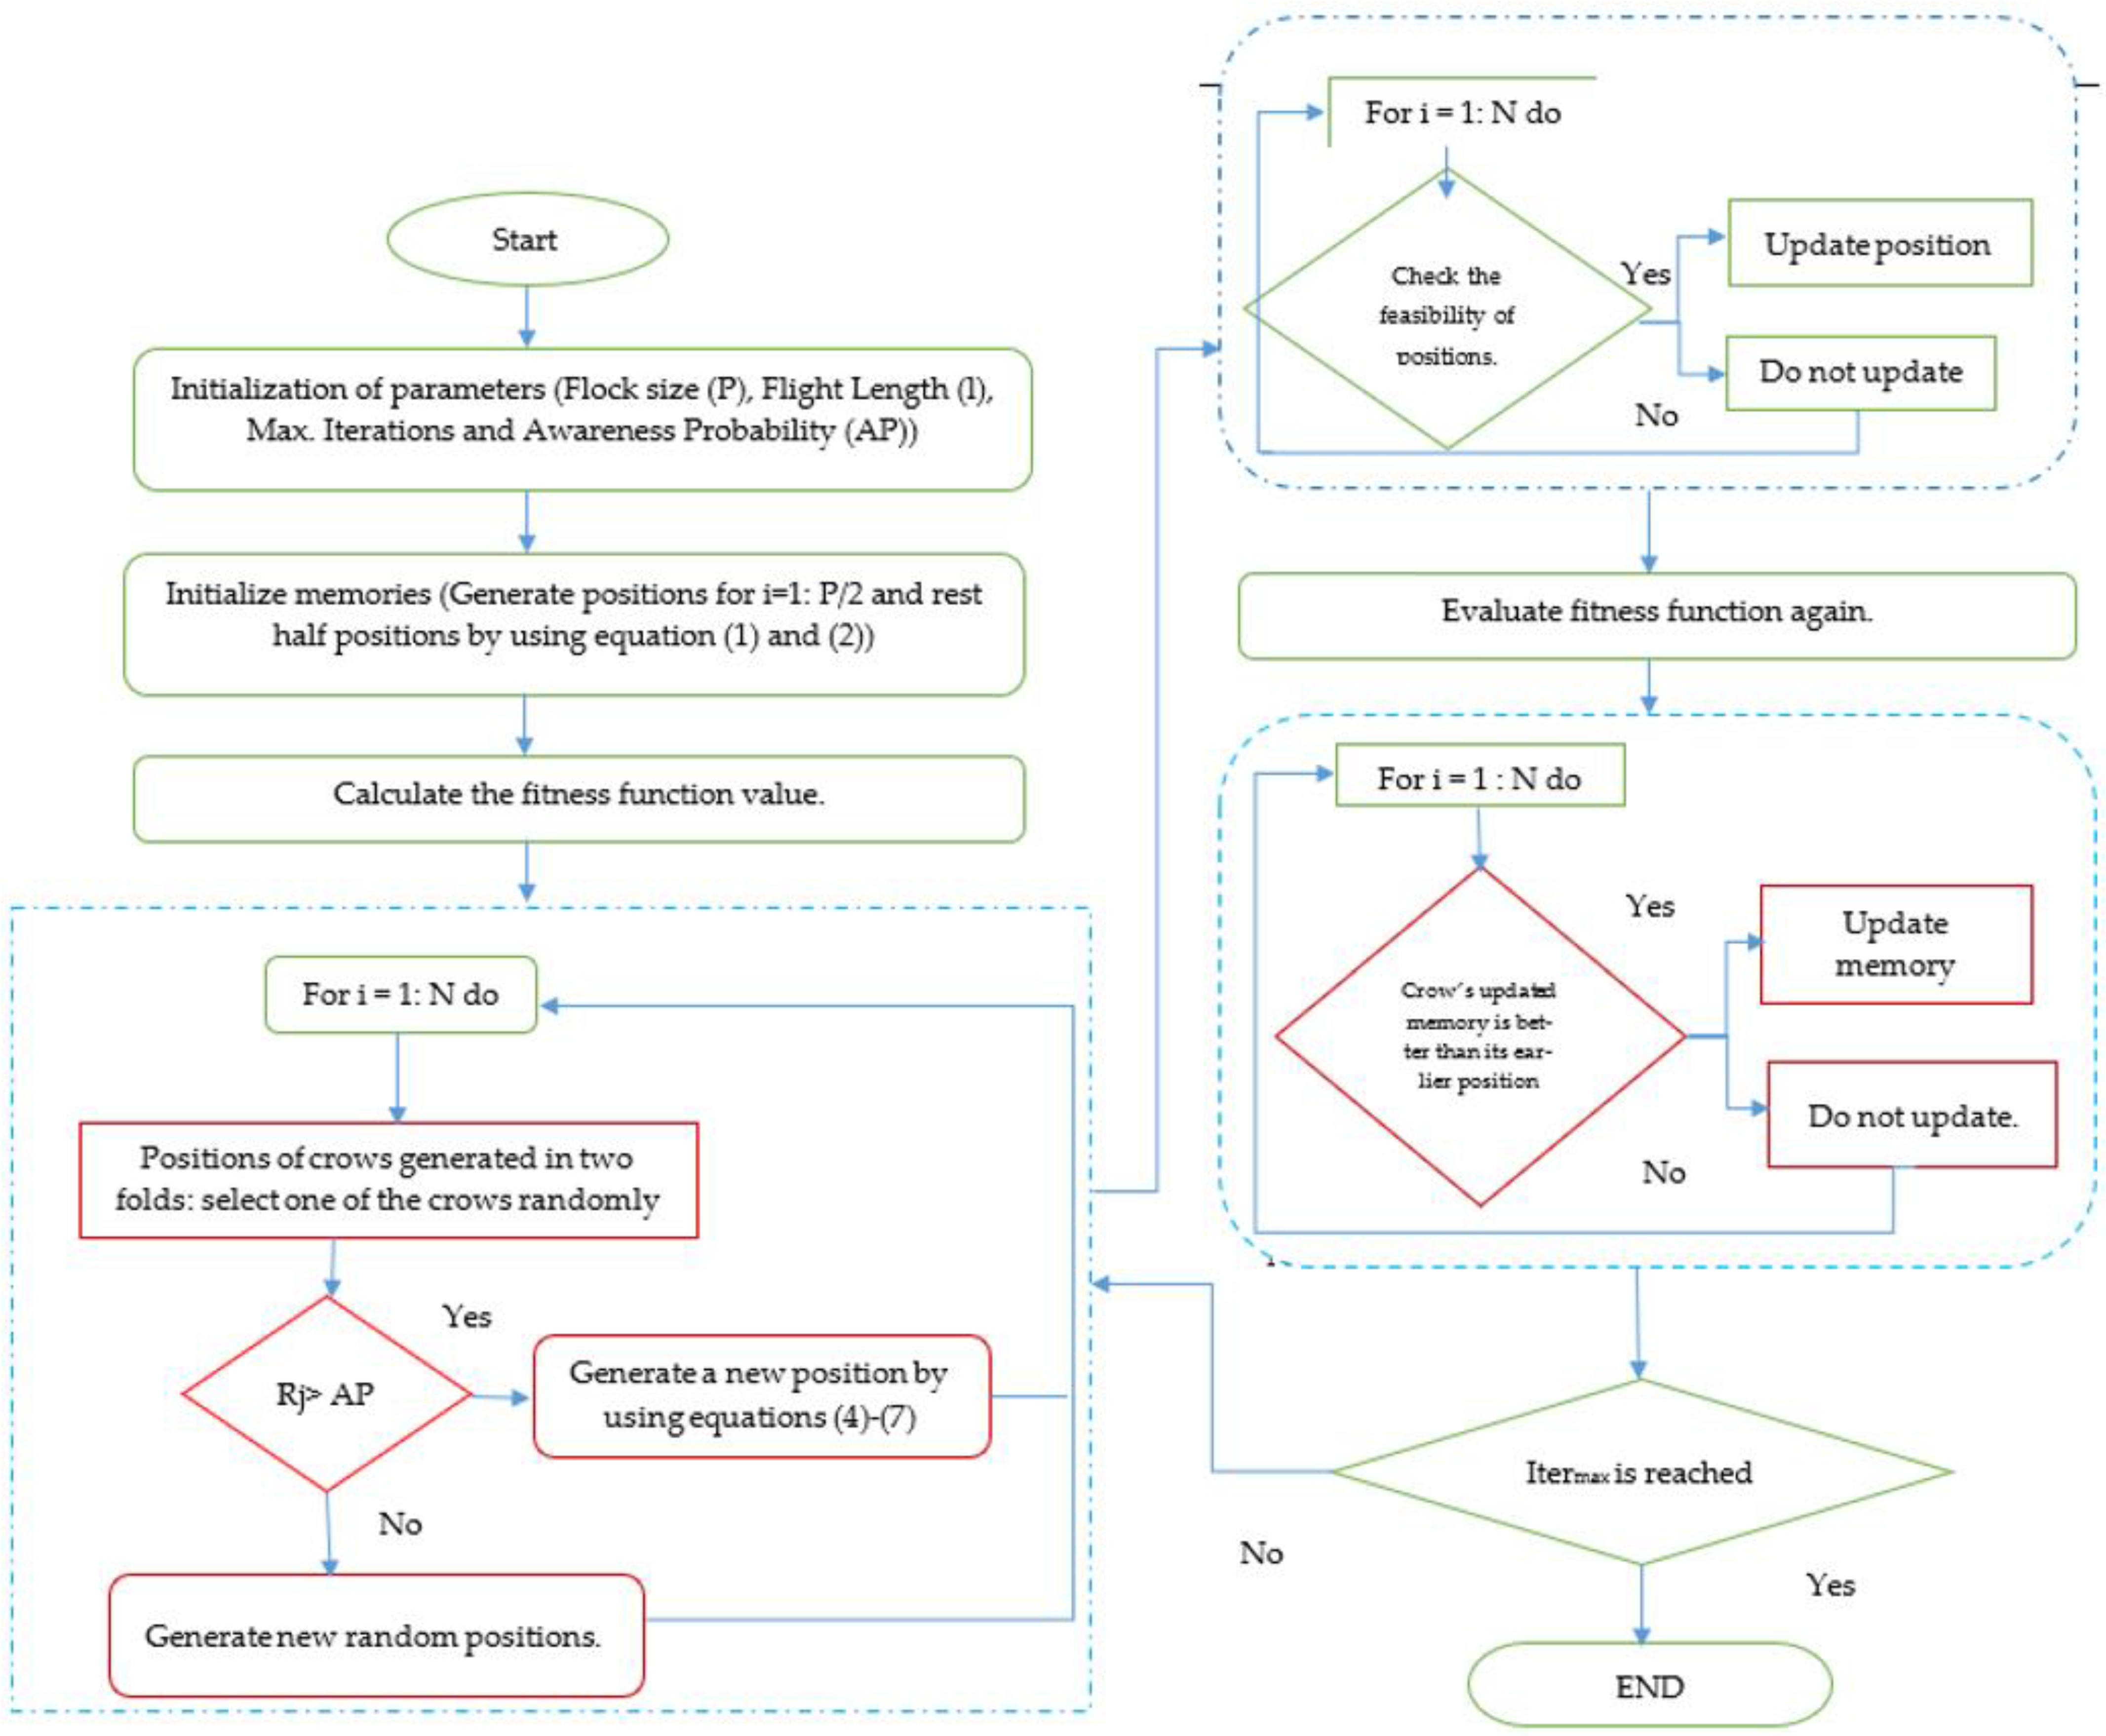
3. Ingenious Crow Search Algorithm
- The first is opposition-based learning, which is used in the initialization phase, when the crows generate their positions. Out of the total crows, half of the crows generate their position randomly, and the remaining half generate it according to the following definition.
- 2.
- The second modification is an acceleration factor based on exponential function, which acts as a bridging mechanism between the exploration and exploitation stages of the optimization process. In comparison with a linear function, a cosine function provides better results as it has a high gradient in the exploration stage, which means that it explores a bigger area which helps in finding the solution. Later on, when the gradient is low, the area shrunk during the second half and led to the avoidance of local minima trapping. This acceleration factor can be given mathematically as
- For implementing any real-life optimization problem, the designer requires the identification of variable composition. In this structure prediction problem, we have to calculate the dimension of the variables as per the sequence length. Hence, the dimension of the solution string is calculated as per size of the sequence.
- As it is a known fact that the folding can be conducted between [−180,180], the upper and lower bounds of the variables have been assigned as per these boundary conditions. From this, it can be observed that the initialization of the number of crows along with their research directions can be finalized with the help of sequence size and range of bend angles.
- For further implementation of the algorithm, the energy function has been evaluated with every iteration of the ICSA, and the values of memory as well fitness function are stacked in an array. Then, the optimal values are retained, and further processing in order to improve the solution quality has been started with the help of the position update equation.
4. Simulation and Results
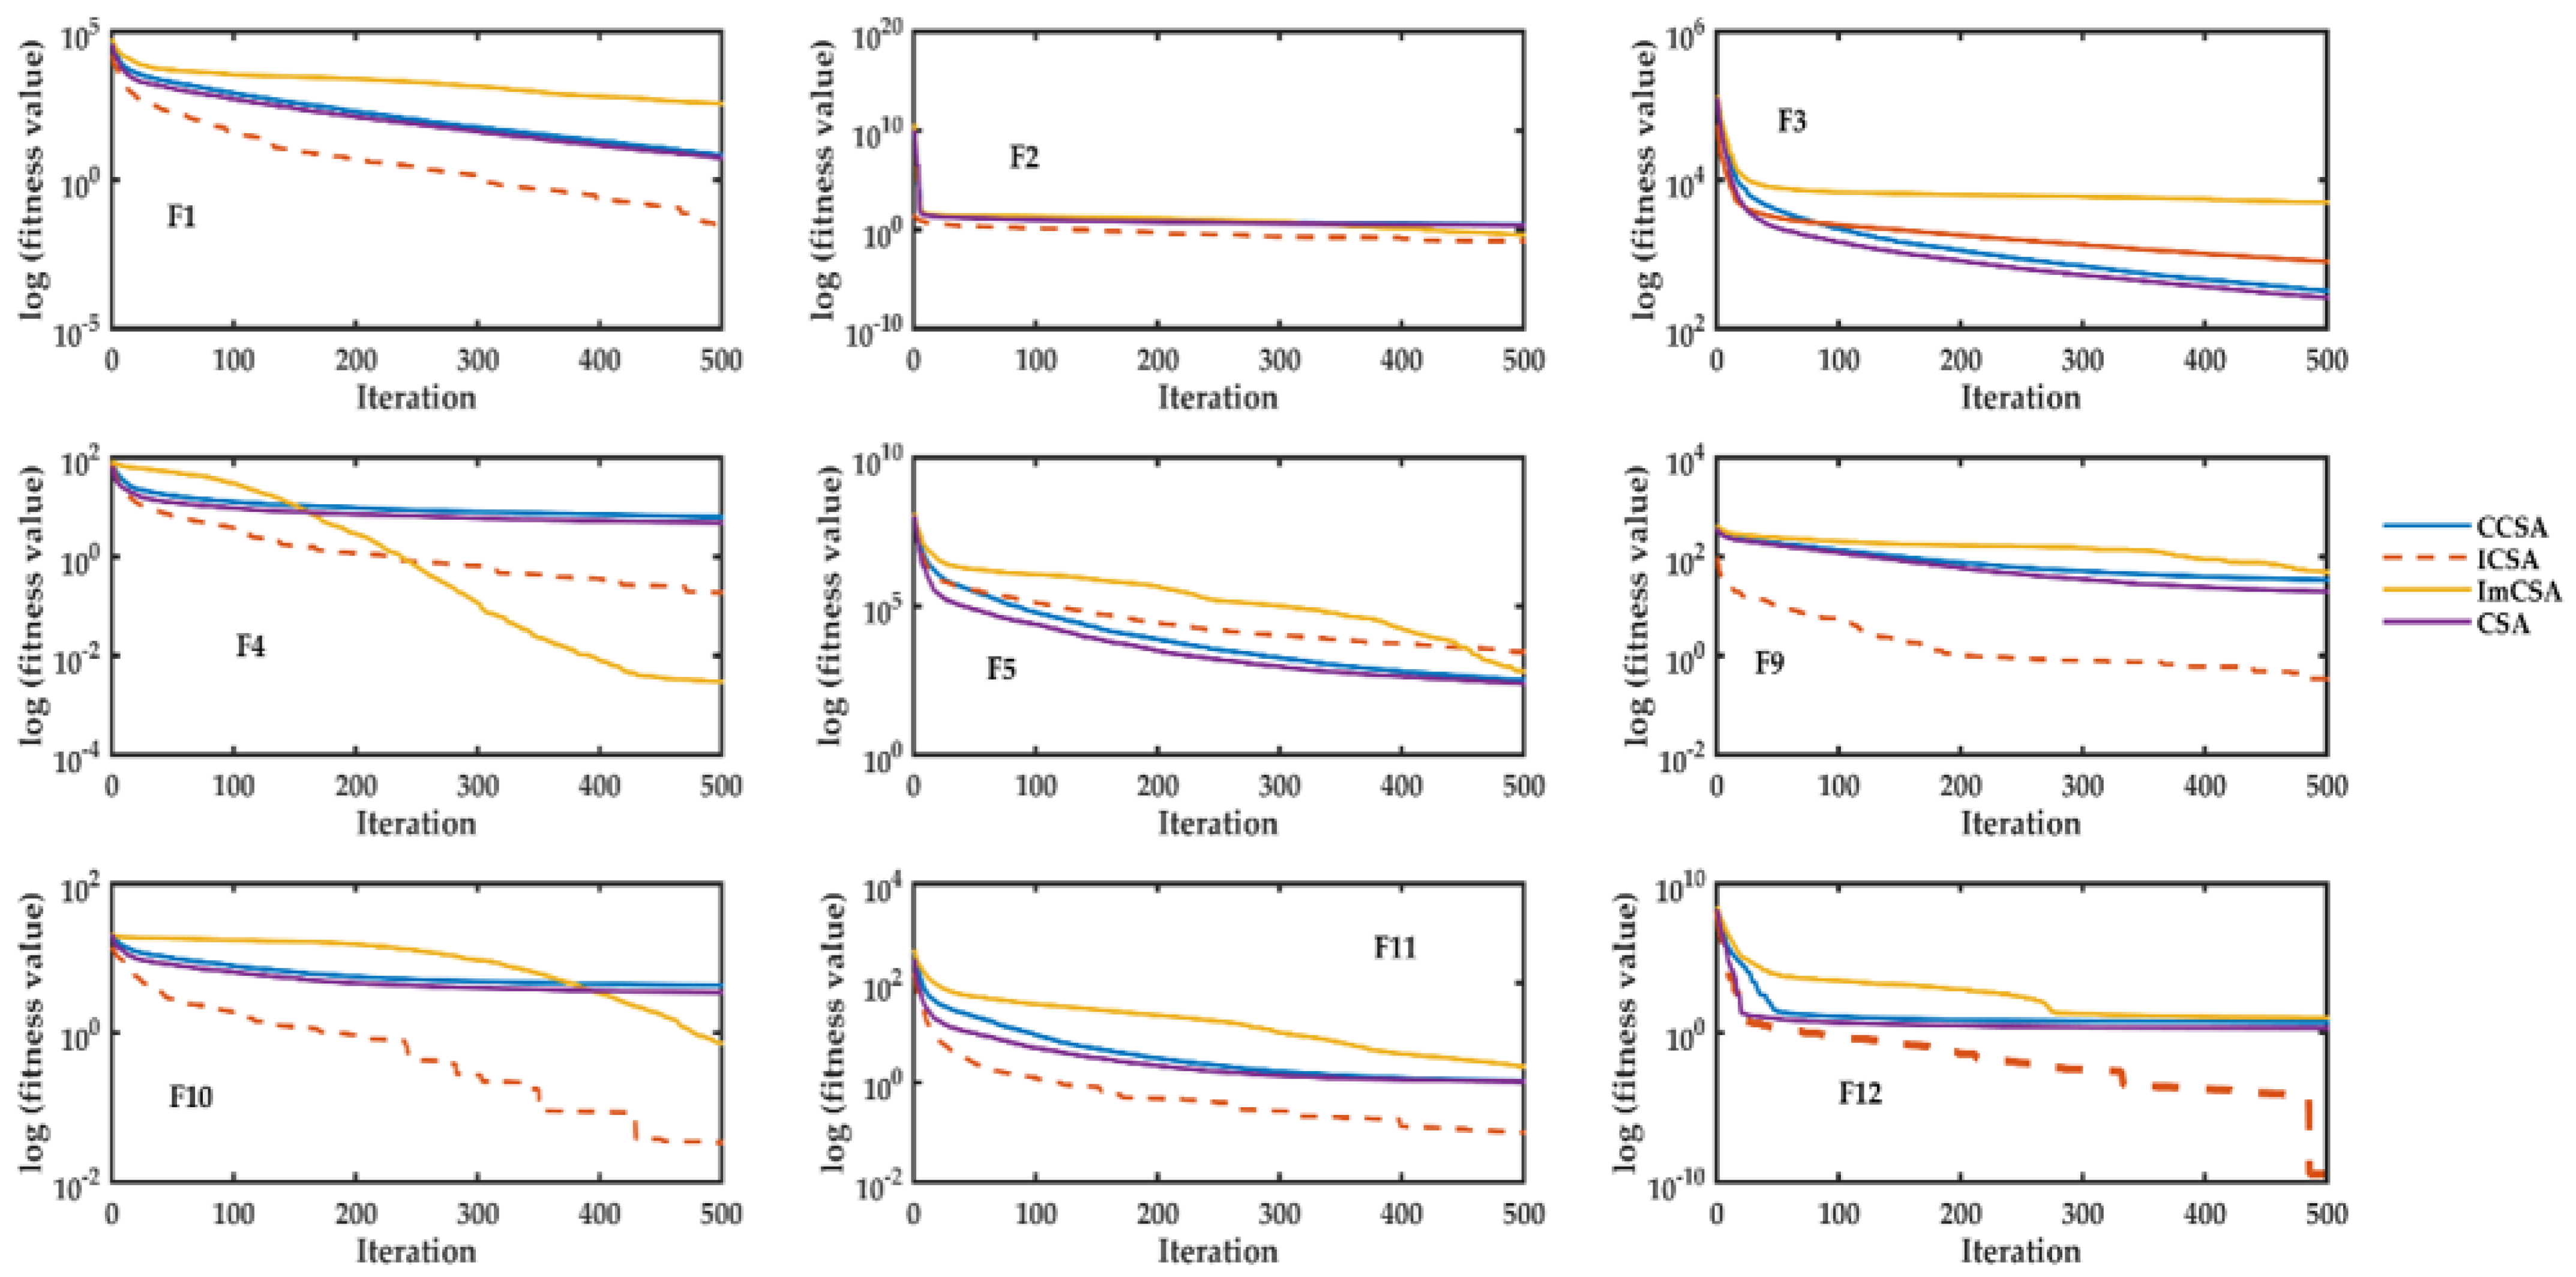
4.1. Evaluation of ICSA on Conventional Benchmark Functions
- Mean of the fitness values obtained from 20 independent runs.
- Maximum fitness values obtained from 20 independent runs (Worst value as minimization is performed).
- Minimum fitness values obtained from 20 independent runs (Best value as minimization is performed).
- Standard Deviation of the fitness values obtained from 20 independent runs.
- From this table, it has been observed that for unimodal functions (F1–F7), the ICSA is performs well and the proposed exponential function-based mechanism helps the algorithm in convergence. Unimodal functions are those functions that possess only one minimum in a given search space. Hence, it can be concluded that the proposed exponential-driven mechanism helps the algorithm to find the minima very efficiently and helps the algorithm in convergence.
- In addition, in a few of multimodal functions, such as F8 to F12, the performance is not compromised. Hence, it can be observed that the exploration and exploitation virtues of the ICSA have been enhanced with the inculcation of opposition-based learning and the proposed exponential-driven function. The results of standard deviation and their optimal values for the ICSA have been showcased in boldface and depict the superior quality of the optimization by the proposed ICSA. The proposed mechanisms help the ICSA to avoid local minima stagnation and provide a big leap in the position updation phase (due to exponential function).
4.2. Application of ICSA to Protein Structure Prediction
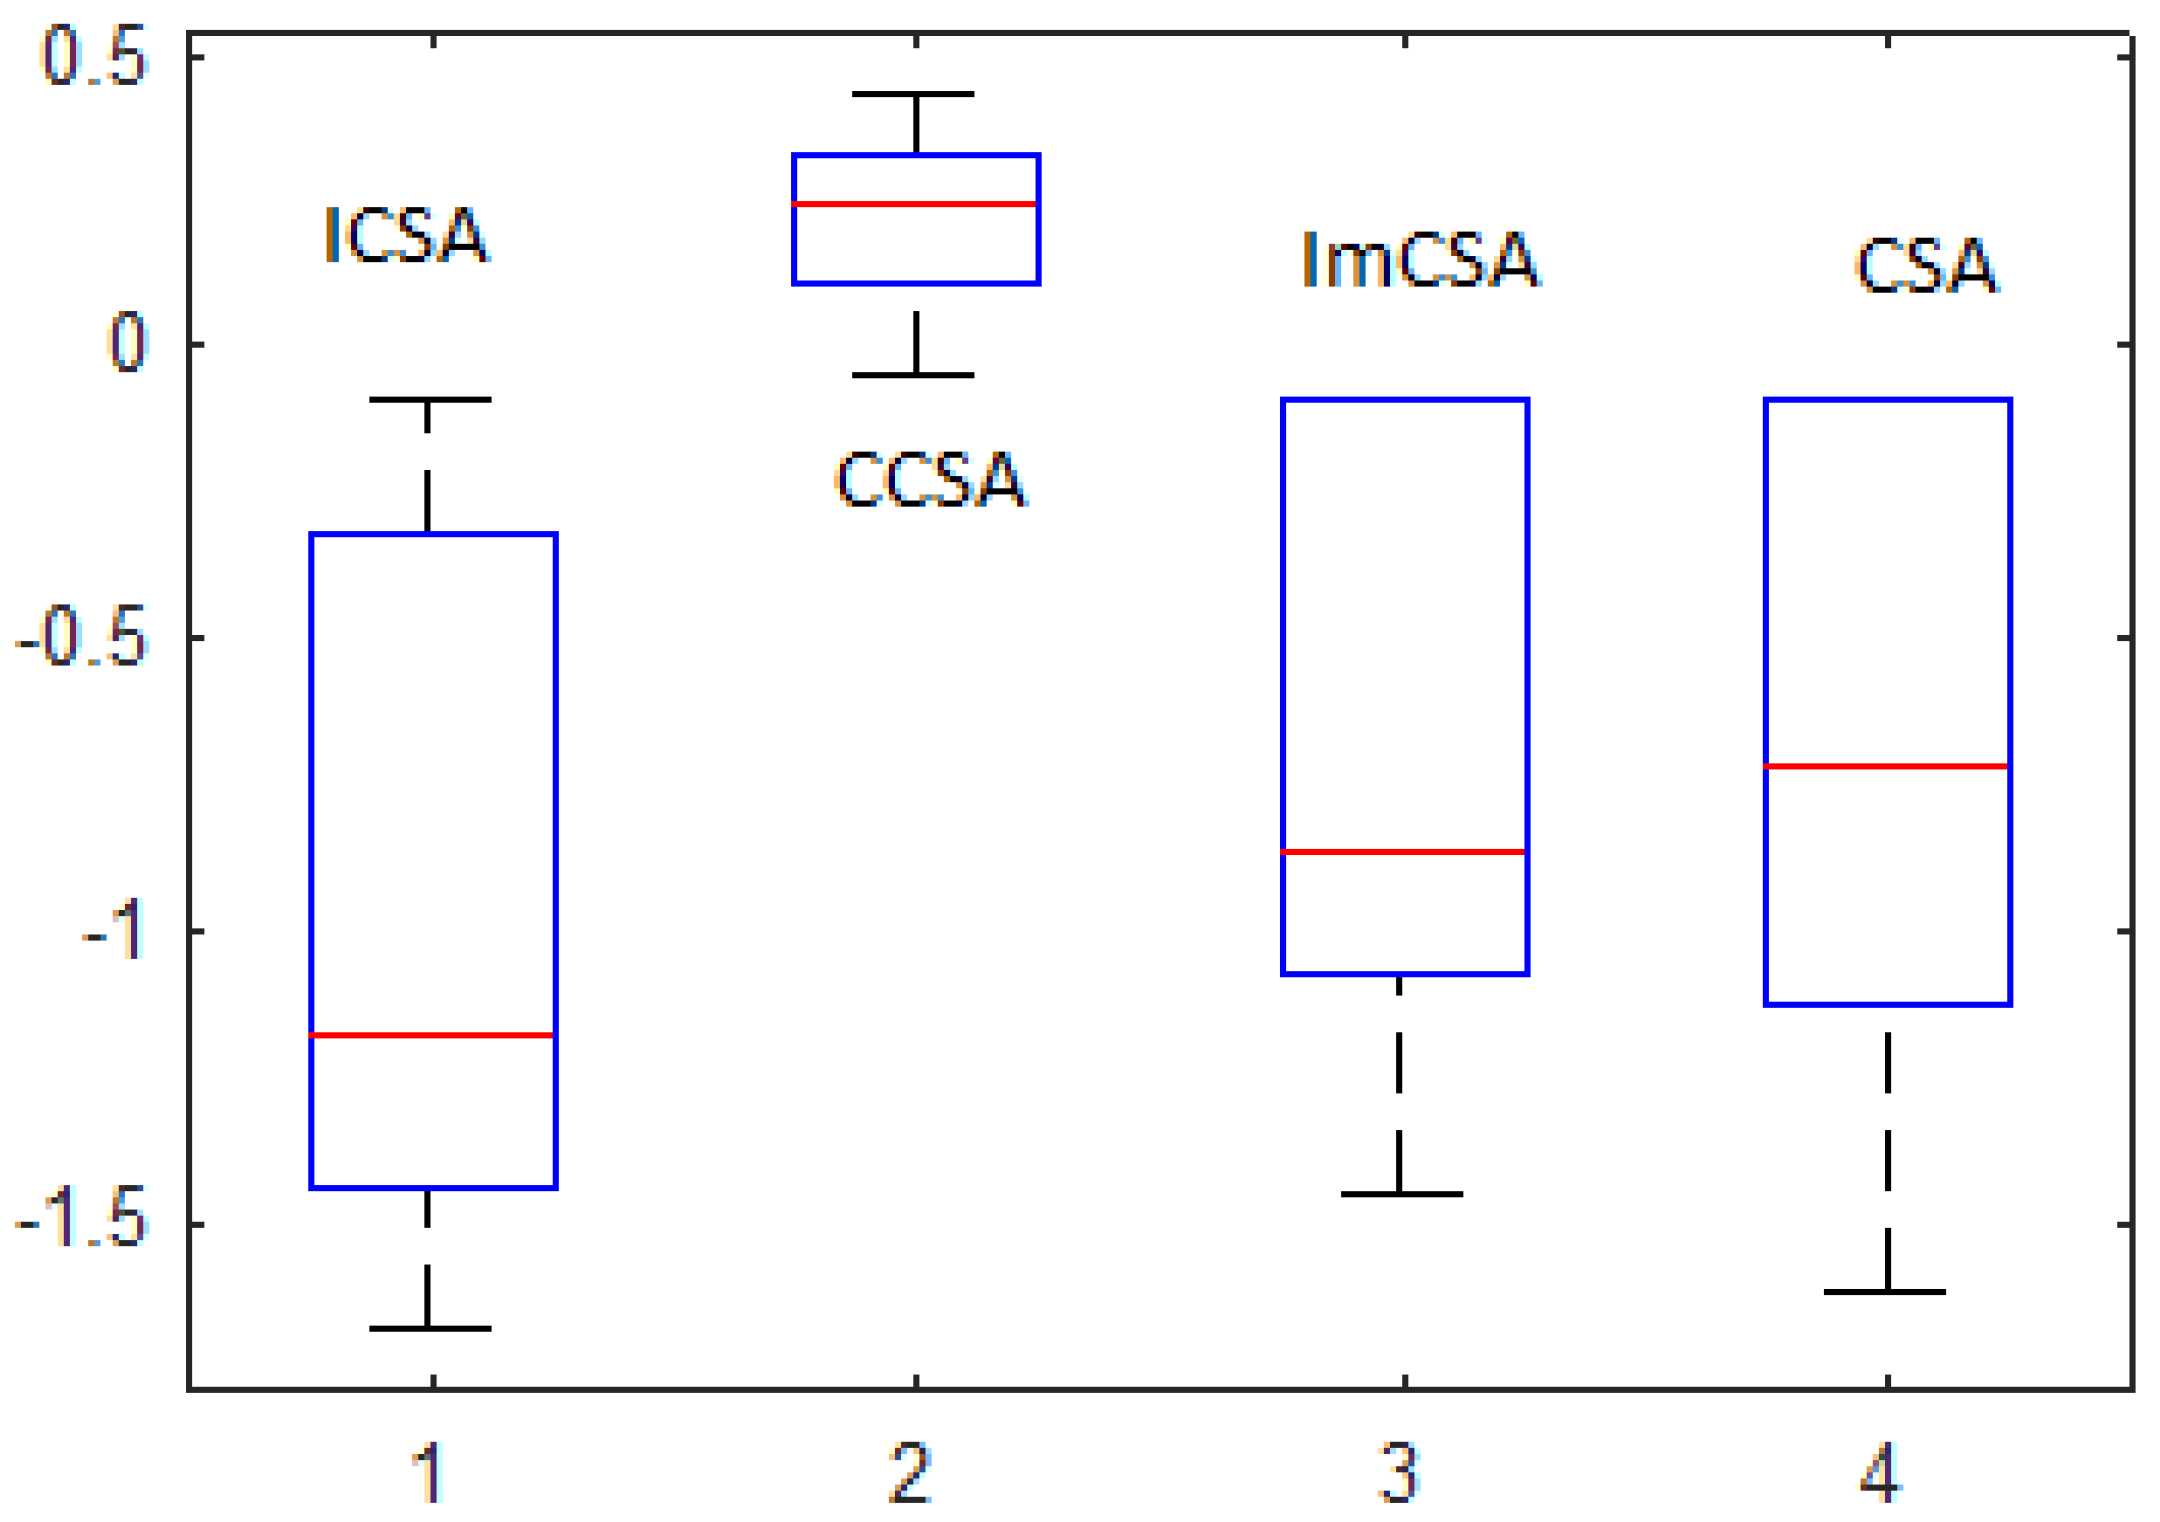
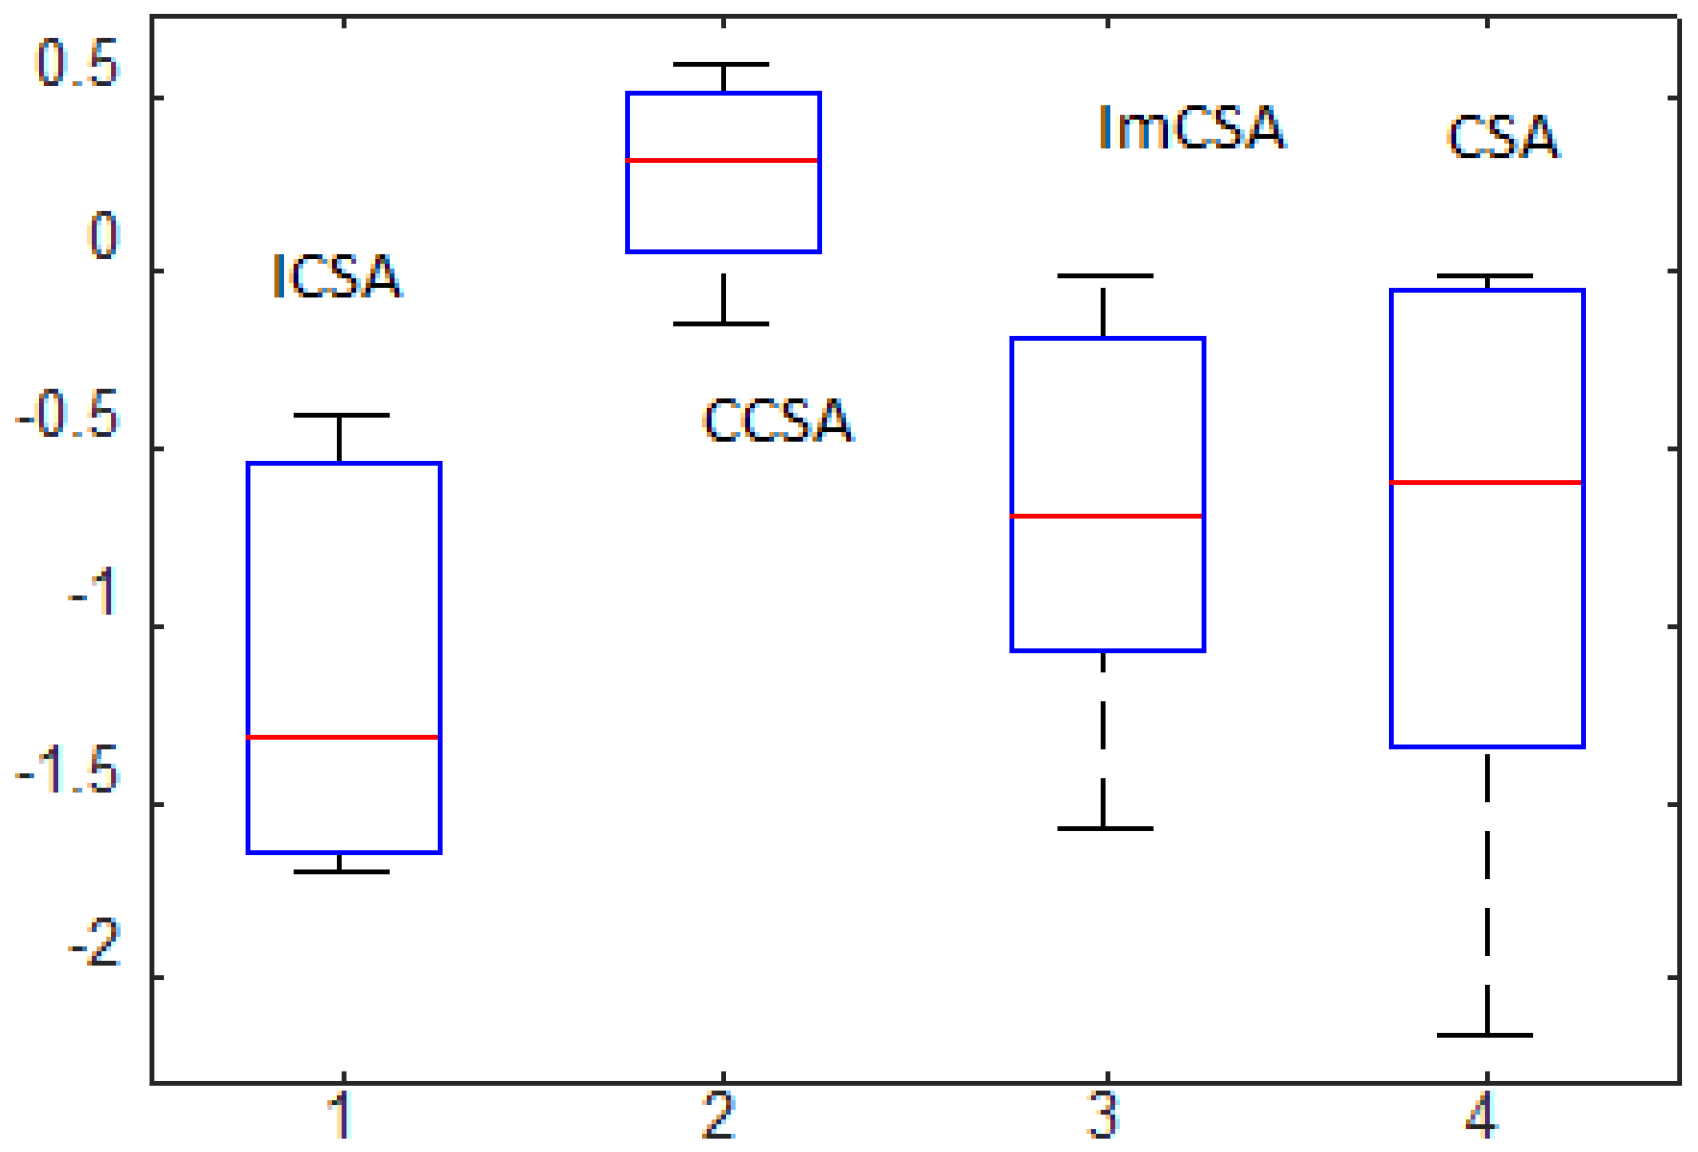
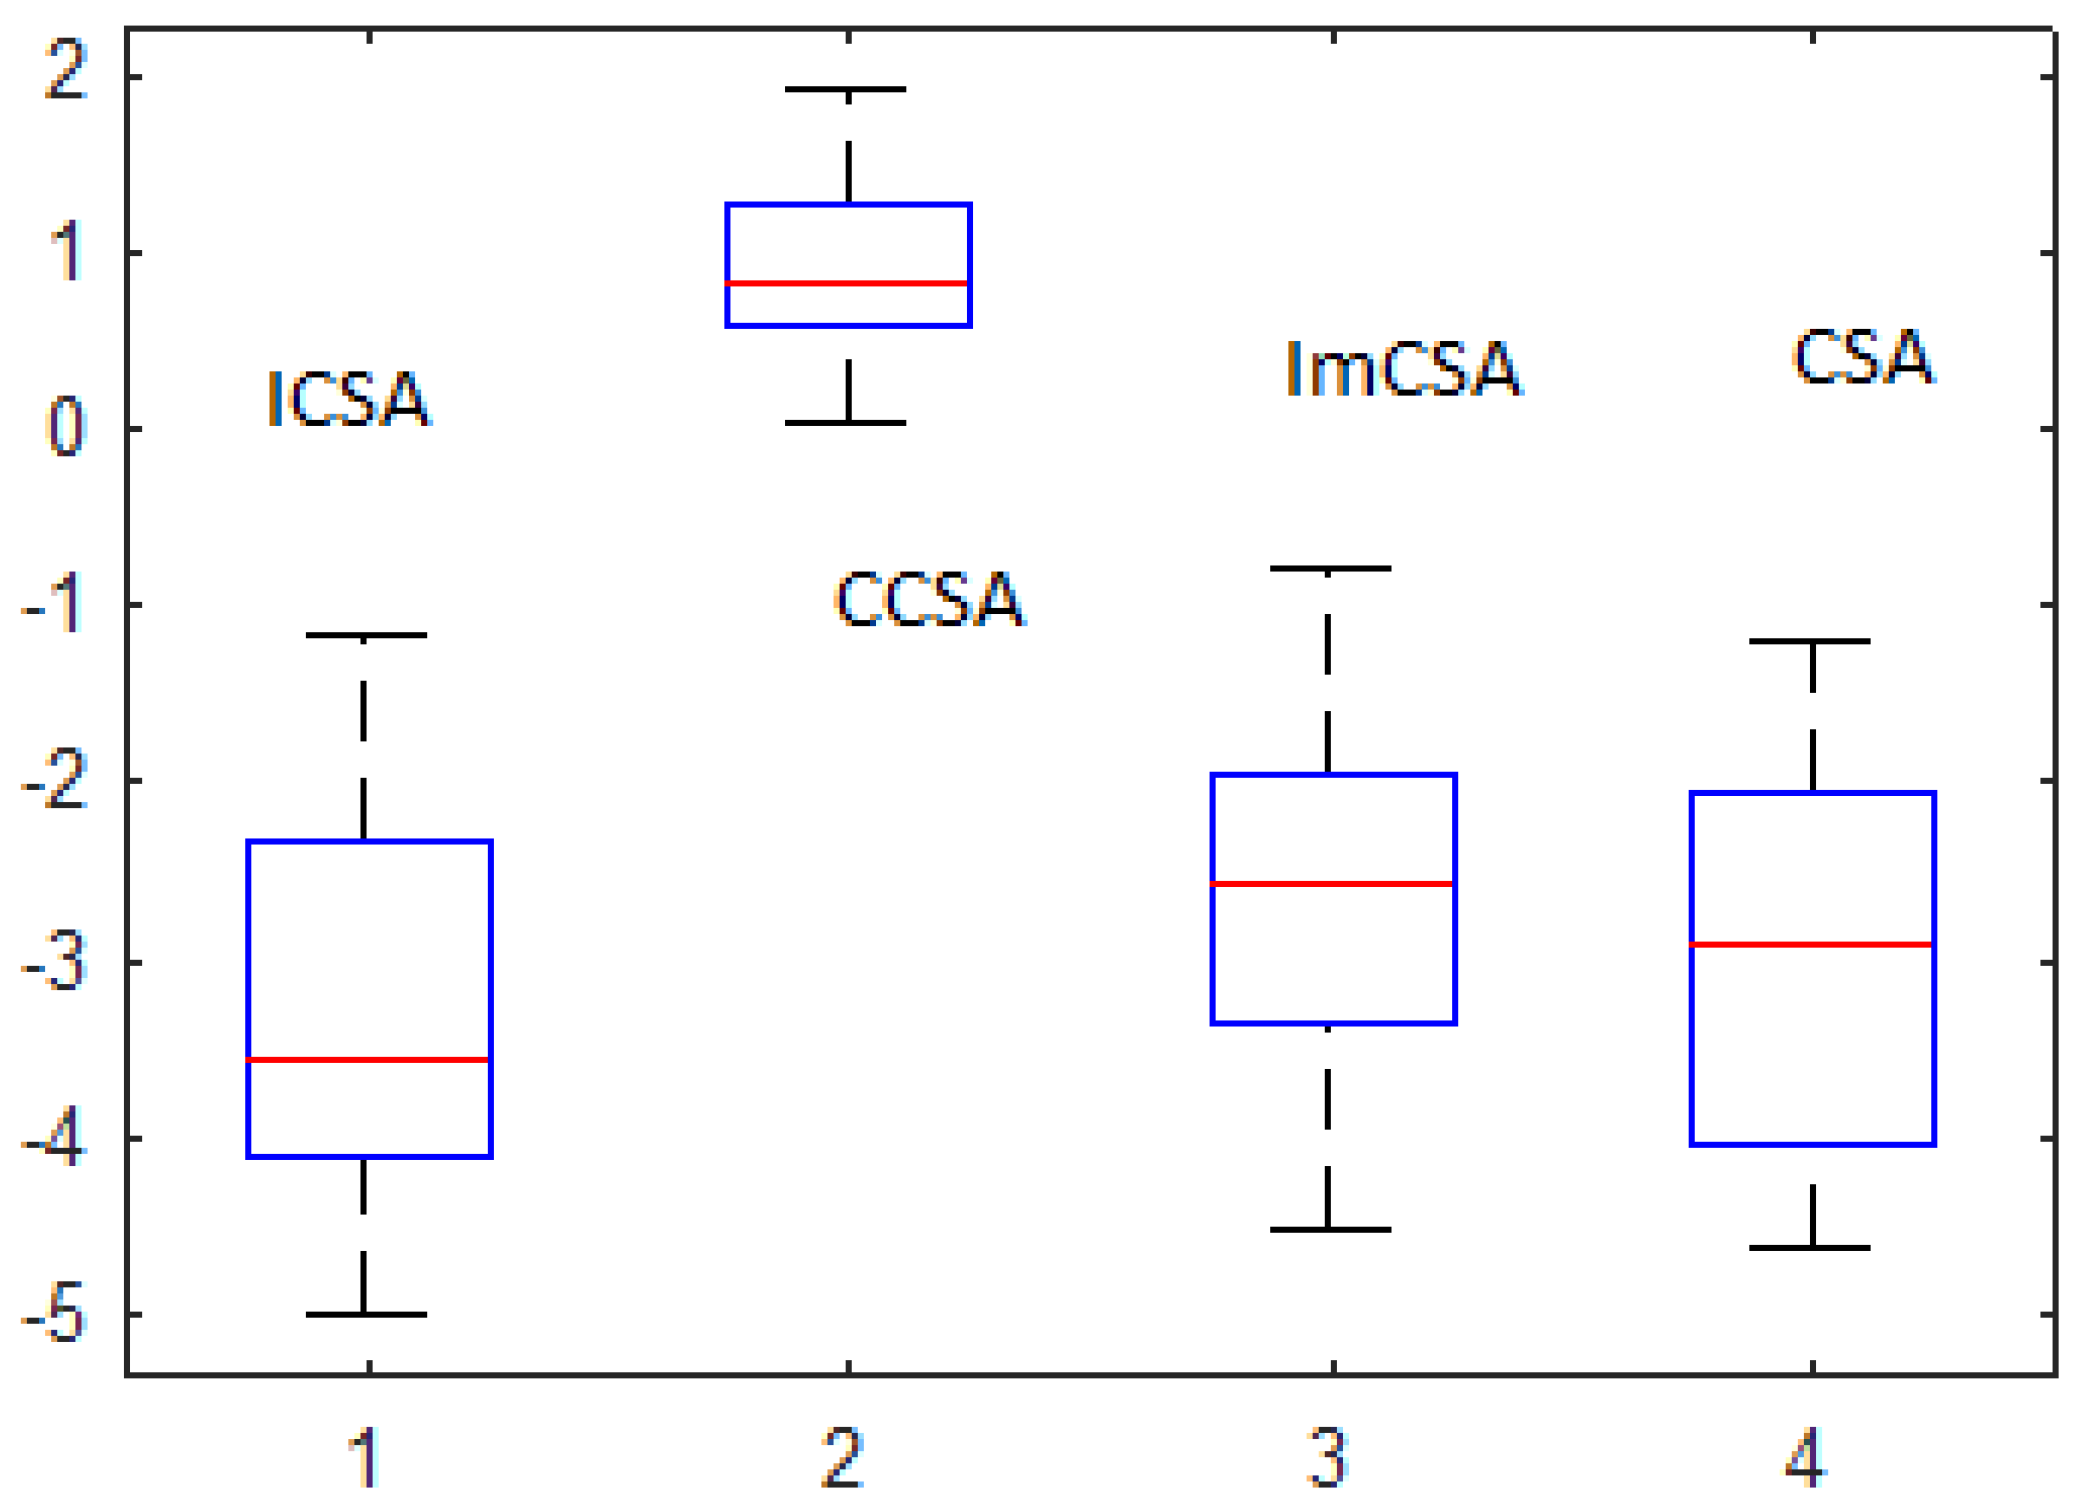
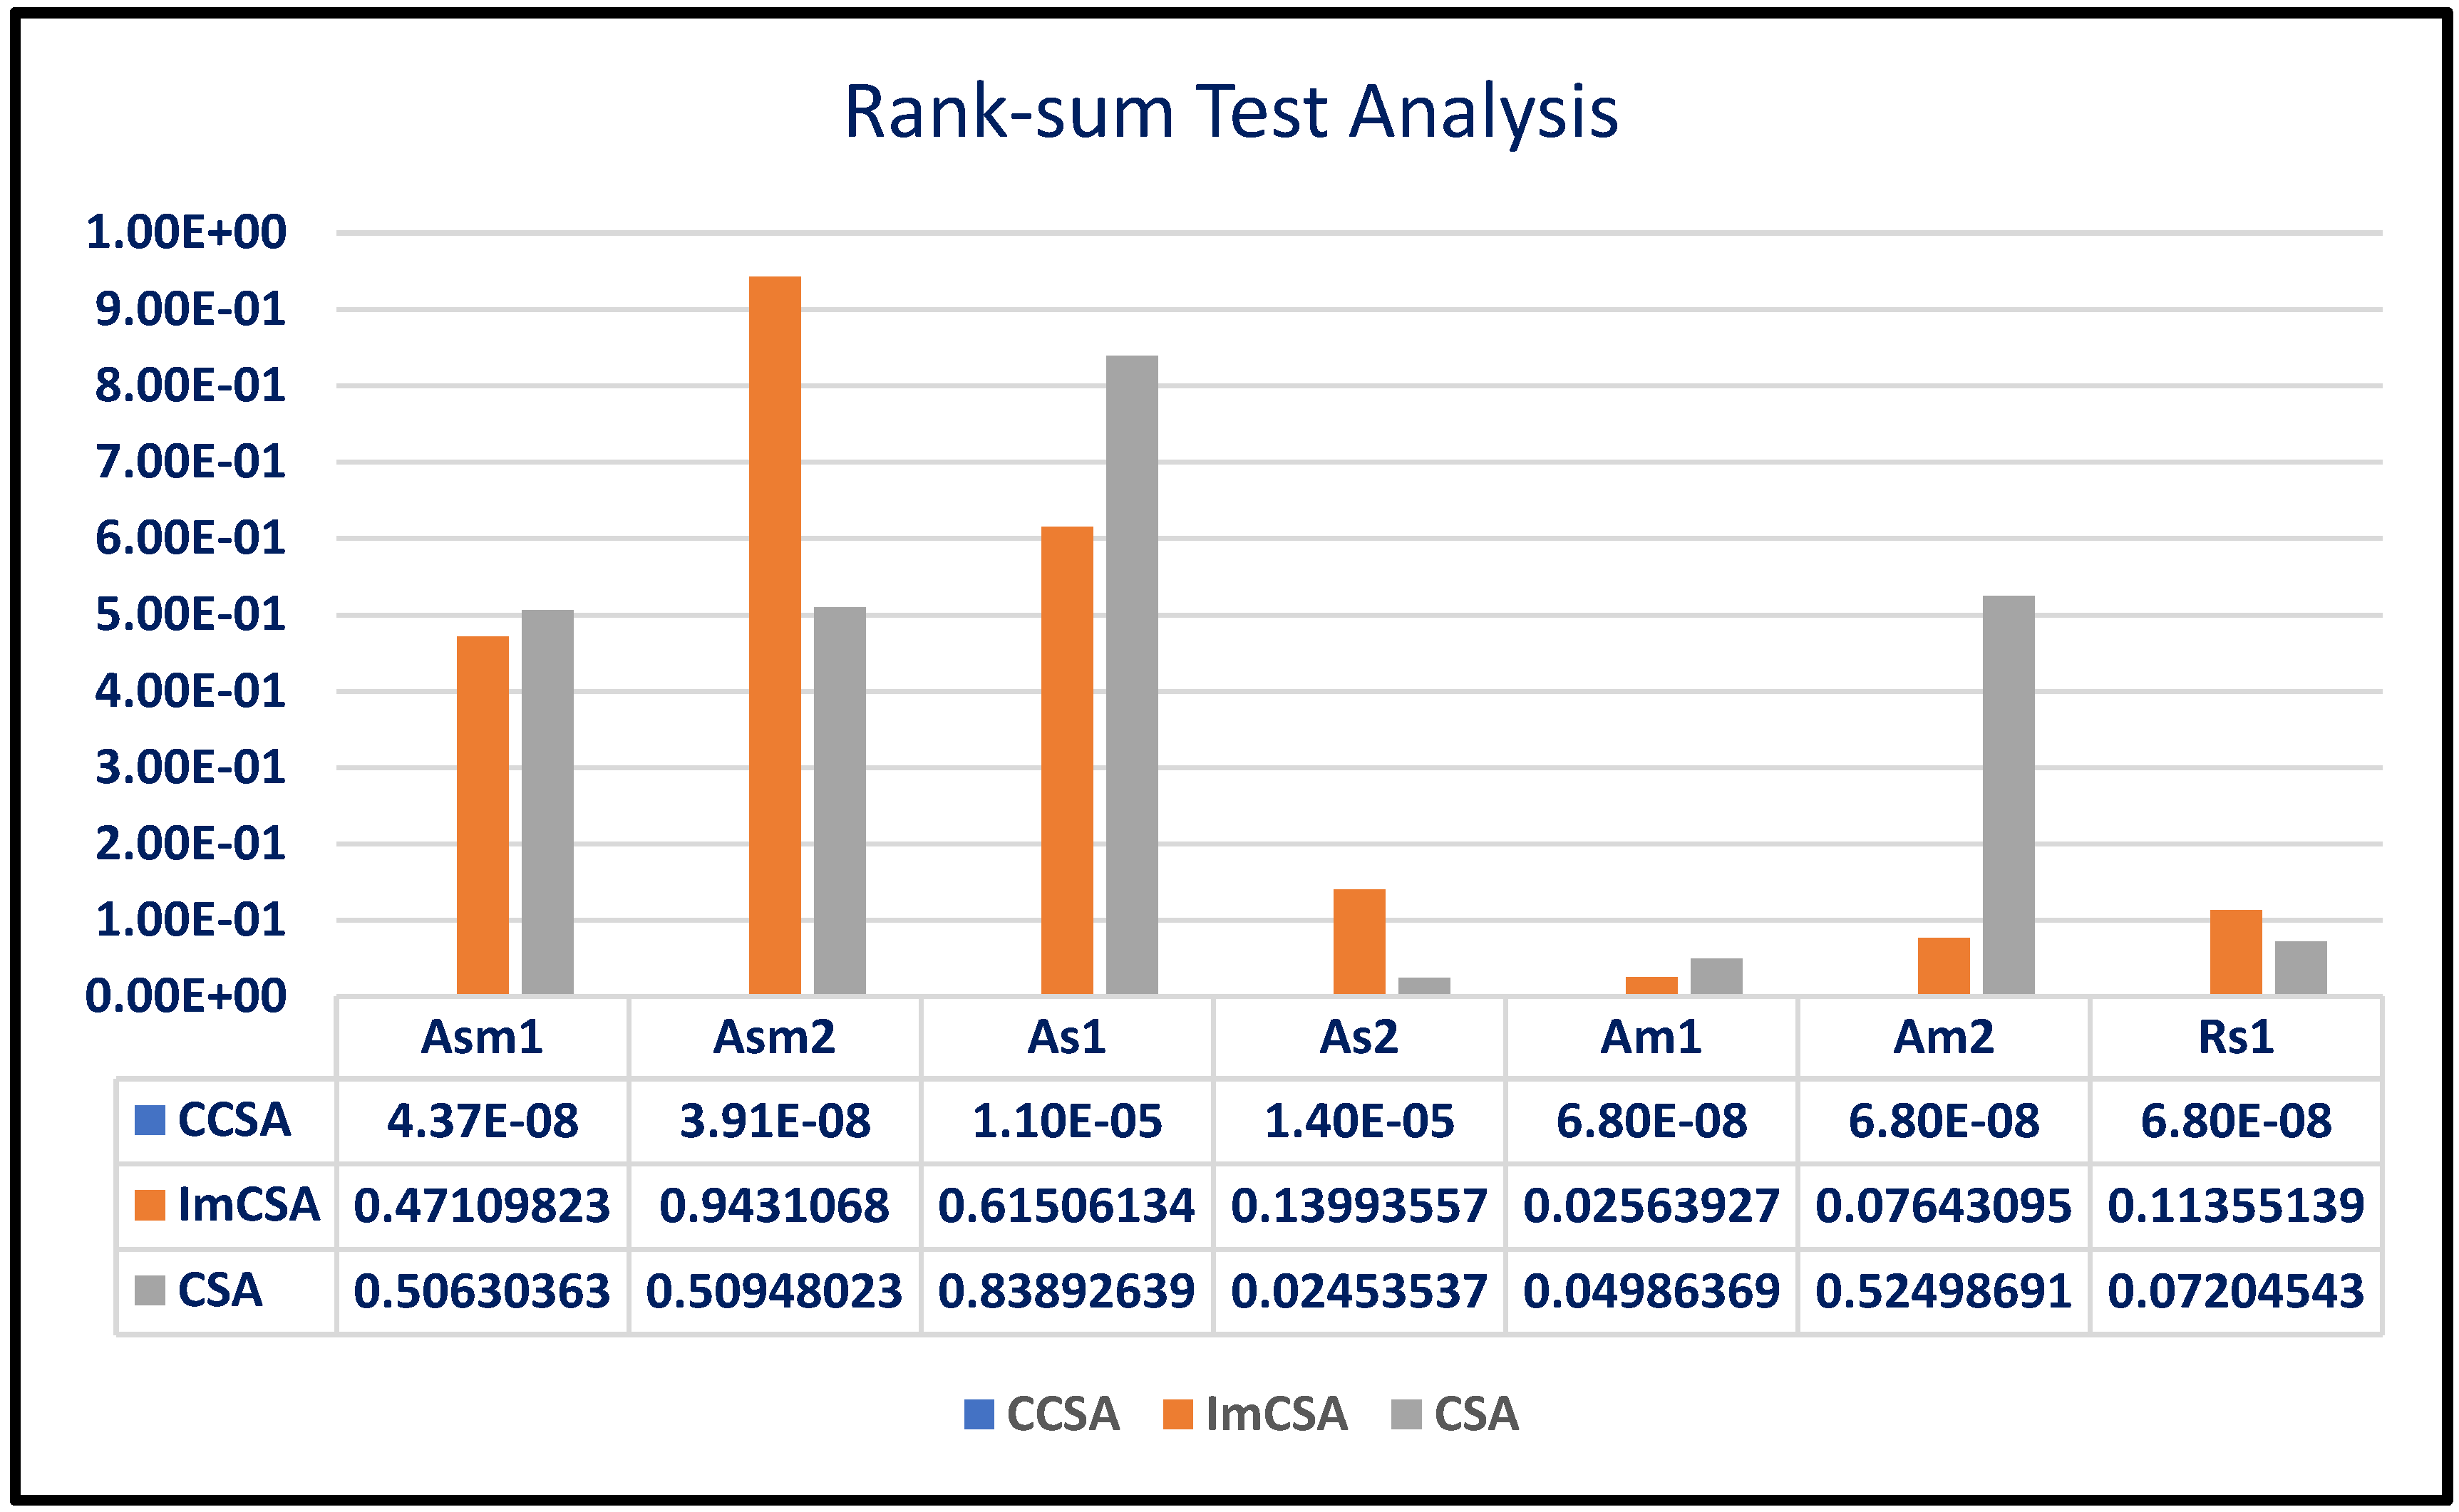
- The results depicted in Table 3 are calculated by taking 20 independent runs into consideration. To make the competition fair, the maximum no. of function evaluations has been kept constant for all participating algorithms. The following points can be observed from these results:
- The bench of protein is divided into three major parts, namely very small, small and medium length. Along with this, a real sequence has also been considered. From the observation table, we can conclude that the algorithms gave almost the same values of free energy for Asm1 and Asm2 when compared; however, the values of standard deviation of the results are optimal for the ICSA. These results are depicted in boldface.
- Inspecting the values of mean As1 and As2, it can be clearly observed that these values are optimal for the ICSA. Along with this fact, in As2, standard deviation is also optimal. These results are considered as affirmative, and it can be concluded that the ICSA works well for these proteins.
5. Conclusions
- Before experimenting on the complex protein sequence, the ICSA has been tested over some of the conventional benchmark functions. These functions are known functions, i.e., the minima and search range are priorly known. The comparative analysis with some of the published versions of the CSA shows that the algorithm is substantially improved with the application of a new exponential-driven factor and opposition-based learning. A detailed investigation in terms of statistical analysis of the fitness has been carried out to exhibit the efficacy of the proposed ICSA.
- A bench of various protein sequences is considered for testing the efficacy of the ICSA and some of the leading versions of the crow search algorithm and its variants. The bench consists of real and artificial sequences of protein.
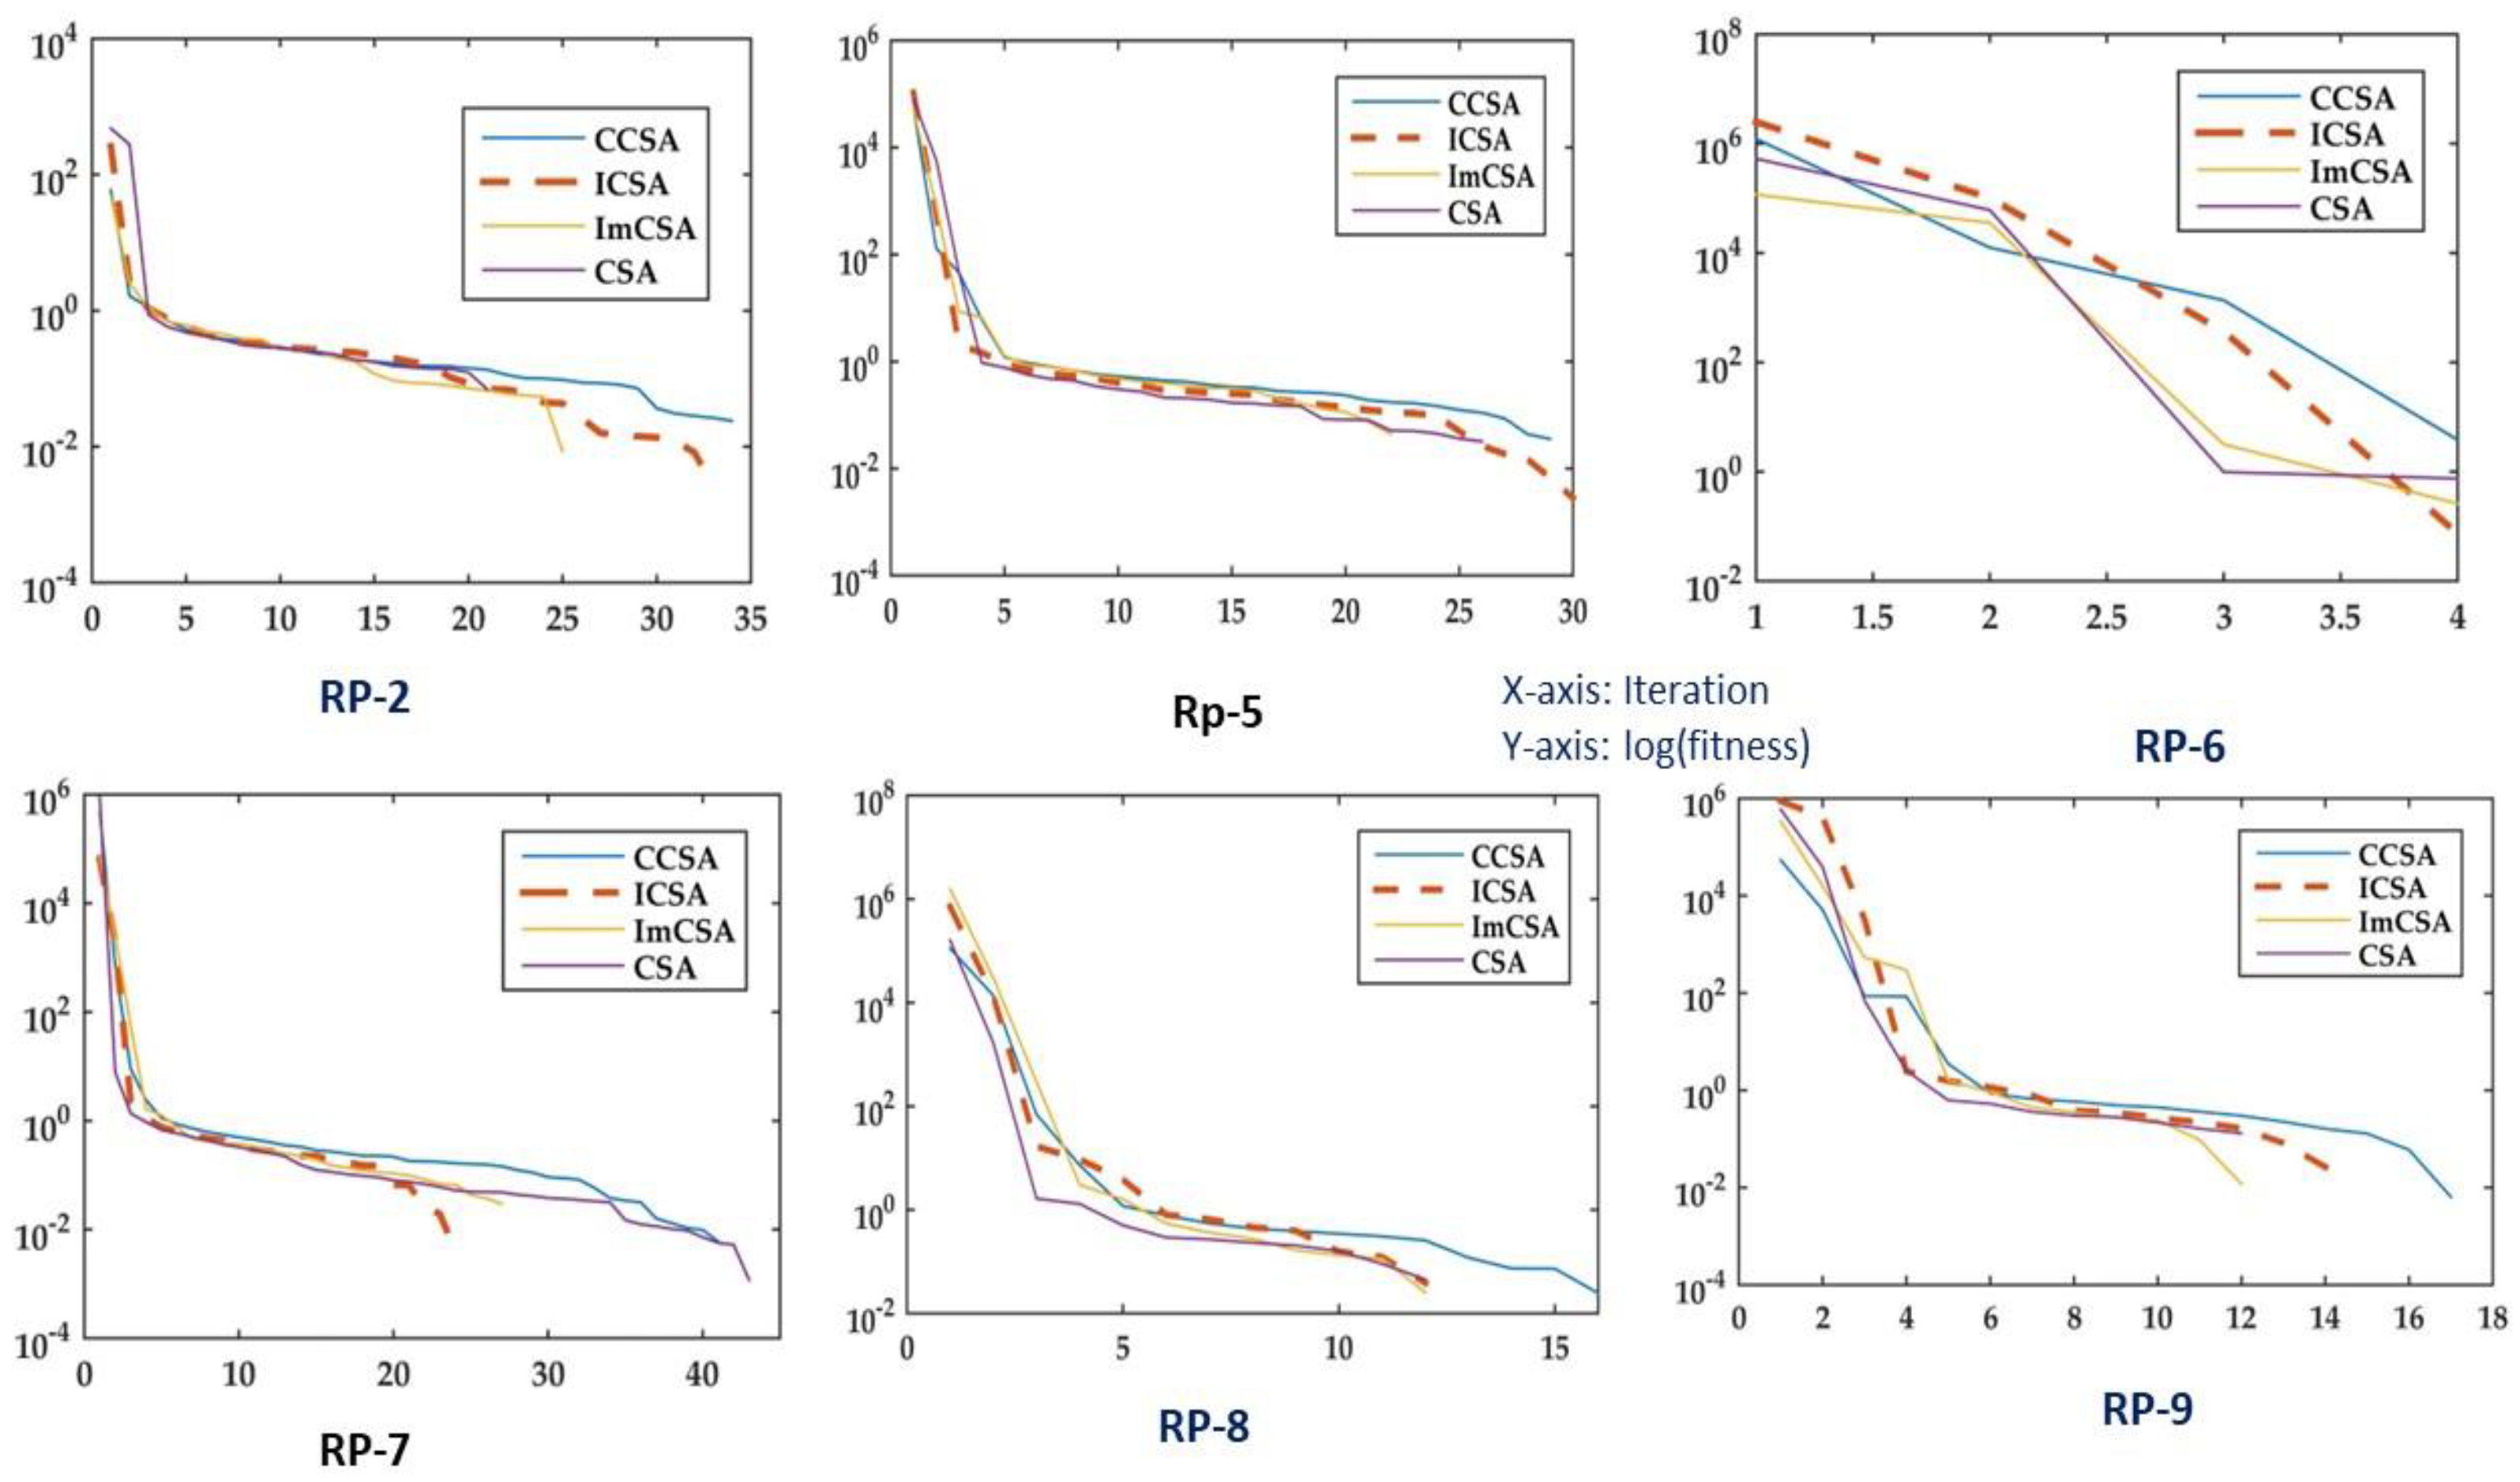
- An extended analysis of the algorithm has been conducted with the help of a real protein bench. The bench consists of a real protein sequence of medium length. The algorithm is evaluated with other opponents on the basis of convergence and SA.
- Optimization performance has been compared with the help of various analyses, such as SAA, ETA and statistical significance evaluation with the help of the rank-sum test. We observed that the ICSA provides the optimal solution in less computation time, and in some cases, a degree of uniqueness exists in the obtained results.
- Convergence curves for different conventional functions have been plotted to showcase the optimization efficacy of the ICSA.
Author Contributions
Funding
Data Availability Statement
Acknowledgments
Conflicts of Interest
References
- Anfinsen, C.B.; Haber, E.; Sela, M.; White, F.H., Jr. The kinetics of formation of native ribonuclease during oxidation of the reduced polypeptide chain. Proc. Natl. Acad. Sci. USA 1961, 47, 1309. [Google Scholar] [CrossRef] [Green Version]
- Anfinsen, C.B. Principles that govern the folding of protein chains. Science 1973, 181, 223–230. [Google Scholar] [CrossRef] [Green Version]
- Dill, K.A.; Bromberg, S.; Yue, K.; Chan, H.S.; Ftebig, K.M.; Yee, D.P.; Thomas, P.D. Principles of protein folding—A perspective from simple exact models. Protein Sci. 1995, 4, 561–602. [Google Scholar] [CrossRef] [Green Version]
- Stillinger, F.H.; Head-Gordon, T.; Hirshfeld, C.L. Toy model for protein folding. Phys. Rev. E 1993, 48, 1469. [Google Scholar] [CrossRef] [Green Version]
- Jana, N.D.; Sil, J.; Das, S. Selection of appropriate metaheuristic algorithms for protein structure prediction in AB off-lattice model: A perspective from fitness landscape analysis. Inf. Sci. 2017, 391, 28–64. [Google Scholar] [CrossRef]
- Li, B.; Gong, L.G.; Yang, W.L. An improved artificial bee colony algorithm based on balance-evolution strategy for unmanned combat aerial vehicle path planning. Sci. World J. 2014, 2014, 232704. [Google Scholar] [CrossRef] [Green Version]
- Li, B.; Chiong, R.; Lin, M. A balance-evolution artificial bee colony algorithm for protein structure optimization based on a three-dimensional AB off-lattice model. Comput. Biol. Chem. 2015, 54, 1–12. [Google Scholar] [CrossRef] [PubMed]
- Vargas Benítez, C.M.; Lopes, H.S. Parallel Artificial Bee Colony Algorithm Approaches for Protein Structure Prediction Using the 3dhp-sc Model. In Intelligent Distributed Computing IV: Proceedings of the 4th International Symposium on Intelligent Distributed Computing-IDC 2010, Tangier, Morocco, September 2010; Springer: Berlin/Heidelberg, Germany, 2010; pp. 255–264. [Google Scholar]
- Kalegari, D.H.; Lopes, H.S. A differential evolution approach for protein structure optimisation using a 2D off-lattice model. Int. J. Bio-Inspired Comput. 2010, 2, 242–250. [Google Scholar] [CrossRef]
- Kalegari, D.H.; Lopes, H.S. An improved parallel differential evolution approach for protein structure prediction using both 2D and 3D off-lattice models. In Proceedings of the 2013 IEEE Symposium on Differential Evolution (SDE), Singapore, 16–19 April 2013; IEEE: Piscataway, NJ, USA, 2013. [Google Scholar]
- Bošković, B.; Brest, J. Protein folding optimization using differential evolution extended with local search and component reinitialization. Inf. Sci. 2018, 454, 178–199. [Google Scholar] [CrossRef] [Green Version]
- Jana, N.D.; Sil, J.; Das, S. An improved harmony search algorithm for protein structure prediction using 3D off-lattice model. In Proceedings of the International Conference on Harmony Search Algorithm Springer, Singapore, 22–24 February 2017; pp. 304–314. [Google Scholar]
- Dash, T.; Sahu, P.K. Gradient gravitational search: An efficient metaheuristic algorithm for global optimization. J. Comput. Chem. 2015, 36, 1060–1068. [Google Scholar] [CrossRef]
- Chen, X.; Lv, M.; Zhao, L.; Zhang, X. An improved particle swarm optimization for protein folding prediction. Int. J. Inf. Eng. Electron. Bus. 2011, 3, 1. [Google Scholar] [CrossRef]
- Shmygelska, A.; Hoos, H.H. An ant colony optimisation algorithm for the 2D and 3D hydrophobic polar protein folding problem. BMC Bioinform. 2005, 6, 30. [Google Scholar] [CrossRef] [PubMed] [Green Version]
- Zhang, X.; Wang, T.; Luo, H.; Yang, J.Y.; Deng, Y.; Tang, J.; Yang, M.Q. 3D Protein structure prediction with genetic tabu search algorithm. BMC Syst. Biol. 2010, 4, 1–9. [Google Scholar] [CrossRef] [PubMed] [Green Version]
- Venske, S.M.; Gonçalves, R.A.; Benelli, E.M.; Delgado, M.R. ADEMO/D: An adaptive differential evolution for protein structure prediction problem. Expert Syst. Appl. 2016, 56, 209–226. [Google Scholar] [CrossRef]
- Saxena, A. A comprehensive study of chaos embedded bridging mechanisms and crossover operators for grasshopper optimisation algorithm. Expert Syst. Appl. 2019, 132, 166–188. [Google Scholar] [CrossRef]
- Shekhawat, S.; Saxena, A. Development and applications of an intelligent crow search algorithm based on opposition-based learning. ISA Trans. 2020, 99, 210–230. [Google Scholar] [CrossRef]
- Rincon, P. Science/nature|crows and jays top bird IQ scale. BBC News, 22 February 2005. [Google Scholar]
- Sayed, G.I.; Hassanien, A.E.; Azar, A.T. Feature selection via a novel chaotic crow search algorithm. Neural Comput. Appl. 2019, 31, 171–188. [Google Scholar] [CrossRef]
- Mohammadi, F.; Abdi, H. A modified crow search algorithm (MCSA) for solving economic load dispatch problem. Appl. Soft Comput. 2018, 71, 51–65. [Google Scholar] [CrossRef]
- Díaz, P.; Pérez-Cisneros, M.; Cuevas, E.; Avalos, O.; Gálvez, J.; Hinojosa, S.; Zaldivar, D. An improved crow search algorithm applied to energy problems. Energies 2018, 11, 571. [Google Scholar] [CrossRef] [Green Version]
- Abdelaziz, A.Y.; Fathy, A. A novel approach based on crow search algorithm for optimal selection of conductor size in radial distribution networks. Eng. Sci. Technol. Int. J. 2017, 20, 391–402. [Google Scholar] [CrossRef]
- Gupta, E.; Saxena, A. Robust generation control strategy based on grey wolf optimizer. J. Electr. Syst. 2015, 11, 174–188. [Google Scholar]
- Kałużyński, P.; Mucha, W.; Capizzi, G.; Lo Sciuto, G. Chemiresistor gas sensors based on conductive copolymer and ZnO blend–prototype fabrication, experimental testing, and response prediction by artificial neural networks. J. Mater. Sci. Mater. Electron. 2022, 33, 26368–26382. [Google Scholar] [CrossRef]
- Jain, K.; Saxena, A. Simulation on supplier side bidding strategy at day-ahead electricity market using ant lion optimizer. J. Comput. Cogn. Eng. 2023, 2, 17–27. [Google Scholar]
- Yang, K.; Huang, H.; Vandans, O.; Murali, A.; Tian, F.; Yap, R.H.; Dai, L. Applying deep reinforcement learning to the HP model for protein structure prediction. Phys. A Stat. Mech. Its Appl. 2023, 609, 128395. [Google Scholar] [CrossRef]
- Pradhan, R.; Panigrahi, S.; Sahu, P.K. Conformational Search for the Building Block of Proteins Based on the Gradient Gravitational Search Algorithm (ConfGGS) Using Force Fields: CHARMM, AMBER, and OPLS-AA. J. Chem. Inf. Model. 2023, 63, 670–690. [Google Scholar] [CrossRef] [PubMed]
- Inzamam-Ul-Hossain, M.; Islam, M.R. Identification of Essential Protein Using Chemical Reaction Optimization and Machine Learning Technique. IEEE/ACM Trans. Comput. Biol. Bioinform. 2023. [Google Scholar] [CrossRef]
- Jana, N.D.; Das, S.; Sil, J. A Metaheuristic Approach to Protein Structure Prediction: Algorithms and Insights from Fitness Landscape Analysis; Springer: Berlin/Heidelberg, Germany, 2018; Volume 31. [Google Scholar]
- RCSB Protein Data Bank (RCSB PDB). Available online: http://www.rcsb.org/pdb/home/home.do (accessed on 6 March 2023).


| Function | Dim | Range | Min. Value |
|---|---|---|---|
| 30 | [−100,100] | 0 | |
| 30 | [−10,10] | 0 | |
| 30 | [−100,100] | 0 | |
| 30 | [−100,100] | 0 | |
| 30 | [−30,30] | 0 | |
| 30 | [−100,100] | 0 | |
| 30 | [−1.28,1.28] | 0 | |
| 30 | [−500,500] | −418.9829 × 5 | |
| 30 | [−5.12,5.12] | 0 | |
| 30 | [−32,32] | 0 | |
| 30 | [−600,600] | 0 | |
| 30 | [−50,50] | 0 |
| Function | Parameter | CCSA [21] | ICSA | ImCSA [23] | CSA | Function | Parameter | CCSA [21] | ICSA | ImCSA [23] | CSA |
|---|---|---|---|---|---|---|---|---|---|---|---|
| F1 | Mean | 6.862046 | 0.031499 | 371.7069 | 5.606232 | F7 | Mean | 0.058742 | 0.058667 | 0.00209 | 0.031414 |
| Max | 13.02088 | 0.603666 | 2978.315 | 12.38207 | Max | 0.098207 | 0.109524 | 0.006988 | 0.074844 | ||
| Min | 2.310426 | 1.68E−08 | 2.01E−06 | 1.688793 | Min | 0.023507 | 0.021947 | 7.16E−05 | 0.003457 | ||
| SD | 3.340716 | 0.134802 | 806.7395 | 2.928814 | SD | 0.020186 | 0.025329 | 0.001671 | 0.017421 | ||
| F2 | Mean | 3.170929 | 0.068385 | 0.286378 | 2.62875 | F8 | Mean | −6709.28 | −3805.25 | −4814.16 | −6657.98 |
| Max | 4.810244 | 0.575082 | 3.658114 | 3.987891 | Max | −5012.01 | −3140.88 | −2626.53 | −5498.49 | ||
| Min | 1.405213 | 4.61E−05 | 0.00042 | 1.515934 | Min | −8371.41 | −4417.09 | −9016.28 | −7919.51 | ||
| SD | 0.910725 | 0.173323 | 0.844995 | 0.740529 | SD | 907.5612 | 453.158 | 2107.081 | 650.6592 | ||
| F3 | Mean | 323.0571 | 797.5047 | 5011.694 | 260.3749 | F9 | Mean | 33.98402 | 0.340106 | 48.68747 | 19.87135 |
| Max | 531.1665 | 1733.91 | 10026.44 | 541.7801 | Max | 54.01139 | 4.837234 | 158.7266 | 40.31614 | ||
| Min | 196.5237 | 256.5388 | 649.7462 | 77.18435 | Min | 19.8377 | 8.43E−09 | 0.000102 | 0.500648 | ||
| SD | 99.44027 | 408.3196 | 2623.501 | 122.8966 | SD | 10.06463 | 1.113659 | 48.36721 | 9.957675 | ||
| F4 | Mean | 6.308253 | 0.188467 | 0.002976 | 4.844995 | F10 | Mean | 4.300276 | 0.033443 | 0.720454 | 3.476109 |
| Max | 8.140264 | 1.737154 | 0.018445 | 7.114288 | Max | 7.323363 | 0.621233 | 9.006787 | 4.978548 | ||
| Min | 3.981577 | 7.91E−05 | 8.24E−05 | 1.400564 | Min | 2.893833 | 2.89E−05 | 0.002134 | 1.547676 | ||
| SD | 1.160448 | 0.482095 | 0.004275 | 1.564157 | SD | 1.218795 | 0.138743 | 2.051522 | 0.861077 | ||
| F5 | Mean | 324.046 | 2903.36 | 642.9959 | 247.6814 | F11 | Mean | 1.076878 | 0.097822 | 2.082308 | 1.032996 |
| Max | 555.5641 | 12040.52 | 5802.284 | 638.3758 | Max | 1.138195 | 0.52547 | 8.259849 | 1.08654 | ||
| Min | 188.2174 | 271.7245 | 28.7011 | 28.65027 | Min | 1.024521 | 0.007396 | 1.68E−06 | 0.938069 | ||
| SD | 89.8575 | 3460.403 | 1538.028 | 127.9758 | SD | 0.033668 | 0.14415 | 2.304979 | 0.045092 | ||
| F6 | Mean | 8.512082 | 0.180113 | 242.2761 | 5.755481 | F12 | Mean | 4.95529 | 3.21E−10 | 10.17759 | 2.026635 |
| Max | 18.40242 | 1.703808 | 1797.644 | 13.4591 | Max | 10.47527 | 1.97E−09 | 19.87467 | 4.821795 | ||
| Min | 3.876712 | 2.59E−08 | 2.48E−06 | 1.820985 | Min | 1.112488 | 4.59E−11 | 5.52E−06 | 0.161102 | ||
| SD | 3.538109 | 0.412308 | 465.7808 | 2.824979 | SD | 2.547375 | 4.63E−10 | 5.21975 | 1.325975 |
| S. No. | Name | Length | Sequence |
|---|---|---|---|
| 1 | Asm1 | 4 | ABAB |
| 2 | Asm2 | 4 | AAAA |
| 3 | As1 | 5 | AAAAB |
| 4 | As2 | 5 | AAAAA |
| 5 | Am1 | 13 | ABBABBABABBAB |
| 6 | Am2 | 17 | ABABBAABBBAAABABA |
| 7 | Rs1 (1BXP) | 13 | ABBBBBBABBBAB |
| PS | SA | CSA | CCSA | ImCSA | ICSA |
|---|---|---|---|---|---|
| Asm1 | Mean | −0.64938 | −0.64876 | −0.64935 | −0.64938 |
| Minimum | −0.64938 | −0.64934 | −0.64938 | −0.64938 | |
| Maximum | −0.64938 | −0.64628 | −0.64885 | −0.64938 | |
| Standard Deviation | 1.99E−16 | 0.000693 | 0.000117 | 1.92E−16 | |
| Asm2 | Mean | −1.67633 | −1.67219 | −1.67178 | −1.67633 |
| Minimum | −1.67633 | −1.67597 | −1.67633 | −1.67633 | |
| Maximum | −1.67633 | −1.66024 | −1.58531 | −1.67633 | |
| Standard Deviation | 4.86E−16 | 0.004327 | 0.020352 | 4.61E−16 | |
| As1 | Mean | −1.57712 | −1.51277 | −1.54829 | −1.57822 |
| Minimum | −1.58944 | −1.57024 | −1.58944 | −1.58944 | |
| Maximum | −1.4772 | −1.46993 | −1.32764 | −1.4772 | |
| Standard Deviation | 0.034475 | 0.028738 | 0.071696 | 0.034547 | |
| As2 | Mean | −2.76032 | −2.71044 | −2.78057 | −2.80884 |
| Minimum | −2.84828 | −2.83731 | −2.84828 | −2.84828 | |
| Maximum | −2.46639 | −2.59715 | −2.45111 | −2.46639 | |
| Standard Deviation | 0.112435 | 0.063695 | 0.093985 | 0.090723 | |
| Am1 | Mean | −0.76309 | 0.284905 | −0.6902 | −1.11339 |
| Minimum | −2.1577 | −0.14584 | −1.56744 | −1.69817 | |
| Maximum | −0.01221 | 0.589463 | −0.01221 | −0.40284 | |
| Standard Deviation | 0.664084 | 0.250181 | 0.504168 | 0.522875 | |
| Am2 | Mean | −2.987 | 0.90737 | −2.58315 | −3.23951 |
| Minimum | −4.61511 | 0.030558 | −4.52953 | −4.99724 | |
| Maximum | −1.19216 | 1.910105 | −0.79697 | −1.15554 | |
| Standard Deviation | 1.107474 | 0.482412 | 1.029253 | 1.064372 | |
| Rs1 | Mean | −0.6866 | 0.204919 | −0.7064 | −0.94874 |
| Minimum | −1.62337 | −0.0458 | −1.45093 | −1.68243 | |
| Maximum | −0.09148 | 0.432196 | −0.09148 | −0.09148 | |
| Standard Deviation | 0.480141 | 0.145814 | 0.475126 | 0.577632 |
| PS | CSA | CCSA | ImCSA | ICSA |
|---|---|---|---|---|
| Asm1 | 0.001632 | 0.002855 | 0.008275 | 0.001577 |
| Asm2 | 0.001651 | 0.002378 | 0.008295 | 0.001604 |
| As1 | 0.00268 | 0.00323 | 0.009296 | 0.0026 |
| As2 | 0.00274 | 0.003219 | 0.009372 | 0.002648 |
| Am1 | 0.040414 | 0.040534 | 0.047735 | 0.040257 |
| Am2 | 0.086517 | 0.087693 | 0.093003 | 0.086233 |
| Rs1 | 0.040848 | 0.041592 | 0.047092 | 0.040451 |
| S.No. | Nomenclature of Protein [31] (Length of Sequence) | Sequence Considered |
|---|---|---|
| RP-1. | 2ZNF (18) | ABABBAABBABAABBABA |
| RP-2. | 1CB3 (13) | BABBBAABBAAAB |
| RP-3. | 1BX1 (16) | ABAABBAAAAABBABB |
| RP-4. | 1EDP (17) | ABABBAABBBAABBABA |
| RP-5. | 1EDN (21) | ABABBAABBBAABBABABAAB |
| RP-6. | 1SP7 (24) | AAAAAAAABAAABAABBAAAABBB |
| RP-7. | 2H3S (25) | AABBAABBBBBABBBABAABBBBBB |
| RP-8. | 1FYG (25) | ABAAABAABBAABBAABABABBABA |
| RP-9. | 1T2Y (25) | ABAAABAABBABAABAABABBAABB |
| RP-10. | 2KPA (26) | ABABABBBAAAABBBBABABBBBBBA |
| RP-11. | 1ARE (29) | BBBAABAABBABABBBAABBBBBBBBBBB |
| RP-12. | 1K48 (29) | BAAAAAABBAAAABABBAAABABBAAABB |
| Sequence | SA | CSA | CCSA | ImCSA | ICSA | Sequence | SA | CSA | CCSA | ImCSA | ICSA |
|---|---|---|---|---|---|---|---|---|---|---|---|
| RP-1 | Mean | −2.3791931 | −0.7886972 | −1.7198855 | −2.4001344 | RP-7 | Mean | −1.3065694 | −0.3117043 | −0.5407107 | −1.4724554 |
| Max | 0.0267368 | 0.2064326 | −0.6176313 | 0.0267386 | Max | 0.0064462 | 0.4984838 | 0.0063101 | 0.0063656 | ||
| Min | −5.0663166 | −2.6839571 | −3.4270418 | −4.3176683 | Min | −3.5274819 | −1.7353797 | −2.0208762 | −2.8963254 | ||
| SD | 1.3375592 | 0.855751 | 0.7766258 | 1.2731138 | SD | 1.3601746 | 0.7018831 | 0.6578956 | 1.0617478 | ||
| RP-2 | Mean | −0.9197507 | −0.1272179 | −0.5434708 | −1.1124384 | RP-8 | Mean | −3.6225088 | −2.2060117 | −2.5448055 | −3.6272946 |
| Max | 0.1393805 | 0.235523 | 0.1393802 | 0.1393803 | Max | −0.5703019 | −1.1118433 | −1.554185 | −1.1893901 | ||
| Min | −3.1515092 | −1.7230257 | −2.9664274 | −3.027823 | Min | −5.730837 | −3.6879032 | −3.6678783 | −5.5395026 | ||
| SD | 1.2288456 | 0.457233 | 0.938032 | 1.1736009 | SD | 1.1702585 | 0.8962653 | 0.6790631 | 1.5134546 | ||
| RP-3 | Mean | −4.061345 | −2.0771745 | −2.6960923 | −4.073643 | RP-9 | Mean | −3.9554999 | −1.5579017 | −1.9065653 | −3.9567796 |
| Max | −1.3752103 | −0.9003451 | −1.010259 | −2.391513 | Max | 0.0042479 | 0.5740143 | 0.0039736 | 0.0040509 | ||
| Min | −6.2571965 | −3.4880659 | −6.3372388 | −5.9779379 | Min | −6.7932439 | −3.7696626 | −5.0893686 | −6.1911524 | ||
| SD | 1.3004085 | 0.7643066 | 1.2378757 | 0.881331 | SD | 1.5168258 | 1.3738249 | 1.0519291 | 1.6046706 | ||
| RP-4 | Mean | −1.6090671 | −0.3213995 | −1.0254915 | −1.277614 | RP-10 | Mean | −3.2471186 | −1.0720838 | −2.4729678 | −2.8468528 |
| Max | −0.4528852 | 0.3969437 | −0.159538 | 0.1053464 | Max | −0.8728514 | −0.0972439 | −1.070647 | −0.3651848 | ||
| Min | −3.1296681 | −1.408081 | −1.9635722 | −3.2492808 | Min | −5.1931067 | −2.1187554 | −4.9041739 | −5.848072 | ||
| SD | 0.9139286 | 0.5580195 | 0.5432835 | 1.0252792 | SD | 1.1630649 | 0.6546535 | 1.0042202 | 1.2853246 | ||
| RP-5 | Mean | −1.5179187 | −0.472523 | −1.4763197 | −1.6676075 | RP-11 | Mean | −1.7560662 | −0.3524027 | −1.3875453 | −1.3565324 |
| Max | 0.0745548 | 0.4167209 | 0.0745165 | 0.0745474 | Max | −0.1602364 | 0.2812715 | −0.1905263 | −0.1585026 | ||
| Min | −3.9066747 | −3.0887209 | −4.3472688 | −4.7164015 | Min | −3.3050487 | −1.662606 | −2.931173 | −3.3910932 | ||
| SD | 1.2562795 | 0.9778551 | 0.9856835 | 1.4249971 | SD | 1.0160831 | 0.6426634 | 0.7622098 | 1.2438222 | ||
| RP-6 | Mean | −8.9429712 | −4.9479063 | −6.4622347 | −9.0543114 | RP-12 | Mean | −5.8367209 | −2.8724377 | −3.7033946 | −4.8984339 |
| Max | −5.9611104 | −1.285182 | −3.7284173 | −5.4037268 | Max | −2.5869554 | −0.4310465 | −0.2096519 | −0.2091465 | ||
| Min | −11.30546 | −9.0011959 | −10.247179 | −13.325058 | Min | −8.8135235 | −4.9994968 | −6.6499219 | −7.9420245 | ||
| SD | 1.4720603 | 1.7702774 | 1.688918 | 1.8708891 | SD | 2.0337375 | 1.4132917 | 1.878015 | 1.765799 |
Disclaimer/Publisher’s Note: The statements, opinions and data contained in all publications are solely those of the individual author(s) and contributor(s) and not of MDPI and/or the editor(s). MDPI and/or the editor(s) disclaim responsibility for any injury to people or property resulting from any ideas, methods, instructions or products referred to in the content. |
© 2023 by the authors. Licensee MDPI, Basel, Switzerland. This article is an open access article distributed under the terms and conditions of the Creative Commons Attribution (CC BY) license (https://creativecommons.org/licenses/by/4.0/).
Share and Cite
Alshamrani, A.M.; Saxena, A.; Shekhawat, S.; Zawbaa, H.M.; Mohamed, A.W. Performance Evaluation of Ingenious Crow Search Optimization Algorithm for Protein Structure Prediction. Processes 2023, 11, 1655. https://doi.org/10.3390/pr11061655
Alshamrani AM, Saxena A, Shekhawat S, Zawbaa HM, Mohamed AW. Performance Evaluation of Ingenious Crow Search Optimization Algorithm for Protein Structure Prediction. Processes. 2023; 11(6):1655. https://doi.org/10.3390/pr11061655
Chicago/Turabian StyleAlshamrani, Ahmad M., Akash Saxena, Shalini Shekhawat, Hossam M. Zawbaa, and Ali Wagdy Mohamed. 2023. "Performance Evaluation of Ingenious Crow Search Optimization Algorithm for Protein Structure Prediction" Processes 11, no. 6: 1655. https://doi.org/10.3390/pr11061655