1. Introduction
In recent years, many accidents have happened during hazardous chemical experiments. On 21 July 2022, an accident of catalyst leakage occurred at a research laboratory of Petro China, which led to the death of one person and three people being injured. On 27 April 2022, at Central South University, an accident happened in a research laboratory during a chemical- and material-science-related experiment, which caused one PhD candidate’s death. The laboratory is an important site for scientific and technological innovation activities, which many young researchers are working in, so the safety issue should not be neglected [
1,
2]. Nowadays, research on laboratory safety attracts increasing attention [
3,
4], and many researchers share their findings and opinions. With the current focus on safety management and accident causation analysis, Keckler et al. developed a safety management method to enhance laboratory safety by using questionnaire data [
5]. Frederico et al. found that improving safety culture can strengthen laboratory safety management [
6]. Peng et al. used machine learning to improve the accuracy and solve the limitations of subjective evaluation in safety management [
7]. Recently, many researchers have realized that human error is a considerable issue in laboratory safety. Ma et al. conducted accident analysis and causation research, finding that most defects in the laboratories and most root causes of laboratory accidents are human-related [
8]. Furthermore, in identifying and analyzing the causes of laboratory fire and explosion accidents, it has also been recognized that human error is a major problem [
9]. Due to the importance of human error, Zhao et al. recently published a study which views humans as a key element for laboratory safety assessment; moreover, Yang et al. assigned the human factor a significant role in the laboratory safety management framework [
10,
11]. With the deepening of laboratory safety research, human error has been acknowledged to be the main cause of laboratory accidents, and its influence should be considered [
12,
13]. Although people have realized that human error is a key element in triggering accidents during hazardous experiments, there is limited research on the quantification of human error in laboratory safety. Without effective human error quantification analysis, people may find it difficult to realize how human error impacts laboratory safety and it may be hard to manage and to avoid human errors. Therefore, HEP quantification is a crucial and necessary research point in the domain of laboratory safety.
Human Reliability Analysis (HRA) is widely used to quantitatively estimate HEP. Considering this study, it is also a reasonable choice to deal with HEP in conducting hazardous chemical experiments. So far, dozens of HRA methods have been designed and published, and those HRA methods can be divided into three generations. The first generation HRA methods include the Technique for Human Error Rate Prediction (THERP), Standardized Plant Analysis Risk-Human Reliability Analysis (SPAR-H), Success Likelihood Index Method (SLIM), and Human Error Assessment and Reduction Method (HEART) [
14,
15,
16,
17,
18,
19], and they focus on task characteristics. Typical methods in the second generation are CREAM and A Technique for Human Error Analysis (ATHEANA) [
20,
21]. They consider the influence of the environment on human reliability apart from task characteristics. However, the ATHEANA method is for nuclear industries, time-consuming, and weak in quantification, so this study does not consider that method. With in-depth research on safety psychology, cognitive science, and system safety science, the newest generation of human reliability methods includes Phoenix and the Integrated Human Event Analysis System (IDHEAS) [
22,
23], which have been published and applied in areas such as the oil and gas industries and nuclear power plants [
24,
25]. The above-mentioned HRA methods are mostly designed for specific domains such as the oil and gas industry, the petrochemical industry, and the nuclear industry. For this study, CREAM was selected as the main method for further research, since it is not designed for a specific domain, and it has strong functions for quantification.
The first publication of CREAM was in 1998, and it has received many expansions. As human factor data is always insufficient, fuzzy CREAM has become an effective research direction. Since 2006, fuzzy CREAM has been applied in the areas of oil and gas, the nuclear industry, railway transportation, aviation transportation, and maritime activities, with useful results [
26,
27,
28]. So far, many improvements and expansions have been made based on the fuzzy CREAM framework. In 2009, relevant scholars endowed fuzzy CREAM with the function of probabilistic safety calculation through fuzzy min-max operators [
29]. In addition, due to the dependence between CPCs, a Bayesian network was integrated with fuzzy CREAM to build a probability safety assessment model [
30,
31,
32]. However, CPCs have different weights of influence on human reliability. Some researchers have promoted the credibility of analysis results based on fuzzy product-sum operator to combine CPCs’ weight and CPCs’ fuzzy degree together [
33,
34,
35,
36]. In addition, as If-Then rules activated by CPCs have weight, Zhang et al. integrated If-Then rule weights into the analytical process of fuzzy CREAM [
37]. Furthermore, type-II fuzzy theory has been introduced to fuzzy CREAM to analyze CPC membership or weights and it can improve the quality of assessment results [
38,
39]. Although the above research promotes the efficiency of fuzzy CREAM, there is still a high level of subjectivity in CPC data. The quality and credibility of CPC data must be guaranteed because the CPC data act as a fundamental guarantee for the fuzzy degree of membership and probabilistic safety calculation.
This research aims to improve the collection of CPC data and to make sure the fuzzy CREAM process is more reasonable. Through analysis of the literature, it was found that some researchers have used the concept of risk to collect data from the perspectives of possibility and severity to describe performance-shaping factors (i.e., CPCs) [
40]. Moreover, as the definition of risk is widely acknowledged, using it to collect CPCs’ performance data can be easily understood by people. Considering this study, it is worth adopting the definition of risk to determine a CPC’s performance data, and then using the CPC’s risk data to determine the CPC’s fuzzy degree, the CPC’s weight, and the If-then rule weight activated directly or indirectly by each CPC for the final calculation of the HEP.
Nonetheless, in contrast to the data of facilities and hardware, which have complete information, the recording of CPC data is always insufficient; namely, it is partially clear and partially unclear. Therefore, it is also worth introducing gray relation theory to deal with this situation. Gray relation theory was designed by Professor Deng Julong in the 1980s and has been applied in many areas [
41,
42], especially for GRA which has been successfully used for identifying important failure modes and key performance-shaping factors for human errors [
43]. For this study, the collected risk data of each CPC can be processed by GRA for determining the importance weight of each CPC. The weight value of each CPC is integrated with the CPC’s fuzzy degree as determined by the CPC’s risk data through product-sum operator. In addition, as CREAM is designed for general industries but our study focuses on chemical experiments that contain risky processes, therefore, the CPCs should receive some changes to make sure they are suitable to describe any chemical experiment task.
According to the description above, this study proposes an improved CREAM to effectively and reasonably estimate the HEP for chemical experiments with hazardous processes. This study firstly adjusts nine CPCs involved in the CREAM to make them match chemical experiments. Then, this study employs the concept of risk to describe the performance of each CPC from the aspect of possibility and severity, so as to enhance the rationality and to decrease the subjectivity of CPC data. Afterwards, the risk data of each CPC, the GRA method, fuzzy calculation, and defuzzification are used together to estimate the HEP for the whole chemical experiment process. In summary, the proposed method provides a feasible passage to estimate the HEP for risky chemical experiments; moreover, traditional fuzzy data which are mainly determined by experts’ subjective evaluations are replaced by the risk data (possibility and severity) to decrease the subjective level and increase data credibility; in addition, CPCs’ fuzzy degrees, CPCs’ weights, and activated If-Then rule weights are effectively integrated for reasonably estimating the HEP value. Those together form the contributions of this study.
This research takes the case of ferrous sulfide preparation as the example to validate the proposed method. The remainder of this paper is structured as follows.
Section 2 introduces the basic procedures of the proposed approach.
Section 3 elaborates on the methodologies used and their principles.
Section 4 uses the test case to verify our proposed method.
Section 5 contains a discussion of the strengths and limitations of this study, and
Section 6 presents our results and conclusions.
2. Research Procedure
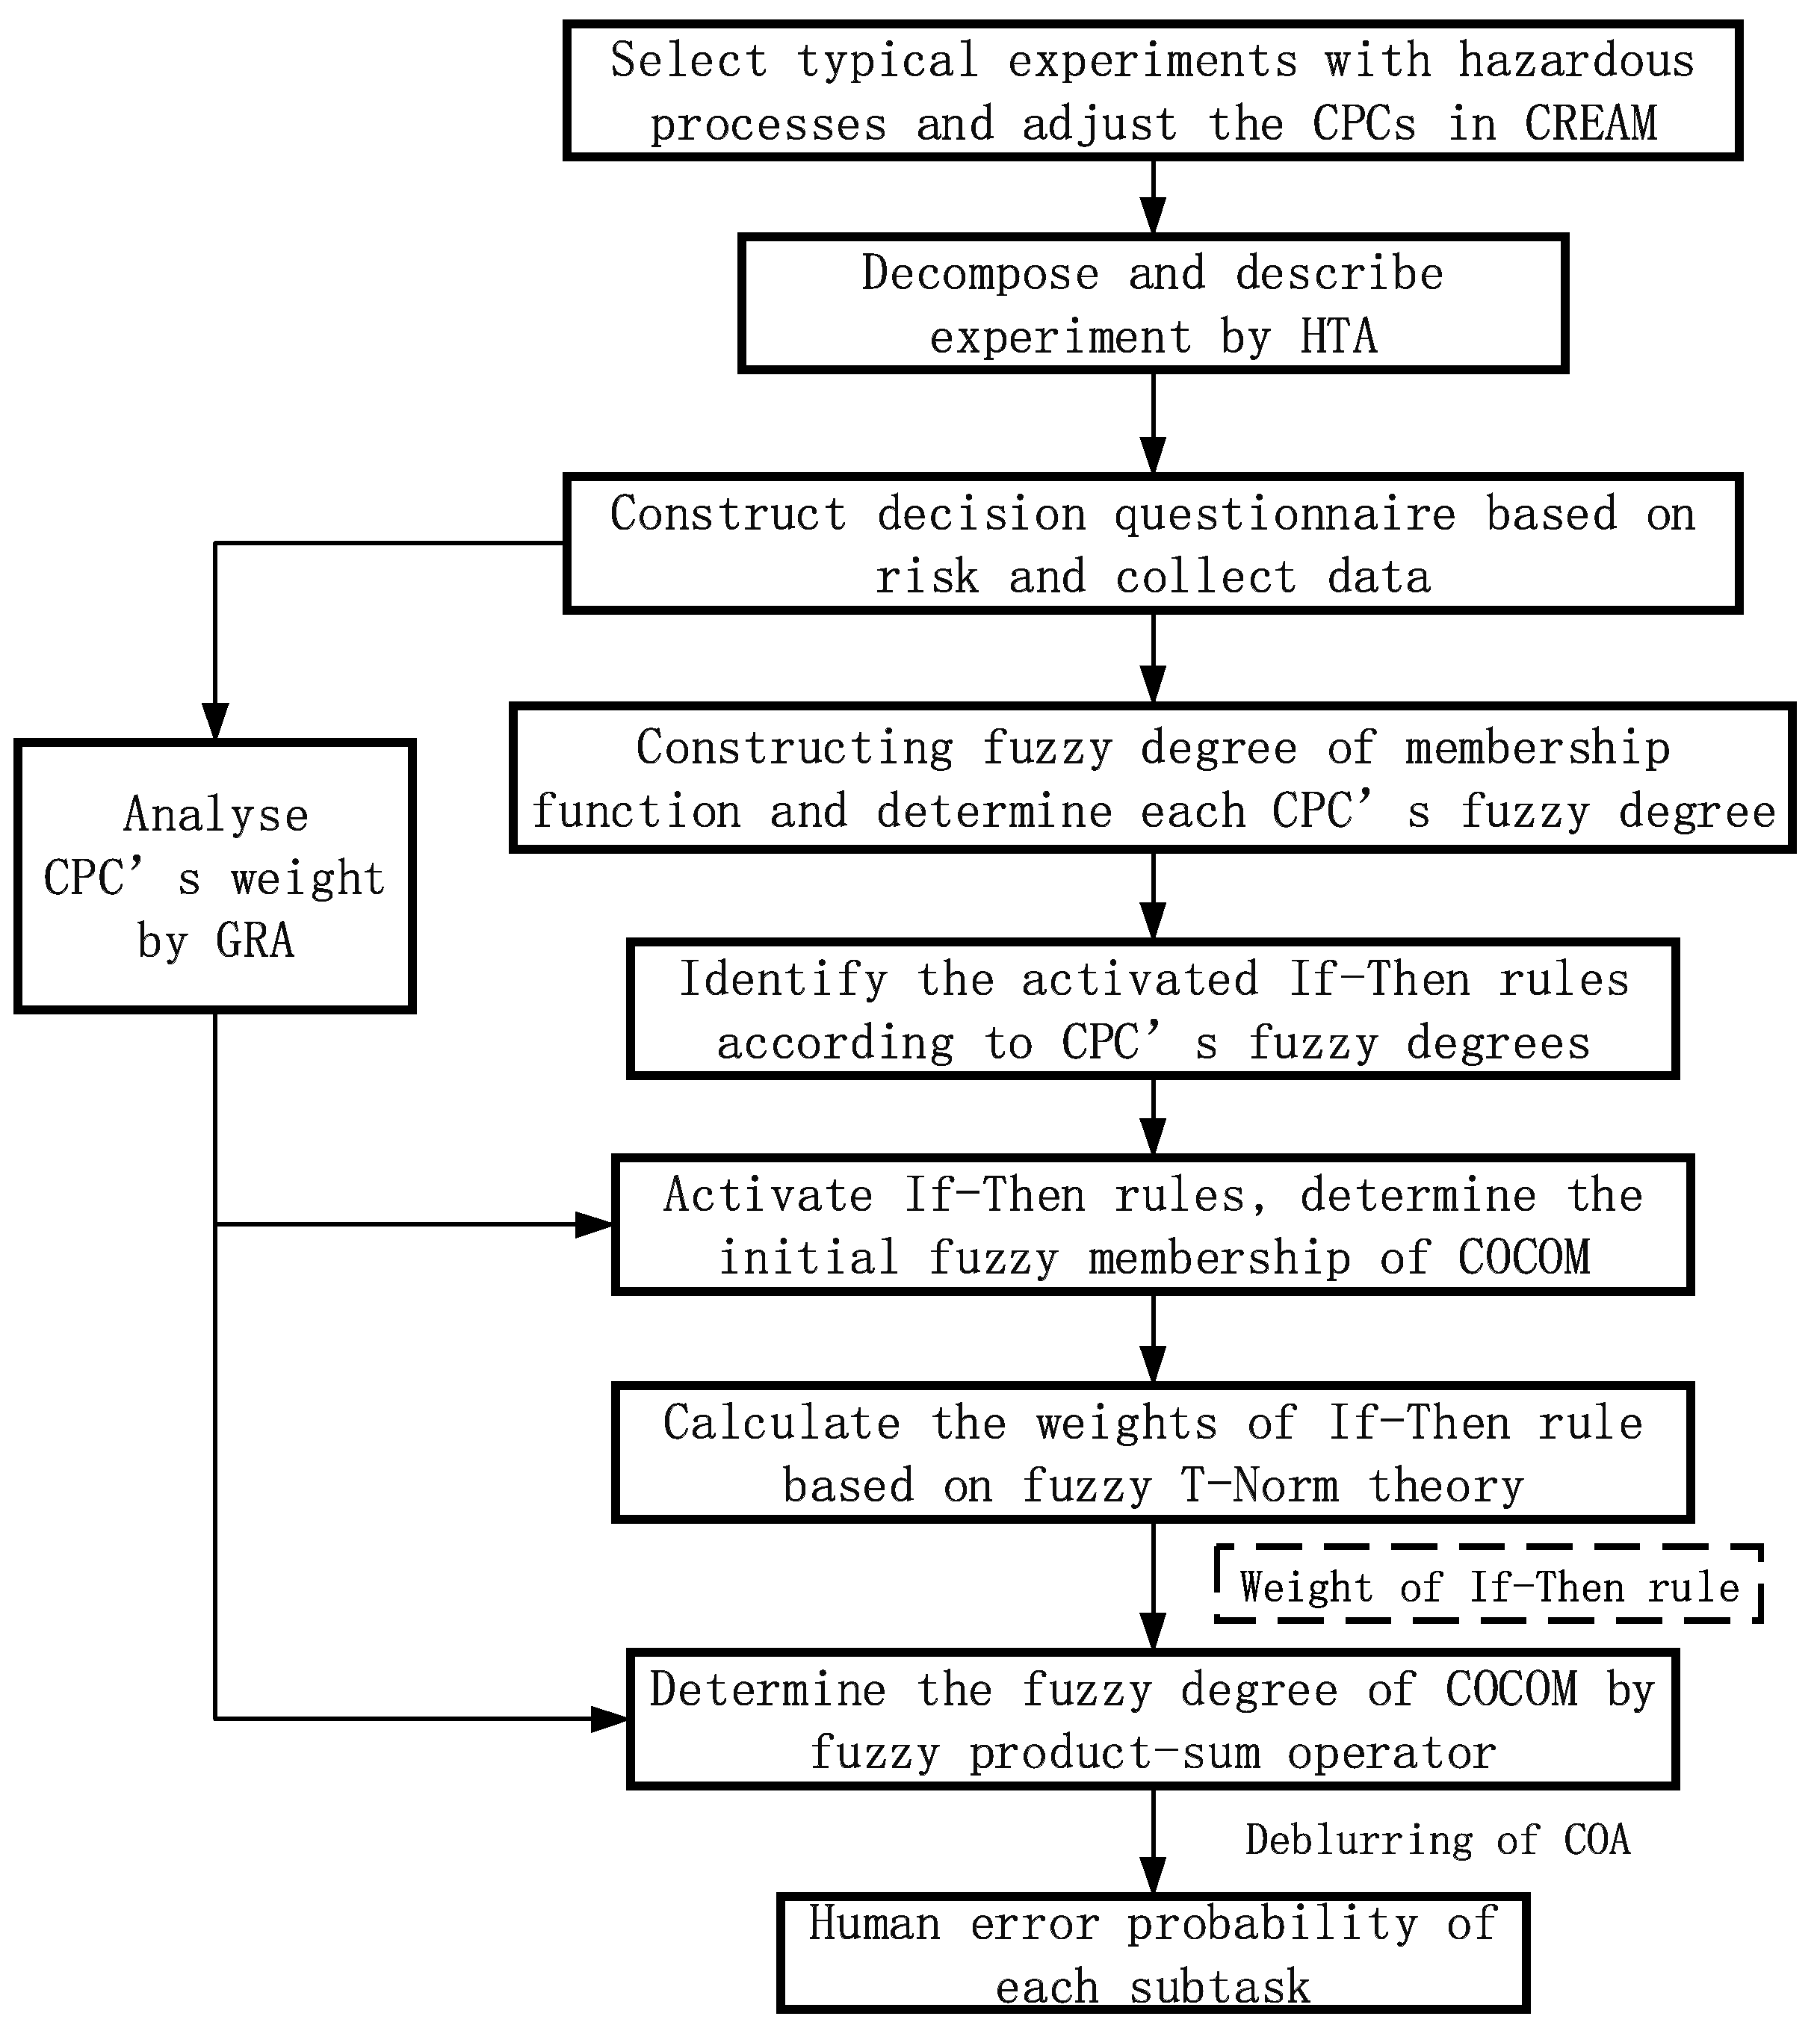
This research provides an improved CREAM approach for estimating the HEP while carrying out chemical experiments with hazardous processes. The main procedure of the proposed method contains ten steps, which are presented in
Figure 1.
The explanation of each step is as follows:
Step 1. Selecting a typical chemical experiment that has risky processes and then adjusting the CPCs in CREAM to make sure each CPC is appropriate to the experiment.
Step 2. Using Hierarchical Task Analysis (HTA) to decompose the selected chemical experiment into several subtasks and to describe them.
Step 3. According to the HTA result, and based on the concept of “Risk”, collecting performance data for each CPC in each subtask from the aspect of possibility and consequence.
Step 4. According to the collected risk data for each CPC, analyzing the CPC’s weight value through Gray Relation Analysis (GRA).
Step 5. Constructing a fuzzy degree of membership function, and then determining each CPC’s fuzzy degree in each subtask according to each CPC’s risk data.
Step 6. Based on the fuzzy CREAM, and according to the CPCs’ fuzzy degrees in each subtask, identifying the activated If-Then rules.
Step 7. With the activated If-Then rules, this study adopts fuzzy product-sum operator to combine a CPC’s weight values and a CPC’s fuzzy degrees together to determine the initial fuzzy membership degree of each COCOM.
Step 8. Based on fuzzy T-Norm theory, calculating the weights of each activated If-Then rule by multiplying each corresponding CPC’s fuzzy degrees together.
Step 9. Using fuzzy product-sum operator to integrate the initial fuzzy membership degree of each COCOM and each corresponding activated If-Then rule to determine the final fuzzy degree of each COCOM.
Step 10. With the final fuzzy degree of each COCOM, this study uses a defuzzification method (the center of area method is used here) to calculate the HEP data of each subtask in the selected risky chemical experiment.
3. Methods and Principles
We propose an approach for human reliability assessment and HEP estimation for chemical experiments with hazardous processes. The main methodologies and their corresponding principles are illustrated in this section.
3.1. CREAM
CREAM includes nine types of CPCs: adequacy of organization, working conditions, adequacy of human–computer interface, availability of programs and plans, number of targets achieved concurrently, available time, time slot of day, adequacy of training and experience, and quality of member cooperation [
44]. These are adjusted due to the many differences between laboratory and industry systems, such as task objectives, the work experience of personnel, and the work environment. The adjusted CPCs are listed in
Table 1. It should be noted that CPC9 is not used when the experiment only needs one person to carry it out.
Table 1 shows that each CPC has impacts on system human reliability, which are “improving,” “reducing,” and “insignificant,” with corresponding scores of +1, 0, and −1. Based on this, we analyze the CPCs based on the human error impact index, calculated by Equation (1).
where
represents the total impact of all CPCs on the task.
and
are the numbers of CPCs that reduce and improve reliability, respectively.
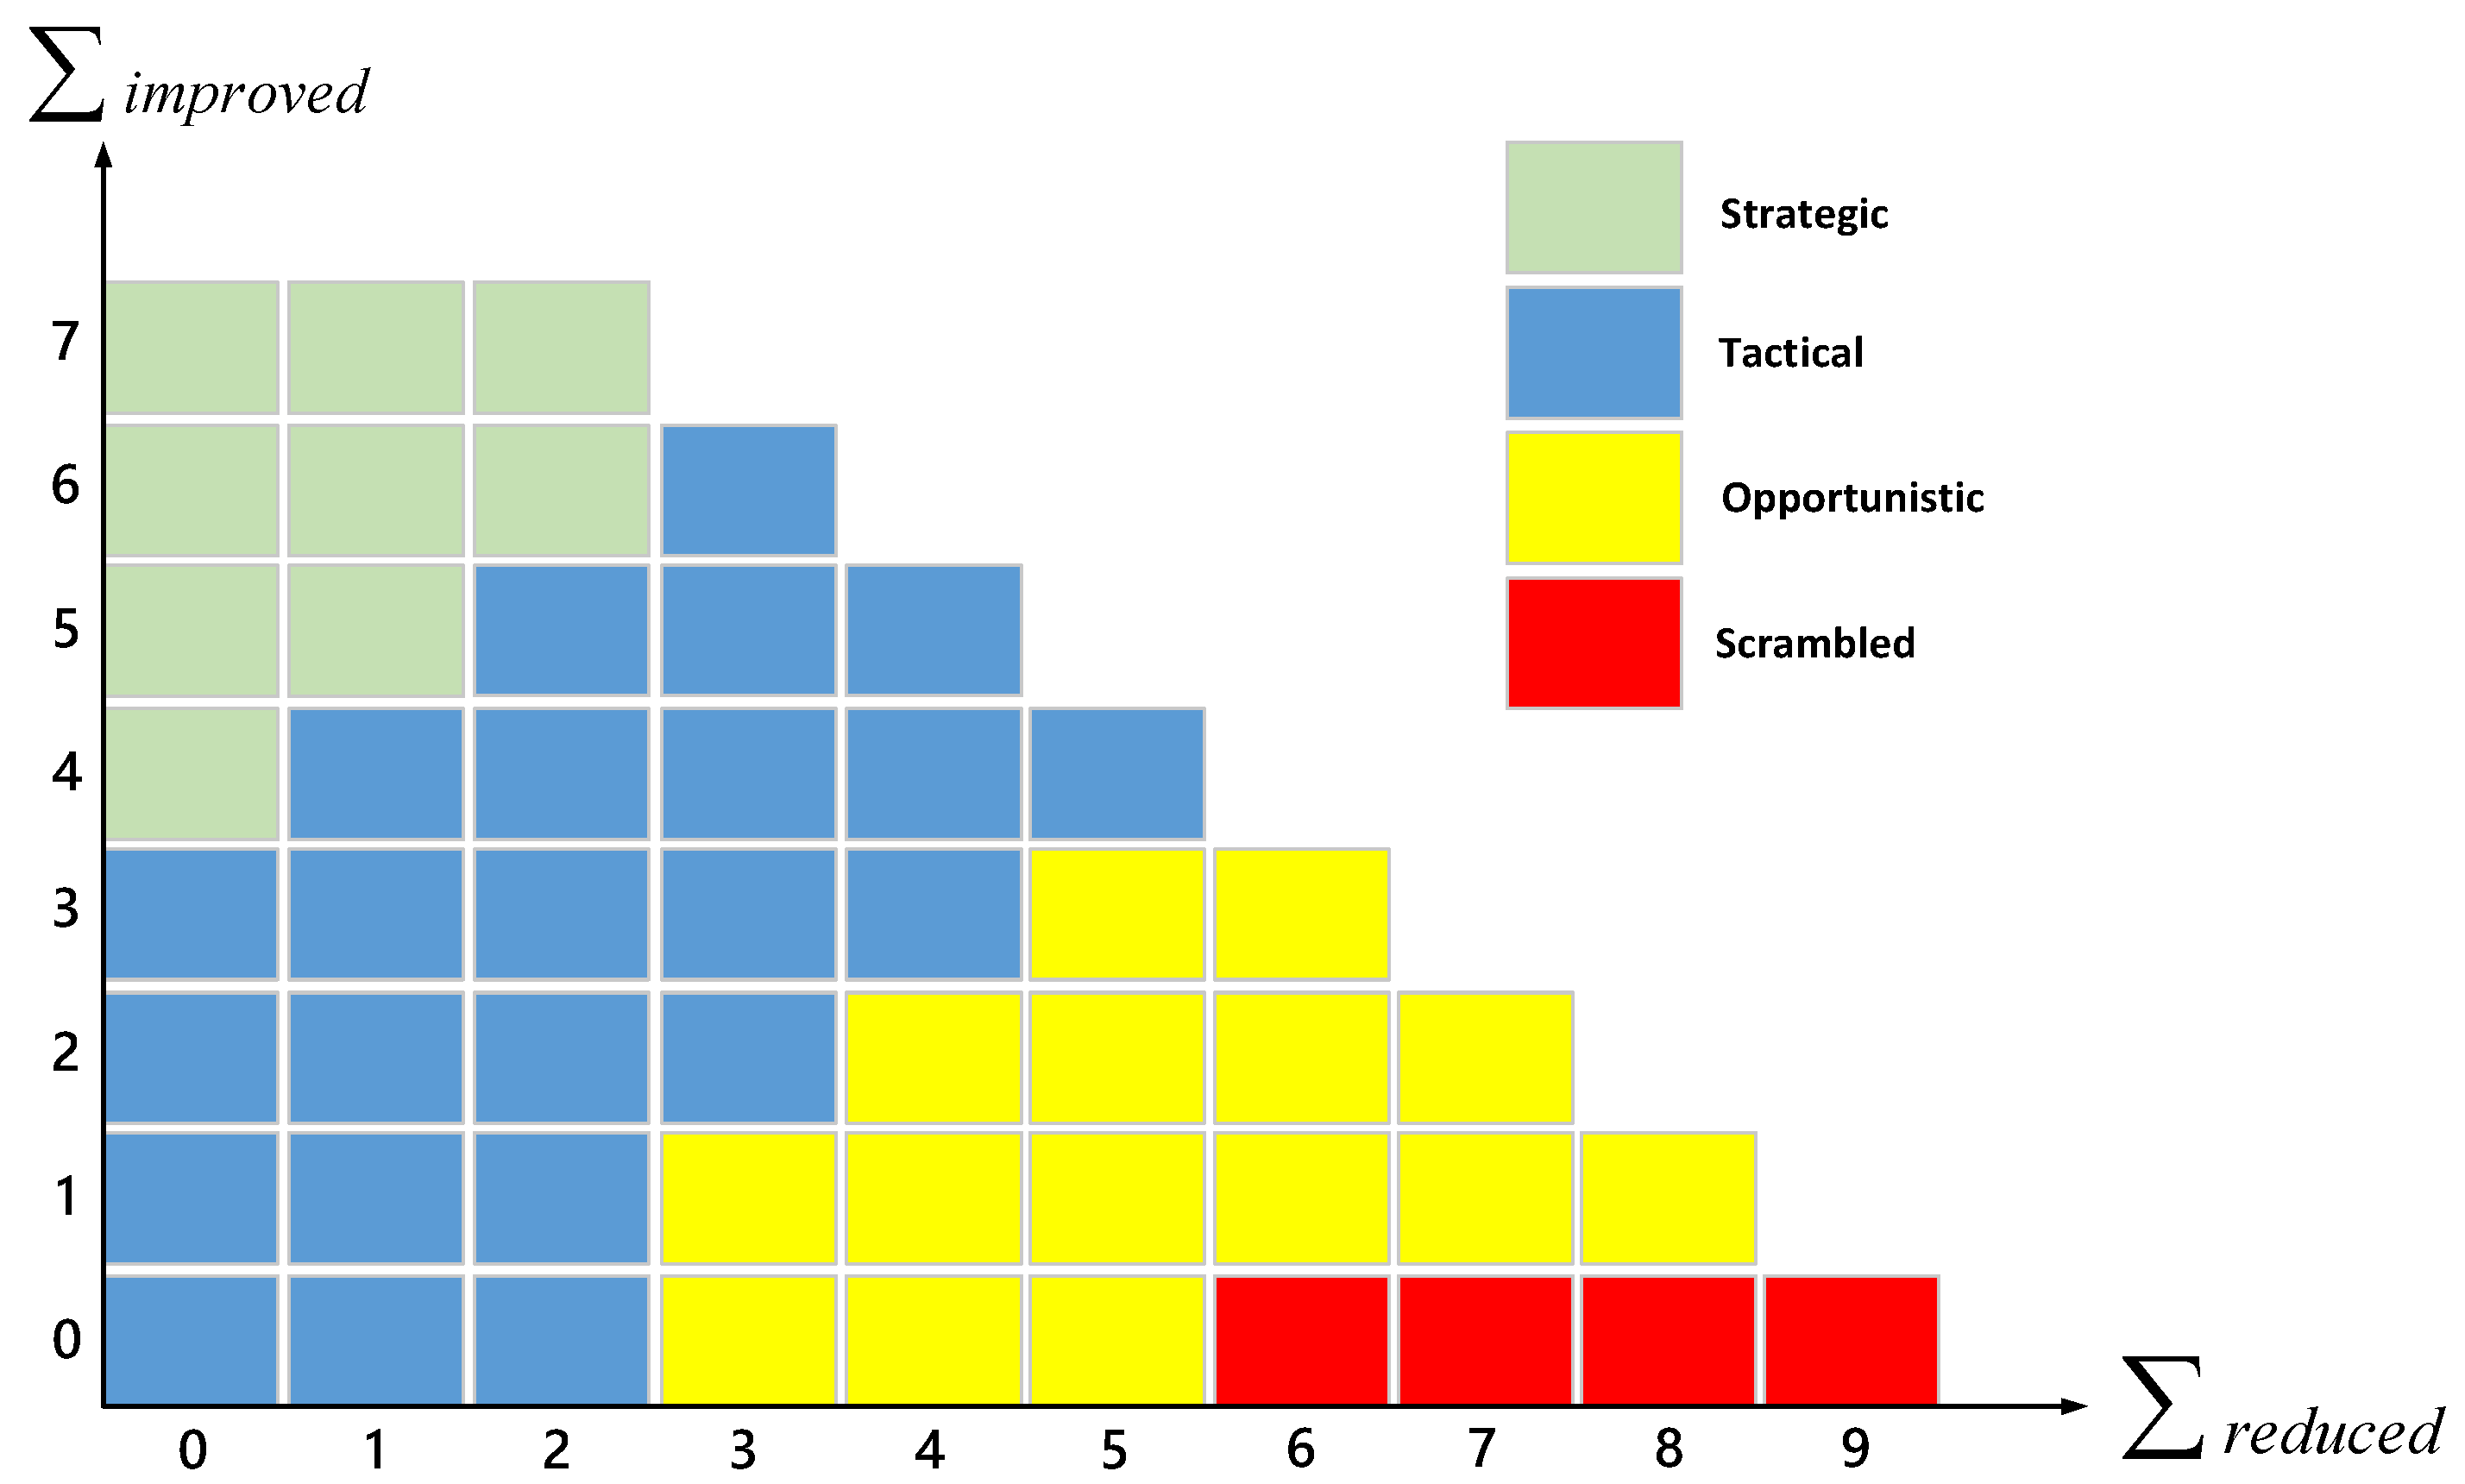
Figure 2 shows the relationship between the CPC and the COCOM. The horizontal and vertical coordinates indicate
and
, respectively.
CREAM calculates human error probabilities in accordance with the COCOM, which has scrambled, opportunistic, tactical, and strategic control modes, each corresponding to an error probability interval.
Table 2 provides error probability intervals under different COCOM modes [
45,
46].
3.2. HTA Method
As shown in
Figure 1, we use the HTA method to build task models for the selected case tasks, and then for human reliability analysis. The HTA task analysis method is used to hierarchically describe task goals and their subgoals, and it is often used to complete task analysis during human reliability analysis. Through structured analysis, this method disassembles the task to determine the goals of main tasks and subtasks. Goals are connected according to the corresponding logical relationship, so as to build the task model.
3.3. Collecting CPC Data Based on Risk Concept
CPC data is collected on the basis of the concept of risk (the combination of possibility and severity), so as to decrease subjective impacts caused by experts who only rate according to their experience. In our study, as shown in
Figure 3, we used a Likert scale to collect the data for each CPC from the aspects of likelihood or severity.
The Likert scale is set from 0.0 to 10.0, indicating possibility or severity of consequences from low to high. In addition, in order to ensure the data quality, the experts invited for collecting risk data in this study all had a master’s degree with at least three years of experience conducting chemical experiments that include risky processes.
3.4. CPC Weight Calculation
As shown in
Figure 1, this research adopted the GRA method to solve the issue of weight differences among the CPCs in each subtask. In accordance with the collected risk data and in combination with the GRA procedure, we built a gray matrix for the collected possibility and severity data, as seen in Equation (2):
The matrix contains m groups of data sequences (, i is the number of experts), each including n data points (, where j is the number of CPCs), and is the gray data for the n CPCs selected for the m experts in the task.
The reference sequence is determined according to
in Equation (2), and it is generally the maximum or minimum data of a sequence. We select the maximum data as Equation (3):
where
is the maximum value of group
n (in this research,
n = 8). The gray relation coefficient of element
k of group
j data in the reference sequence is calculated as Equation (4),
where
is the gray relation coefficient of element
k of group
j data;
and
are the minimum and maximum values, respectively, of the absolute difference between the reference sequence and all comparison sequences;
is element
k in the reference sequence;
is element
k of sequence
j in the decision data; and
is the distinguishing coefficient, where normally we set
. The gray relation degree of data sequence
j is determined as Equation (5),
where
is the gray relation degree of data sequence
j;
is the weight of expert
k (experts have equal weight in this research), where
is calculated by Equation (4). The gray relation degree of each CPC based on the definition of risk in data sequence
j can be obtained by Equation (6),
where
is the gray relation degree of each CPC;
and
are the respective gray relation degrees for possibility and consequences of data sequence
j. The weight data of each CPC corresponding to the sequence
j can be acquired by normalization (
) as Equation (7).
3.5. HEP Calculation
We use risk data as the input to the fuzzy CREAM analytical process. The CPC risk data are acquired by multiplying possibility and severity data. The risk data of each CPC are described by a trapezoidal membership function as Equation (8),
where
is the trapezoidal membership function; y indicates risk data, and
a,
b,
c, and
d are parameters of the fuzzy degree of membership function. Reference is made to the research of Zhang et al. (2018) for the fuzzy degree of membership function in this research [
34], which is used to determine the fuzzy degree of membership for each CPC, to activate If-Then rules to obtain statistics on CPC membership of each subtask, and to determine the COCOM according to Equation (1) and
Figure 2. Then, with the CPC weight data, the initial membership degree of COCOM can be calculated by Equation (9),
where
is the initial membership degree of COCOM;
is calculated using Equation (7),
indicates the fuzzy degree of membership of the nth CPC in subtask
j under If-Then rules, and the fuzzy weight of m types of If-Then rules that exist in subtask
j is calculated as Equation (10),
where
is the fuzzy weight of
m types of If-Then rules that exist in subtask
j;
indicates CPC membership of subtask
j. Then, the COCOM membership of subtask
j is calculated as Equation (11),
where
is the COCOM membership of subtask
j;
and
are calculated using Equations (9) and (10), respectively. The end result of the HEP is acquired according to the Center of Area (COA) defuzzification method as Equation (12),
where
is the common logarithm of the HEP;
z indicates membership of each COCOM,
is the expression of the corresponding COCOM fuzzy degree of membership function, and
and
are the respective upper and lower limits of the membership function.
4. Experimental Verification
We selected the experiment of active ferrous sulfide preparation for model verification. Laboratory supplies include high-risk chemicals, such as sodium sulfide nonahydrate, ethyl alcohol, and ferrous sulfide, and other sources of hazard that can easily cause accidents, including electrical equipment (heating plates, centrifugal machines, and stirrers) and glass apparatuses (beakers and conical flasks). As the experiment has a high risk coefficient with much human–machine interaction, we selected it to verify the proposed model of human reliability analysis in a laboratory.
Through HTA analysis, the goals, tasks, subgoals, and subtasks of the ferrous sulfide preparation experiment were determined, with results as shown in
Table A1 of
Appendix A. According to the results of the HTA analysis, the experiment was divided into 12 main tasks and 26 subtasks. Subtask m of main task
n was defined as “Tn.m.” The data of T10.3 (“checking activity in fume cupboard, quickly pouring samples from vial onto filter paper in a pile, and observing sample combustion or not”) were selected for illustration. As this is a solo experiment, CPC9 (quality of member cooperation) was not considered in the process of analysis. A survey of experts’ decisions was designed on the basis of 26 subtasks and eight CPCs. Four experts with experience in this experiment were invited to make judgements on the CPCs of each task from the perspectives of severity and possibility. Each expert held a master’s degree or above, with sufficient experience in experiments and in the management of ferrous sulfide preparation. They completed the risk data collection of the experiment task with accurate cognition of basic information and experimental risk. Using the subtask T10.3 as an example, four experts’ decision data can be seen in
Table 3. The data for other subtasks can be similarly determined.
Table 3 shows that there were certain differences in their subjective judgments. Therefore, the issue of data incompleteness and non-uniqueness must be addressed. The gray relation degrees of possibility and consequences were calculated by Equations (4) and (5), respectively, and the gray relation degree of risk was calculated by Equation (6). In the end, the GRA weight result of each CPC was acquired after normalization through Equation (7). The gray relation degree weight of each CPC in T10.3 is shown in
Table 4.
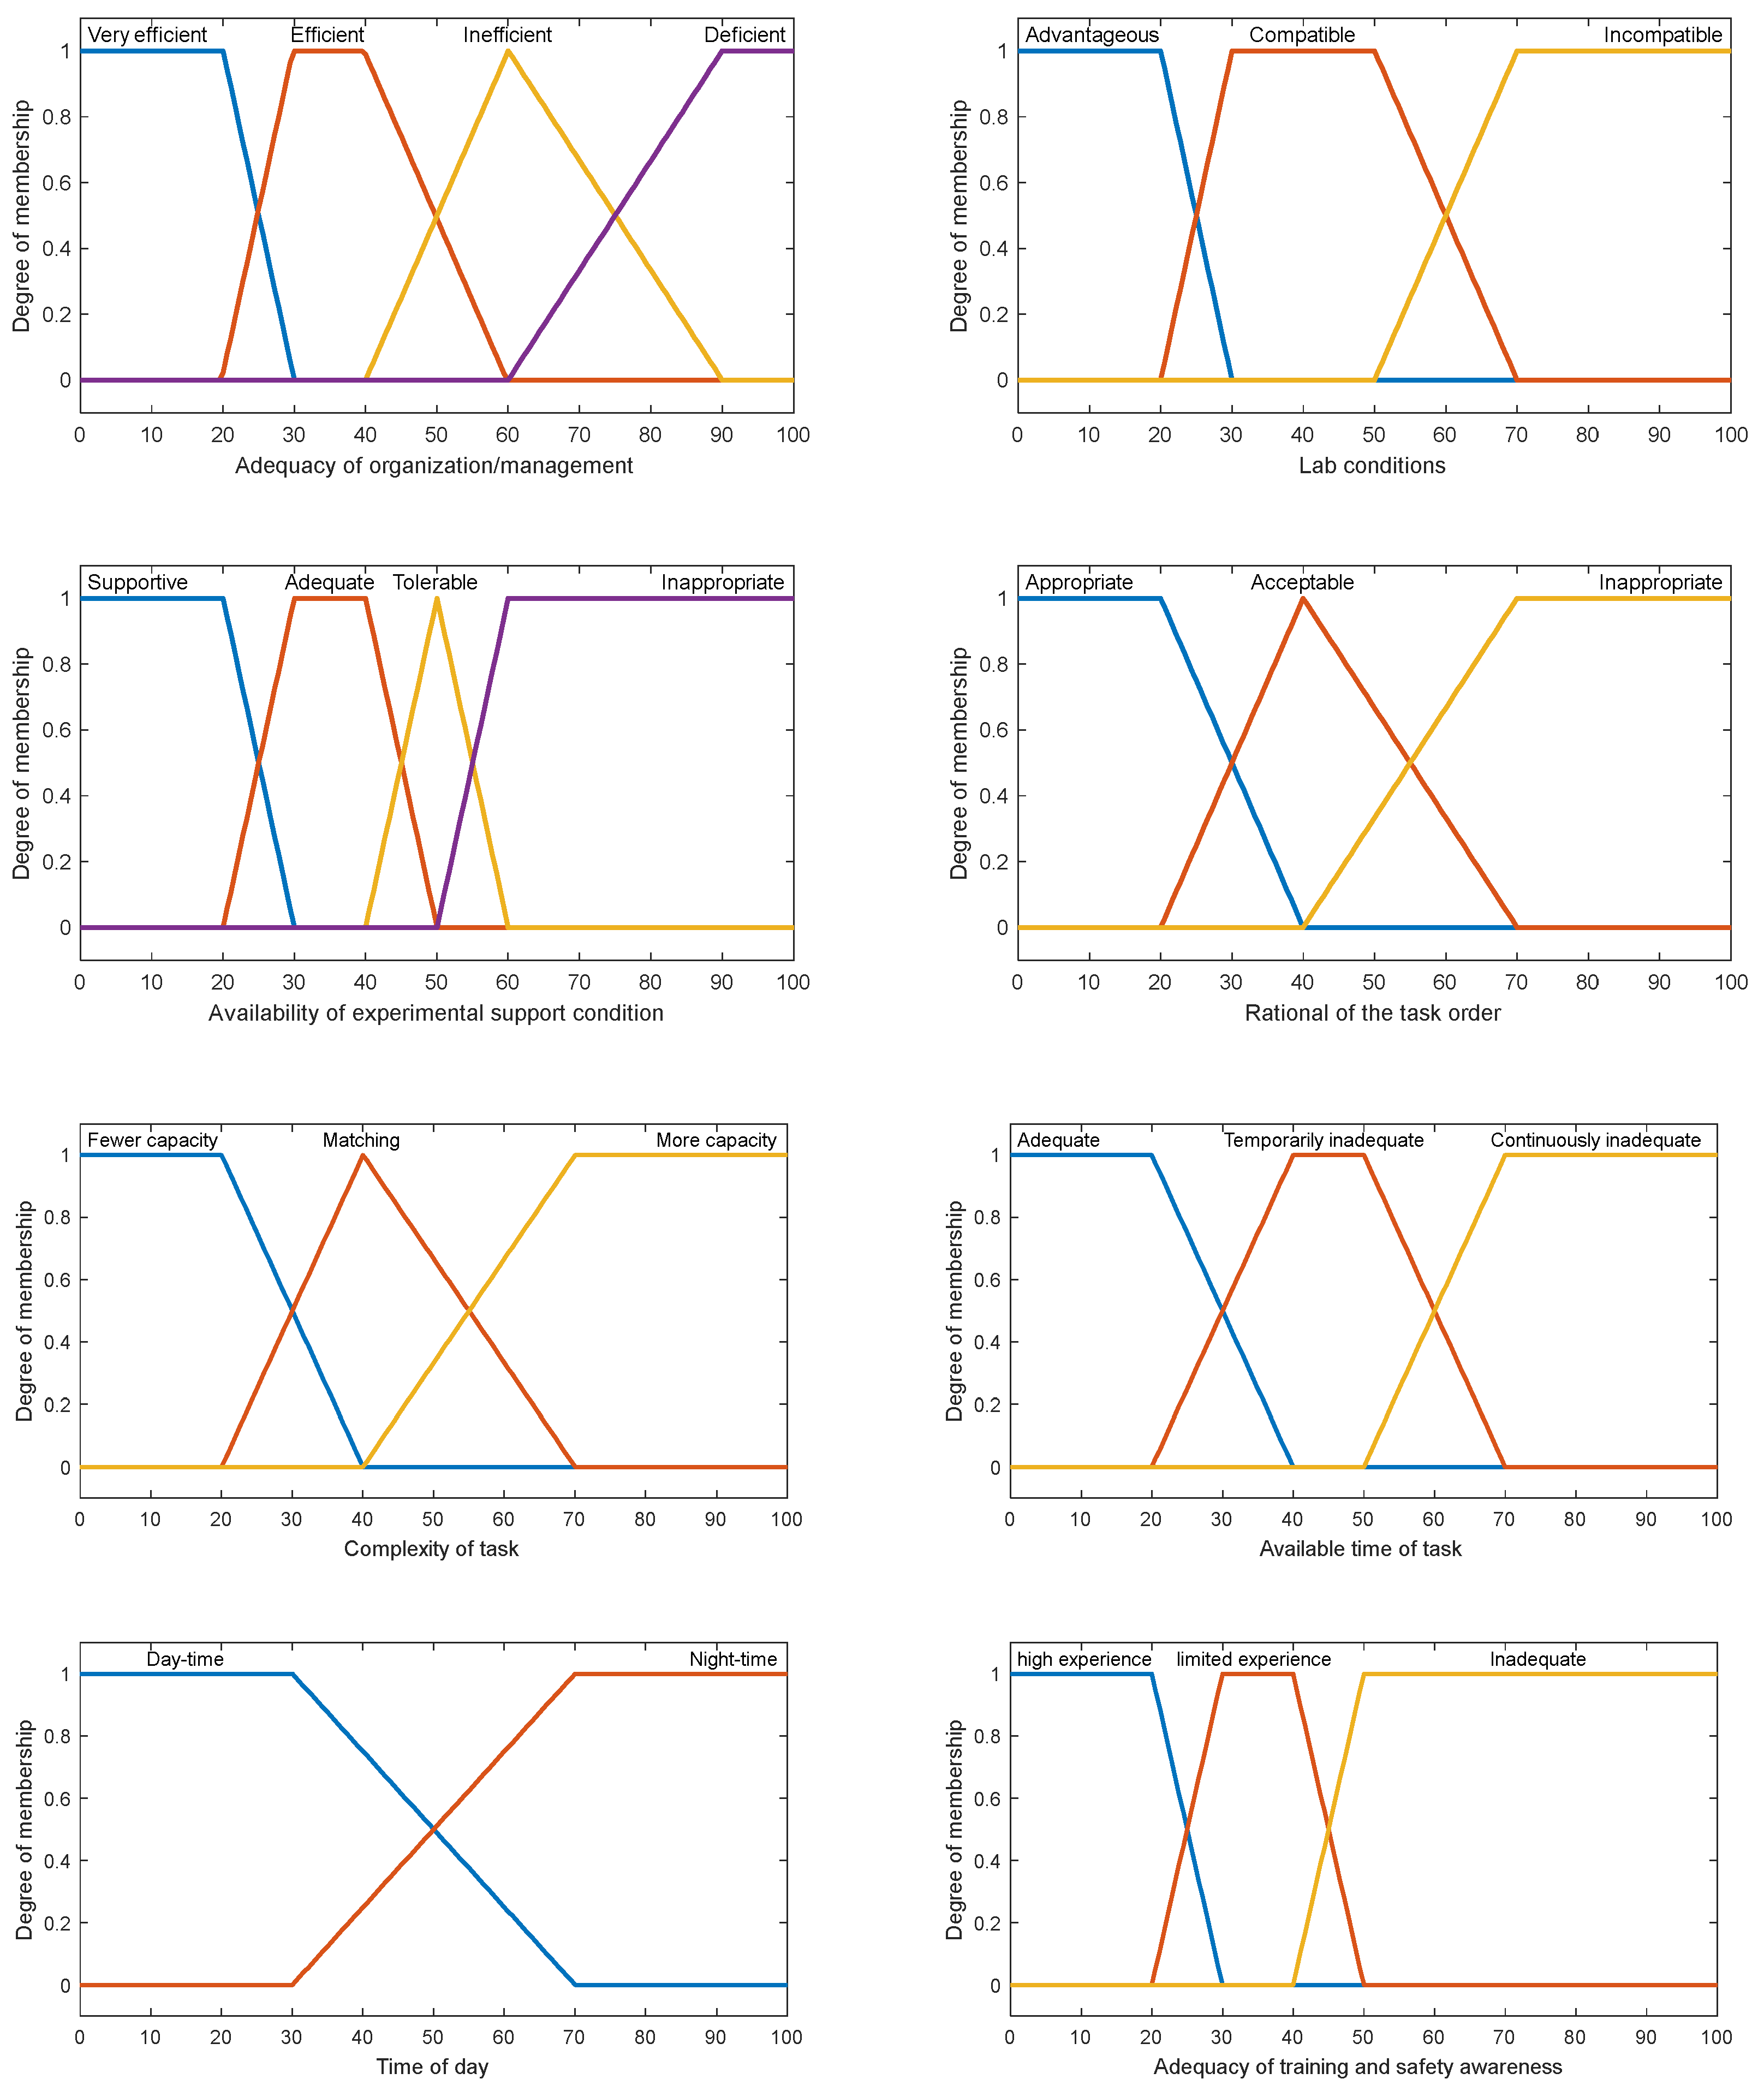
Risk data were brought into the CPC fuzzy degree of membership function. Fuzzy sets and corresponding membership were used to interpret the risk data. The fuzzy degree of membership function was described according to parameters a, b, c, and d in Equation (8) and used to interpret the risk data. For instance, fuzzy sets of CPC1, “adequacy of organization/management system,” are very efficient [a, b, c, d] = [0, 0, 20, 30], efficient [a, b, c, d] = [20, 30, 40, 60], inefficient [a, b, c, d] = [40, 60, 60, 90], or deficient [a, b, c, d] = [60, 90, 100, 100]. All CPC membership functions are shown in
Figure 4.
The data of the fuzzy degree of membership for each task on every CPC were calculated using Equation (8), as seen in
Figure 4. See
Table 5 for the fuzzy degree of membership of T10.3.
It was found that in T10.3, five CPCs cover two levels, so it can activate 25 = 32 If-Then rules to determine the COCOM. One example of an activated If-Then rule is CPC1 is Efficient (0.33), CPC2 is Advantageous (1), CPC3 is Adequate (0.88), CPC4 is Acceptable (0.57), CPC5 is Fewer than capacity (1), CPC6 is Adequate (0.93), CPC 7 is Day-time (1), and CPC8 is Inadequate (0.17).
Based on Equation (9) and the CPC weight data in
Table 4, the initial membership degree of COCOM for T10.3 can be collected. Using the presented If-Then rule as an example, its COCOM degree is: 0.1061
0.33
0.1430
1
0.1959
0.17 = 0.68 with Tactical. Then, as each activated If-Then rule has the rule weight, Equation (10) is selected. Still using the presented If-Then rule as the example, its rule weight is 0.33
1
0.17 = 0.026. For other activated rules, their weights can be determined in the same way. Afterwards, the final membership degree of each COCOM can be collected using Equation (11). Here, using the presented If-Then rule in T10.3 as an example, its final COCOM is 0.68
0.018 = 0.01224 (Tactical). For all activated If-Then rules in T10.3 and other subtasks, their final membership degrees of COCOMs can be calculated similarly.
Table 6 shows the final COCOM degrees.
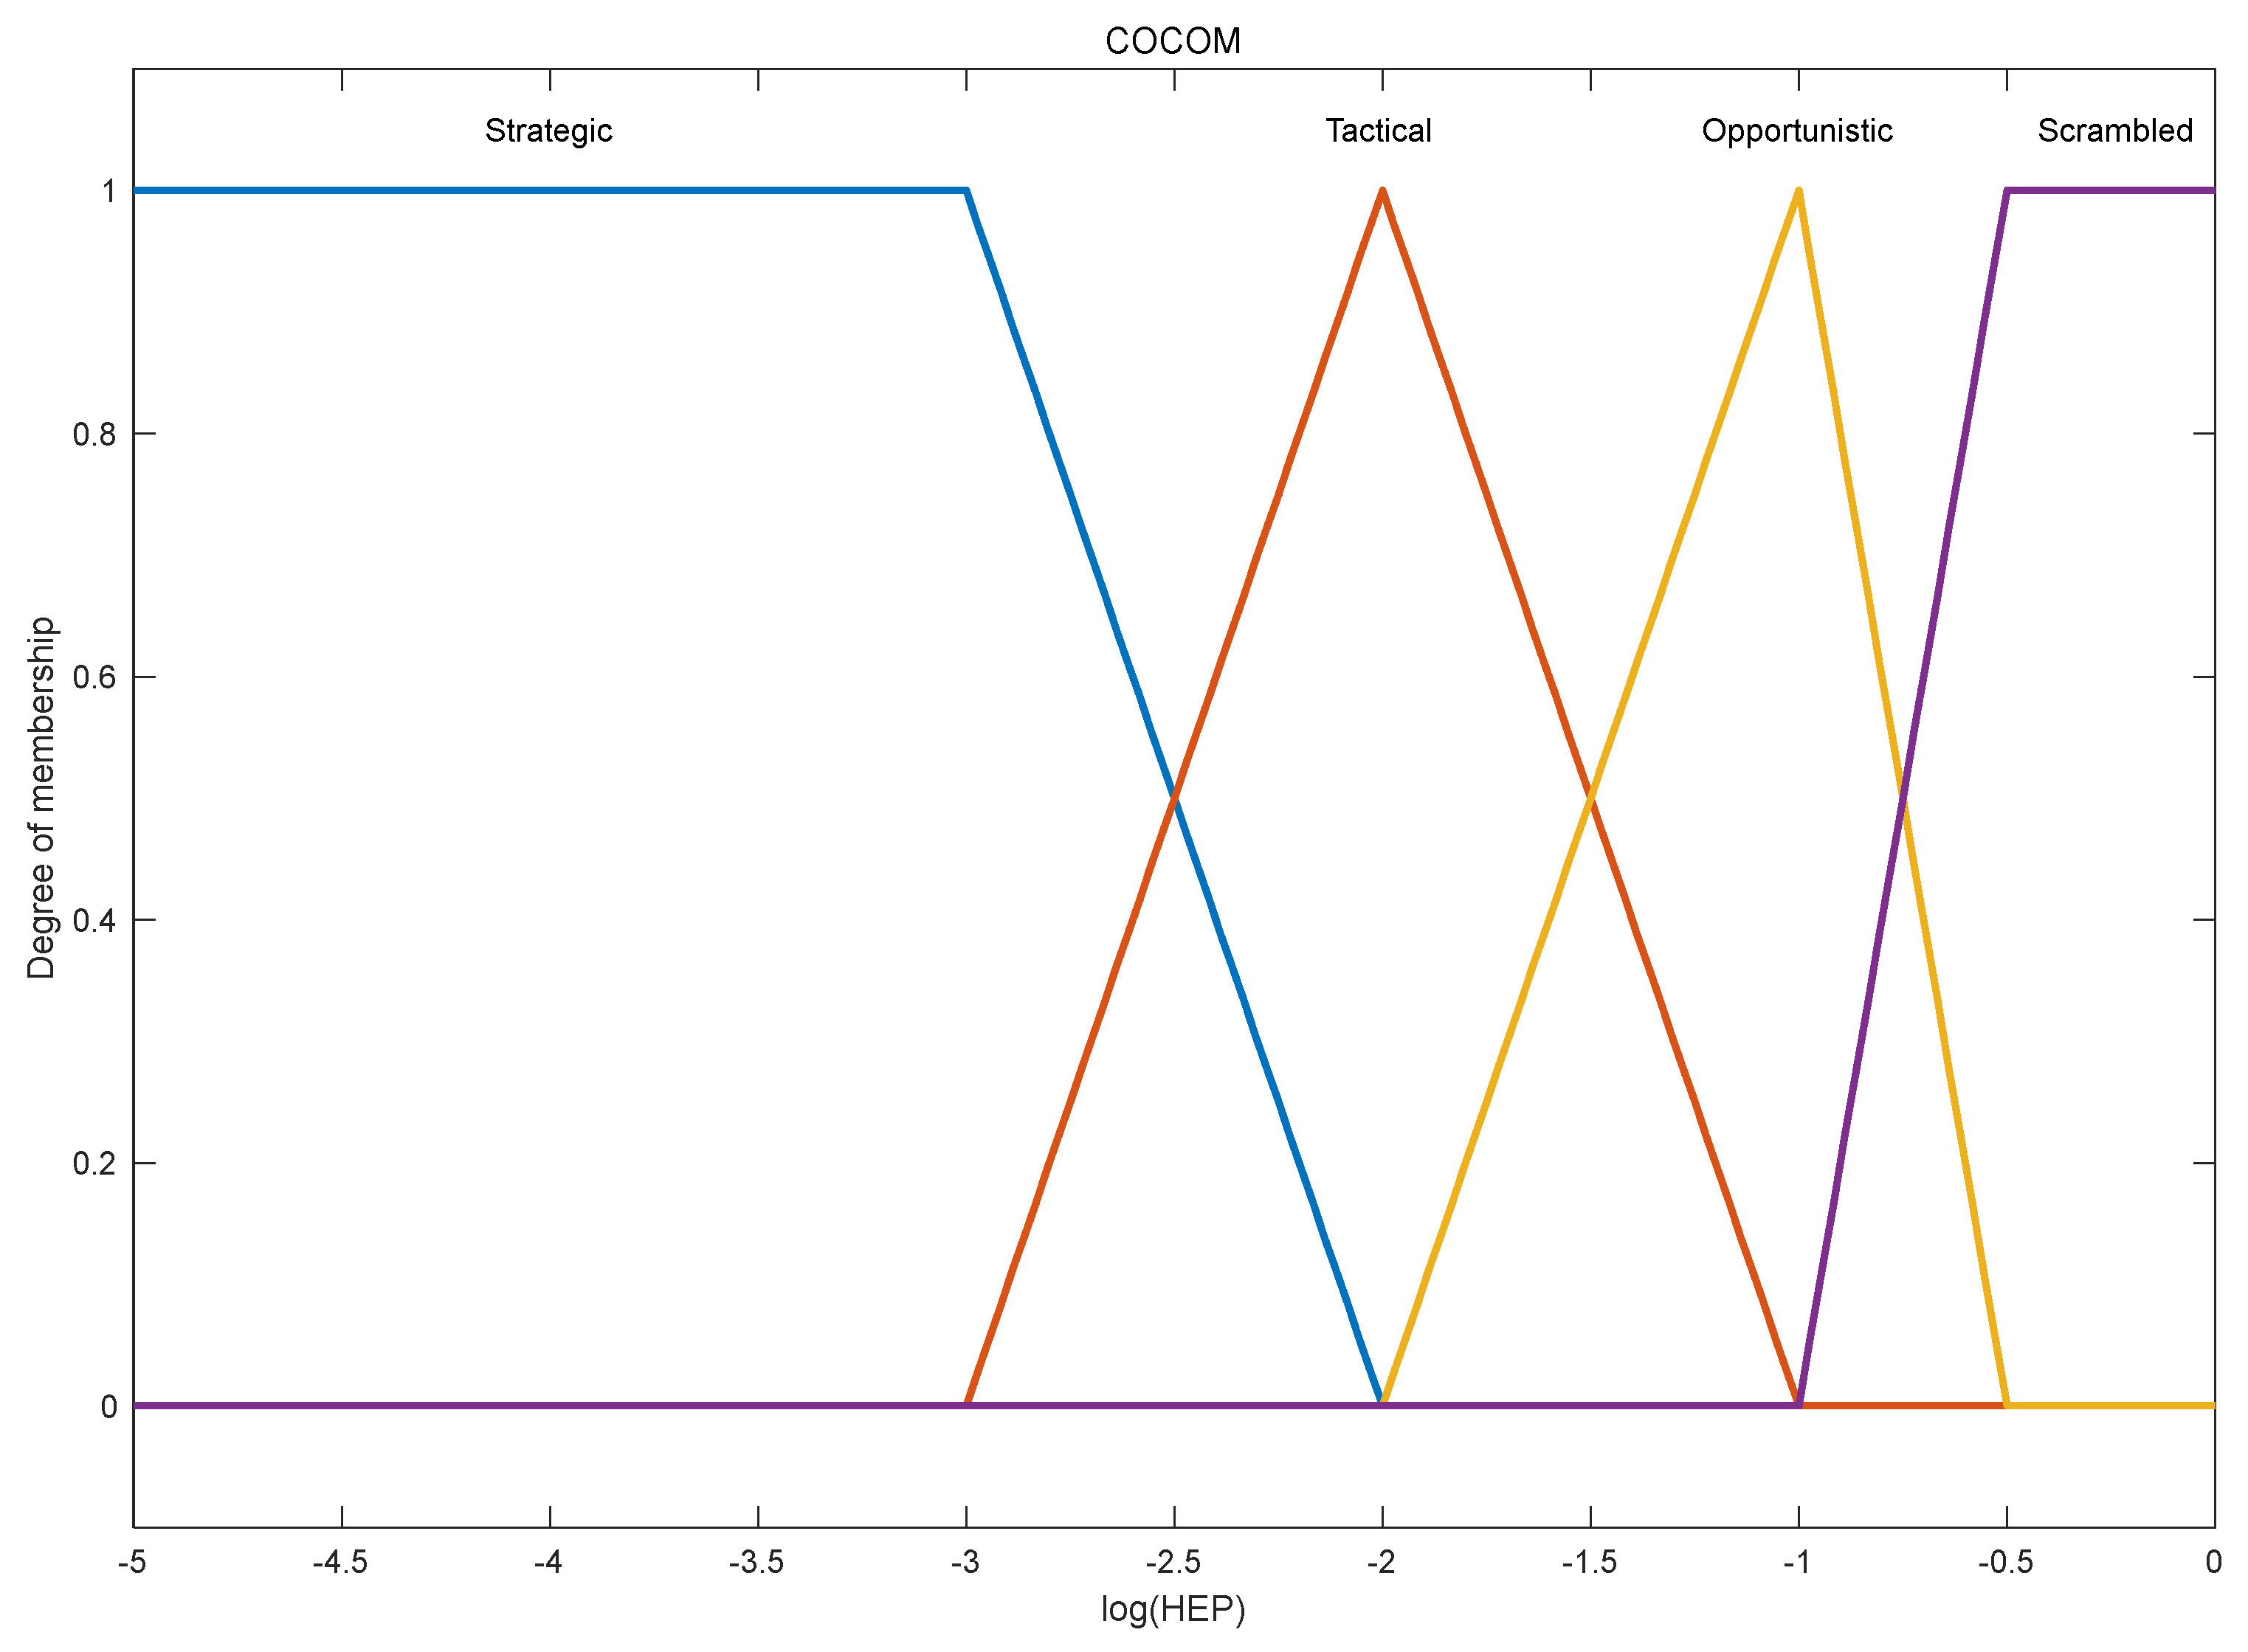
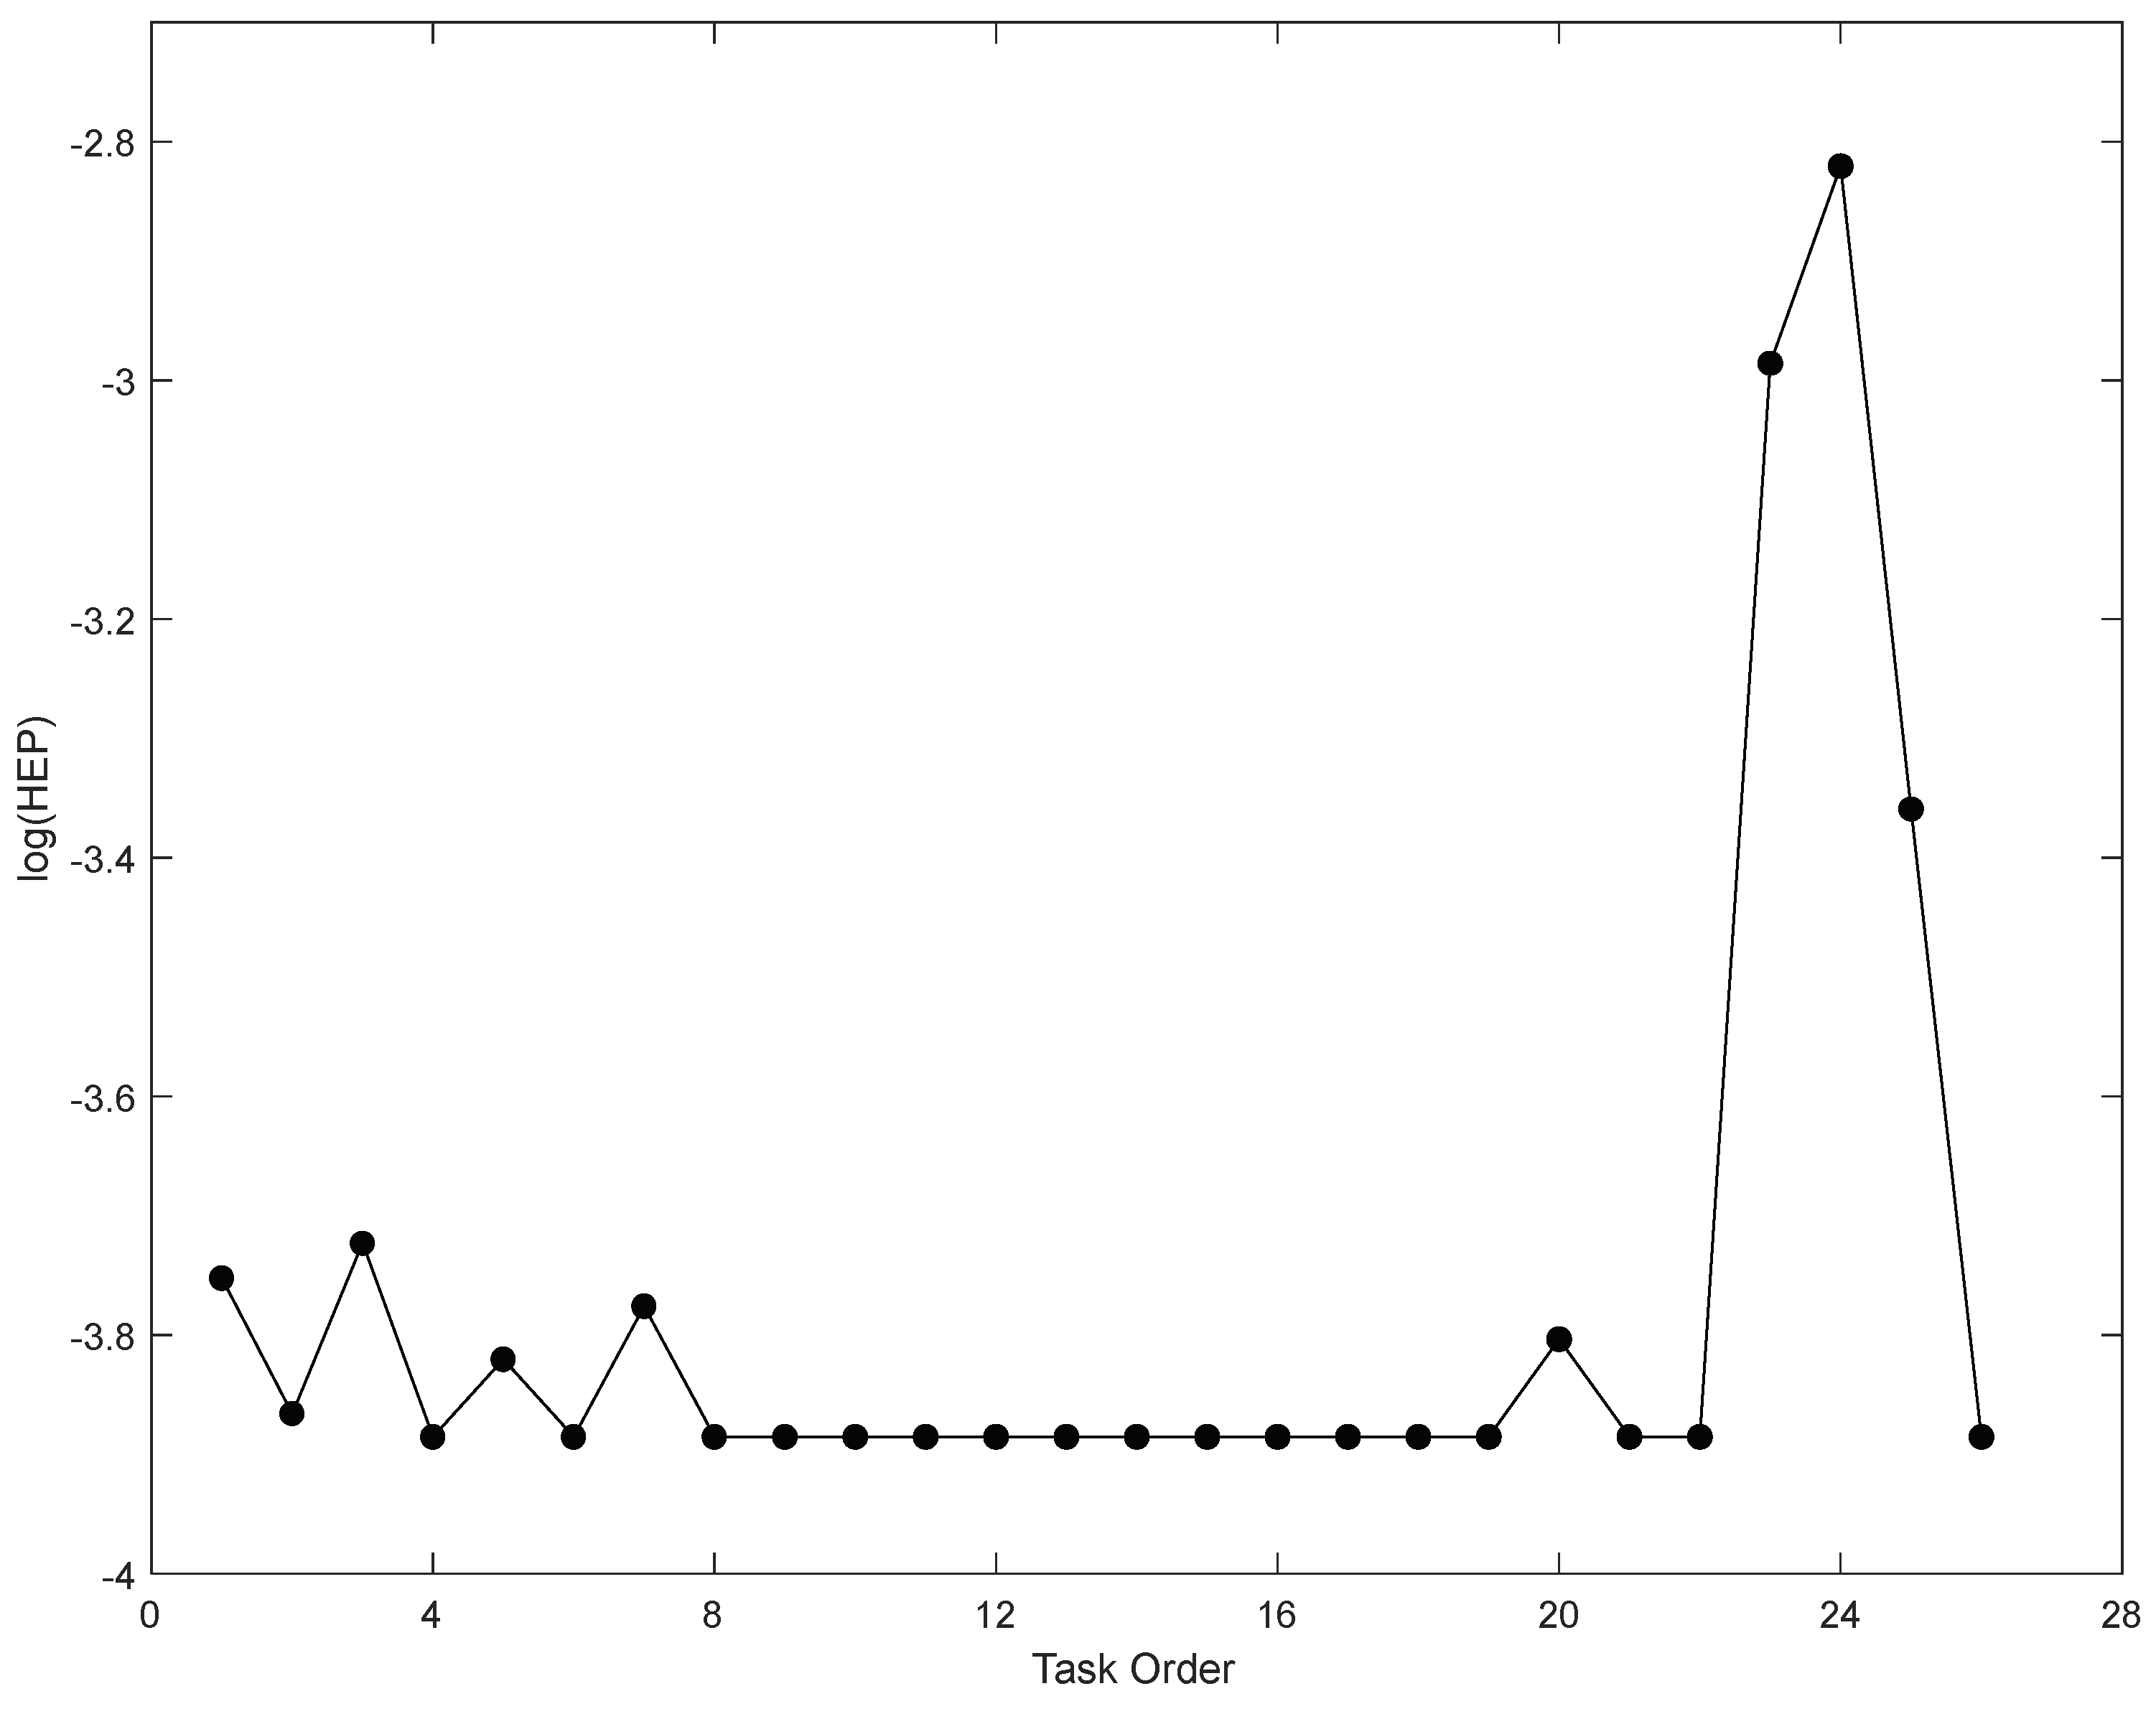
With the final membership degree of each COCOM, we can calculate the corresponding HEP data. According to the HEP interval of each COCOM (see
Table 2), the fuzzy membership functions of each COCOM are shown as
Figure 5. Then, using Equation (12), the HEP of each task was acquired after COA defuzzification and logarithmization, and the corresponding results of each task are shown in
Figure 6.
According to the final results in
Figure 6, the HEP of each subtask can be calculated. The task during which human errors will most likely appear in this experiment is T11.1 (“The liquid after separation, the liquid after water washing, and the liquid after alcohol washing need to be put into the corresponding waste bucket”) with HEP = 1.51
10
−3. For the HEPs for other subtasks,
Table A1 in the
Appendix A gives their results.
Overall, the HEPs of subtasks T10.3, T11.1, and T11.2 were the top three highest. These subtasks not only have sources of hazards with high risk but are also involved in the complicated procedure of combustion and waste disposal. In addition, the HEPs of subtasks T1.1, T2.1, T3.1, T4.1, and T9.2 were moderately high. In these tasks, there are sources of hazard with high risk, such as heating plates, sodium sulfide, and ammonium ferrous sulfate, as well as many human–machine interaction activities. It also is found that the HEPs in other subtasks are low, and that those subtasks have fewer sources of hazards and low complexity of human operation. The results of human reliability analysis conform to the human error situation of this experiment, so the proposed model has effective results.
5. Discussion
According to the description above, it can be seen that the method provided by this study is applicable and effective for HEP estimation for chemical experiments that contain hazardous processes. This method has attempted to consider the characteristics of chemical experiment processes, so as to provide some modifications for the nine CPCs in CREAM. Moreover, based on the definition of risk, this proposed method uses the risk data of each CPC for further calculating the CPCs’ fuzzy degrees, the CPCs’ weights, and If-Then rule weights. Through this method, experts can judge each CPC from more dimensions (possibility and severity), rather than just experts’ subjective judgments. In addition, compared with many previous publications, this study designs a fuzzy operating approach that can absorb the influence of CPCs’ degrees, CPCs’ weights, and If-Then rule weights together during HEP calculation.
However, this study still has limitations. Although some changes have been made to the nine CPCs, more considerations are still required to make sure each CPC is suitable to describe the characteristics of dangerous chemical experiment processes. Using risk data instead of traditional fuzzy data can increase data credibility and decrease subjectivity, but the uncertainty issues are still existing, so some data processing methods should be involved to decrease the uncertainty level of the risk data. Furthermore, software should be designed to allow the whole method to be conducted and presented by computer. In summary, the proposed method is an effective attempt to deal with human-related safety issues for risky chemical experiments, but more specific efforts are still necessary.
6. Conclusions
This study provides an effective method to estimate the HEPs for chemical experiments with hazardous processes. The proposed approach firstly adjusts nine CPCs to make sure they can match the characteristics of chemical experiments. Next, for improving the rationality and for reducing the subjectivity of the CPC data, the method uses the definition of risk as the support to collect data to express the performance level of each CPC. Then, this study innovatively chooses those collected risk data as the basis to directly and indirectly determine the CPCs’ fuzzy degrees, the CPCs’ weight values, and the weight value of each activated If-Then rule by fuzzy membership function, GRA, and fuzzy calculation. Afterwards, this method combines the CPC’s degree, the CPC’s weight, and the If-Then rule weight together by using fuzzy calculating operator to determine the final fuzzy degree of each COCOM. Finally, the COA method is selected to give defuzzification to the COCOM’s fuzzy degrees for assessing the HEP results. Those together form the risk-data-based HRA method for operation safety during chemical experiments.
Based on the analysis results, we verified that the model can calculate the HEP of the experiment of the selected test case, “active ferrous sulfide preparation”. With the proposed method, the highest HEP was 1.51 × 10⁻³ for the subtask “The liquid after separation, the liquid after water washing, and the liquid after alcohol washing need to be put into the corresponding waste bucket”. Therefore, some appropriate measures should be taken. For instance, setting up a risk identifier to remind everyone involved in the dangerous experiment of safety awareness and to ask them to be in compliance with experimental regulations; setting up a work safety checklist to make sure the correct operations are carried out; and assigning a staff member to supervise safety when carrying out an experiment that has risky processes.
Through the approach designed in this research, quantitative human error data can be acquired to enhance people’s awareness of human risk and improve laboratory management. Meanwhile, it can help the management team to prevent human error and reduce unsafe behavior in a more targeted way. However, some further development of this method is still required. The design of the CPCs for chemical experiments with hazardous processes should be deeply analyzed to ensure they are closely related to the task processes and task characteristics. Additionally, the source data used in this study still have a level of uncertainty, so solutions such as type-II fuzzy membership function can be selected to replace traditional fuzzy membership function for HEP estimation in the future.


