Article

Grinding Characteristics of New Varieties of Winter Triticale Grain

1
Department of Thermal Technology and Food Process Engineering, University of Life Sciences in Lublin, 31 Głęboka St., 20-612 Lublin, Poland
2
Department of Animal Production, College of Agriculture, Al-Qasim Green University, Babylon 51001, Iraq
3
Institute of Genetics, Plant Breeding and Biotechnology, Faculty of Agrobioengineering, University of Life Sciences in Lublin, 15 Akademicka St., 20-950 Lublin, Poland
*
Author to whom correspondence should be addressed.
Processes 2023, 11(5), 1477; https://doi.org/10.3390/pr11051477
Submission received: 18 March 2023 / Revised: 6 May 2023 / Accepted: 9 May 2023 / Published: 12 May 2023

Abstract

:
Triticale (× Triticosecale Wittmack), developed by crossing rye and wheat, is increasingly applied in food production. The aim of this paper was to study the grinding process of eight new triticale grain (TG) varieties harvested in 2020 and 2021. TG was tempered to 12% of moisture and a knife mill was used for the size reduction. The following parameters characterizing the grinding process of TG were determined: specific grinding energy, Sokołowski grinding index, particle size distribution and average particle size. Additionally, the basic chemical composition, total phenolic content and antiradical activity of TG were determined. The protein content of TG was strongly influenced both by the variety and harvesting year, while other components were mostly affected by the genetic factor. The strongest influence on the grinding indices has a variety of TG. Specific grinding energy varied in the range of 14.0 kJ kg−1–17.8 kJ kg−1 and was positively correlated with the size of ground particles. Especially, the grain of Belcanto required lower grinding energy requirements and showed the strongest antioxidant capacity compared with other varieties of TG.

1. Introduction

Triticale (×Triticosecale Wittmack × A. Camus) is a hybrid grain produced by crossing wheat and rye. It is a cereal created to combine the high yield and quality of wheat with the disease resistance and durability of rye [1,2]. This cereal is grown on approximately 3.5 million hectares of land worldwide [3]. The top producers of triticale are European countries (Poland, Germany, Belarus, France, and Russia) and China [4]. The majority of the world’s triticale cultivation (70–80%) is taken up by Polish triticale varieties [3]. This cereal is high-yielding, but with a lower flour milling extraction rate than wheat grain [5]. Due to its beneficial effects on health and a good balance of essential amino acids, vitamins, and bioactive components, triticale grain can contribute to the expanding market for healthy foods [6]. Triticale production has been rising globally during the past few years [4].
Compared with wheat, triticale grain (TG) has a similar chemical composition, however, with higher contents of total carbohydrates, ash, lipids, polyphenols, minerals, vitamins and fiber [7,8]. Additionally, TG has a superior mineral balance and a higher concentration of lysine when compared to wheat [9]. Ferulic, coumaric, protocatechuic, sinapic and gallic acids are the main phenolic acids present in TG, and they were primarily in bound form (>90%) [10,11].
Although TG is mainly used as animal feed, recently researchers and manufacturers pay more and more attention to the usage of this cereal in various food-related industries. The use of triticale flour as a raw material in the place of wheat flour is promising. This flour can be used to create a variety of food and beverage products including bread [12], cookies [4], pasta [13], malt [14] cereal bars [15], ethanol [16] and edible films [17].
Grinding is a crucial unit operation in cereal processing. It has a major impact on the properties and nutritional value of flour production. The functional properties of flour depend both on the chemical composition of the grain and the milling technique [18]. Especially particle size distribution determines the functionality of the quality of the final product [19]. Many papers focused on the grinding process of wheat. However, in relation to triticale, only a few works deal with this topic and these papers were mainly focused on roller milling of TG and white flour production. TG is rather preferred for whole-meal flour production because the white flour yield of TG is significantly lower (from 7.1 to 10.1%) compared with wheat. Especially, TG with hard endosperm had a low white flour extraction ratio [20].
Warechowska et al. [21] found that increasing the level of fertilization caused a decrease in milling energy and an increase in the mean particle size. Other authors demonstrated that the grain size of triticale is positively correlated with flour yield and particle size distribution [22]. Whereas Dennett and Trethowan [20] found a negative correlation between milling yield and the moisture content of triticale grain. This work aimed to study the effect of variety and the year of harvesting on grinding characteristics, basic composition and antioxidant activity of TG.

2. Materials and Methods

2.1. Raw Material

The research material consisted of eight Polish varieties of winter triticale. Five of them came from the breeding company DANKO Plant Breeding Sp. z o.o. (Choryń, Poland) and three from Plant Breeding Strzelce Sp. z o.o. IHAR Group (Strzelce, Poland) (Table 1). These varieties are collected in the Polish gene bank in a collection kept by the Institute of Genetics, Breeding and Plant Biotechnology.
The Polish varieties of winter triticale (×Triticosecale Wittm. × A. Camus) were examined in the years 2020 and 2021. The experiments were carried out on the experimental fields of the University of Life Sciences in Lublin on the Lublin Upland in Czesławice near Nałęczów (51 18′ N. 22 14′ E. alt. 210 m asl) in soil developed from loess according to WRB (IUSS. 2006) classified as Haplic Luvisol. The forecrop for the winter triticale varieties in both years was potatoes. Basic cultivation was conducted and the mineral fertilization was applied in the amount of N: N: 60 kg ha−1. P2O5: 80 kg ha−1 and K2O: 100 kg ha−1. The chemical weed control was also carried out using spring spraying with Chwastox Extra 300 SC and additionally manual care of plots. Meteorological data on the course of weather conditions in the growing season 2019–2020 and 2020/2021, giving average decadal and average monthly air temperatures as well as decadal and monthly rainfall totals in individual years of research in Czesławice were collected. The distribution of average monthly air temperatures and rainfall totals in the analyzed growing seasons was presented in the form of a climatogram (Supplementary Materials).
The varieties were sown in autumn 2019 and 2020 on individual 5-row and 2 m long plots. Manual sowing was applied on 2 m2 plots, with 20 cm row spacing and 2 cm plant distance in a row. The sowing density was approximately 300 seeds per square meter. Due to a partial allogamy of triticale, each year several spikes were isolated to preserve the identity of the objects. The seed obtained from isolated spikes was sown in the next vegetation season.

2.2. Analitycal Methods

2.2.1. Basic Chemical Composition

Moisture content, ash content, protein content, crude fibre content and fat content were determined using the AACC methods [23]: Method 44-15.02, Method 08-01.01, Method 46-10.01 (Nx6.25) and Method 30-10.01, respectively, and expressed per gram of dry mass (dm) of the sample. The content of available carbohydrates was calculated by subtracting the sum of the other components from 100.

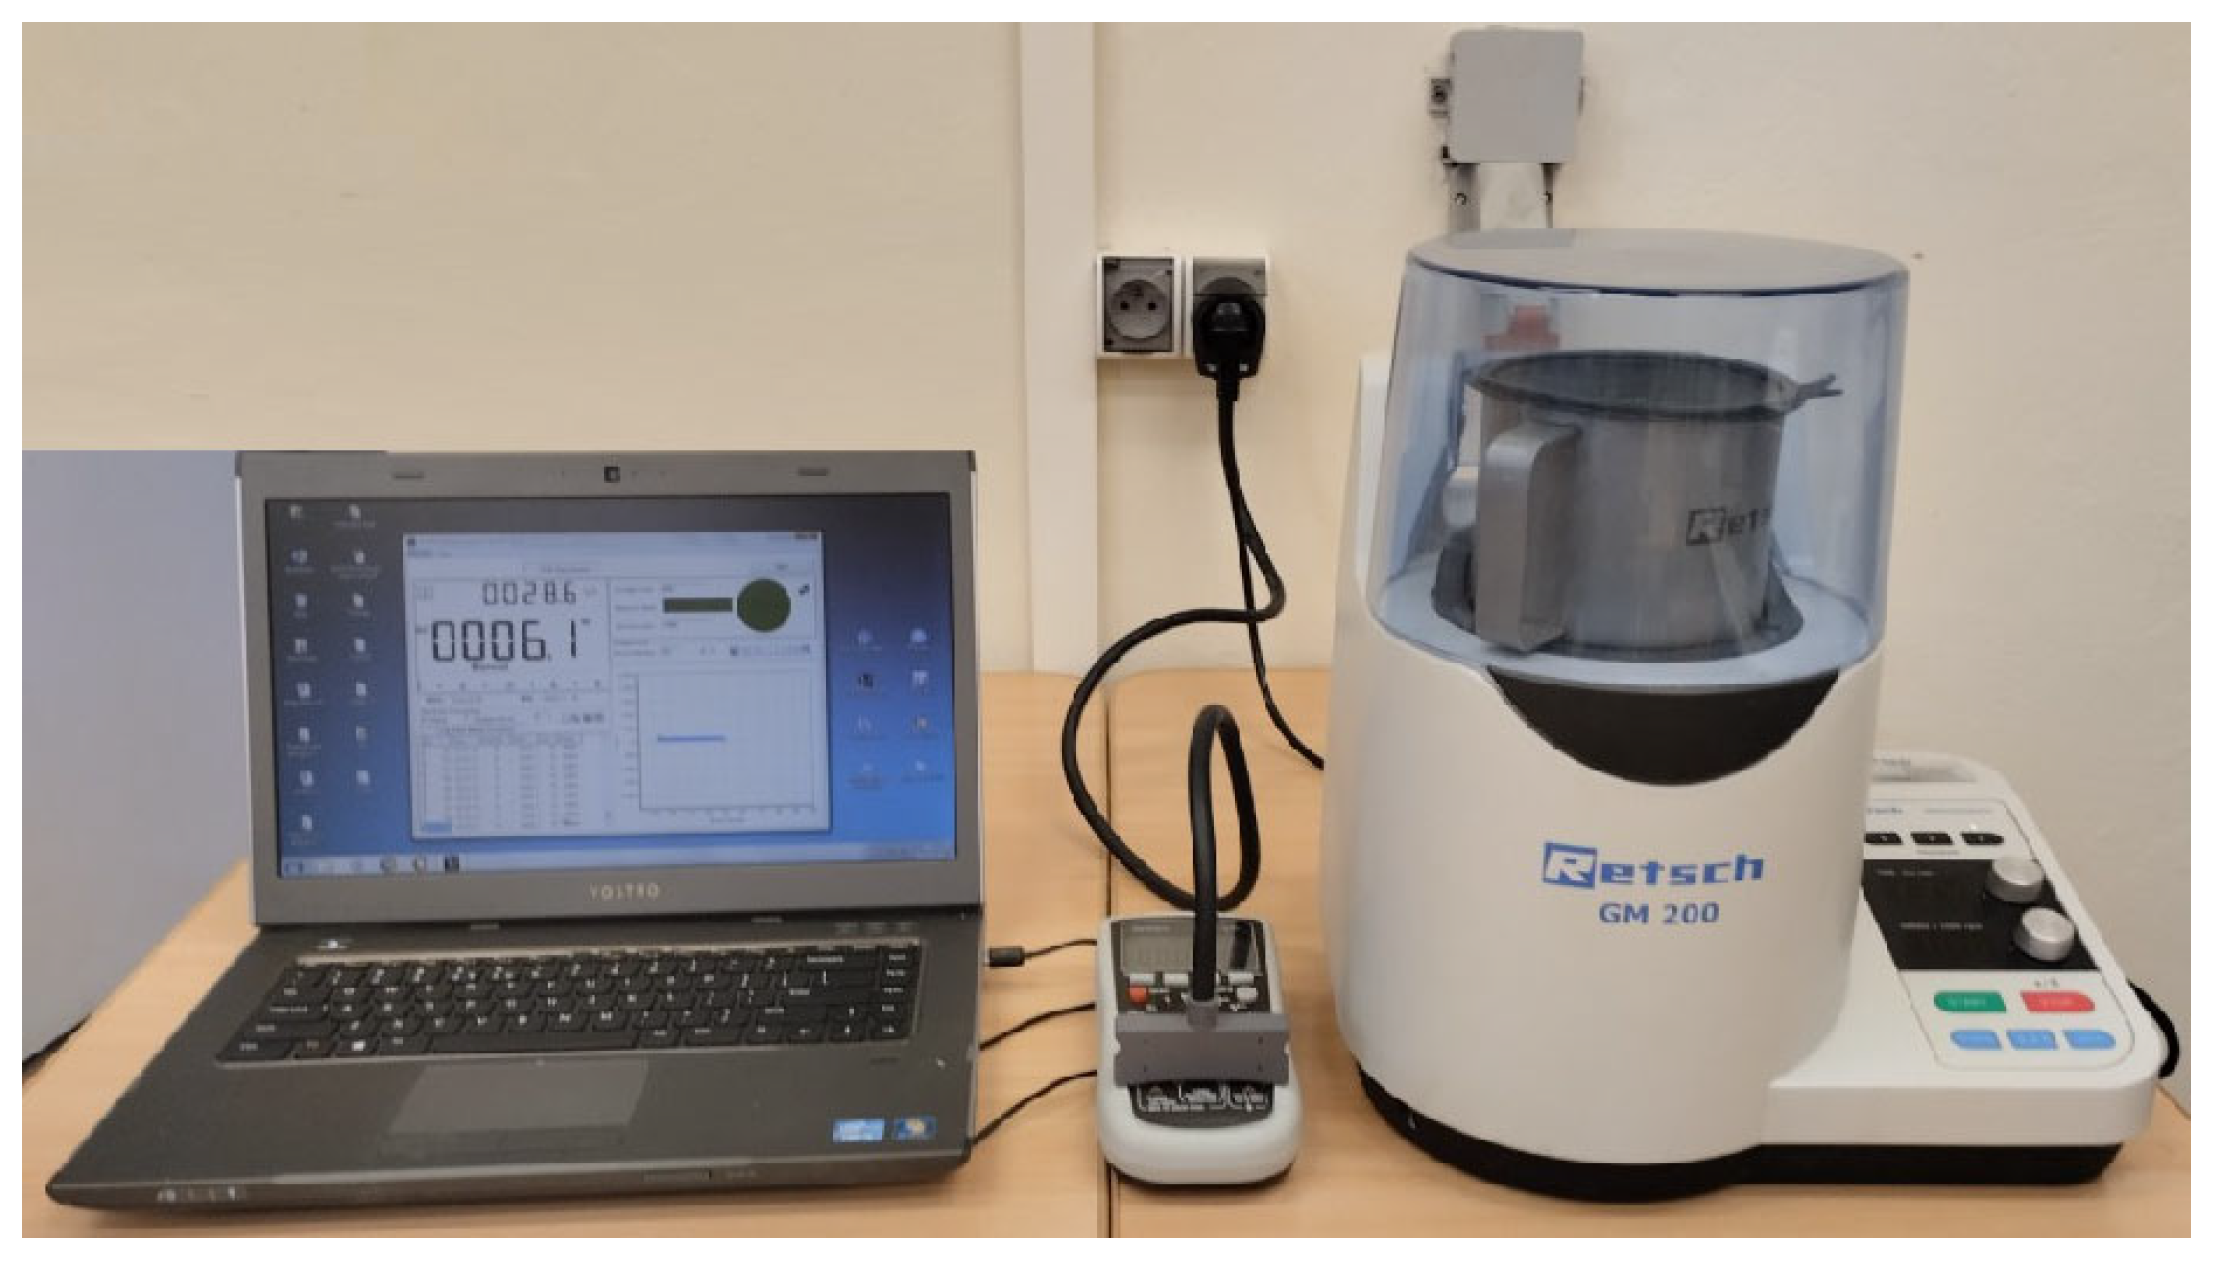
2.2.2. Grinding Process

TG was tempered by either drying at 35 °C or by adding water to adjust moisture content to 12% (w.b.) and was then stored for 24 h prior to size reduction. The grinding procedure was performed according to the method described by Hassoon et al. [18]. The samples of triticale (50 g) were milled using the GRINDOMIX GM-200 mill (Retsch, Haan, Germany) at a speed of 10,000 rpm. The mill was equipped with a digital multimeter (VC 870, VOLTCRAFT®, Wollerau, Germany) that measured the power of the electric current with an accuracy of 0.1% (according to producer data). The multimeter was connected to a computer that was equipped with a special program (VC870 Interface 4.2.6., VOLTCRAFT®, Wollerau, Germany) to record changes in electric power during grinding (Figure 1). Firstly, the energy of idle running was recorded. Secondly, a sample of grain was placed into the grinding chamber, and the total grinding energy (Et) was recorded. The grinding time for each sample was set at 3 min.
The grinding energy (Eg) was calculated as the difference between the total grinding energy (Et) and the energy lost during idle running (Ei):
E g = E t E i   J
The specific grinding energy (Es) was computed as a ratio of Eg to the mass of ground TG.
After size reduction, the particle size distribution was determined using AS 200 sieve shaker (Retsch, Haan, Germany). The shaker was equipped with sieves with hole sizes of 0.1, 0.2, 0.4, 0.6, 0.8, and 1.0 mm. Based on the sieve analysis the particle size (ds) of ground TG was calculated [24]:
d s = Φ i d i   mm
where Φ is the differential weight fraction of particles passing through the sieve size di.
Additionally, the grinding index (Si) was determined based on the grinding theory described by Sokołowski [25]:
S i = Er 1 d s 1 d i   ( J   kg 1   mm 0.5 )
where di and ds represent the average particle size of TG before and after grinding, respectively. di was calculated according to the procedure described by [26].

2.2.3. Phenolic Content and Antioxidant Capacity

To determine the total phenolics content (PC) and antioxidant capacity (AC) of TG the methanolic extracts (methanol:water. 1:1. v/v) were prepared [27]. TPC was determined using the Folin–Ciocalteu method [28]. AC against ABTS radicals (antiradical activity) was determined using a plate spectrophotometer (Model Epoch2TC, S/N 15120115, Aligent BioTek, Santa Clara, CA, USA). The antiradical activity was determined as described by Re et al. [29] with slight modification [27] and expressed as EC50 index (extract concentration necessary to obtain a 50% antioxidant effect) [30].

2.2.4. Statistical Analysis

All analyses were performed in three replicates. Comparisons among groups were carried out using a two-way analysis of variance and homogeneous groups were compared using Tukey’s test. Moreover, Pearson’s correlation coefficients were determined. Statistical 13.1 program (StatSoft. Inc., Tulsa, OK, USA) was used to conduct all statistical calculations. The significance level of α was established at 0.05.

3. Results and Discussion

3.1. Basic Composition

The protein content in grain was in the range of 9.70 to 12.77% (Table 2). This compound is one of the most important parameters which determines about technological quality of TG [31]. Both the variety and the year of harvest had a significant influence on protein content. The lowest content of this compound was found in Orinoko and Dolindo grains (9.5%) collected in 2020 and 2021, respectively. The highest protein content was observed in the TG of Toro and Gringo varieties (12.77% and 12.73%, respectively) harvested in 2020. Similar protein content in TG was found by other authors [32]. Moreover, they also revealed the reverse correlation between protein content and the yield of grain. Other authors also found that protein content in TG depends strongly on the year of harvesting and nitrogen fertilization level [33]. According to Manley et al. [34] protein content in TG can change in a wide range (from 7.5% to 16.2%) depending on a genotype. Moreover, the study conducted by Navarro-Contreras et al. [35] demonstrated, that TG protein has similar contents of gliadin (from 11 to 26%), albumin (from 38 to 45%) and globulin (20 to 30), and lower content of glutenin (from 7 to 10%) than wheat and rye proteins.
The highest contents of fat and total dietary fiber were found in Gringo TG (2.00% and 17.5%, respectively), whereas the lowest contents of these ingredients were found in the Carmelo variety (1.65% and 15.1%, respectively). The year of harvesting had little or no significant influence on the contents of these ingredients. Rakha et al. [6] found that the dietary fiber of TG mainly includes arabinoxylan, fructan, cellulose (mean 2.1%), lignin and β-glucan. The ash content in TG samples varied from 1.74% to 2.04% and depended mainly on the genotype. Ash content is an indicator of TG milling value. The low milling yield of triticale for food applications is a challenge [20]. Higher ash content in TG usually results in a lower yield of flour and a lower milling effectiveness index expressed as the ratio of flour extract to its ash content [36]. Carbohydrates in the studied TG varieties ranged from 67.4% to 72.9% and depended on both variety and the year of the harvesting.

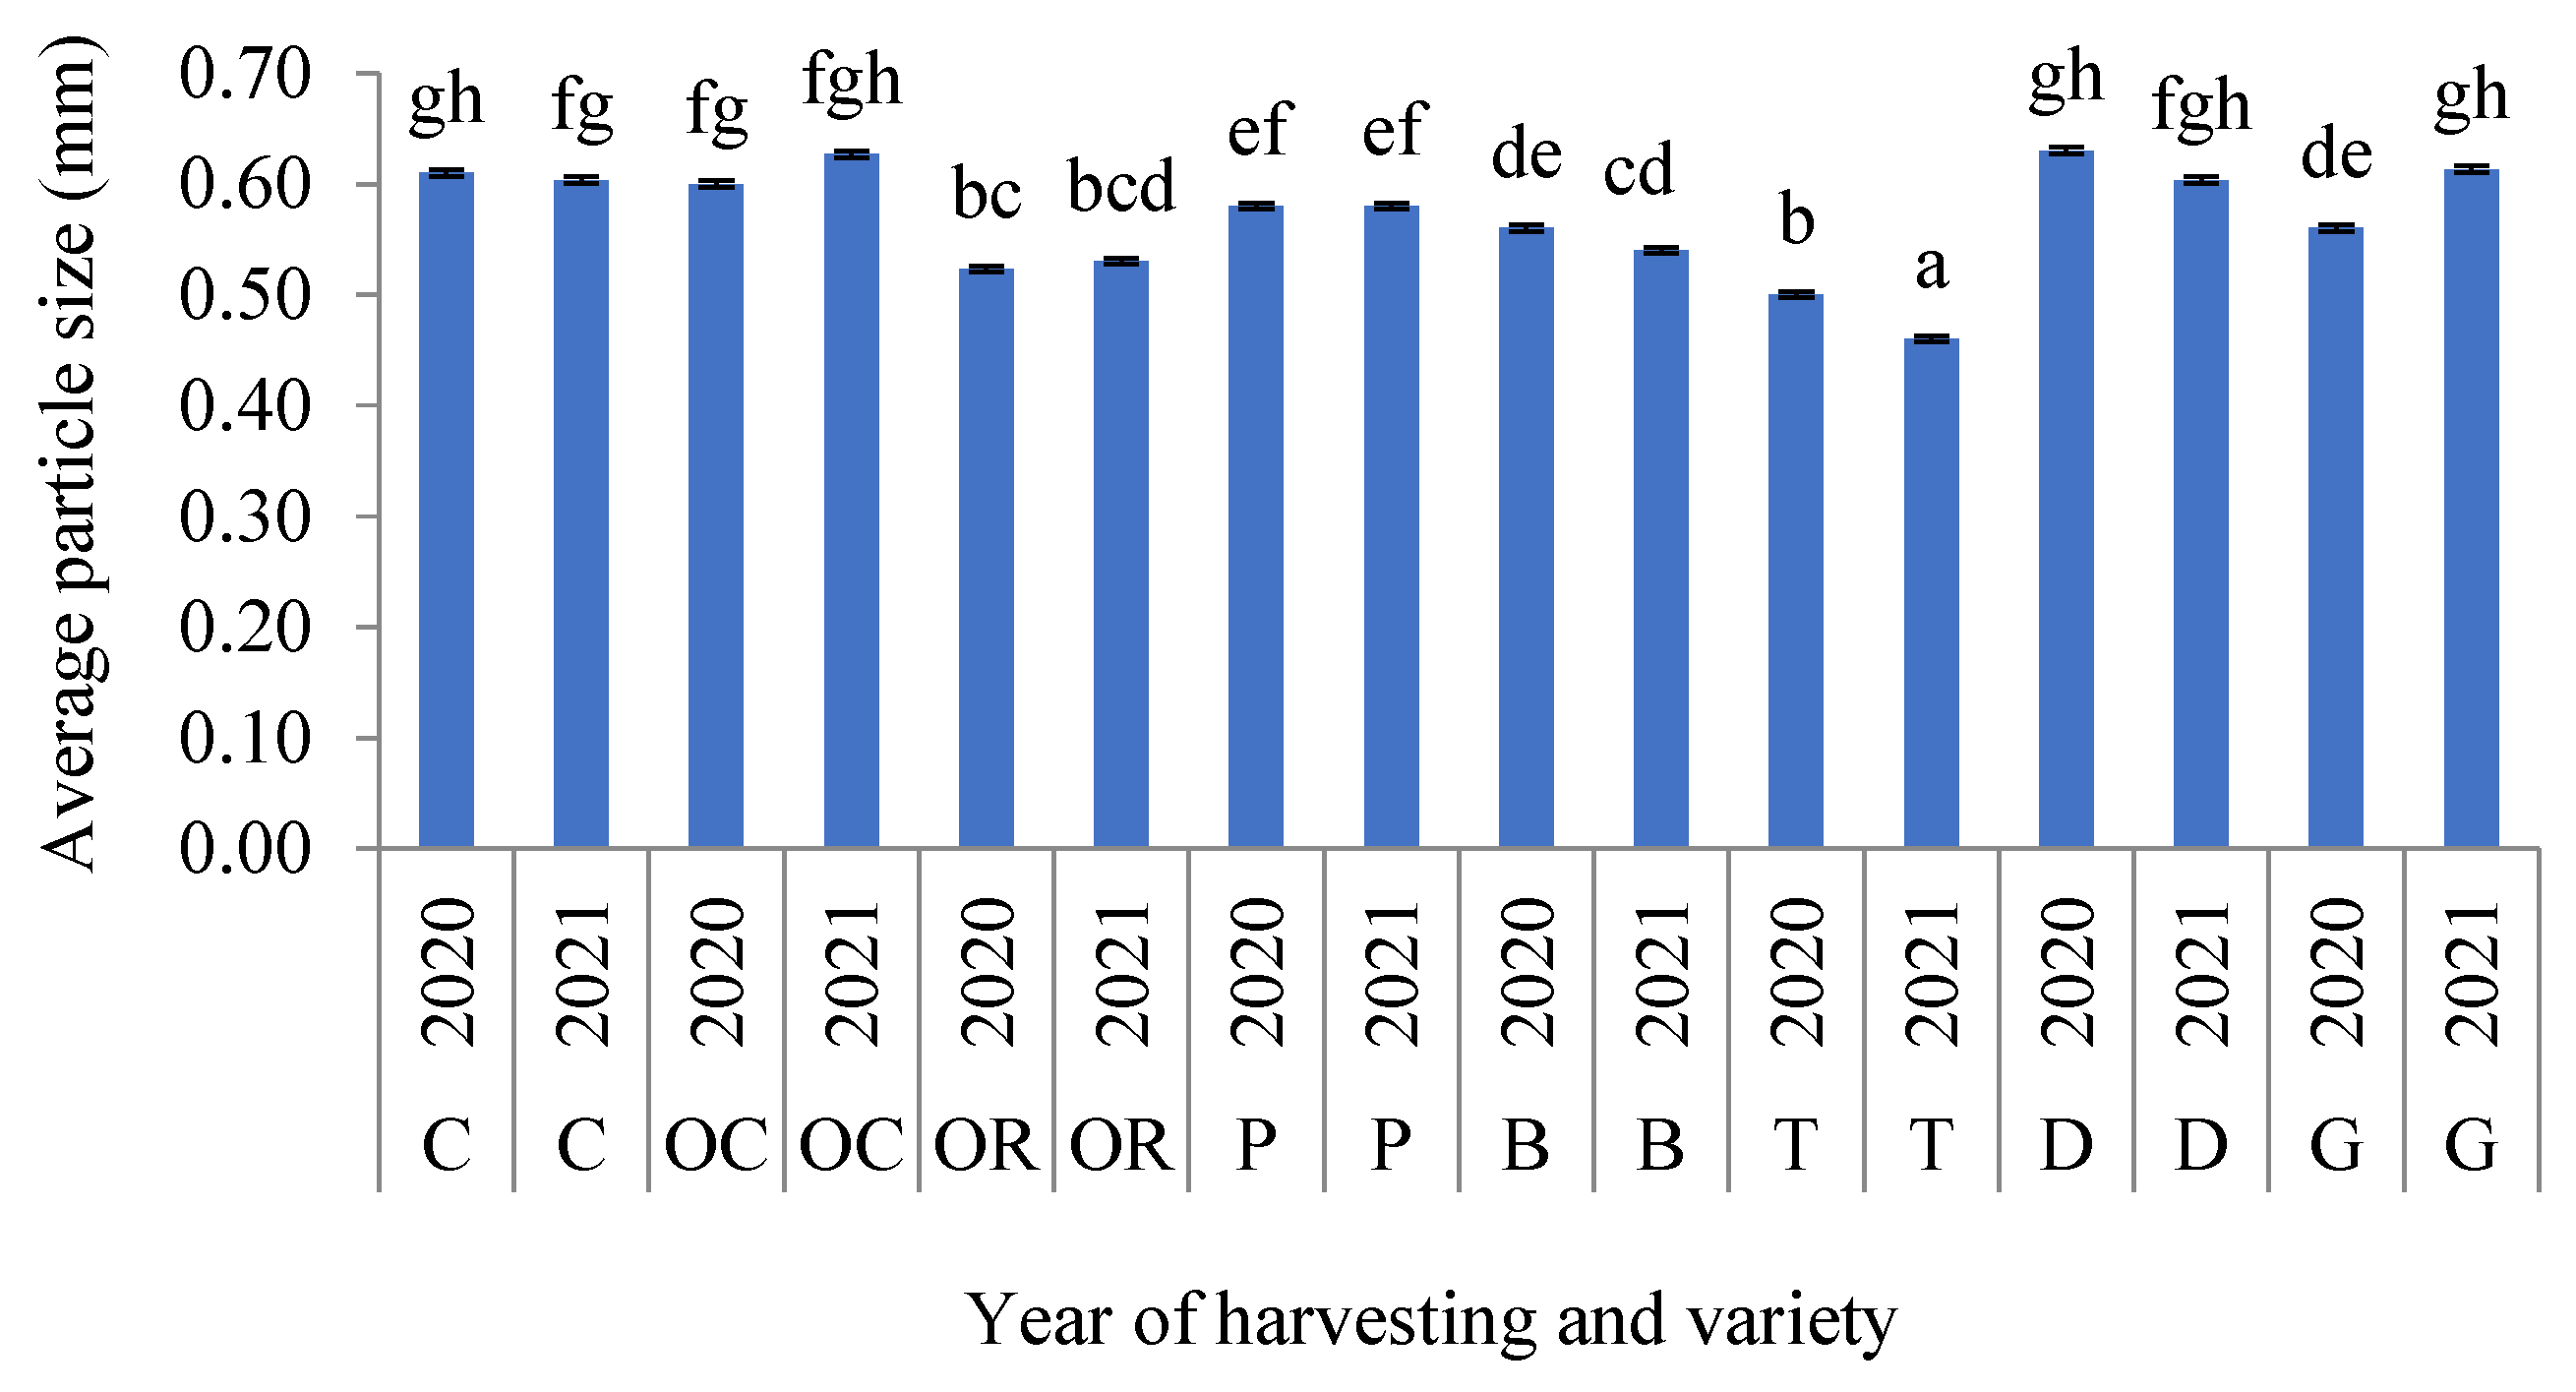
3.2. Particle Size Distribution

The particle size and particle size distribution (PSD) are very important indices of ground TG which decide the properties of size-reduced grain and consequently, the quality of the final products [37,38,39]. Fine particles are normally associated with increased cell rupture and release of cellular components, whereas the large particles of milled grain better preserve cellular integrity and limit the action of digestive enzymes [40]. Moreover, the solubility and availability of some microelements increased with decreased particle size [41]. The strongest influence on PSD had the genetic factor (Table 3). In most cases, the year of harvesting had no significant influence on PSD. The ground TG of the Porto and Gringo varieties contained the lowest parentage of fine particles (<0.1 mm), whereas grinding of the Toro variety harvested in 2021 resulted in the highest mass fraction of these particles. The mass of fine particles after grinding is often taken as an indicator of grain hardness [42]. Hard grain during size reduction gives a significantly lower amount of fine particles compared with grain with soft endosperm [43]. The highest mass fraction of coarse particles (>1.0 mm) was found in the ground TG of Carmelo, Dolindo and Octavio varieties. On the other hand, Dziki et al. [44] showed, that amount of coarse particles in ground wheat samples positively correlated with the hardness of grain.
The average particle size (ds) of ground TG samples was in the range of 0.46–0.63 mm (Figure 2). The lowest value of this parameter was found for the ground TG of Toro and Orinoko and the highest for Octavio and Dolindo. According to the obtained results in most cases, the year of harvesting had no significant impact on ds. Only in the case of Toro and Gringo varieties the significant difference between ds in different years of harvesting was observed. The analysis of variance showed that genetic factors had the strongest influence on ds (the highest value of the F-Test). Additionally, the interaction between the variety and the year of harvesting was statistically significant (Table 4).

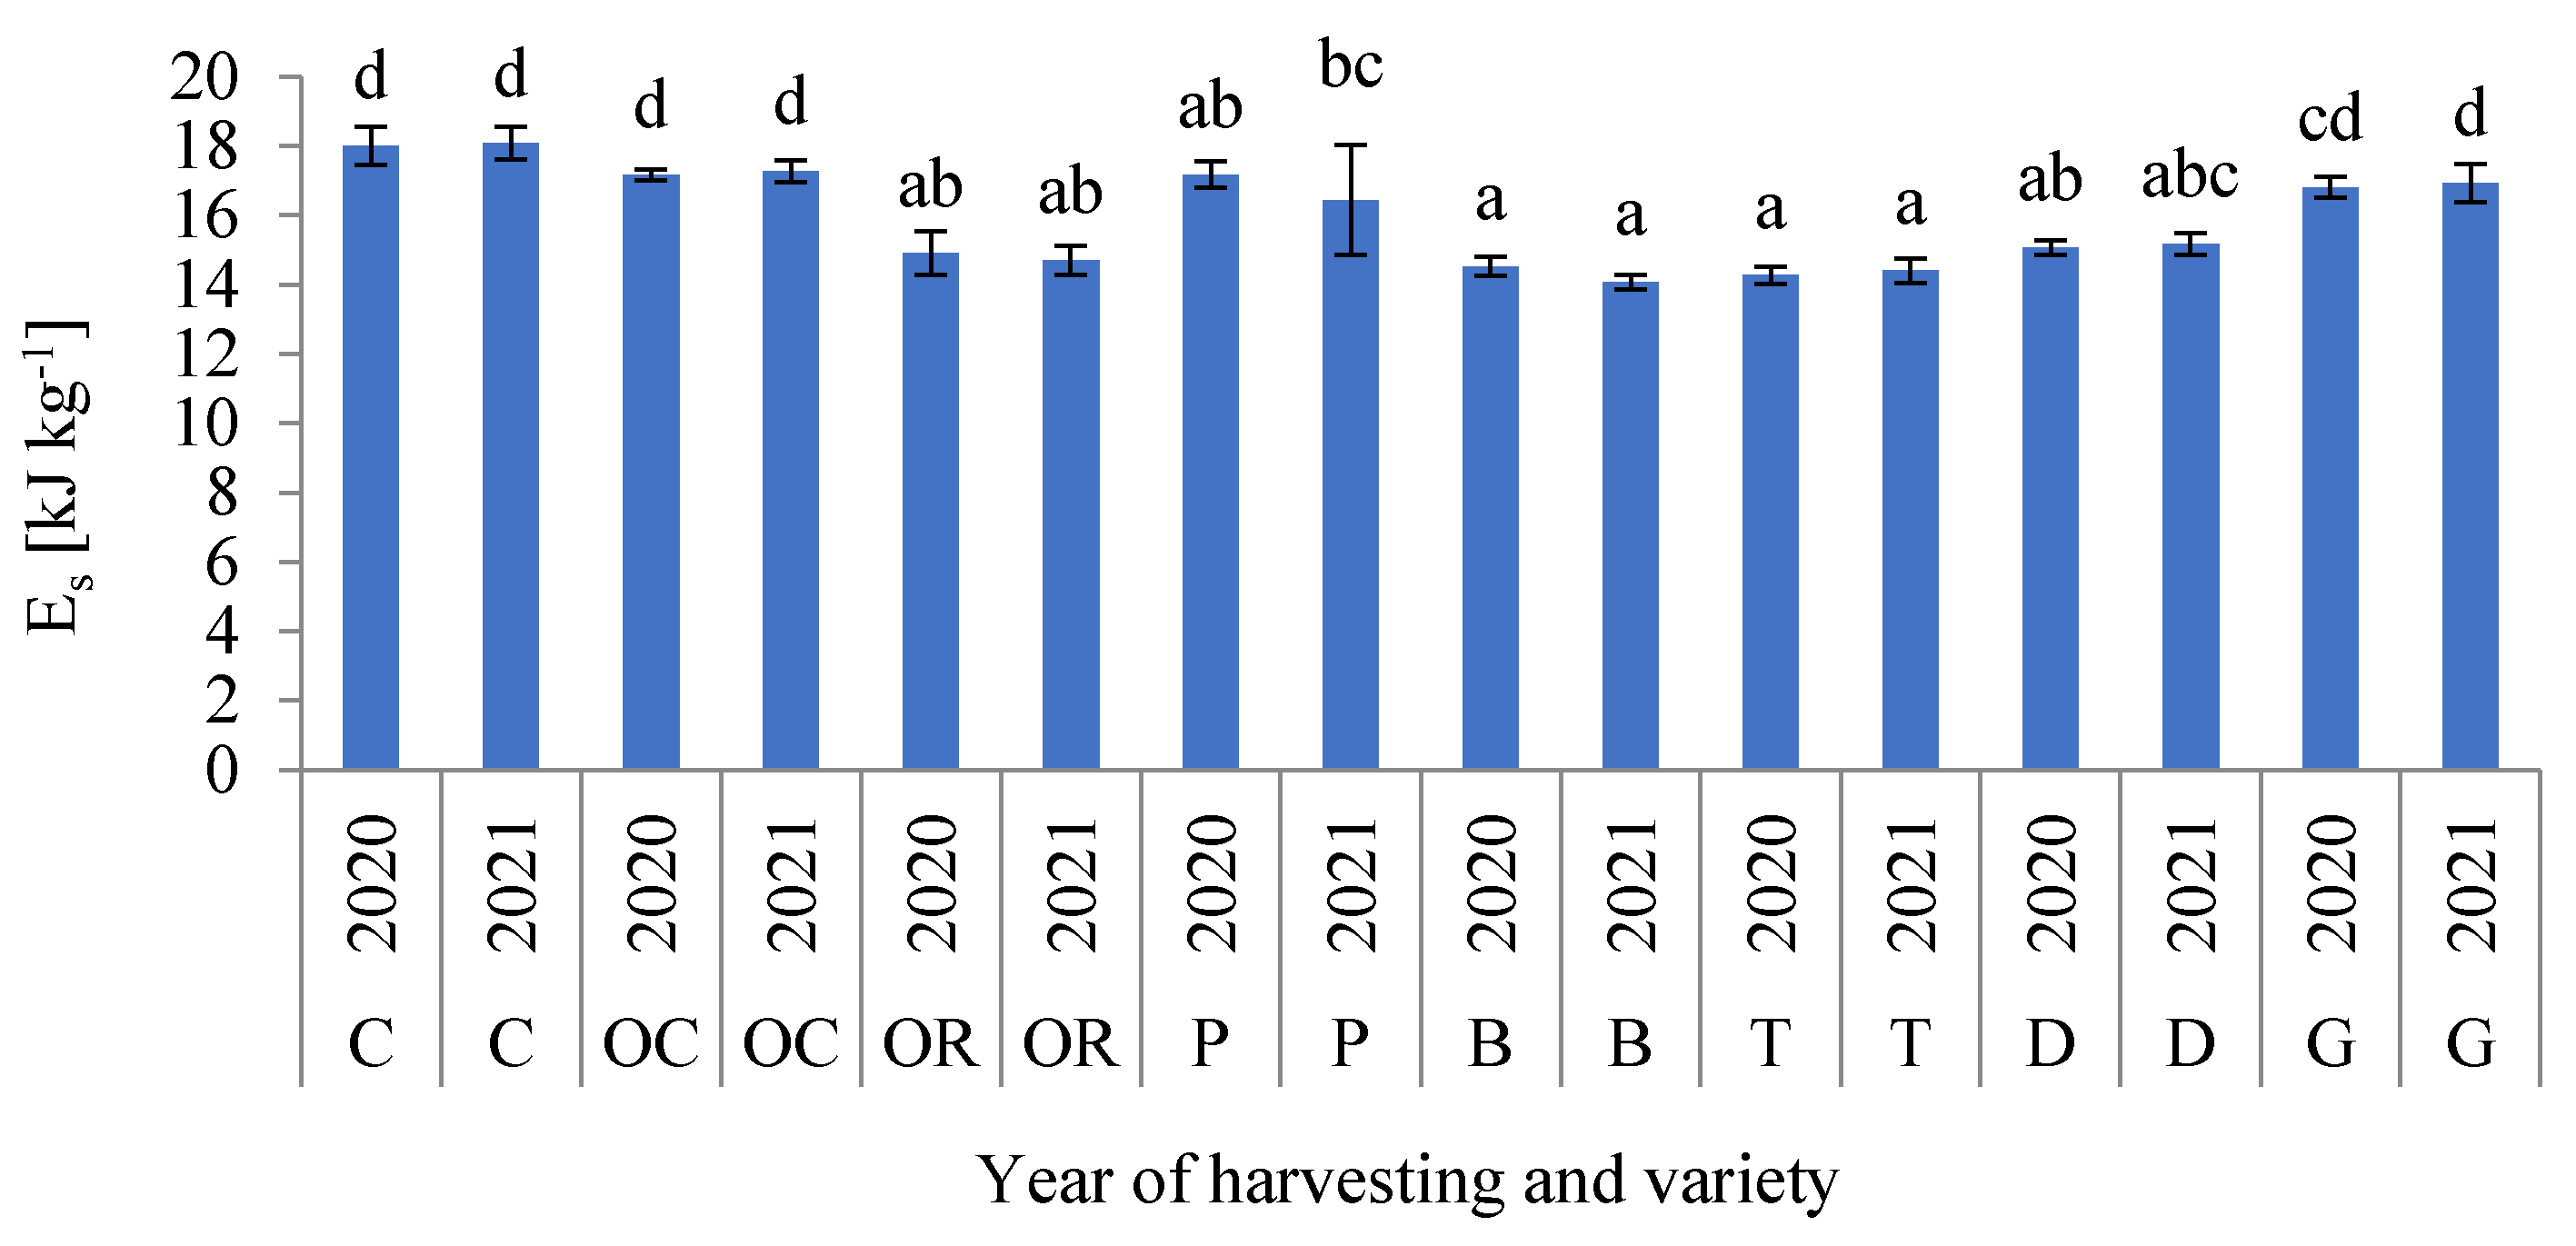
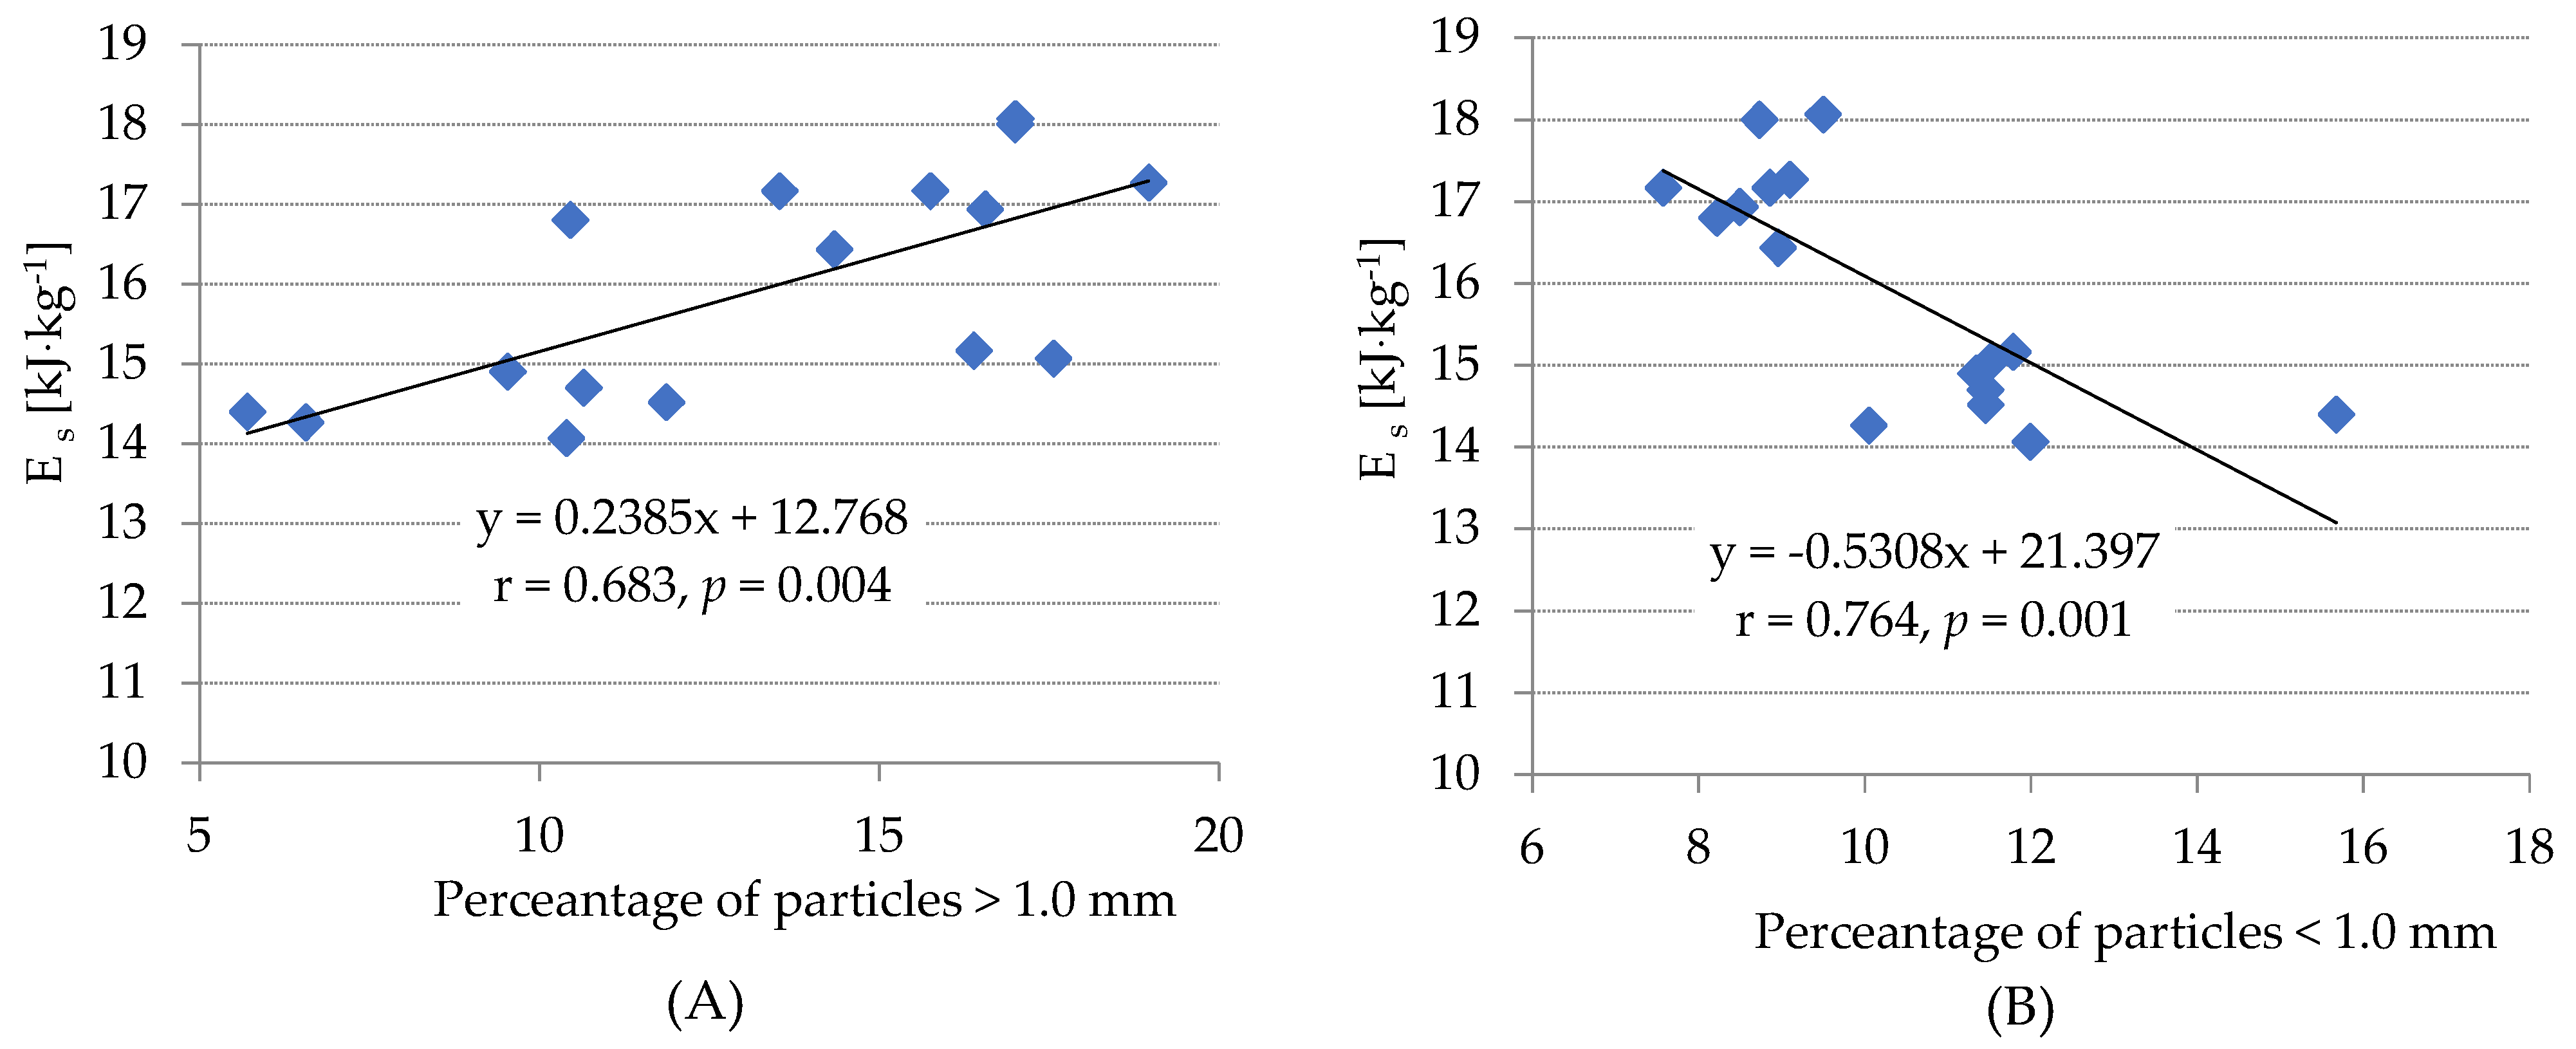
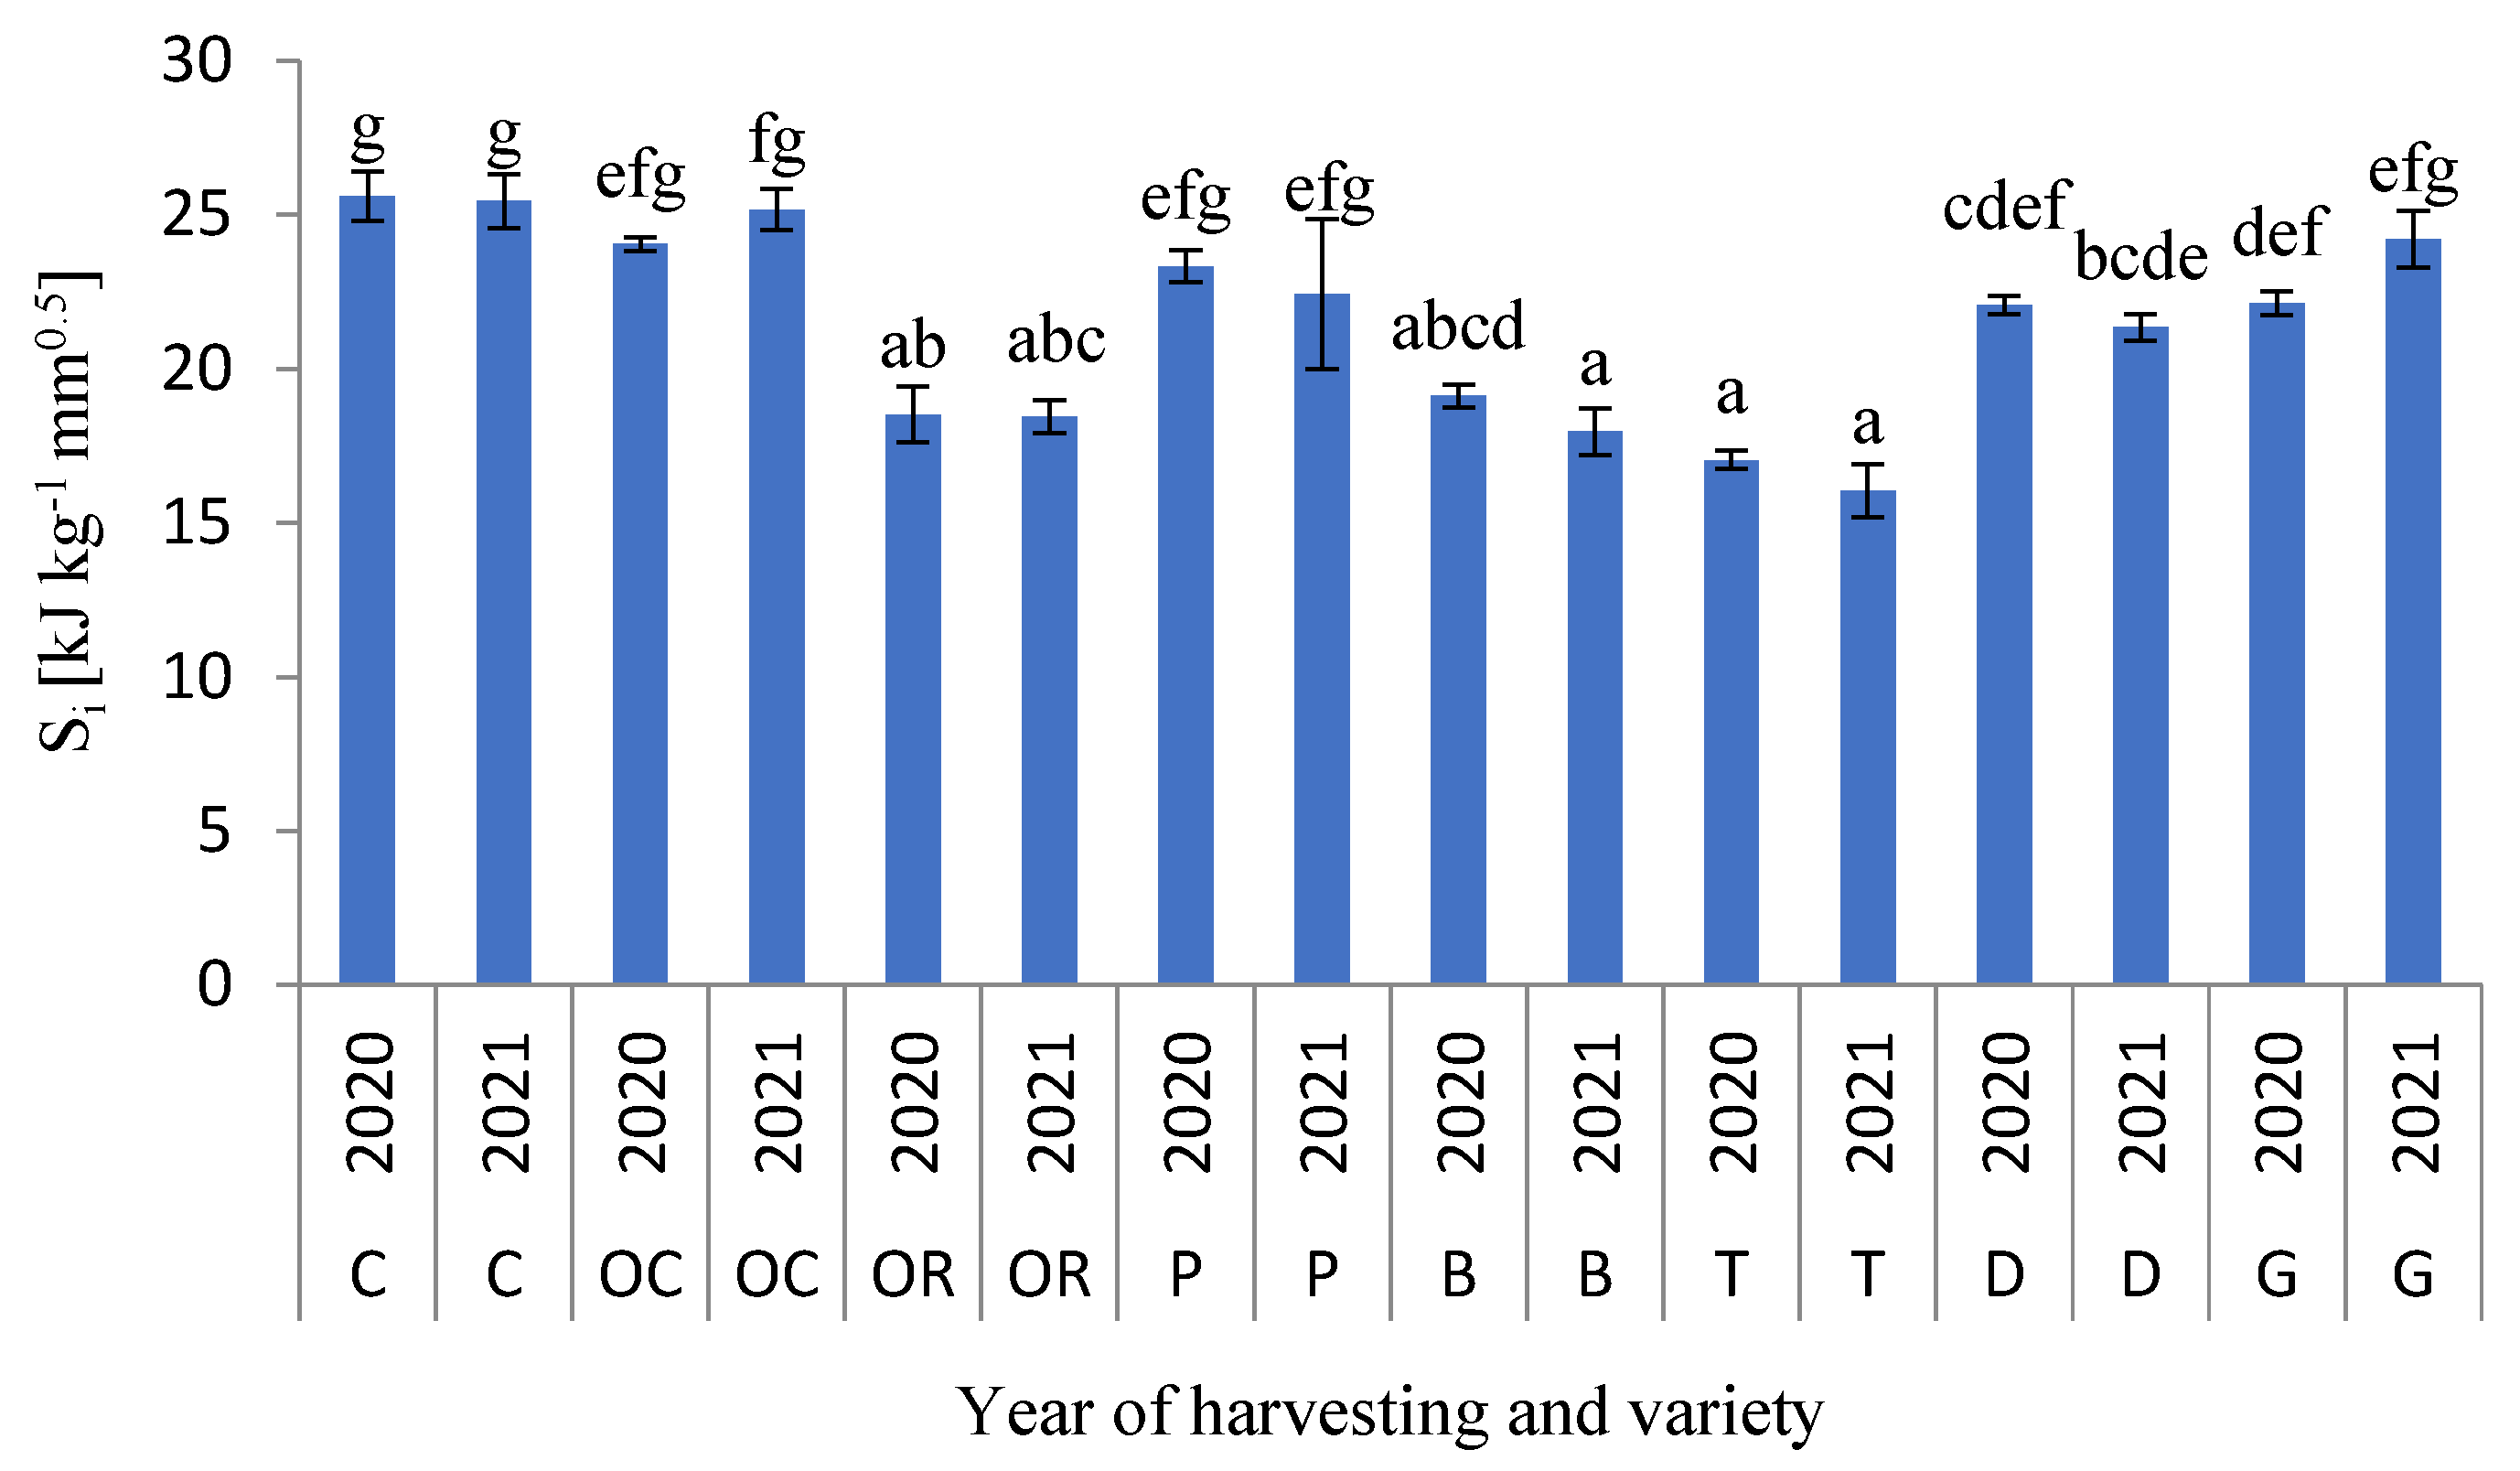
3.3. Specific Grinding Energy

Grinding energy is an indicator of grain resistance to size reduction. The results of specific grinding energy (Es) were depicted in Figure 3, whereas the analysis of the variance of Es was shown in Table 5. According to the obtained results, Es was influenced by variety, whereas the growing season had no significant effect on this parameter. Additionally, the interaction between the year of harvesting and the growing season was not statistically significant. The lowest values of Es were recorded for Belcanto, Toro and Orinoko varieties (14.6 kJ kg−1 on average). On the other hand, the TG of Carmelo, Octavio and Gringo varieties were characterized by the highest specific grinding energy (17.8 kJ kg−1 on average).
Many studies prove that grain hardness and moisture content are crucial factors that have an influence both on the grinding energy requirements and grinding pattern [44,45,46]. Therefore, in this study for the comparison of the different samples of TG, the same moisture content was established. Higher moisture content cereal grain increases its plasticity and consequently grinding effectiveness decreased as a result of higher grinding energy requirements and a lower degree of fineness [18]. The study conducted by Hassoon et al. [18] using the same kind of mill and measuring system showed that in the case of wheat grain, the specific grinding energy ranged from 13.2 to 25.3 kJ kg−1 depending on the grain hardness and moisture content. Additionally, other authors [21] found that the specific grinding energy of TG during flour milling ranged from 51.3 to 58.3 kJ kg−1 with higher values of Es for grain with a lower level of nitrogen fertilization. Moreover, Warechowska et al. [22] found that when a roller mill is used for size reduction the grinding energy depends on the thickness of TG. Additionally, the flour extraction increased with increasing the size of TG. Based on correlation analysis we observed a significant and positive correlation between the mass fraction of coarse particles (>1.0 mm) and Es (Figure 4A) and a negative correlation between the mass fraction of fine particles (<0.1 mm) and Es (Figure 4B). It shows, that TG which required higher grinding energy requirements is also characterized by the higher size of ground particles. Consequently, we found a positive and statistically significant correlation between the average particle size and Es (r = 0.670, p = 0.004).
For a more accurate description of the grinding process, in addition to Es, the indices that take into account both grinding energy and the degree of fineness of the particles are determined such as Bond, Kick, Rittinger, or Sokołowski’s grinding index (Si) [18]. The values of Si were presented in Figure 5. The lowest Si values were found for the Toro variety (averaged 17.8 kJ kg−1 mm0.5), whereas, for the TG of Carmelio and Octavio varieties, the values of this index were about 45% higher. Importantly, both the year of harvesting and the interaction between the year and variety had no significant influence on this index (Table 6). Hasson et al. [18] used the same kind of mill and found that Si for wheat grain ranges from 10 to 26 kJ kg−1 mm0.5, with lower values obtained for soft wheat grain and with low moisture content. Other authors found higher values of Si for roller-milled wheat. Depending on grain hardness Si was found from 22 to 54 kJ kg−1 mm0.5 [47].

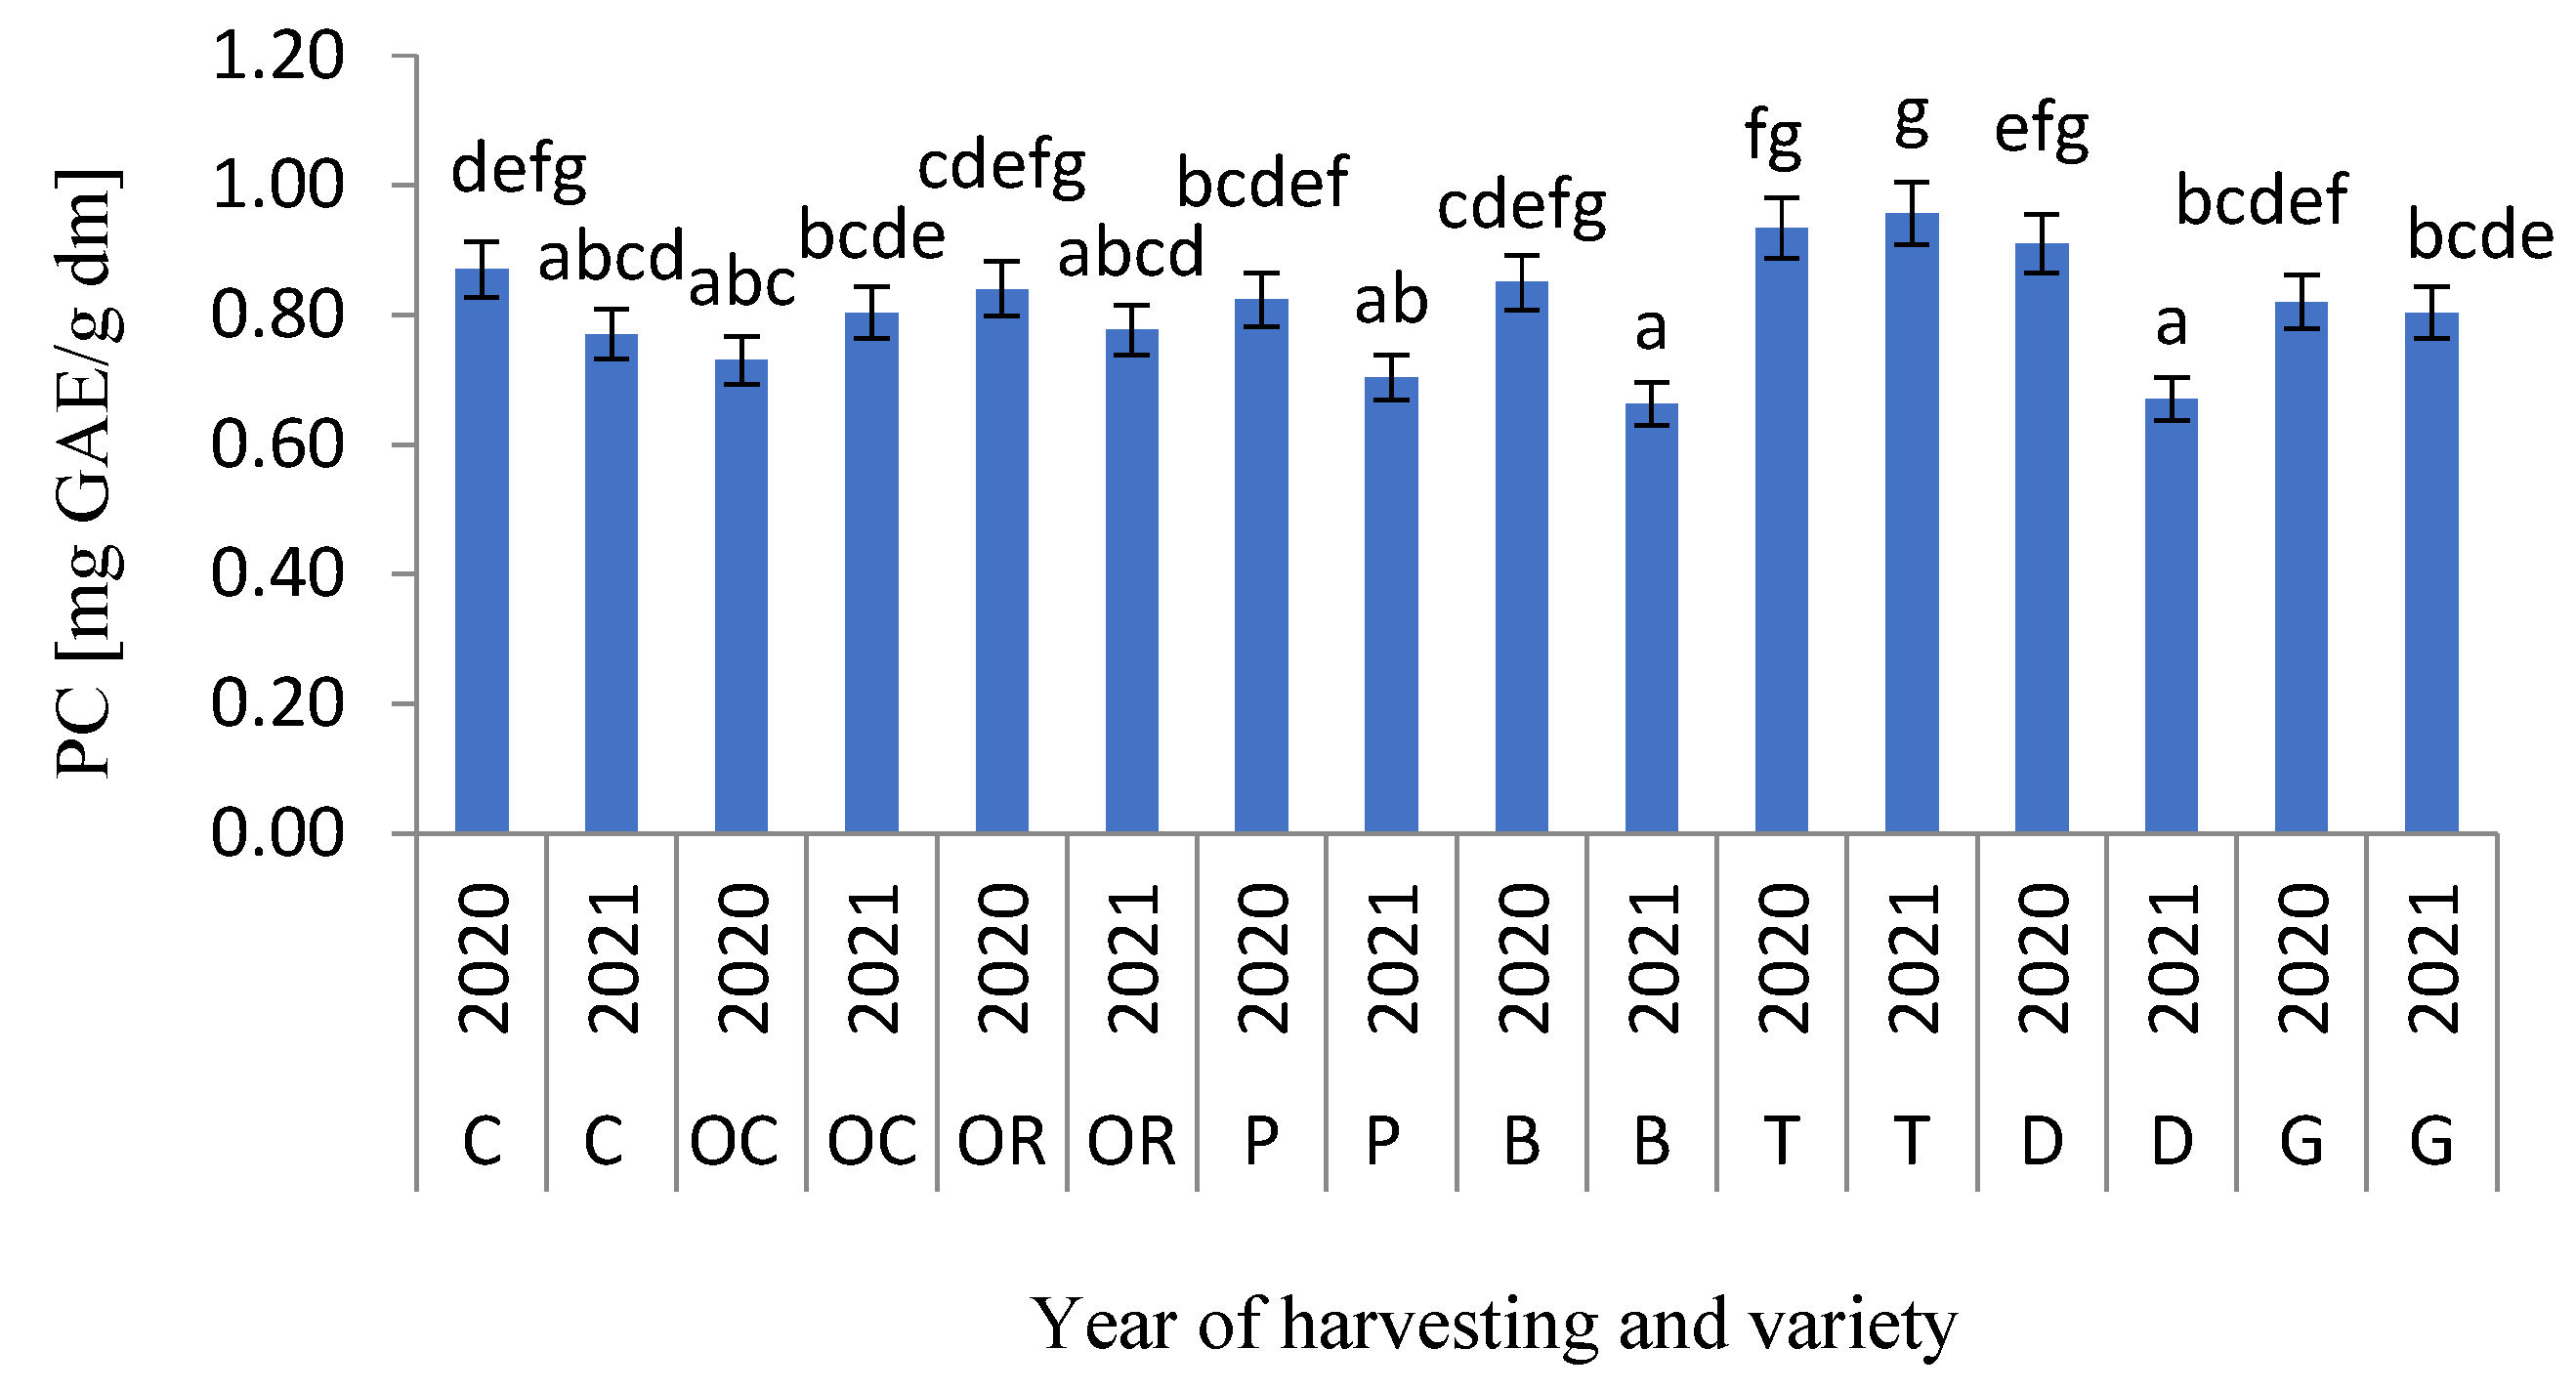
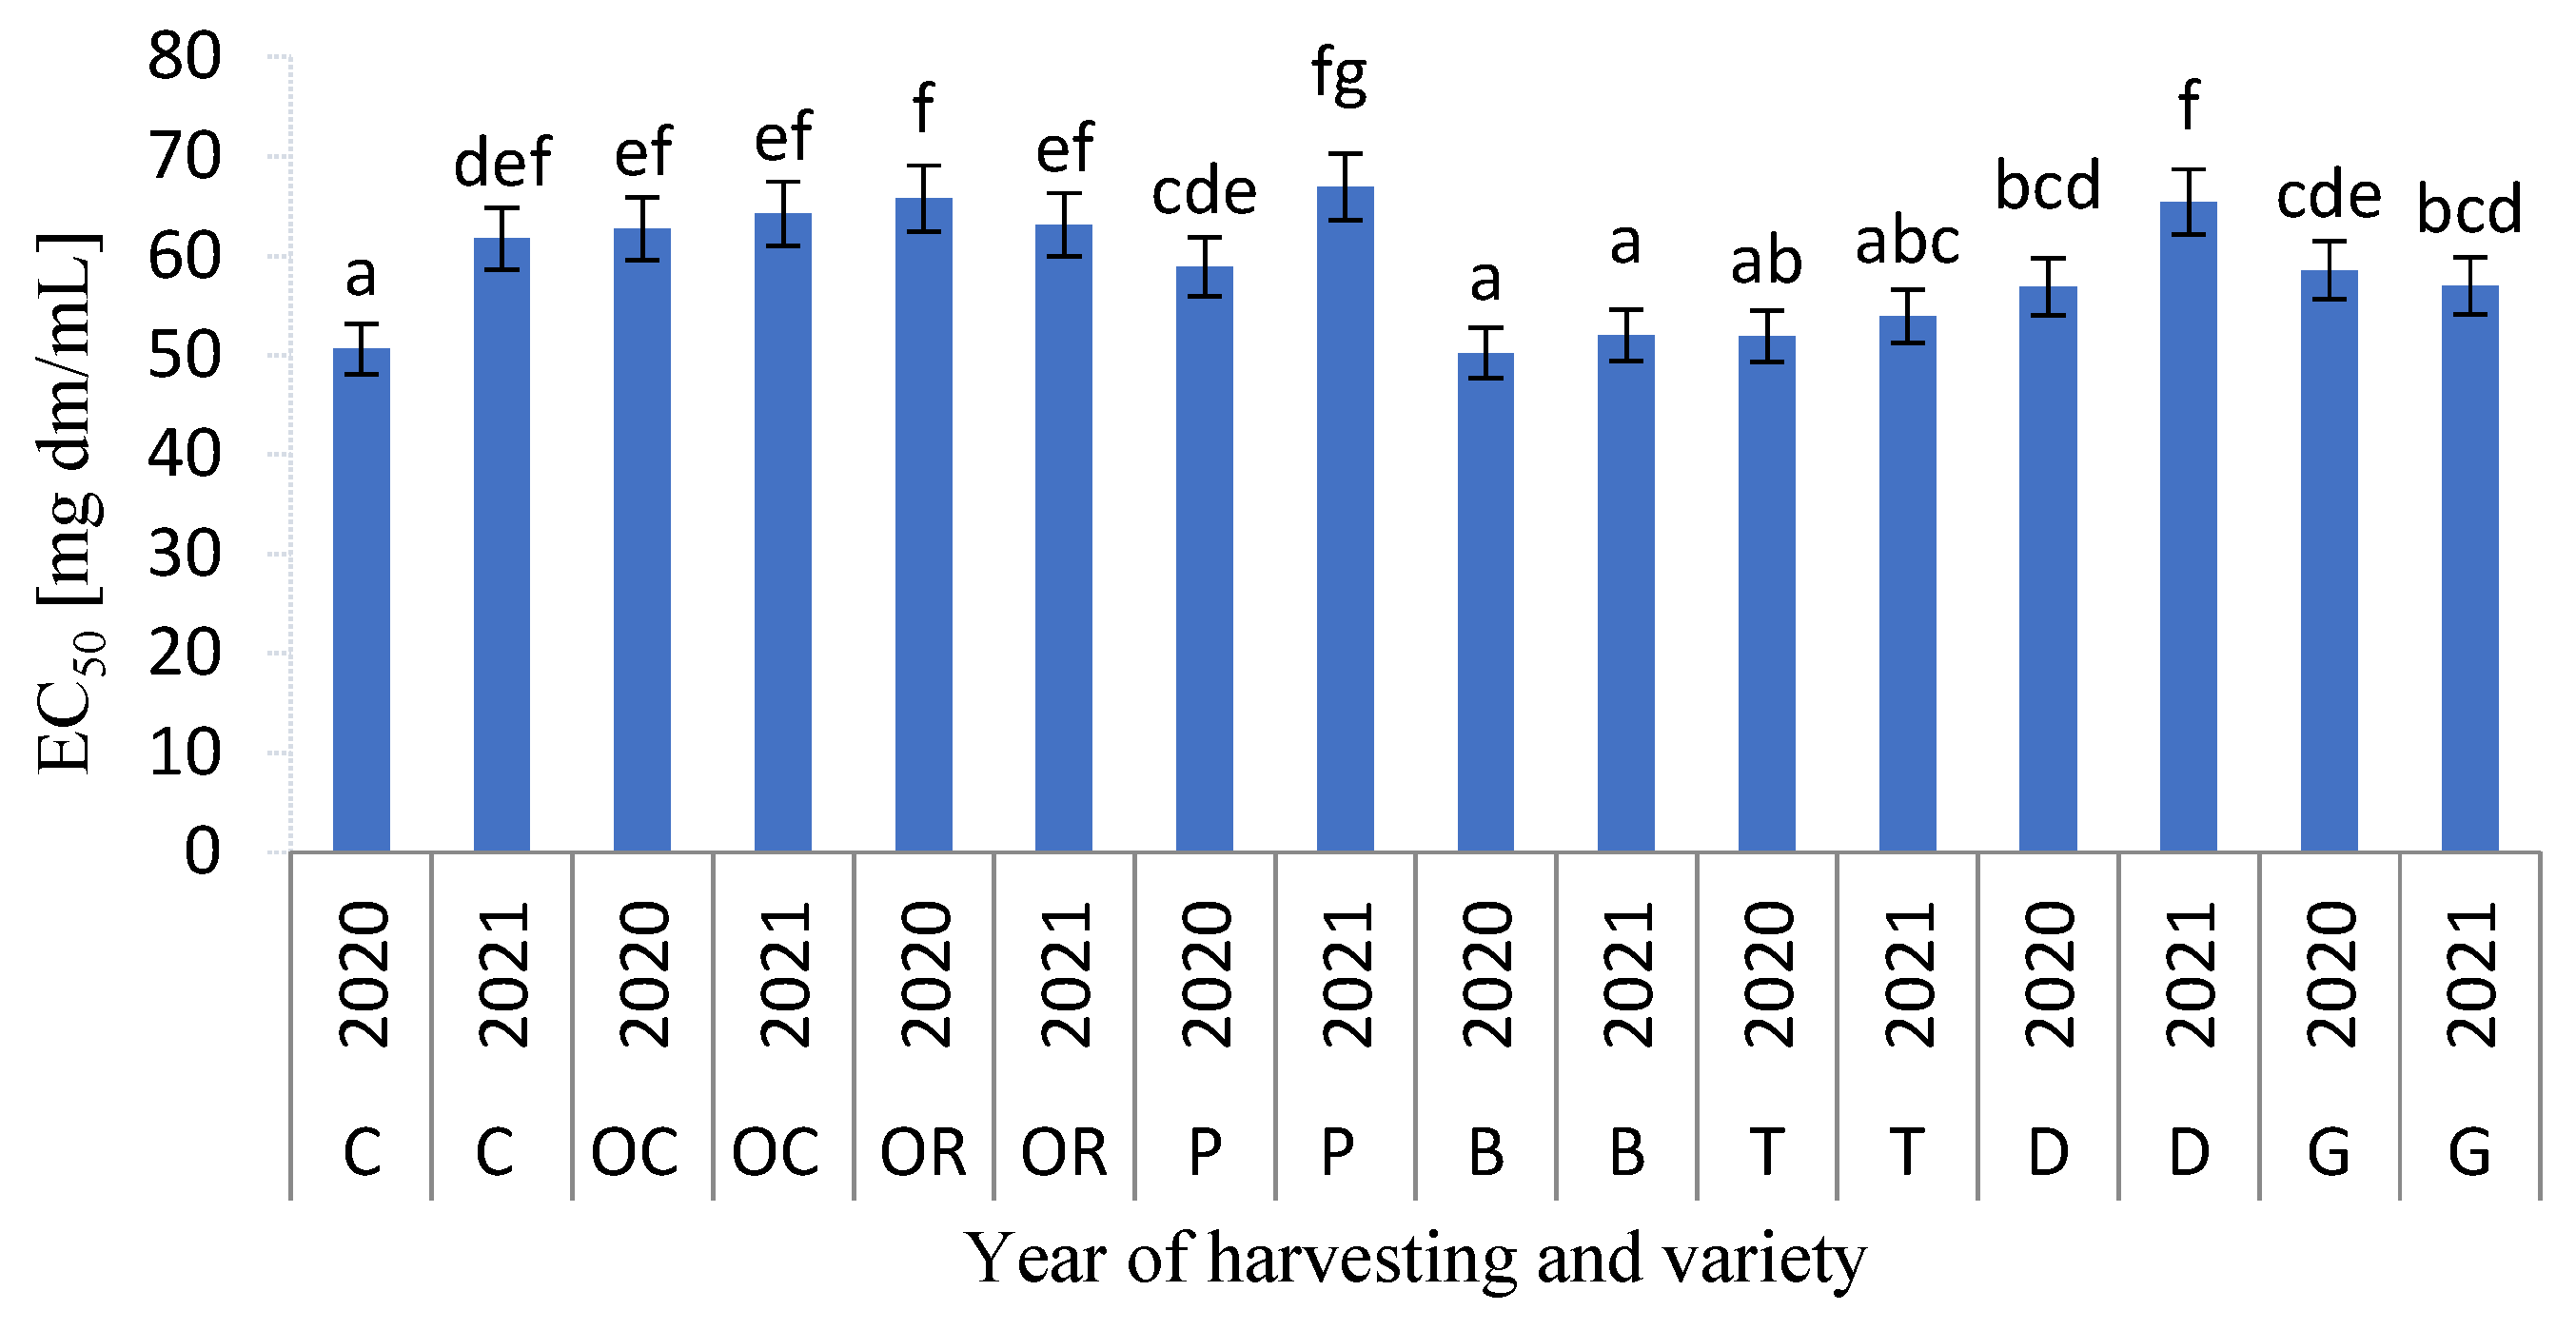
3.4. Phenolics Content and Antioxidant Capacity

Cereal grain contains many phytochemicals. Phenolic compounds play an important role in health benefits [48], because of their high antioxidant capacity [49]. These phytochemicals are mainly concentrated in the bran layers. Therefore, wholemeal flour compared with white flour is a richer source of many bioactive compounds including phenolics, flavonoids, folates, fibre, vitamins and carotenoids [50]. The content of PC in the studied wholemeal TG ranged from 0.66 to 0.91 mg GAE/g dm The highest content of phenolics was found in the grain of the Toro variety. Whereas the lowest values were observed for the Belcanto and Dolindo varieties harvested in 2021 (Figure 6). The grain of Toro from both years of harvesting was the most abundant in phenolics. Both the growing season and variety, as well as their interaction, significantly influenced TP content. However, the strongest effect (the highest F-test value) had a genetic factor (Table 7). A similar range of PC content was found by Straumîte et al. [51] for other varieties of TG. However, these authors found that the growing conditions had a stronger effect on PC than variety. Other authors [8] found a higher level of phenolics in TG. The authors observed that the content of phenolics was in the range 1.3–1.6 mg of GAE/g dm for wholemeal flour of triticale and 0.7–1.1 mg of GAE/g dm for white triticale flour.
The antioxidant activity (expressed by EC50 index) of TG obtained from different harvesting seasons is presented in Figure 7. Both the growing season and variety significantly influenced EC50, with the stronger effect of genetic factors (Table 8). The highest antiradical activity (the lowest EC50 values) was found for Carmelo and Belcanto varieties harvested in 2020 (EC50 = 50.1 mg dm/mL on average) and for Toro TG from both years of harvesting (EC50 = 53.0 mg dm/mL on average). Whereas the TG of Porto and Toro harvested in 2021 showed the lowest antiradical activity (EC50 = 69.5 mg dm/mL on average). The results presented in Table 8 also demonstrated that the interaction between the year of harvesting and variety was statistically significant. Other authors also confirmed that both the growing season and Triticale variety significantly changed the antiradical activity of TG [51].

4. Conclusions

According to the study, the protein content of TG samples varied from 9.5 to 12.7% and was strongly influenced by the variety and harvesting year. Other TG components, however, were most affected by the genetic factor. The size reduction findings showed that distinct grinding patterns were produced by different TG samples with the same moisture level. The average particle size of ground TG varied from 0.46 to 0.63 mm and depended mainly on the genotype. Additionally, the specific grinding energy and Sokołowski grinding index were mainly related to the TG cultivar and ranged from 14.0 kJ kg−1 to 17.8 kJ kg−1 and from 17.1 to 26.4 kJ kg−1 mm0.5, respectively. Moreover, there was a significant and positive correlation between the specific grinding energy and particle size of ground TG. The presented study revealed that especially the grain of Belcanto required lower grinding energy requirements and showed the strongest antiradical activity compared with other TG varieties. In this work, the basic nutritional and health properties of the tested rye varieties were determined. Subsequent studies in this area should focus more on a complete characterization of the phenolic compounds in the tested varieties. Moreover, future research should concentrate on characterizing the grinding process of the tested triticale varieties in order to obtain white flour, and also assess the feasibility of using it for the production of various cereal products.

Supplementary Materials

The following supporting information can be downloaded at: https://www.mdpi.com/article/10.3390/pr11051477/s1.

Author Contributions

Conceptualization, D.D.; methodology, D.D. and A.K. (Aneta Kramek); software, D.D.; validation, D.D. and W.H.H.; formal analysis, D.D.; investigation, DD, W.H.H. and (Aneta Kramek); resources, D.D.; data curation, D.D. and A.K. (Aneta Kramek).; writing—original draft preparation, D.D., W.H.H. and A.K. (Anna Krajewska), writing—review and editing, D.D. and A.K. (Anna Krajewska); visualization, D.D. and W.H.H.; supervision, D.D.; project administration, D.D.; funding acquisition, D.D. and A.K. (Aneta Kramek). All authors have read and agreed to the published version of the manuscript.

Funding

This research received no external funding.

Institutional Review Board Statement

Not applicable.

Data Availability Statement

The data presented in this study are available on request from the corresponding author.

Conflicts of Interest

The authors declare no conflict of interest.

References

  1. Mcgoverin, C.M.; Snyders, F.; Muller, N.; Botes, W.; Fox, G.; Manley, M. A review of triticale uses and the effect of growth environment on grain quality. J. Sci. Food Agric. 2011, 91, 1155–1165. [Google Scholar] [CrossRef] [PubMed]
  2. Wójcik-Gront, E.; Studnicki, M. Long-term yield variability of triticale (×Triticosecale wittmack) tested using a cart model. Agriculture 2021, 11, 92. [Google Scholar] [CrossRef]
  3. Feledyn-Szewczyk, B.; Nakielska, M.; Jónczyk, K.; Berbéc, A.K.; Kopínski, J. Assessment of the suitability of 10 winter triticale cultivars (×Triticosecale Wittm. ex A. Camus) for organic agriculture: Polish case study. Agronomy 2020, 10, 1144. [Google Scholar] [CrossRef]
  4. Zhu, F. Triticale: Nutritional composition and food uses. Food Chem. 2018, 241, 468–479. [Google Scholar] [CrossRef]
  5. Aprodu, I.; Banu, I. Milling, functional and thermo-mechanical properties of wheat, rye, triticale, barley and oat. J. Cereal Sci. 2017, 77, 42–48. [Google Scholar] [CrossRef]
  6. Rakha, A.; Åman, P.; Andersson, R. Dietary fiber in triticale grain: Variation in content, composition, and molecular weight distribution of extractable components. J. Cereal Sci. 2011, 54, 324–331. [Google Scholar] [CrossRef]
  7. Meija, L.; Havensone, G.; Lejnieks, A. Postprandial Glycaemic and Insulinaemic Responses after Consumption of Activated Wheat and Triticale Grain Flakes. J. Nutr. Metab. 2019, 2019, 6594896. [Google Scholar] [CrossRef]
  8. Fraś, A.; Gołębiewska, K.; Gołębiewski, D.; Mańkowski, D.R.; Boros, D.; Szecówka, P. Variability in the chemical composition of triticale grain, flour and bread. J. Cereal Sci. 2016, 71, 66–72. [Google Scholar] [CrossRef]
  9. Biel, W.; Kazimierska, K.; Bashutska, U. Nutritional Value of Wheat, Triticale, Barley and Oat Grains. Acta Sci. Pol. Zootech. 2020, 19, 19–28. [Google Scholar] [CrossRef]
  10. Kaszuba, J.; Kapusta, I.; Posadzka, Z. Content of phenolic acids in the grain of selected polish triticale cultivars and its products. Molecules 2021, 26, 562. [Google Scholar] [CrossRef]
  11. Kandil, A.; Li, J.; Vasanthan, T.; Bressler, D.C. Phenolic acids in some cereal grains and their inhibitory effect on starch liquefaction and saccharification. J. Agric. Food Chem. 2012, 60, 8444–8449. [Google Scholar] [CrossRef] [PubMed]
  12. Kaszuba, J.; Jaworska, G.; Krochmal-Marczak, B.; Kogut, B.; Kuźniar, P. Effect of bran addition on rheological properties of dough and quality of triticale bread. J. Food Process. Preserv. 2021, 45, e15093. [Google Scholar] [CrossRef]
  13. Daribayeva, G.; Magomedov, G.O.; Iztaev, B.; Zhexenbay, N.; Tyussyupova, B. Preparation of triticale flour by ion-ozone treatment for pasta quality improvement. East.-Eur. J. Enterp. Technol. 2019, 4, 64–73. [Google Scholar] [CrossRef]
  14. Cioch-Skoneczny, M.; Zdaniewicz, M.; Pater, A.; Skoneczny, S. Impact of triticale malt application on physiochemical composition and profile of volatile compounds in beer. Eur. Food Res. Technol. 2019, 245, 1431–1437. [Google Scholar] [CrossRef]
  15. Watanabe, E.; Arruda, K.M.A.; Kitzberger, C.S.G.; Scholz, M.B.d.S.; Coelho, A.R. Physico-chemical properties and milling behavior of modern triticale genotypes. Emir. J. Food Agric. 2019, 31, 752–758. [Google Scholar] [CrossRef]
  16. McKenzie, R.H.; Bremer, E.; Middleton, A.B.; Beres, B.; Yoder, C.; Hietamaa, C.; Pfiffner, P.; Kereliuk, G.; Pauly, D.; Henriquez, B. Agronomic practices for bioethanol production from spring triticale in Alberta. Can. J. Plant Sci. 2014, 94, 15–22. [Google Scholar] [CrossRef]
  17. Makowska, A.; Waśkiewicz, A.; Chudy, S. Lignans in triticale grain and triticale products. J. Cereal Sci. 2020, 93, 102939. [Google Scholar] [CrossRef]
  18. Hassoon, W.H.; Dziki, D.; Miś, A.; Biernacka, B. Wheat grinding process with low moisture content: A new approach for wholemeal flour production. Processes 2021, 9, 32. [Google Scholar] [CrossRef]
  19. Bressiani, J.; Oro, T.; Da Silva, P.M.L.; Montenegro, F.M.; Bertolin, T.E.; Gutkoski, L.C.; Gularte, M.A. Influence of milling whole wheat grains and particle size on thermo-mechanical properties of flour using Mixolab. Czech J. Food Sci. 2019, 37, 276–284. [Google Scholar] [CrossRef]
  20. Dennett, A.L.; Trethowan, R.M. Milling efficiency of triticale grain for commercial flour production. J. Cereal Sci. 2013, 57, 527–530. [Google Scholar] [CrossRef]
  21. Warechowska, M.; Warechowski, J.; Wojtkowiak, K.; Stępień, A. Milling Quality of Spring Triticale Grain under Different Nitrogen Fertilization. Pol. J. Nat. Sci. 2013, 28, 423–435. [Google Scholar]
  22. Warechowska, M.; Warechowski, J.; Stepien, A.; Wojtkowiak, K. Effect of the Size of Triticale Kernel on Milling Energy Consumption, Flour Yield and Granulometric Composition of flour. Pol. J. Nat. Sci. 2016, 31, 433–444. [Google Scholar]
  23. AACC. American Association of Cereal Chemistry Approved Methods of Analysis, 11th ed.; AACC: St. Paul, MN, USA, 2022; Available online: http://methods.aaccnet.org/toc.aspx (accessed on 11 December 2022).
  24. Dziki, D. The crushing of wheat kernels and its consequence on the grinding process. Powder Technol. 2008, 185, 181–186. [Google Scholar] [CrossRef]
  25. Dziki, D.; Laskowski, J. Study to analyze the influence of sprouting of the wheat grain on the grinding process. J. Food Eng. 2010, 96, 562–567. [Google Scholar] [CrossRef]
  26. Dziki, D. Effect of preliminary grinding of the wheat grain on the pulverizing process. J. Food Eng. 2011, 104, 585–591. [Google Scholar] [CrossRef]
  27. Sujka, K.; Cacak-Pietrzak, G.; Sułek, A.; Murgrabia, K.; Dziki, D. Buckwheat Hull-Enriched Pasta: Physicochemical and Sensory Properties. Molecules 2022, 27, 4065. [Google Scholar] [CrossRef] [PubMed]
  28. Romankiewicz, D.; Hassoon, W.H.; Cacak-Pietrzak, G.; Sobczyk, M.; Wirkowska-WojdyBa, M.; CegliNska, A.; Dziki, D. The effect of chia seeds (Salvia hispanica L.) addition on quality and nutritional value of wheat bread. J. Food Qual. 2017, 2017, 7352631. [Google Scholar] [CrossRef]
  29. Re, R.; Pellegrini, N.; Proteggente, A.; Pannala, A.; Yang, M.; Rice-Evans, C. Antioxidant activity applying an improved ABTS radical cation decolorization assay. Free Radic. Biol. Med. 1999, 26, 1231–1237. [Google Scholar] [CrossRef]
  30. Chen, Z.; Bertin, R.; Froldi, G. EC50 estimation of antioxidant activity in DPPH* assay using several statistical programs. Food Chem. 2013, 138, 414–420. [Google Scholar] [CrossRef] [PubMed]
  31. Kh Sukhanberdina, L.; Tulegenova, D.K.; Sh Dzhaparov, R.; Denizbayev, S.E.; Zh Turbayev, A. Economic and technological assessment of triticale breeding lines. IOP Conf. Ser. Earth Environ. Sci. 2022, 1045, 012102. [Google Scholar] [CrossRef]
  32. Levchenko, O.S.; Kostenko, O.I.; Holyk, L.M.; Shpakovych, I.V. The results of using in the breeding process of collection samples of winter triticale in terms of grain quality. Agric. Plant Sci. Theory Pract. 2021, 2, 84–90. [Google Scholar] [CrossRef]
  33. Burešová, I.; Sedláčková, I.; Faměra, O.; Lipavský, J. Effect of growing conditions on starch and protein content in triticale grain and amylose content in starch. Plant Soil Environ. 2010, 56, 99–104. [Google Scholar] [CrossRef]
  34. Manley, M.; McGoverin, C.M.; Snyders, F.; Muller, N.; Botes, W.C.; Fox, G.P. Prediction of triticale grain quality properties, based on both chemical and indirectly measured reference methods, using near-infrared spectroscopy. Cereal Chem. 2013, 90, 540–545. [Google Scholar] [CrossRef]
  35. Navarro-Contreras, A.L.; Chaires-González, C.F.; Rosas-Burgos, E.C.; Borboa-Flores, J.; Wong-Corral, F.J.; Cortez-Rocha, M.O.; Cinco-Moroyoqui, F.J. Comparison of protein and starch content of substituted and complete triticales (×Triticosecale Wittmack): Contribution to functional properties. Int. J. Food Prop. 2014, 17, 421–432. [Google Scholar] [CrossRef]
  36. Gil, Z. Effect of Physical and Chemical Properties of Triticale Grain on its Milling Value. Plant Breed. Seed Sci. 2002, 46, 24–29. [Google Scholar]
  37. Lapčíková, B.; Burešová, I.; Lapčík, L.; Dabash, V.; Valenta, T. Impact of particle size on wheat dough and bread characteristics. Food Chem. 2019, 297, 124938. [Google Scholar] [CrossRef]
  38. Lin, S.; Gao, J.; Jin, X.; Wang, Y.; Dong, Z.; Ying, J.; Zhou, W. Whole-wheat flour particle size influences dough properties, bread structure and: In vitro starch digestibility. Food Funct. 2020, 11, 3610–3620. [Google Scholar] [CrossRef]
  39. Guan, E.; Yang, Y.; Pang, J.; Zhang, T.; Li, M.; Bian, K. Ultrafine grinding of wheat flour: Effect of flour/starch granule profiles and particle size distribution on falling number and pasting properties. Food Sci. Nutr. 2020, 8, 2581–2587. [Google Scholar] [CrossRef] [PubMed]
  40. Al-Rabadi, G.J.S.; Gilbert, R.G.; Gidley, M.J. Effect of particle size on kinetics of starch digestion in milled barley and sorghum grains by porcine alpha-amylase. J. Cereal Sci. 2009, 50, 198–204. [Google Scholar] [CrossRef]
  41. Aslam, M.F.; Ellis, P.R.; Berry, S.E.; Latunde-Dada, G.O.; Sharp, P.A. Enhancing mineral bioavailability from cereals: Current strategies and future perspectives. Nutr. Bull. 2018, 43, 184–188. [Google Scholar] [CrossRef]
  42. Acar, O.; Sanal, T.; Köksel, H. Effects of wheat kernel size on hardness and various quality characteristics. Qual. Assur. Saf. Crop. Foods 2019, 11, 459–464. [Google Scholar] [CrossRef]
  43. Muhamad, I.I.; Campbell, G.M. Effects of kernel hardness and moisture content on wheat breakage in the single kernel characterisation system. Innov. Food Sci. Emerg. Technol. 2004, 5, 119–125. [Google Scholar] [CrossRef]
  44. Dziki, D.; Cacak-Pietrzak, G.; Miś, A.; Jończyk, K.; Gawlik-Dziki, U. Influence of wheat kernel physical properties on the pulverizing process. J. Food Sci. Technol. 2014, 51, 2648–2655. [Google Scholar] [CrossRef] [PubMed]
  45. Jung, H.; Lee, Y.J.; Yoon, W.B. Effect of moisture content on the grinding process and powder properties in food: A review. Processes 2018, 6, 69. [Google Scholar] [CrossRef]
  46. Cwiklinska, M.; Hanusz, Z.; Soja, J.; Polak, R. Nonparametric Methods in the Analysis of the Quality of Kernel of Selected Winter Wheat Cultivars. Agric. Eng. 2021, 25, 125–134. [Google Scholar] [CrossRef]
  47. Pujol, R.; Létang, C.; Lempereur, I.; Chaurand, M.; Mabille, F.; Abecassis, J. Description of a micromill with instrumentation for measuring grinding characteristics of wheat grain. Cereal Chem. 2000, 77, 421–427. [Google Scholar] [CrossRef]
  48. Gani, A.; SM, W.; FA, M. Whole-Grain Cereal Bioactive Compounds and Their Health Benefits: A Review. J. Food Process. Technol. 2012, 3, 146–156. [Google Scholar] [CrossRef]
  49. Zhu, Y.; Sang, S. Phytochemicals in whole grain wheat and their health-promoting effects. Mol. Nutr. Food Res. 2017, 61, 1600852. [Google Scholar] [CrossRef]
  50. Okarter, N.; Liu, R.H. Health benefits of whole grain phytochemicals. Crit. Rev. Food Sci. Nutr. 2010, 50, 193–208. [Google Scholar] [CrossRef] [PubMed]
  51. Straumite, E.; Galoburda, R.; Tomsone, L.; Kruma, Z.; Gramatiņa, I.; Kronberga, A.; Sturite, I. Nutritional quality of triticale (×Triticosecale Wittm.) grown under different cropping systems. Proc. Latv. Acad. Sci. Sect. B Nat. Exact Appl. Sci. 2017, 71, 481–485. [Google Scholar] [CrossRef]
Figure 1. Measuring stand for the recording of grinding energy of triticale grain.
Processes 11 01477 g001
Figure 2. Average particie size of ground TG samples: C—Carmelo, OC—Octavio, OR—Orinoko, P—Poroto, B—Belcanto, T—Toro, D—Dolindo, G—Gringo. The values designated by the different small letters (a–h) show significant differences between the means.
Processes 11 01477 g002
Figure 3. Specific grinding energy (Es) of TG samples; C—Carmelo, OC—Octavio; OR—Orinoko, P—Poroto, B—Belcanto, T—Toro, D—Dolindo, G—Gringo. The values designated by the different small letters (a–d) show significant differences between the means.
Processes 11 01477 g003
Figure 4. Relationship between the percentage of coarse (A) and fine particles (B) and specific grinding energy (Es) of TG.
Processes 11 01477 g004
Figure 5. Solołowski’s grinding index (Si); C—Carmelo, OC—Octavio; OR—Orinoko, P—Poroto, B—Belcanto, T—Toro, D—Dolindo, G—Gringo. The values designated by the different small letters (a–g) show significant differences between the means.
Processes 11 01477 g005
Figure 6. Total phenolic content (PC) of ground TG samples; C—Carmelo, OC—Octavio; OR—Orinoko, P—Poroto, B—Belcanto, T—Toro, D, Dolindo, G—Gringo. The values designated by the different small letters (a–g) show significant differences between the means.
Processes 11 01477 g006
Figure 7. Antioxidant activity (EC50) of ground TG samples; C-Carmelo, OC-Octavio; OR-Orinoko, P-Poroto, B-Belcanto, T-Toro, D-Dolindo, G-Gringo. The values designated by the different small letters (a–g) show significant differences between the means.
Processes 11 01477 g007
Table 1. Varieties of triticale used for the study.
No.VarietyBreederThe Year of Register in the Polish National List
1CarmeloHR Strzelce *2017
2OctavioHR Strzelce2017
3OrinokoDANKO **2017
4PortoDANKO2017
5BelcantoDANKO2018
6ToroHR Strzelce2018
7DolindoDANKO2019
8GringoDANKO2019
* HR Strzelce—Plant Breeding Strzelce Sp. z o.o. IHAR Group, ** DANKO—DANKO Plant Breeding Sp. z o.o.
Table 2. Basic composition of triticale grain (% dry mass).
VarietyYearProteinFatAsh ContentTotal Dietary FibreAvailable Carbohydrates
Carmelo20209.70 ± 0.26 a*1.66 ± 0.02 ab1.74 ± 0.03 a15.73 ± 0.12 bc72.90 ± 0.20 g
Carmelo202112.33 ± 0.21 f1.65 ± 0.03 a1.82 ± 0.04 ba14.53 ± 0.31 a71.48 ± 0.52 ef
Octavio202010.37 ± 0.15 b1.74 ± 0.02 bc1.94 ± 0.02 ef16.33 ± 0.25 fgh71.56 ± 0.37 ef
Octavio202111.20 ± 0.10 d1.73 ± 0.03 abc1.97 ± 0.01 efg16.00 ± 0.10 cde71.07 ± 0.23 ed
Orinoko20209.50 ± 0.10 a1.82 ± 0.04 d1.84 ± 0.03 cd15.77 ± 0.15 bcd72.92 ± 0.14 g
Orinoko202111.93 ± 025 e1.80 ± 0.02 cd1.83 ± 0.02 c15.43 ± 0.12 bc70.83 ± 0.30 cde
Poroto202011.13 ± 0.06 d1.96 ± 0.02 fgh1.75 ± 0.03 ab16.37 ± 0.21 gh70.54 ± 0.28 cd
Poroto202110.77 ± 0.06 c1.99 ± 0.03 gh1.77 ± 0.02 abc16.13 ± 0.21 def71.11 ± 0.24 de
Belcanto202012.23 ± 0.15 ef1.88 ± 0.02 de1.98 ± 0.03 efg15.47 ± 0.15 bc70.42 ± 0.02 cd
Belcanto202110.20 ± 0.20 b1.90 ± 0.04 ef1.99 ± 0.03 fg15.37 ± 0.15 b72.53 ± 0.39 g
Toro202012.77 ± 0.25 g1.97 ± 0.03 gh2.04 ± 0.01 g16.37 ± 0.15 gh68.90 ± 0.22 b
Toro202110.13 ± 0.21 b1.99 ± 0.02 gh2.00 ± 0.01 fg16.63 ± 0.06 gh71.25 ± 0.24 de
Dolindo202012.47 ± 0.47 fg1.85 ± 0.03 de1.80 ± 0.02 abc15.67 ± 0.25 bc70.01 ± 0.20 c
Dolindo20219.50 ± 0.10 a1.92 ± 0.03 efg1.83 ± 0.03 c16.27 ± 0.21 efg72.31 ± 0.23 fg
Gringo202012.73 ± 0.12 g2.02 ± 0.02 h1.93 ± 0.02 ef17.60 ± 0.35 k67.64 ± 0.32 a
Gringo202111.40 ± 0.10 d2.00 ± 0.02 gh1.91 ± 0.03 de17.43 ± 0.15 k69.17 ± 0.15 b
* The values designated by the different letters a–h are significantly different (p < 0.05).
Table 3. Particle size distribution of ground triticale samples.
VarietyYearRange of Particles (mm)
>1.0 mm0.8–1.00.6–0.80.4–0.60.2–0.40.1–0.2<0.1
Carmelo202017.0 ± 0.6 fgh15.1 ± 0.2 bcde18.4 ± 0.2 abc16.4 ± 0.9 defg17.1 ± 0.9 de7.3 ± 0.2 ab8.7 ± 1.5 a
Carmelo202117.0 ± 0.5 fgh15.1 ± 0.2 bcde18.1 ± 0.4 a15.6 ± 1.0 cde16.9 ± 0.9 cde7.8 ± 0.1 ab9.5 ± 1.5 a
Octavio202015.8 ± 0.2 fgh16.0 ± 0.2 efg19.0 ± 0.3 abcd14.6 ± 0.3 bc17.0 ± 0.3 de8.8 ± 0.2 bc8.9 ± 0.2 a
Octavio202118.0 ± 0.3 h15.9 ± 0.4 efg18.0 ± 0.3 a14.5 ± 0.3 bc14.8 ± 0.2 ab8.7 ± 0.3 bc9.1 ± 0.3 a
Orinoko20209.5 ± 0.4 bc13.8 ± 0.6 abcd19.8 ± 0.2 def16.9 ± 0.1 efg17.4 ± 0.1 def11.3 ± 0.1 def11.3 ± 0.6 ab
Orinoko202110.7 ± 0.1 bcde13.3 ± 0.1 abc19.1 ± 0.6 abcd16.6 ± 0.4 defg17.7 ± 0.4 defg11.3 ± 0.1 def11.5 ± 0.5 ab
Poroto202013.5 ± 0.1 def17.1 ± 0.1 fgh18.2 ± 0.2 ab15.1 ± 0.0 cd16.9 ± 0.2 cde11.6 ±0.1 def7.6 ± 0.2 a
Poroto202114.3 ± 4.4 efg15.3 ± 1.8 cdef18.5 ± 0.5 abc15.5 ± 1.1 cde17.2 ± 0.6 de10.2 ± 1.0 cde9.0 ± 2.9 a
Belcanto202011.9 ± 0.2 cde15.5 ± 0.3 def19.7 ± 0.1 edef15.6 ± 0.2 cde17.2 ± 0.2 de8.8 ± 0.1 bc11.5 ± 0.3 ab
Belcanto202110.4 ± 1.3 cd15.7 ± 0.4 defg19.1 ± 0.5 abcd15.7 ± 0.3 cdef15.9 ± 1.3 bcd11.2 ± 2.2 def12.0 ± 0.4 ab
Toro20206.6 ± 0.2 ab13.2 ± 0.1 ab20.5 ± 0.4 ef17.6 ± 0.2 g19.17 ± 0.2 h12.9 ± 0.2 f10.1 ± 0.2 ab
Toro20215.7 ± 0.9 a12.0 ± 0.9 a19.1 ± 0.9 abcd16.4 ± 1.0 defg18.9 ± 0.5 gh12.3 ± 0.6 ef15.7 ± 4.7 b
Dolindo202017.6 ± 0.3 gh18.7 ± 0.2 h19.4 ± 0.3 bcde12.5 ± 0.3 a14.1 ± 0.2 a6.3 ± 0.1 a11.5 ± 0.2 ab
Dolindo202116.4 ± 0.6 fgh17.4 ± 1.0 gh18.2 ± 0.8 ab13.4 ± 0.5 ab15.4 ± 0.2 abc7.51 ± 1.1 ab11.8 ± 0.5 ab
Gringo202010.5 ± 0.2 cd15.4 ± 0.3 cdef20.7 ± 0.1 f17.4 ± 0.1 fg17.8 ± 0.2 efg1.0 ± 0.2 cd8.3 ± 0.2 a
Gringo202116.6 ± 0.21 fgh16.4 ± 0.3 efg18.7 ± 0.3 abcd15.4 ± 0.3 cde16.2 ± 0.5 bcd8.4 ± 0.1 bc8.5 ± 0.3 a
The values designated by the different superscript letters a–h are significantly different (p < 0.05).
Table 4. Variance analysis of average particle size of ground TG.
ParameterSource of VarianceDegree of FreedomMean SqueareF-Testp-Value
Year0.0000110.000010.030.863480
Variety0.0946270.0135250.280.000000
Year × Variety0.0095170.001365.050.000661
Table 5. Variance analysis of specific grinding energy.
ParameterSource of VarianceDegree of FreedomMean SqueareF-Testp-Value
Year0.1310.130.440.511644
Variety87.74712.5342.060.000000
Yeason × Variety1.1270.160.540.798969
Table 6. Variance analysis of Sokołowski grinding index.
ParameterSource of VarianceDegree of FreedomMean SqueareF-Testp-Value
Year0.1210.100.100.750952
Variety427.10761.0153.130.000000
Year × Variety13.8171.971.720.141141
Table 7. Variance analysis of total phenolics content.
ParameterSource of VarianceDegree of FreedomMean SqueareF-Testp-Value
Year0.1535310.0219313.310.000000
Variety0.0744270.0744242.160.000000
Year × Variety0.1161670.0165910.070.000001
Table 8. Variance analysis of antiradical activity of TG.
ParameterSource of VarianceDegree of FreedomMean SqueareF-Testp-Value
Year67.81196.927.170.000000
Variety451.07451.0126.500.000000
Year × Variety0.695799.327.850.000000
Disclaimer/Publisher’s Note: The statements, opinions and data contained in all publications are solely those of the individual author(s) and contributor(s) and not of MDPI and/or the editor(s). MDPI and/or the editor(s) disclaim responsibility for any injury to people or property resulting from any ideas, methods, instructions or products referred to in the content.

