Article

Predicting Octane Number of Petroleum-Derived Gasoline Fuels from MIR Spectra, GC-MS, and Routine Test Data

1
Grupo de Yacimientos de Hidrocarburos, Departamento de Procesos y Energía, Facultad de Minas, Universidad Nacional de Colombia, Sede Medellín, Cra 80 65-223, Medellín 050034, Colombia
2
Grupo de Investigación en Fenómenos de Superficie-Michael Polanyi, Departamento de Procesos y Energía, Facultad de Minas, Universidad Nacional de Colombia, Sede Medellín, Cra 80 65-223, Medellín 050034, Colombia
*
Authors to whom correspondence should be addressed.
Processes 2023, 11(5), 1437; https://doi.org/10.3390/pr11051437
Submission received: 22 March 2023 / Revised: 22 April 2023 / Accepted: 26 April 2023 / Published: 9 May 2023

Abstract

:
Petroleum-derived gasoline is still the most widely used liquid automotive fuel for ground vehicles equipped with spark-ignition engines. One of the most important properties of gasoline fuels is their antiknock performance, which is experimentally evaluated via the octane number (ON). It is widely accepted that the standard methods for ON measuring (RON: research octane number and MON: motor octane number) are very expensive due to the costs of the experimental facilities and are generally not suitable for field monitoring or online analysis. To overcome these intrinsic problems, it is convenient that the ON of gasoline fuels is estimated via faster methods than the experimental tests and allows for acceptable results with acceptable reproducibility. Various ON prediction methods have been proposed in the literature. These methods differ in the type of fuels for which they are developed, the input features, and the analytical method used to underlie the link between input features and ON. The aim of this work is to develop and evaluate three empirical methods for predicting the ON of petroleum-derived gasoline fuels using MIR spectra, GC-MS, and routine test data as input features. In all cases, the chosen analytical method was partial least squares regression (PLSR). The best performance for both MON and RON prediction corresponded with the composition-based model, since it presented lesser evaluation indices (RMSE, MAE, and R2) and more than 80% of residuals were within the established criteria (sum of the reproducibility and the uncertainty of the standard method). Although the routine-test-data-based method performed poorly according to the established criterion, its use could be recommended in cases of scarce data since it showed an acceptable value of R2 and physical consistency. Despite their empirical nature, the proposed prediction models based on MIR (mid-infrared) spectra, GC-MS, and routine test data had the potential to predict the RON and MON of real gasoline fuels commercialized in Colombia.

1. Introduction

Petroleum-derived gasoline is still the most widely used liquid automotive fuel for ground vehicles equipped with spark-ignition engines. Commercial automotive gasoline fuels are complex mixtures composed primarily of hydrocarbons belonging to four main families: aromatic, olefinic, paraffinic (straight-chain and branched), and naphthenic. In addition, gasoline fuels also contain several additives and oxygenated compounds such as alcohols or ethers. The chemical composition and hydrocarbon molecular structure determine the fuel physicochemical properties, which in turn affect fuel quality, engine performance, combustion characteristics, and emissions. One of the most important properties of gasoline fuels is their antiknock performance, which is governed by the ability of the “end-gas” (fuel/air mixture yet to ignite) to resist autoignition when simultaneously being compressed by the piston and the flame-front. This fundamental characteristic can, to a large extent, dictate the ability of an engine to work to its full thermodynamic potential [1].
The antiknock performance of gasoline fuels is commonly evaluated using an empirical index called the octane number (ON), in such a way that gasoline fuels with a higher ON can be utilized in spark-ignition engines with a higher compression ratio, producing a higher engine thermal efficiency and smoother engine running [2,3].
The ON is directly measured by using a standardized single-cylinder engine that can accurately adjust the compression ratio. The test and reference fuels are burned in the engine to measure their knocking tendency under standard experimental conditions. According to the different experimental standards, namely ASTM D2699 [4] and ASTM D2700 [5], ON is classified into the research octane number (RON) and motor octane number (MON), respectively. The MON assesses the fuel’s resistance to detonation when the engine operates under severe conditions, while the RON measures how the fuel resists detonation when the motor is under a full load at low rpm. All practical fuels have RON higher than MON, and the difference between RON and MON is known as octane sensitivity [1]. For commercial purposes, manufacturers prefer to use the so-called antiknock index (AKI), defined as the average between the RON and MON. Although the effectiveness of the two standard methods is not questioned by the industrial and research community, they result in being expensive due to the costs of the experimental facilities (engine and instrumentation) and reagents (standards of purity and quantity) to be employed and are generally not suitable for field monitoring or online analysis because of the equipment size and complicated instrumentation and/or long analysis time required. To overcome these intrinsic problems, it is convenient that the ON of gasoline fuels is estimated via faster methods than the mentioned standard tests which allow for acceptable results with high repeatability and reproducibility [6,7].
Various ON prediction methods have been proposed in the literature. These methods differ in the type of fuels for which they are developed, the input features, and the analytical method used to underlie the link between input features and ON. In relation to the type of fuels, there are prediction methods for pure hydrocarbons [8,9], commercial gasoline [10,11], oxygenated gasoline [12,13], gasoline surrogate fuels [1], and fuels for advanced combustion engines [6]. The input features can either be chemical or physical attributes such as chemical composition [14,15], infrared spectroscopy [16,17], NIR [18,19], MIR [20,21], FT-Raman spectroscopy [22], nuclear magnetic resonance spectroscopy [2,23], distillation curves [24], flame spectroscopy emission [25], dielectric spectrum [26], and ignition delay time [27]. Regarding the analytical methods used in ON prediction, most studies have employed multivariate methods such as PLSR (partial least square regression) or PCR (principal component regression). However, the non-linear nature of the ON behavior in complex mixtures has led many researchers to build correlations via machine-learning methods or other novel approaches such as artificial neural networks (ANNs), support vector machines (SVMs), Bayesian estimation, and random forest [21,28].
Since it is evident that ON is highly dependent on the chemical nature of gasoline fuels, prediction methods based on chemical composition should be the preferred option. However, the development of this type of method is not straightforward due to the complexity of the gasoline composition and the non-linear blending characteristics of the ON of the individual components and gasoline blend stocks [14,21]. The composition of gasoline can vary widely depending on the refineries’ crude diet, the refining processes, such as cracking or catalytic reforming, and local regulations [29]. The chemical complexity of gasoline is due, in part, to the high structural diversity in its components (aromatic, olefinic, paraffinic (straight-chain and branched), and naphthenic hydrocarbons). For example, in the case of alkanes, it is observed that isoparaffins have better performance than n-alkanes. Furthermore, the ON of isoparaffins depends on a variety of structural features, such as the size of the molecule and the type, position, separation, and number of branches. Specifically, ON decreases with the separation between branches and increases with the more central position of branches and with their bulkiness [30].
Van Leeuwen et al. [14] developed several models for the prediction of ON from high-resolution gas chromatographic data (GC). Initially, they used linear models based on PCR and multiple linear regression (MLR) to establish a relation between RON and PIANO (paraffins, isoparaffins, aromatics, naphthenes, and olefins) groups. With neither PCR nor MLR, acceptable results were found, unless via the inclusion of many variables or principal components. Later, the researchers proposed two non-linear non-parametric methods (projection pursuit regression and neural network) to model the relation between RON and PIANO groups. The RMSEP (root mean square error of prediction) was near the inherent variance in the ON. The data set consisted of 851 gasoline fuels with known ROM and MON. GC analysis (carbon distribution over 418 individual components) and classification in PIANO groups were available for each gasoline. Nikolaou et al. [31] proposed a simple non-linear method for NO prediction using compositional data from high-resolution capillary GC analysis. The method utilized calculable weighting factors, which were specific for each gasoline blend used, and showed excellent agreement with the experimental RON values of various refinery isomerate samples. Ghosh et al. [11] developed a composition-based predictive model for both RON and MON. They claimed that their model could be universally applied across a wide variety of gasoline fuels derived from different naphtha process streams and blends, and that it was applicable to a broad range of ONs from 30 to 120. The ON was correlated to 54 hydrocarbon lumps and 3 lumps for oxygenates measured via gas chromatography. The model predicted the ON to be within a standard error of one number for both the RON and MON. The authors argued that the blend value of a molecule i or a lump i varied almost linearly with the ON of the gasoline fuel that it was part of or blended into. Alexandrovna and Tuyen [32] presented a mathematical model for predicting the ON of gasoline fuels from different naphtha process streams. The ON was correlated to a total of 69 hydrocarbons measured via gas chromatography and the intermolecular interaction between hydrocarbons and oxygenates in gasoline blends was considered. The model predicted the ON to be within a standard error of one number for both the MON and RON. Anderson and Wallington [13] developed a model that predicts different ethanol blending responses in the base fuels of different compositions and properties. According to the authors, ethanol blending into gasoline yields a wide range of octane rating responses, most frequently synergistic (i.e., greater than expected via linear blending) but also linear or antagonistic. The proposed model considered an interaction term to the linear molar blending model with a coefficient that quantified the synergistic/antagonistic blending effect. Fuel property and hydrocarbon composition data for 299 ethanol–gasoline blends and their 90 complex base fuels were collected from the literature, market gasoline fuels, blend stocks for oxygenate blending, and research fuels.
Among the ON prediction methods based on spectroscopy techniques, near-infrared spectroscopy (NIRS) has become an attractive method for gasoline analysis and ON prediction because most of the absorption bands observed in this region are due to overtones and/or combinations of carbon–hydrogen, carbon–carbon, carbon–oxygen, carbonyl-associated groups, and aromatic stretching and deformation vibration of the hydrocarbon molecules [16]. Furthermore, spectroscopic methods such as NIRS appear to be faster and more cost-effective, and require less sample volume [7,33]. Since the spectral data are challenging to analyze, spectroscopic methods almost always need support from chemometric analysis, i.e., statistical mathematics [23]. Consequently, a large number of samples are necessary for both method calibration and validation.
Several reports in the literature have proposed the application of NIRS to assess the ON in gasoline fuels. Pioneer work was carried out by Kelly et al. [10] who evaluated several ASTM specifications, including RON and MON, using a short wavelength near infrared (SW-NIR) scanning spectrophotometer (660–1215 nm) and partial least squares (PLS) data analysis. They reported that the RON of gasoline was predicted with a standard error within 0.4–0.5. Bohács et al. [16] developed a method to predict the RON and MON of gasoline fuels using NIR spectroscopy with fiber optics in combination with PLSR. The R and standard error values for the model (0.975 and 0.34 for RON, and 0.972 and 0.30 for MON, respectively) indicated that the NIR-predicted ONs were superior compared to the reproducibility of the standard tests. Felício et al. [18] compared different partial least squares algorithms used on mid- and near-infrared data for assessing several fuel parameters, including RON. The applied techniques were single PLS, multiblock PLS, and serial PLS. According to the authors, the best calibration model was single PLS since the results were quite accurate and were achieved in less time. Daly et al. [9] correlated IR-ATR (infrared-attenuated total reflectance absorbance) spectra data to RON by way of PCR. They used neat hydrocarbons and surrogate fuels to provide the model input for predicting the RON of fuels for advanced combustion engines (FACE). Al Ibrahim and Farook [21] developed a model for the prediction of the RON and MON of hydrocarbon mixtures and gasoline–ethanol blends based on infrared spectroscopy data of pure components. Infrared spectra for neat hydrocarbon species were used to generate the spectra of hydrocarbon blends by averaging the spectra of their pure components on a molar basis. The authors demonstrated that several features from the group contribution method could be extracted from IR spectra by applying PLSR. Furthermore, they proposed an ANN method to predict the RON and MON using the features from the group contribution method as inputs. Finally, they reported mean absolute errors from an ANN of 0.56 and 0.73 for RON and MON, respectively, which were within the experimental uncertainty of octane testing. Wang et al. [26] combined a dimensional reduction method with ANN to build an ON prediction model with the input parameters being the NIR spectra. Landmark–isometric feature mapping (L-Isomap), as a novel manifold learning algorithm, was used for the dimensionality reduction in spectral data. Wu et al. [7] developed a model for determining the RON of gasoline fuels based on NIRS and ANN methods. They argued that when the input features were PLS factors extracted via the PLSR method, at least 90% of residuals were within the experimental error range. The model was validated using a sample of 200 gasoline fuels collected from different regions of China with values of RON ranging from 90 to 100. Results showed that the selected PLS factors generally contained the C-H bond vibration information, the second vibrational overtone of the C-H bond, and the vibrational combination of the C-H bond.
Instead of analytical methods such as GC and NIRS, several researchers have focused their efforts on developing ON prediction approaches based on fuel properties that can be determined via inexpensive test methods. Mendes et al. [34] used distillation curves (ASTM D86) associated with PLS to predict the MON and RON values of gasoline fuels from different Brazilian refineries, in a range between 81.6 and 83.4 for MON, and 97.3 and 101.4 for RON. The RMSEC (root mean square error of calibration) values obtained were 0.051 and 0.078, and the RMSEP (root mean square error of prediction) values were 0.063 and 0.085 for MON and RON, respectively. Tipler et al. [12] investigated 41 parameters from inexpensive tests to find a link between fuel properties and the RON and MON. They first reduced the number of properties to only consider the principal ones relying on PCA. Then, they applied ANN to identify the underlying links between the selected properties (different points of the distillation curve, the atomic mass fraction, and the specific gravity) and the ON. According to the authors, the methodology was only validated for a gasoline blend stock mixed with an oxygenated molecule and the MSE was equal to 0.7.
As a summary, Table 1 shows a comparison between the several representative models described in this section.
Despite the multiple efforts mentioned above, it has not been possible to develop ON prediction methods that can be generalized to any gasoline fuel or even to a specific type such as petroleum-derived gasoline. Part of this limitation in the proposed models originates from the purely empirical and statistical nature of the underlying mathematical structure used to develop the models, making them rather restrictive for extrapolation. In addition, the ON is not strictly a physical property, but an empirical index, petroleum-derived gasoline fuels are very complex mixtures, and the ON of their components (pure hydrocarbons, alcohols, or blend stocks) typically exhibits non-linear blending characteristics. The aim of this work is to propose alternative models that can be applied to predict the ON of gasoline fuels marketed in Colombia (petroleum-derived fuels with 10% added ethanol). Bearing this in mind, three prediction models with different input features were developed and evaluated. The first model was based on the detailed chemical composition of the gasoline samples determined via CG-MS. In principle, an adequate identification of the individual components with a greater contribution to a complex property such as ON can help local refiners in the process of gasoline compounding. To simplify the analytical process and the time needed for analysis, a model based on MIR spectroscopy was implemented. Portable pieces of equipment based on NIR or MIR spectroscopy and chemometrics are frequently used in mobile laboratories to test that the fuel quality is right at filling stations, fighting fuel adulteration fraud. With the purpose of estimating the ON of gasoline fuels as part of routine analysis, a third method based on two physical properties (density and volatility) and the ethanol content on a volumetric basis was developed. The main novelty of the last method is to correlate a complex parameter such as ON with simple and easy-to-measure fuel properties such as the API (American Petroleum Institute) gravity and representative points of the distillation curve.

2. Materials and Methods
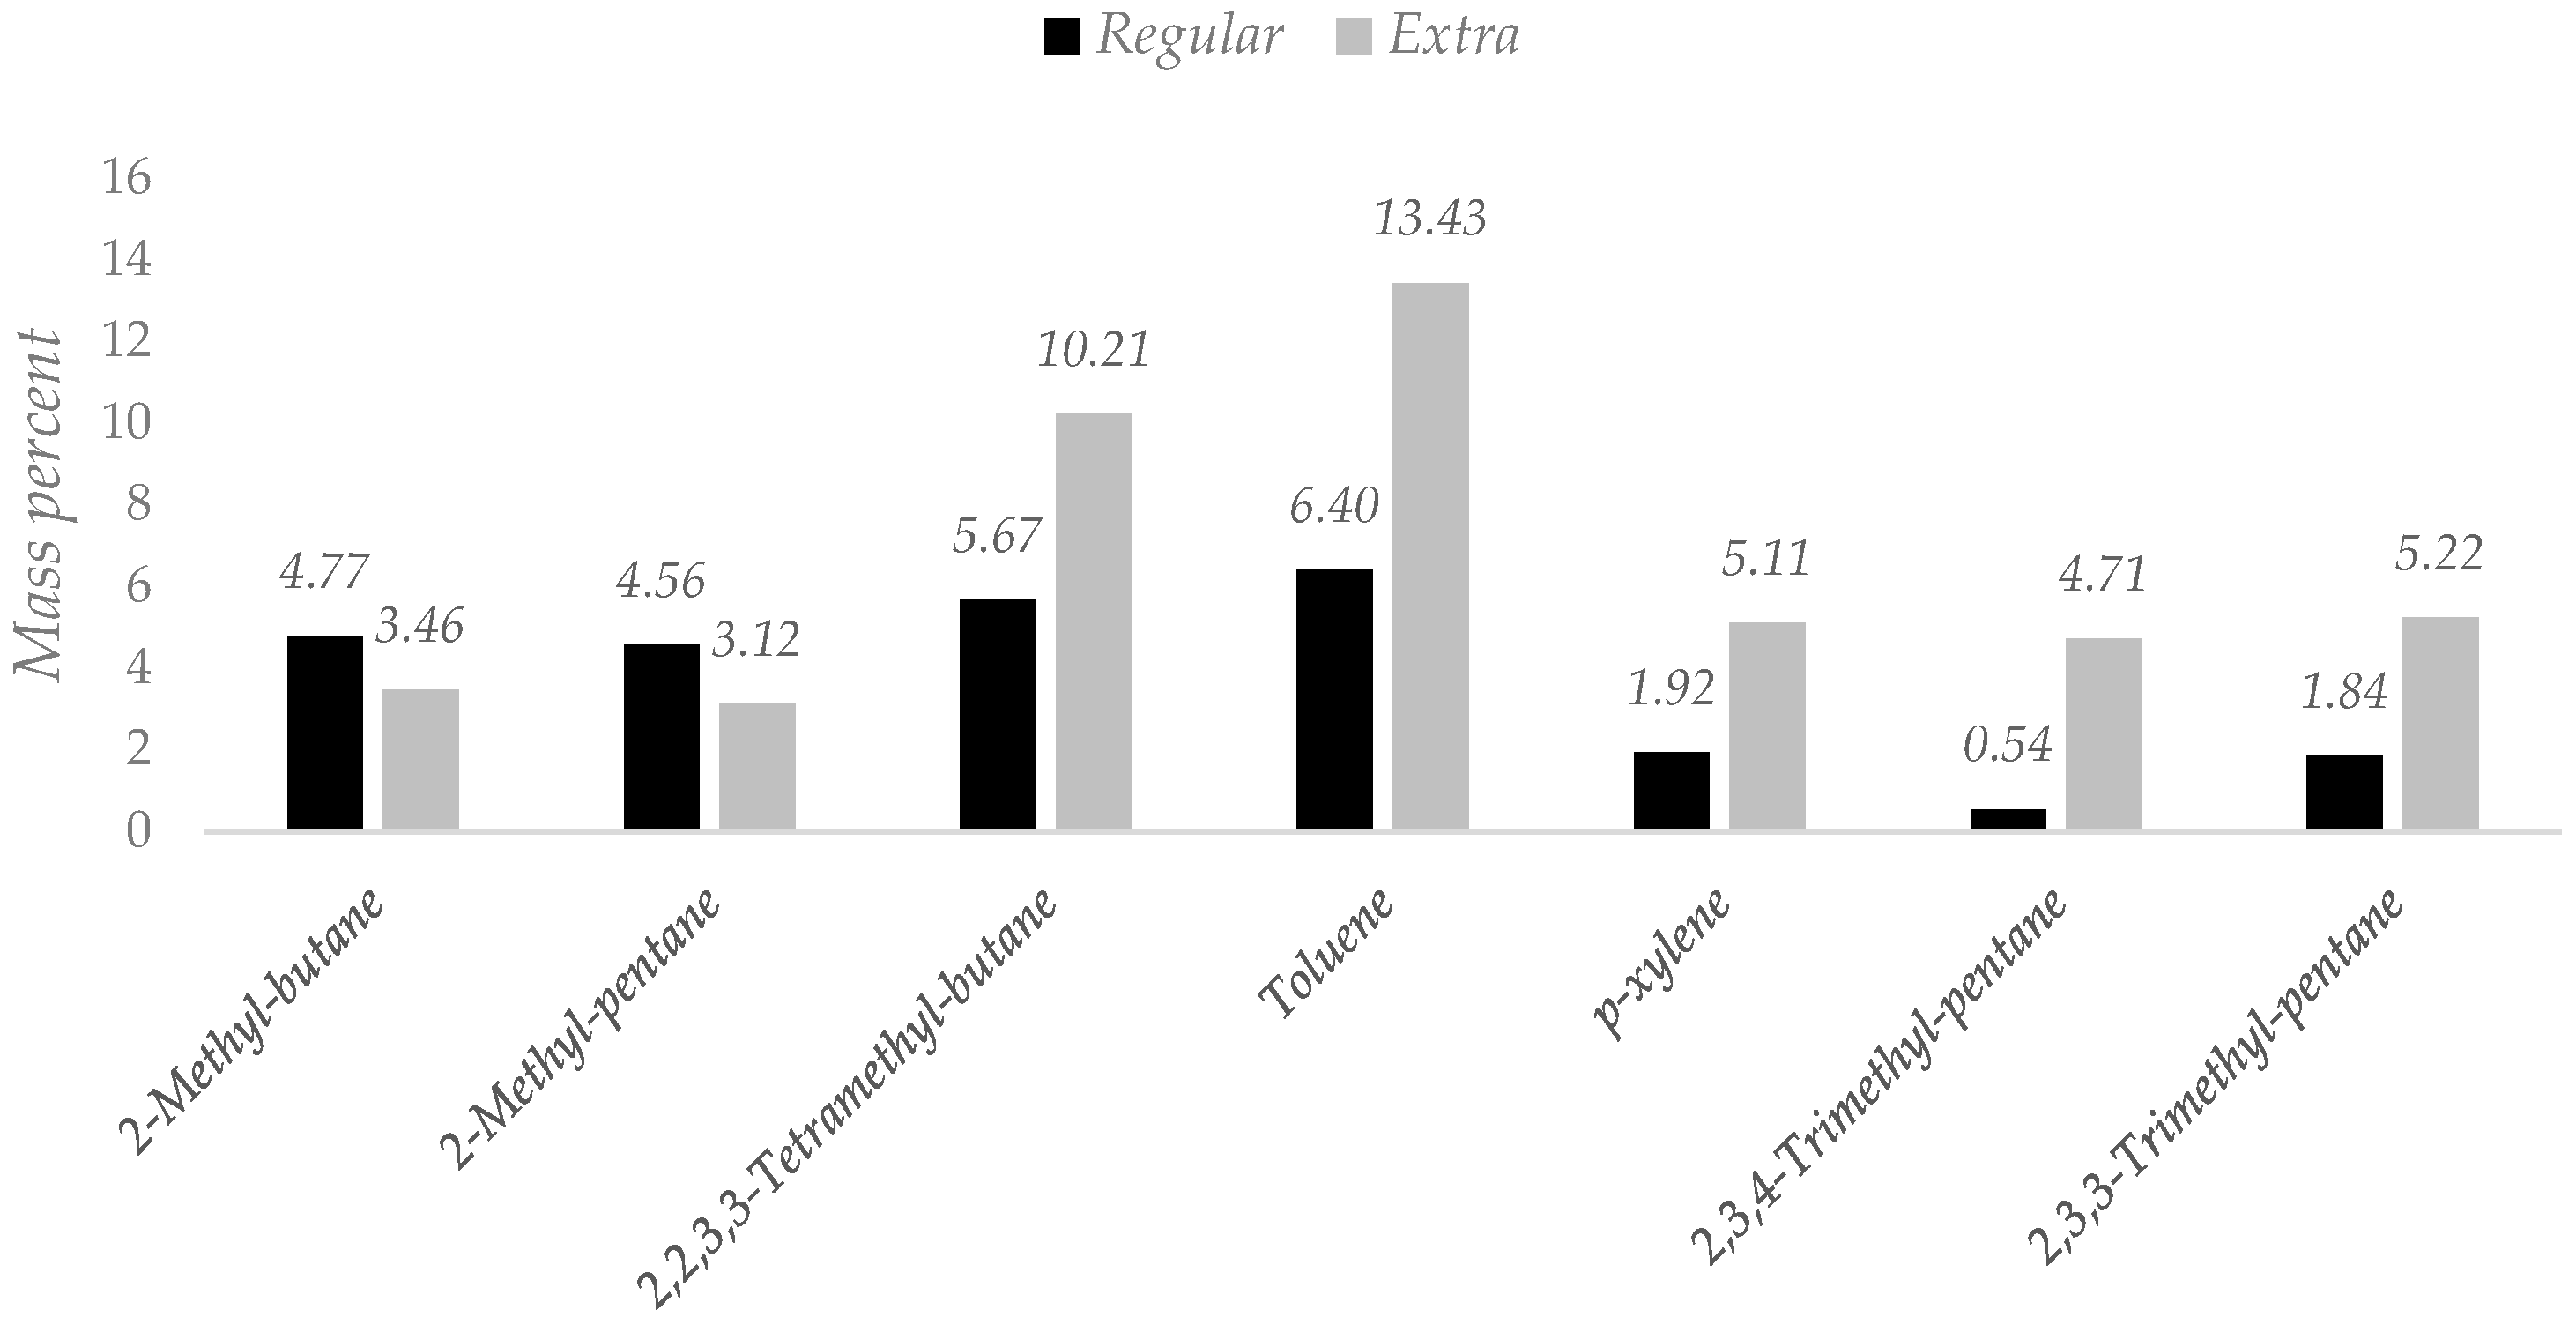
This section is organized in agreement with the three main differences between the ON prediction methods: the type of fuels for which they are developed, the input features, and the analytical method used to underlie the link between input features and ON.

2.1. Type of Fuel

Thirty samples of gasoline fuels collected over a twelve-month period were tested. All samples were supplied by a regional service station in Colombia. As established by the Colombian Ministry of Mines and Energy, all gasoline fuels (extra and regular) marketed in the country must have 10% added ethanol. The duration of the sampling period, the sample size and type, and the sampling frequency were selected in such a way as to ensure a set of samples with the appropriate differences in chemical composition and, therefore, physicochemical properties, thus being able to guarantee a detailed statistical analysis [35]. Fuel samples (500 to 700 mL) were freshly sourced, and their homogeneity and stability were guaranteed by storing them in amber-type glass containers in a controlled environment of around −14°C. The octane number values for all samples were determined using a Fourier transform spectrometer eralytics (eraspec model) based on mid-infrared spectroscopy with a measurement range from 70 to 110 for RON and from 60 to 100 for MON. This piece of equipment is designed as a fully automated multifuel analyzer and is periodically calibrated against ON engine measurements.

2.2. Input Features

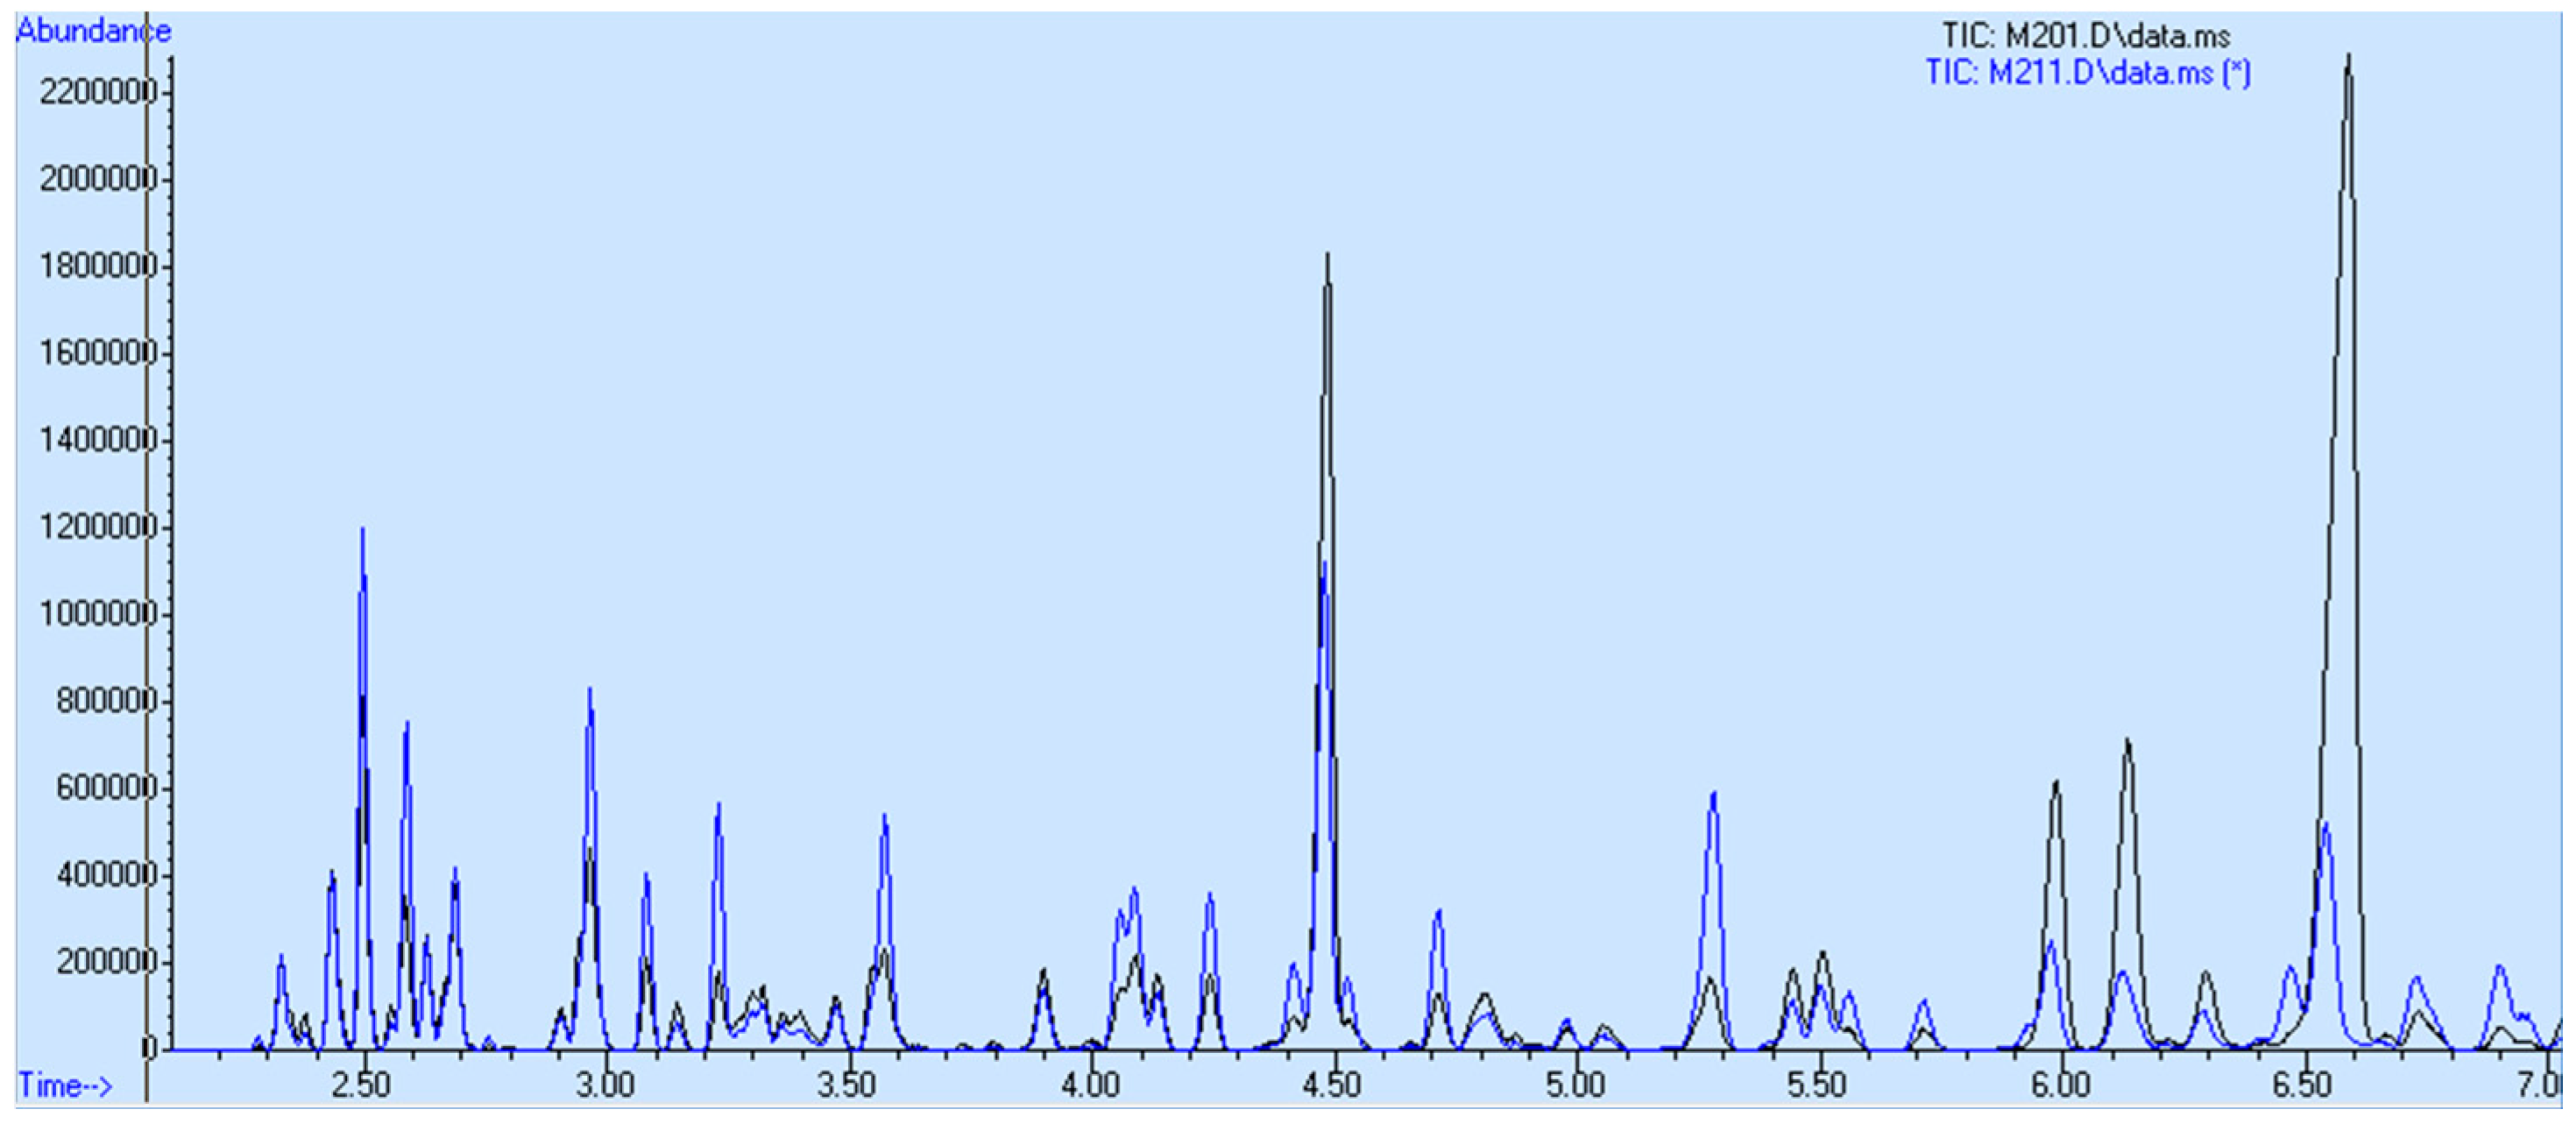
2.2.1. Chemical Composition

The composition of the gasoline samples, expressed as the mass percentage of 69 individual hydrocarbons belonging to the saturated (paraffin), cyclosaturated (naphthenic), olefinic, and aromatic groups, was determined via gas chromatography coupled with mass spectrometry (GC-MS). Quantification was performed using hexadecane as an internal standard and determining the response factors of the reference compounds cyclohexane, hexane, and toluene for naphthenic, paraffin, and aromatics, respectively. It was verified that hexadecane did not interfere with the components of the gasoline samples. The internal standard had a retention time of 57.87 min, while all target compounds had retention times ranging from 2.33 to 31.40 min. Target compounds were monitored via the total ion mode with a mass/charge (m/z) ratio in the range of 35 to 500. Data were analyzed using the MassHunter mass spectrometry software from Agilent company and the compounds were identified according to the NIST 2017 mass spectral library. The analysis was performed in a gas chromatograph coupled with a mass spectrometer (Agilent 7890/MSD 5975C) equipped with an HP-5MS capillary column. The analysis conditions described in the “gasoline analysis method using a GC-MS” published by Shimadzu Corporation (Application Data Sheet 21 [36]) were followed, with minor modifications. The main analysis conditions were vaporization chamber temperature: 250 °C, control mode: constant linear velocity (30.6 cm/s), injection quantity: 1.0 μL, solvent elution time: 0.50 min, and mass range: m/z 35 to 500.

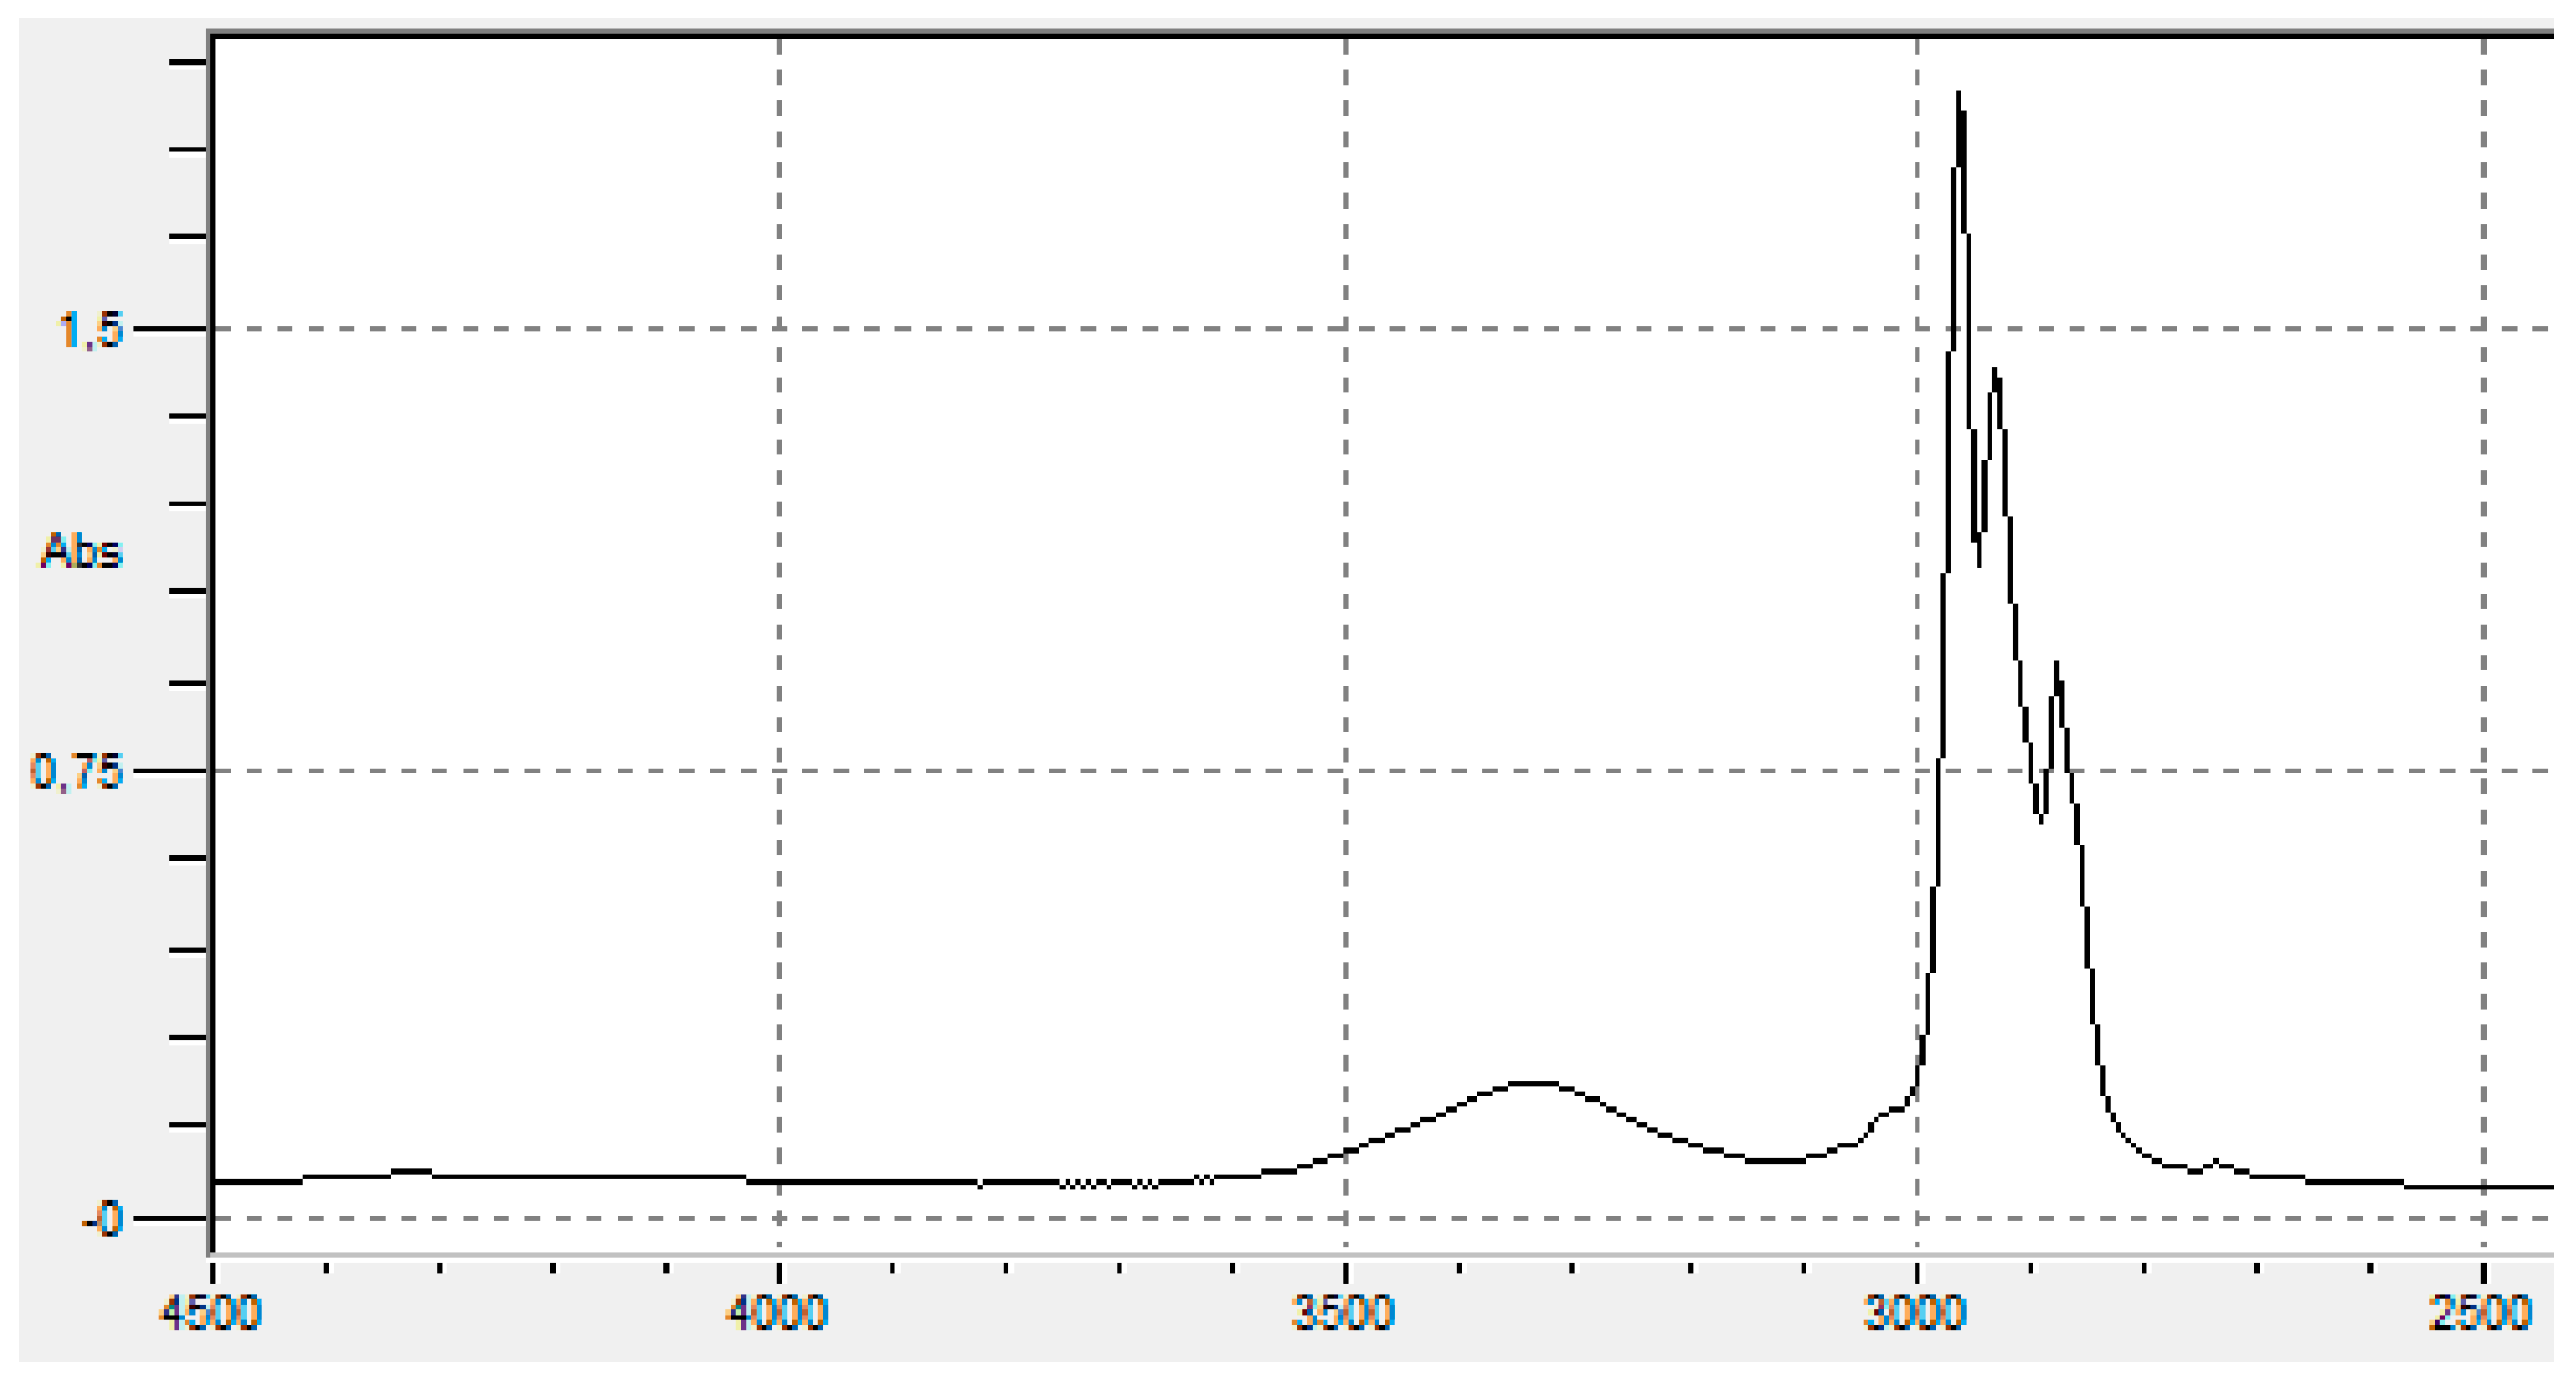
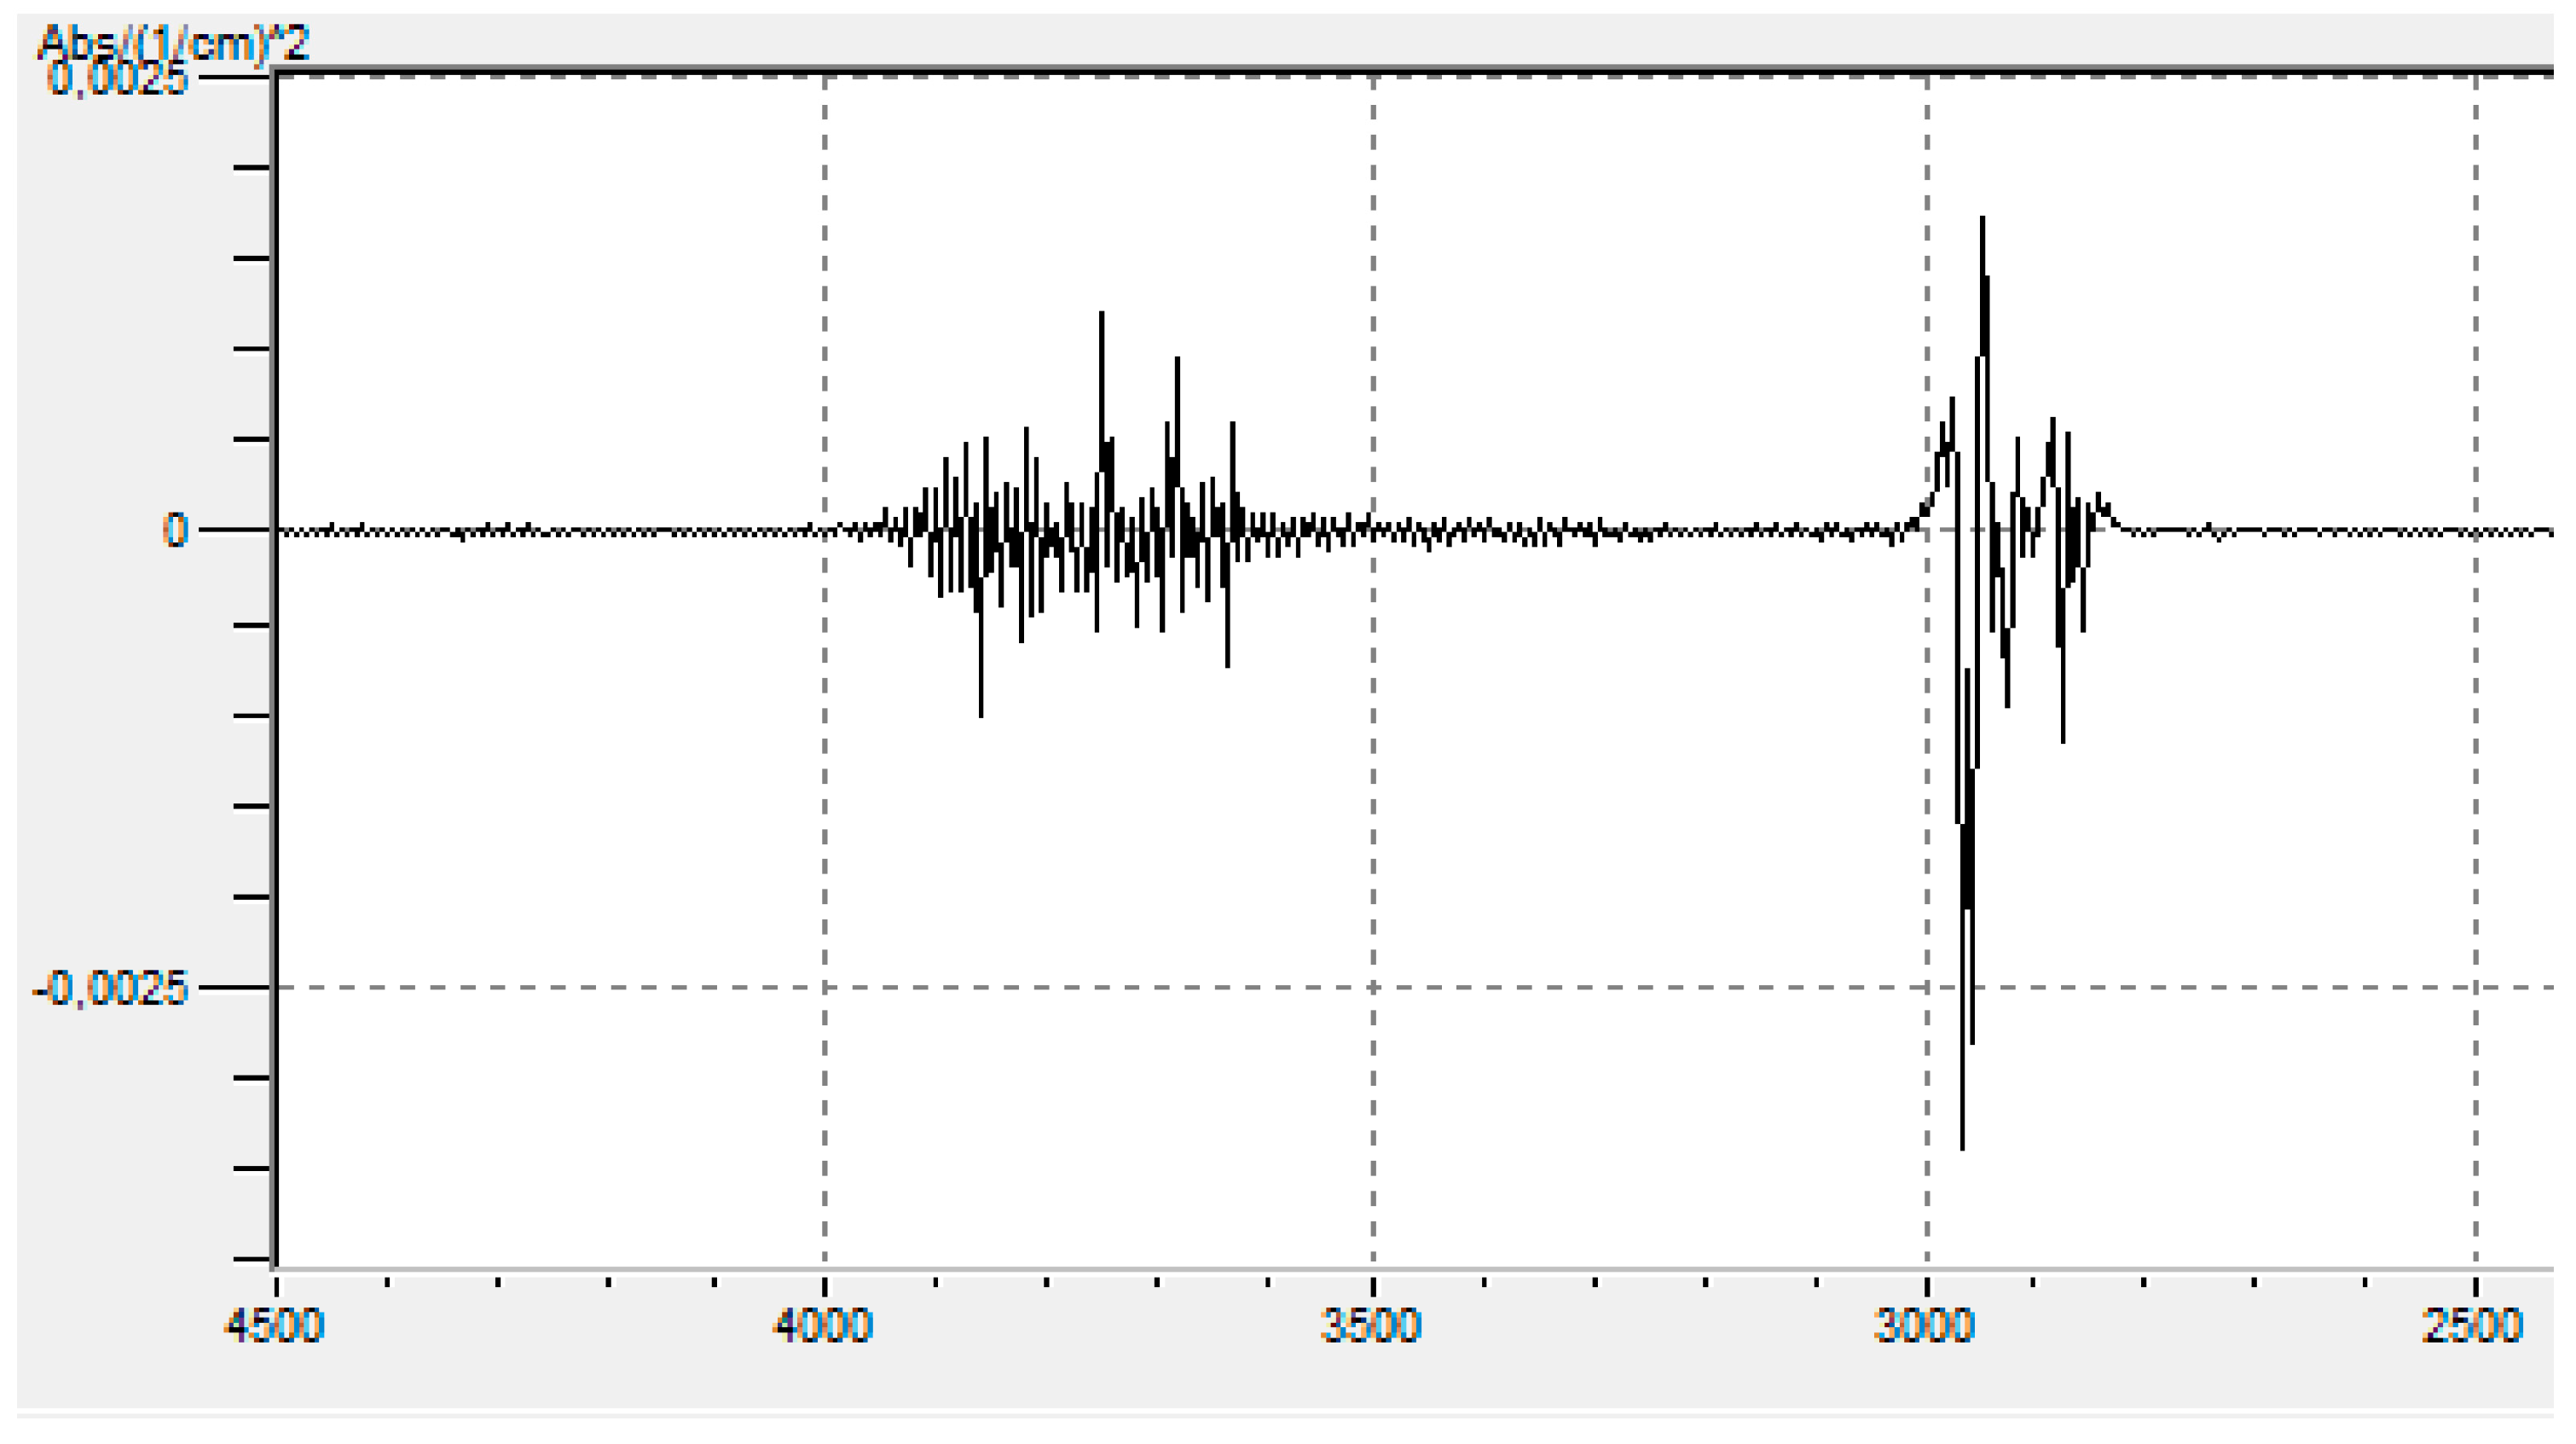
2.2.2. Infrared Spectroscopic Analysis

The absorption spectra of gasoline samples were collected using a Thermo Scientific Nicolet iS5 FTIR (Fourier transform infrared) spectrometer with a spectral range of 7800 to 350 cm−1, a resolution of 0.8 cm−1, and a precision of 0.01 cm−1. A liquid sample cell with a potassium bromide (KBr) window and a verified step length of 0.04 mm was used. FTIR spectrophotometers are mainly used to measure the light absorption of so-called mid-infrared light, which is light in the wavenumber range of 4000 to 400 cm−1 (wavelengths 2.5 to 25 µm). Considering the chemical composition of the collected samples, to facilitate data handling, the wave number range used in this study was 2700 to 3500 cm−1 and the second derivative technique was used to improve the separation of overlapping peaks and thus obtain more useful information. The IRsolution FTIR software was used to perform the second derivative analysis and all mathematical and statistical treatments of the spectra and calibration data. The FTIR spectrometer was also used to quantitatively identify the ethanol percentage in the gasoline samples. According to Conkling et al. [37], the percentage of ethanol in hexanes and gasoline fuels can easily be determined using the O–H and alkane C–H absorptions in an infrared spectrum.

2.2.3. Physical Properties

The distillation curve and the API gravity of all samples were obtained using the proper ASTM standard methods. The API gravity was evaluated using the standard test method for the API gravity of crude oil and petroleum products (hydrometer method), ASTM D287-12b [38]. The distillation test was carried out according to the standard test method for the distillation of petroleum products and liquid fuels at atmospheric pressure, ASTM D86-19 [39]. To better characterize the volatility performance of gasoline fuels, it is recommended to report the initial boiling point (IBP) and the distillation yield at several temperatures, particularly at T10 (temperature at 10% recovery), T50 (temperature at 50% distilled volume), T90 (temperature at 90% distilled volume), and final boiling point (FBP).

2.3. Analytical Method

Given the available database and the need to model the dependency relationship between a dependent (target) variable and multiple correlated independent (explanatory) variables, the chosen analytical method in all cases was partial least squares regression (PLSR). This method is a multivariate statistical technique designed to deal with multiple regression when there is a small sample of data, or when there are missing values or multicollinearity. Furthermore, PLSR focuses on covariance while reducing the dimensionality of correlated variables [40]. To test the performance of the proposed models, three common evaluation indices, root mean squared error (RMSE), maximum absolute error (MAE), and coefficient of determination (R2), were used. RMSE indicates the standard deviation of the residuals (prediction errors); it is a measure of how spread out these residuals are. MAE evaluates the average magnitude of the errors between the predicted and experimental values without considering their direction, and all individual errors have equal weight. R2 reflects the mutual relationship between the predicted and experimental values, and their correlation direction is also identified [7].

3. Results and Discussion

In this section, in addition to the presentation and discussion of the results obtained through the three proposed approaches, an evaluation of the methods as such is also carried out, using a methodology based on the uncertainty generated in the measurement procedures. Furthermore, it is verified that the predicted values are within the reproducibility of the standards adopted in the gasoline conformity assessments.

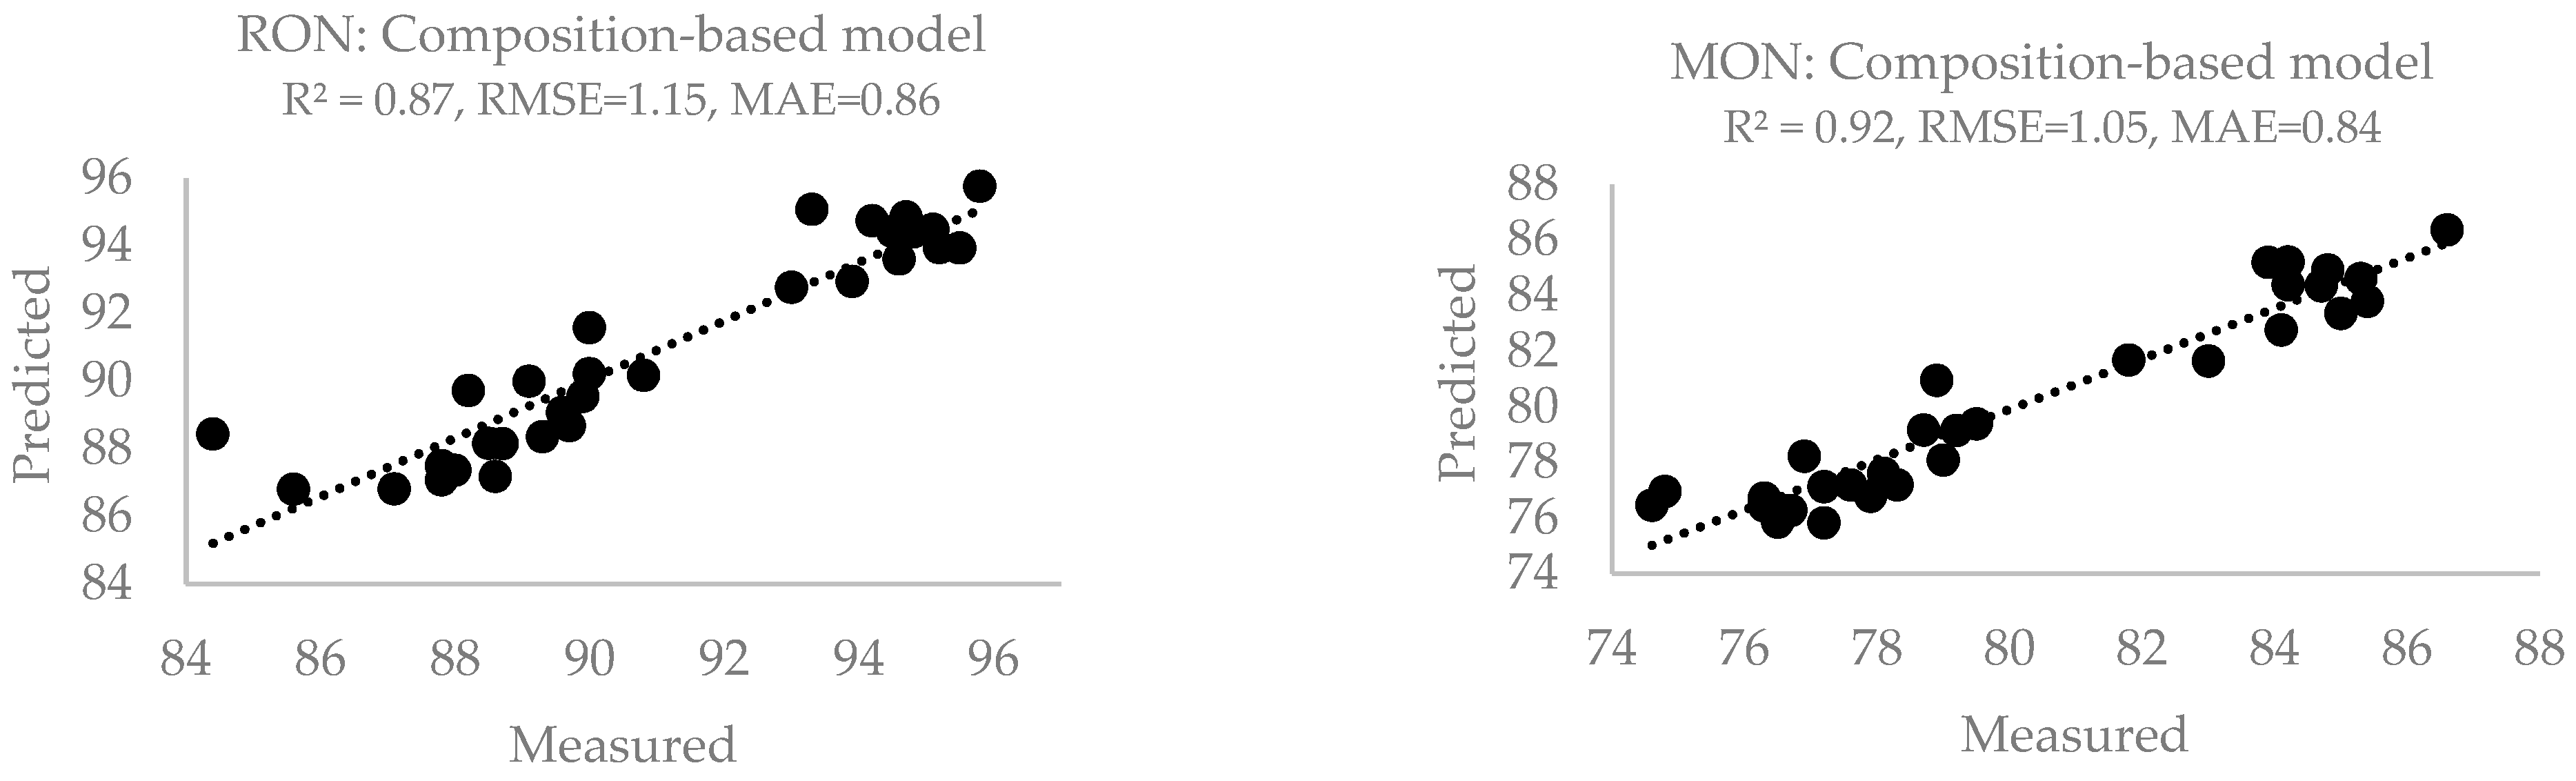
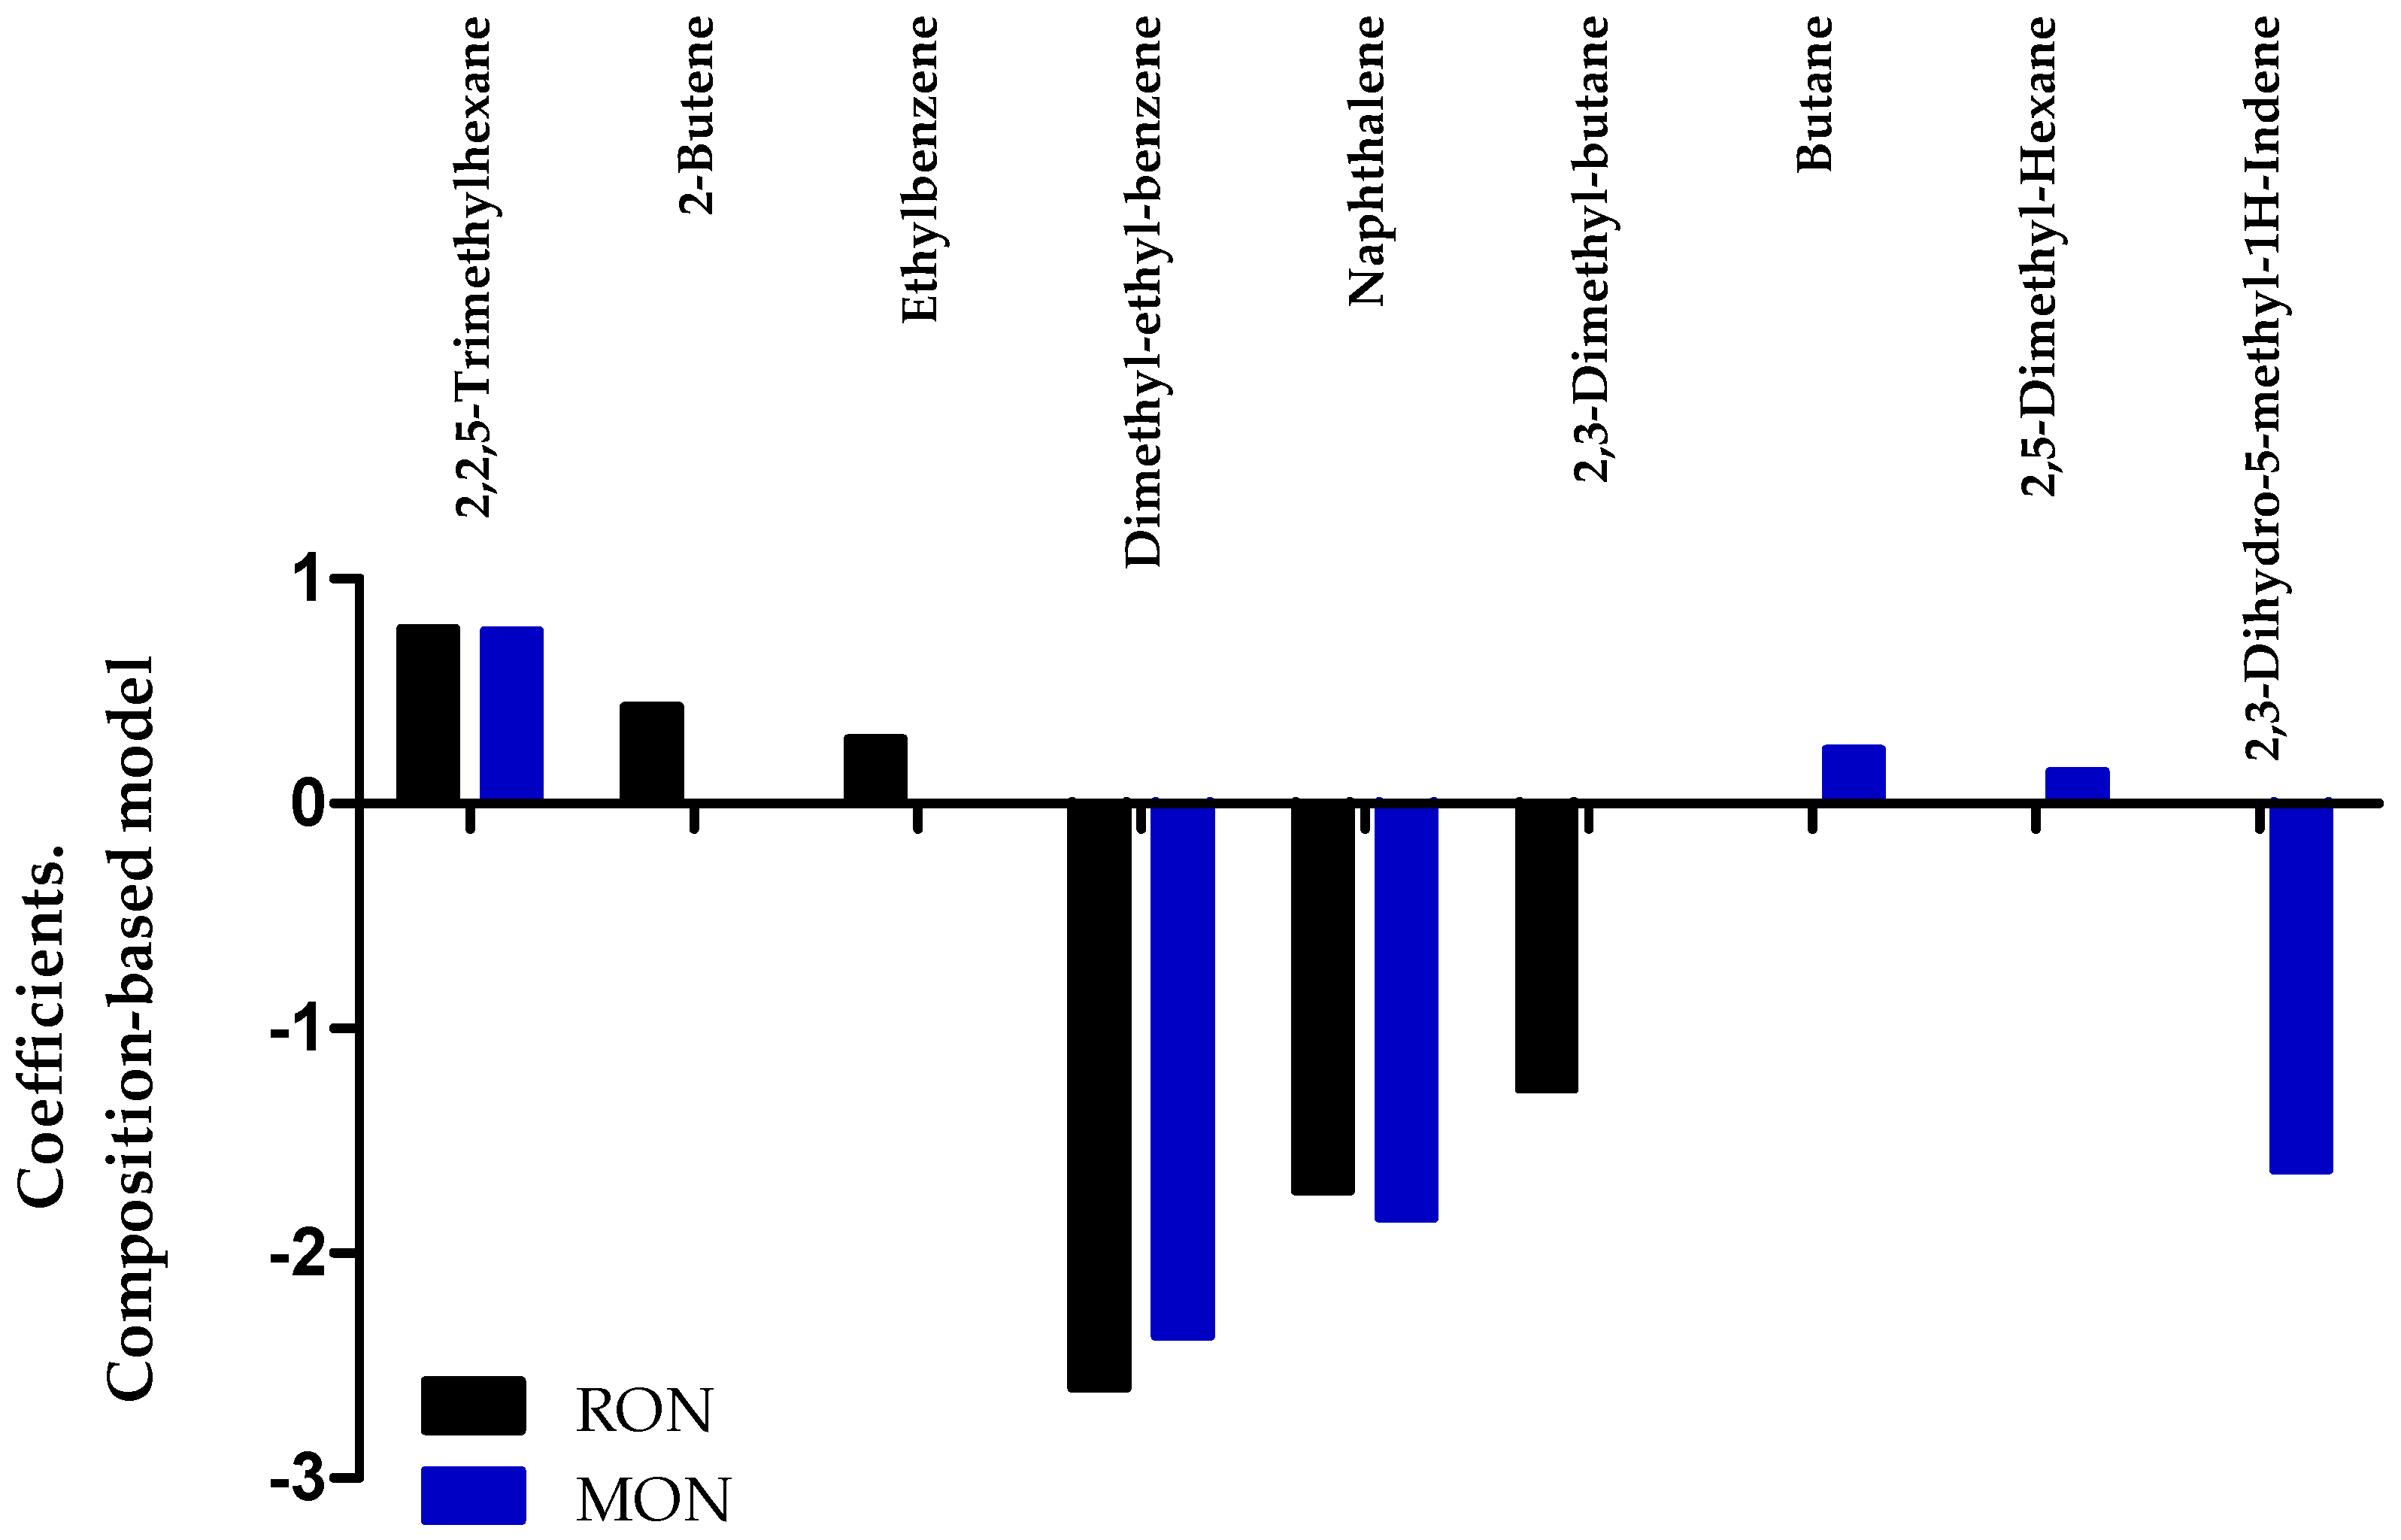
3.1. Composition-Based Model

The GC-MS analysis allowed for identifying 69 individual hydrocarbon components present in the oxygenated gasoline fuels tested. Figure 1 shows the superposed chromatograms of representative extra (RON = 96) and regular (RON = 86) gasoline samples. According to the chromatograms, the individual hydrocarbons with greater concentration were 2-Methyl-butane (retention time, rt = 2.5 min), 2-Methyl-pentane (rt = 2.96), 2,2,3,3-Tetramethyl-butane (rt = 4.47), 2,3,4-Trimethyl-pentane (rt = 5.97), 2,3,3-Trimethyl-pentane (rt = 6.12), toluene (rt = 6.54), and p-xylene (rt = 10.89). Figure 2 shows a comparison of the mass percent (normalized due to the presence of ethanol) of these components in both gasoline fuels. As expected, the extra gasoline with higher ON had a higher content of aromatic hydrocarbons and multibranched isoparaffins.
To determine the existence of significant linear relationships between the input variables, a correlation matrix was calculated, finding strong linear relationships between most of the variables. The strongest direct relationship was 0.99, which occurred across several pairs of variables, for example between 3-Methyl-pentane and 2-Methyl-pentane. The strongest inverse relationship was −0.98 between pentane and ethanol. Due to the multicollinearity between explanatory variables, multiple regressions were obtained via the PLRS analytical method. The results of the composition-based models for the RON and the MON are shown in Figure 3. These models explained 87% and 92% of the variation in the RON and MON, respectively.
Figure 4 shows the variables that had coefficients with higher positive or negative values in the linear regression models. As can be seen in this figure, these coefficients do not correspond to the individual hydrocarbons with a higher or lower ON. This result confirms the purely empirical and statistical nature of the underlying mathematical structure used to develop the models, making them rather restrictive for extrapolation despite their acceptable evaluation indices.

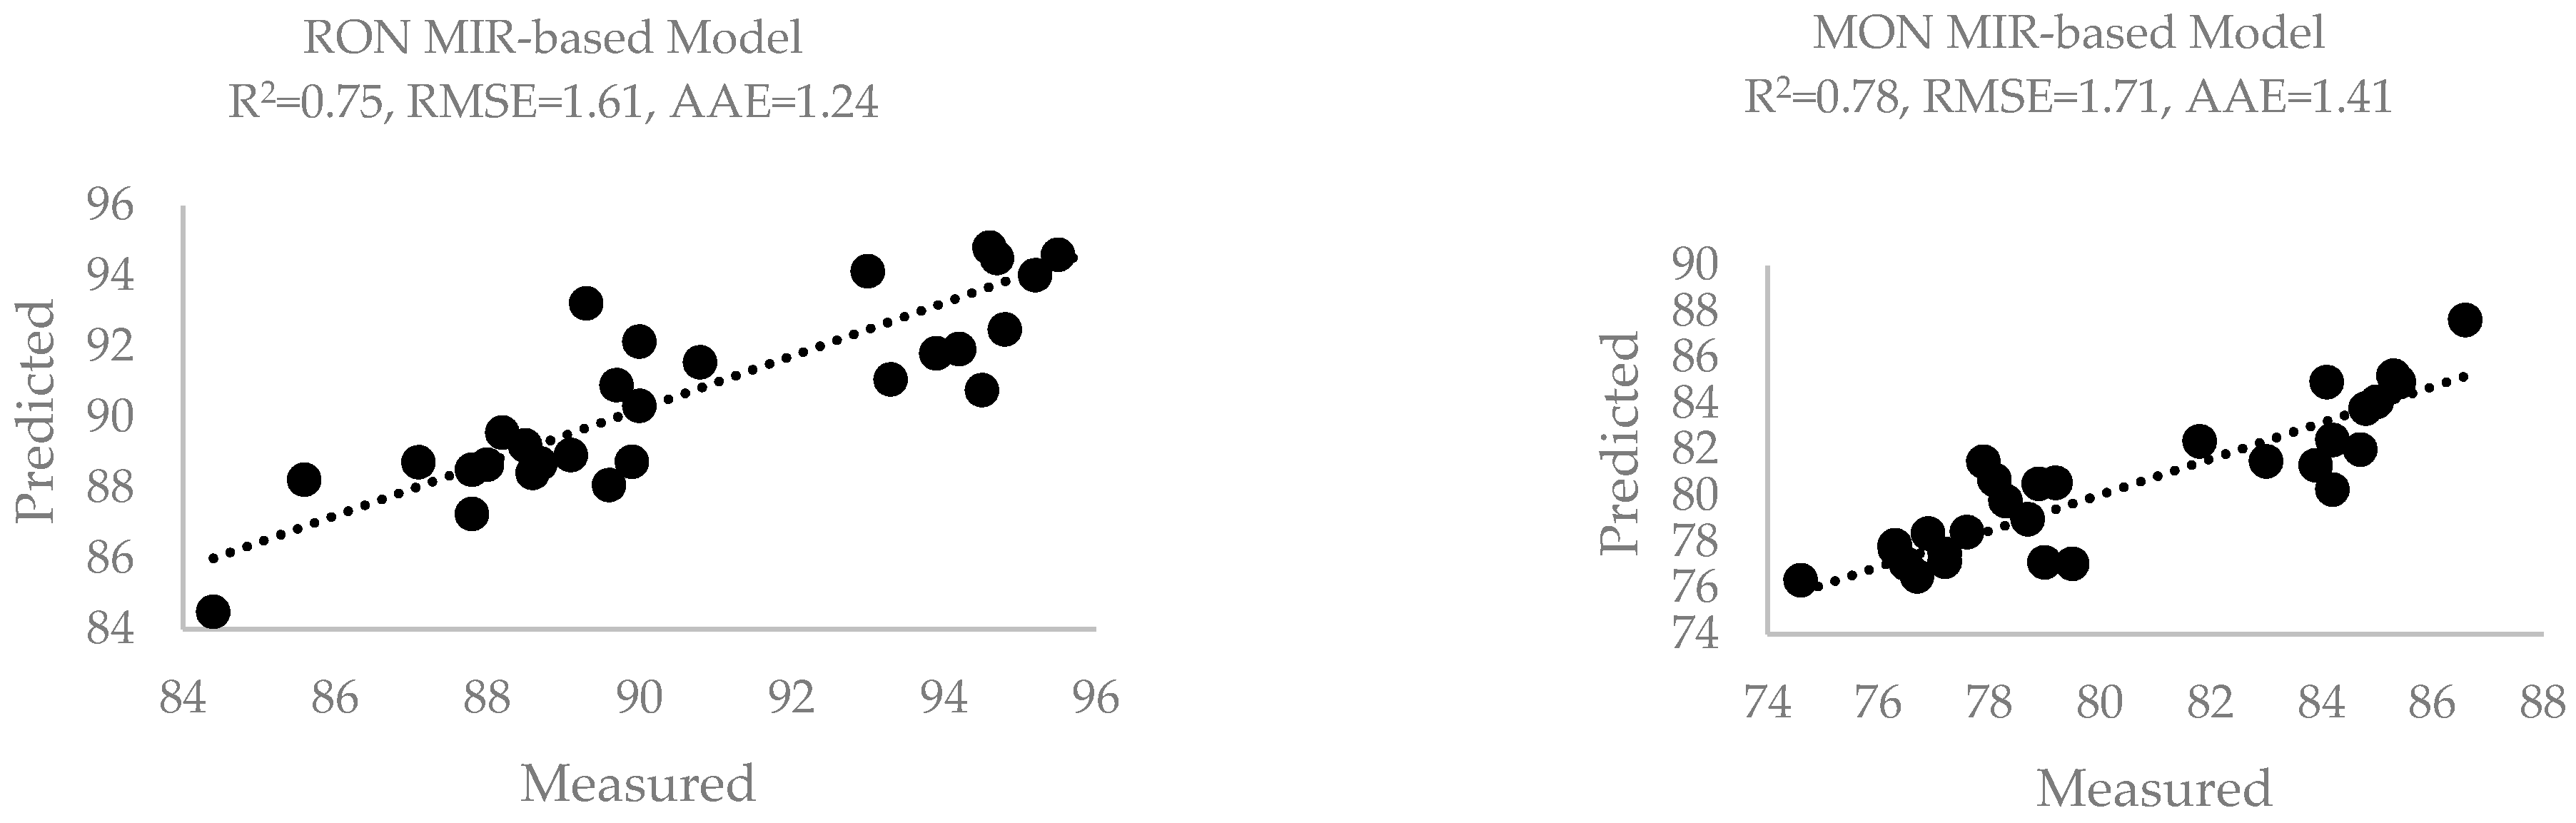
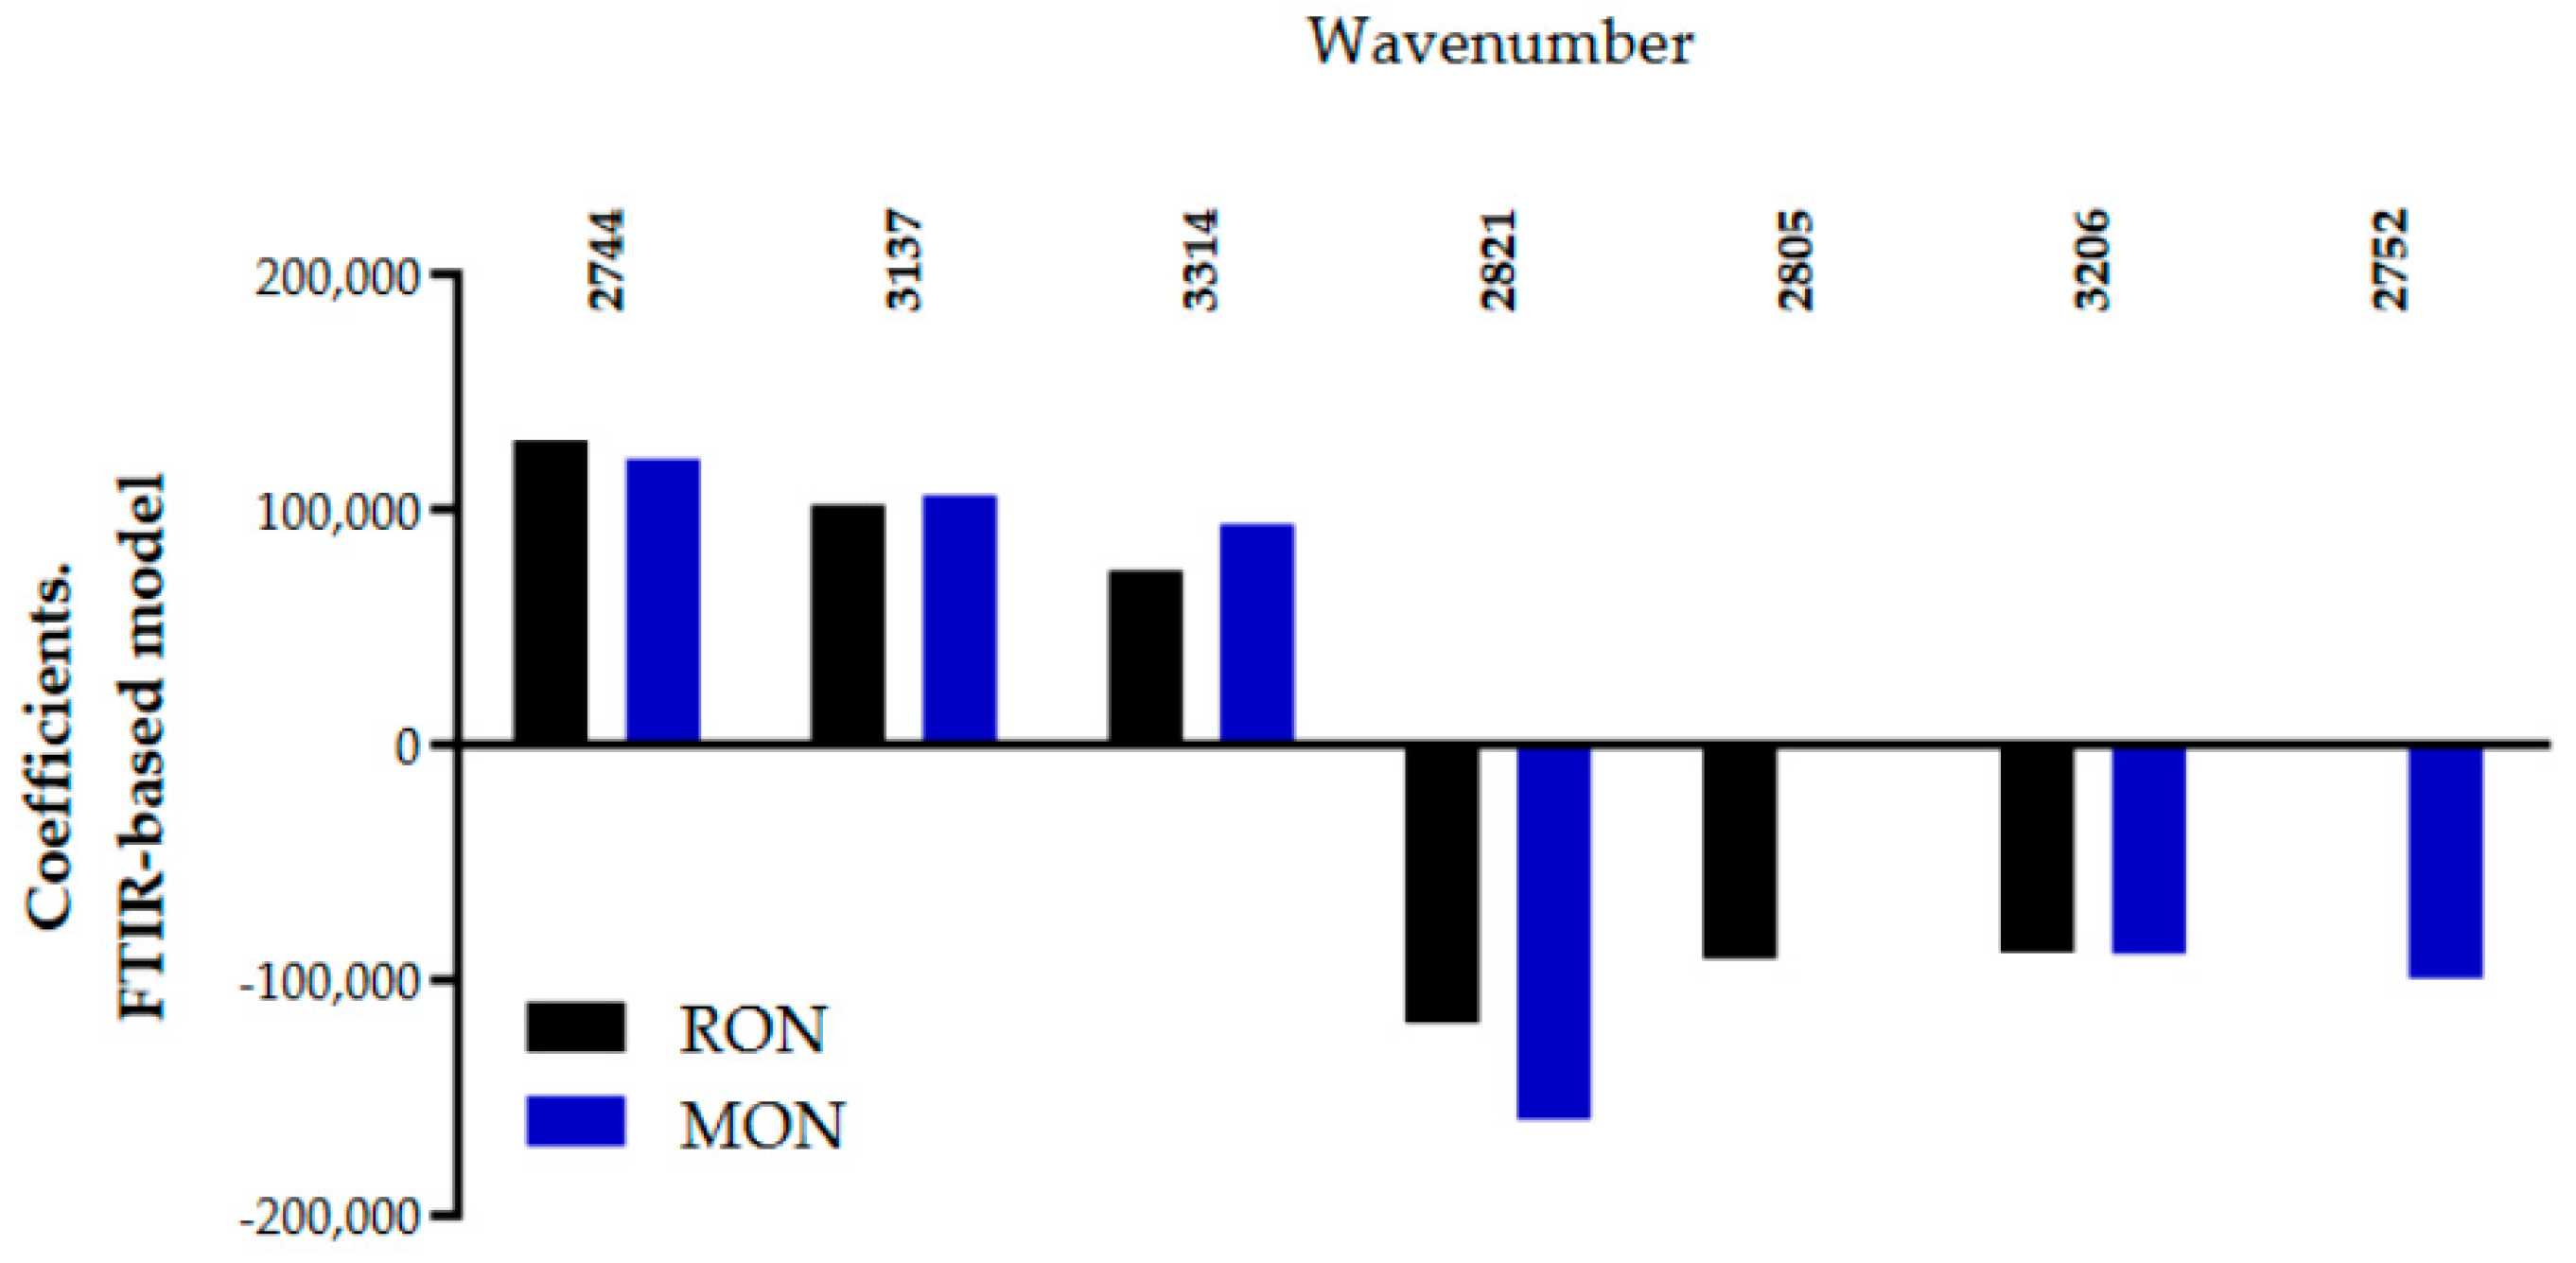
3.2. Infrared Spectroscopy Data-Based Model

Figure 5 and Figure 6 present the absorbance and its second derivative spectra for a representative sample of extra gasoline. To facilitate the analysis and eliminate the zone containing mainly experimental noise, the points for analysis were taken in the spectra wavenumber region from 27005.2058 cm−1 to 3507.0458 cm−1 (105 points with an approximate resolution of 7.6365 cm−1). The selected points were set as the input features to the MON and RON prediction models based on the PLSR analytical method.
As a preliminary analysis, the variation in the MON and RON with absorbance was analyzed for each of the selected points, without finding a defined trend. For the wave number 3329.71 cm−1, a slightly increasing trend was observed, that is, as the absorbance increased, the antiknock index also increased at that wave number. In contrast, for wave number 3206.35 cm−1, a slightly decreasing trend of NO was observed as absorbance increased. To determine the existence of significant linear relationships between the input variables, a correlation matrix was calculated, finding strong linear relationships between most of the variables. Of the 105 explanatory variables, only 14 of them were not significantly related to any other. The results of the MIR-based models for the RON and the MON are shown in Figure 7. These models explained 75% and 78% of the variation in the RON and the MON, respectively. Figure 8 shows the coefficients of the linear regression models with greater positive or negative values. In the case of the RON, the points with the greatest positive weight were 2743.755 cm−1 and 3136.9658 cm−1, while those with the greatest negative weight were 2805.4358 cm−1 and 2820.8558 cm−1.

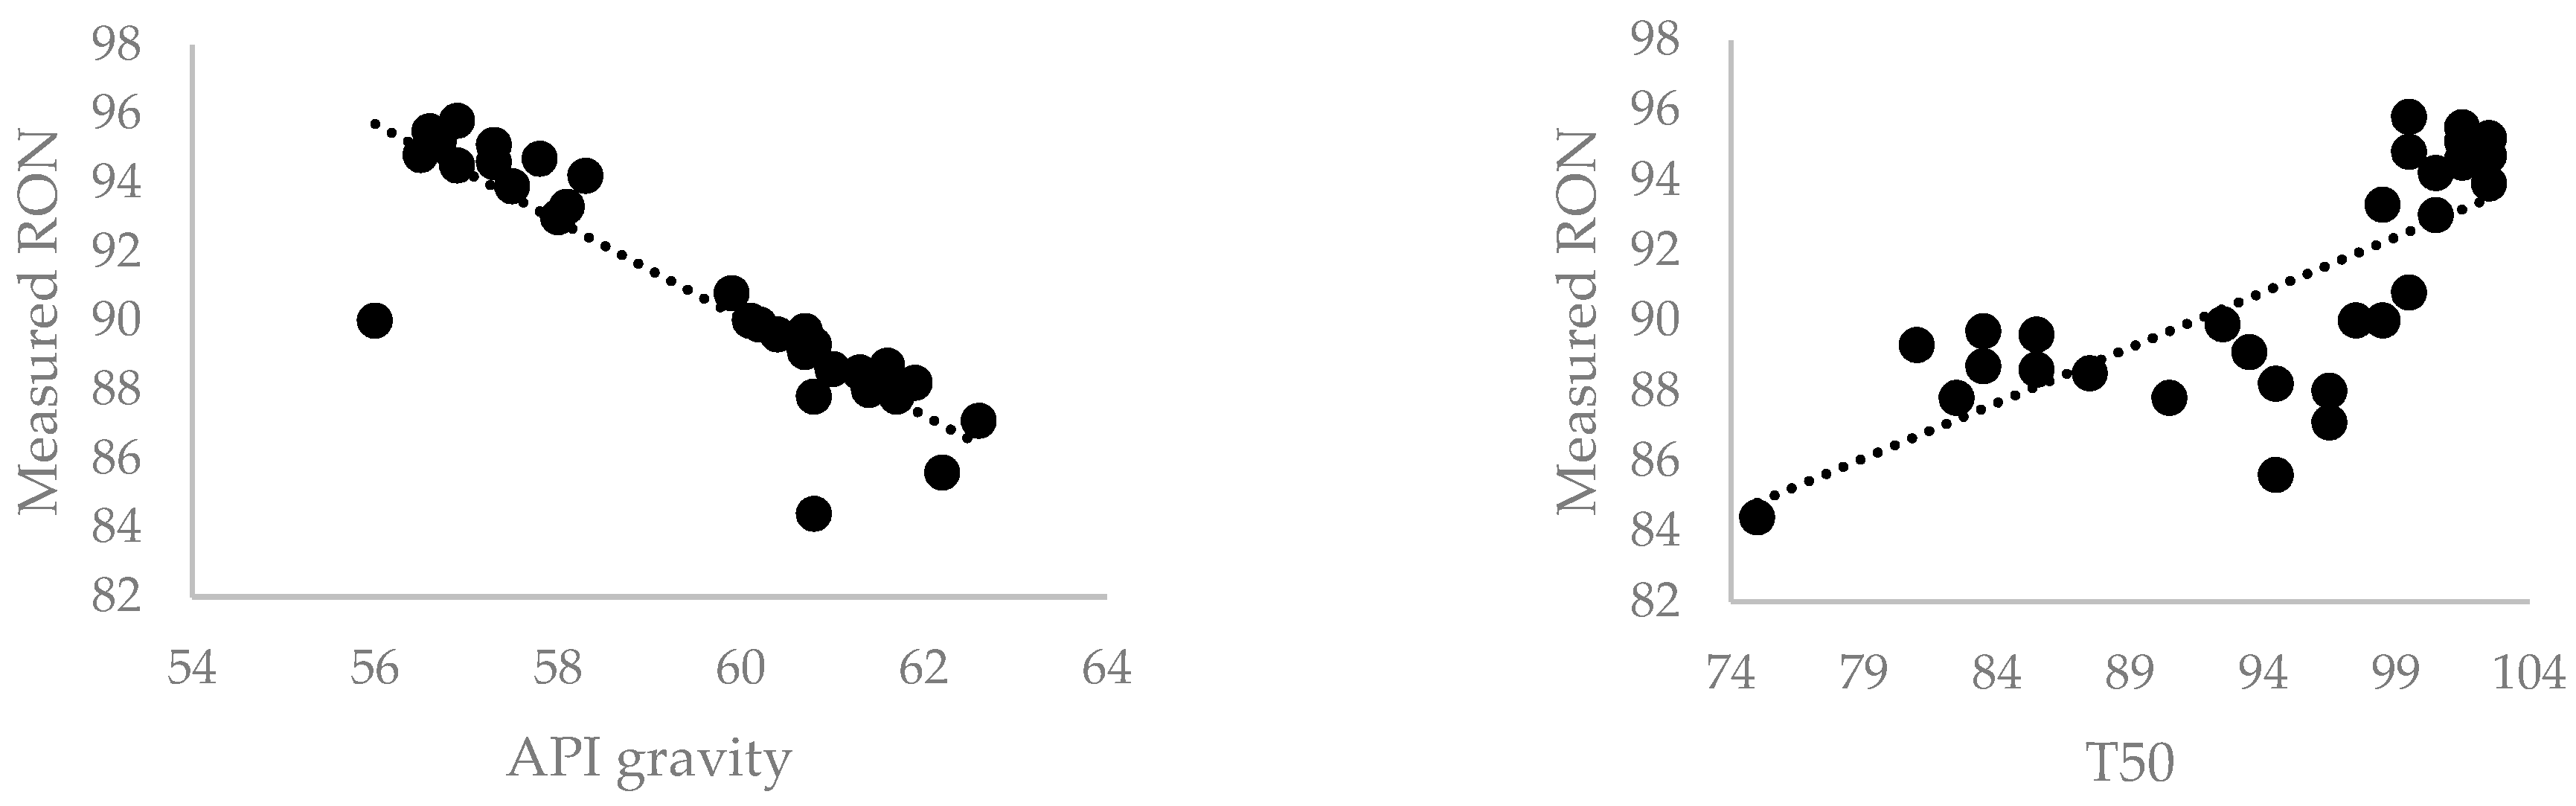
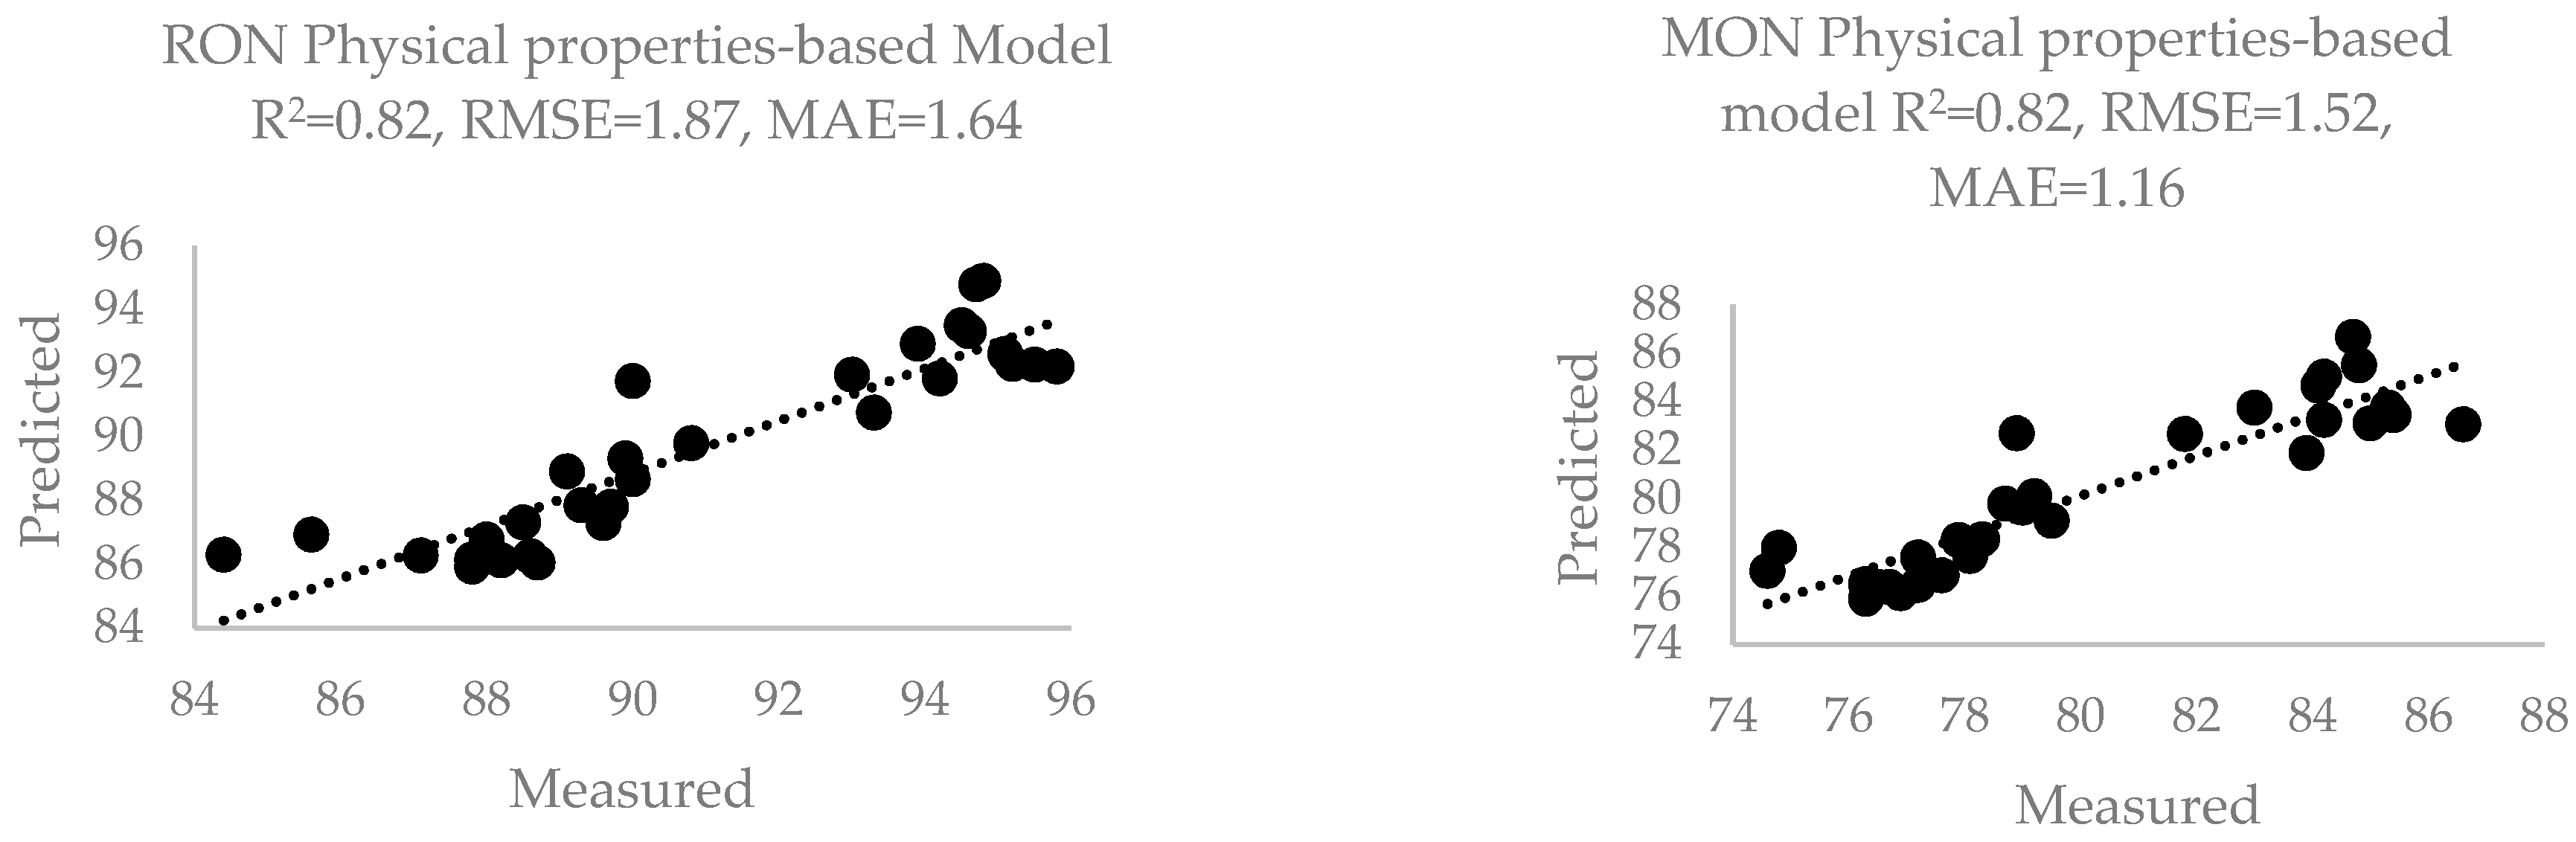
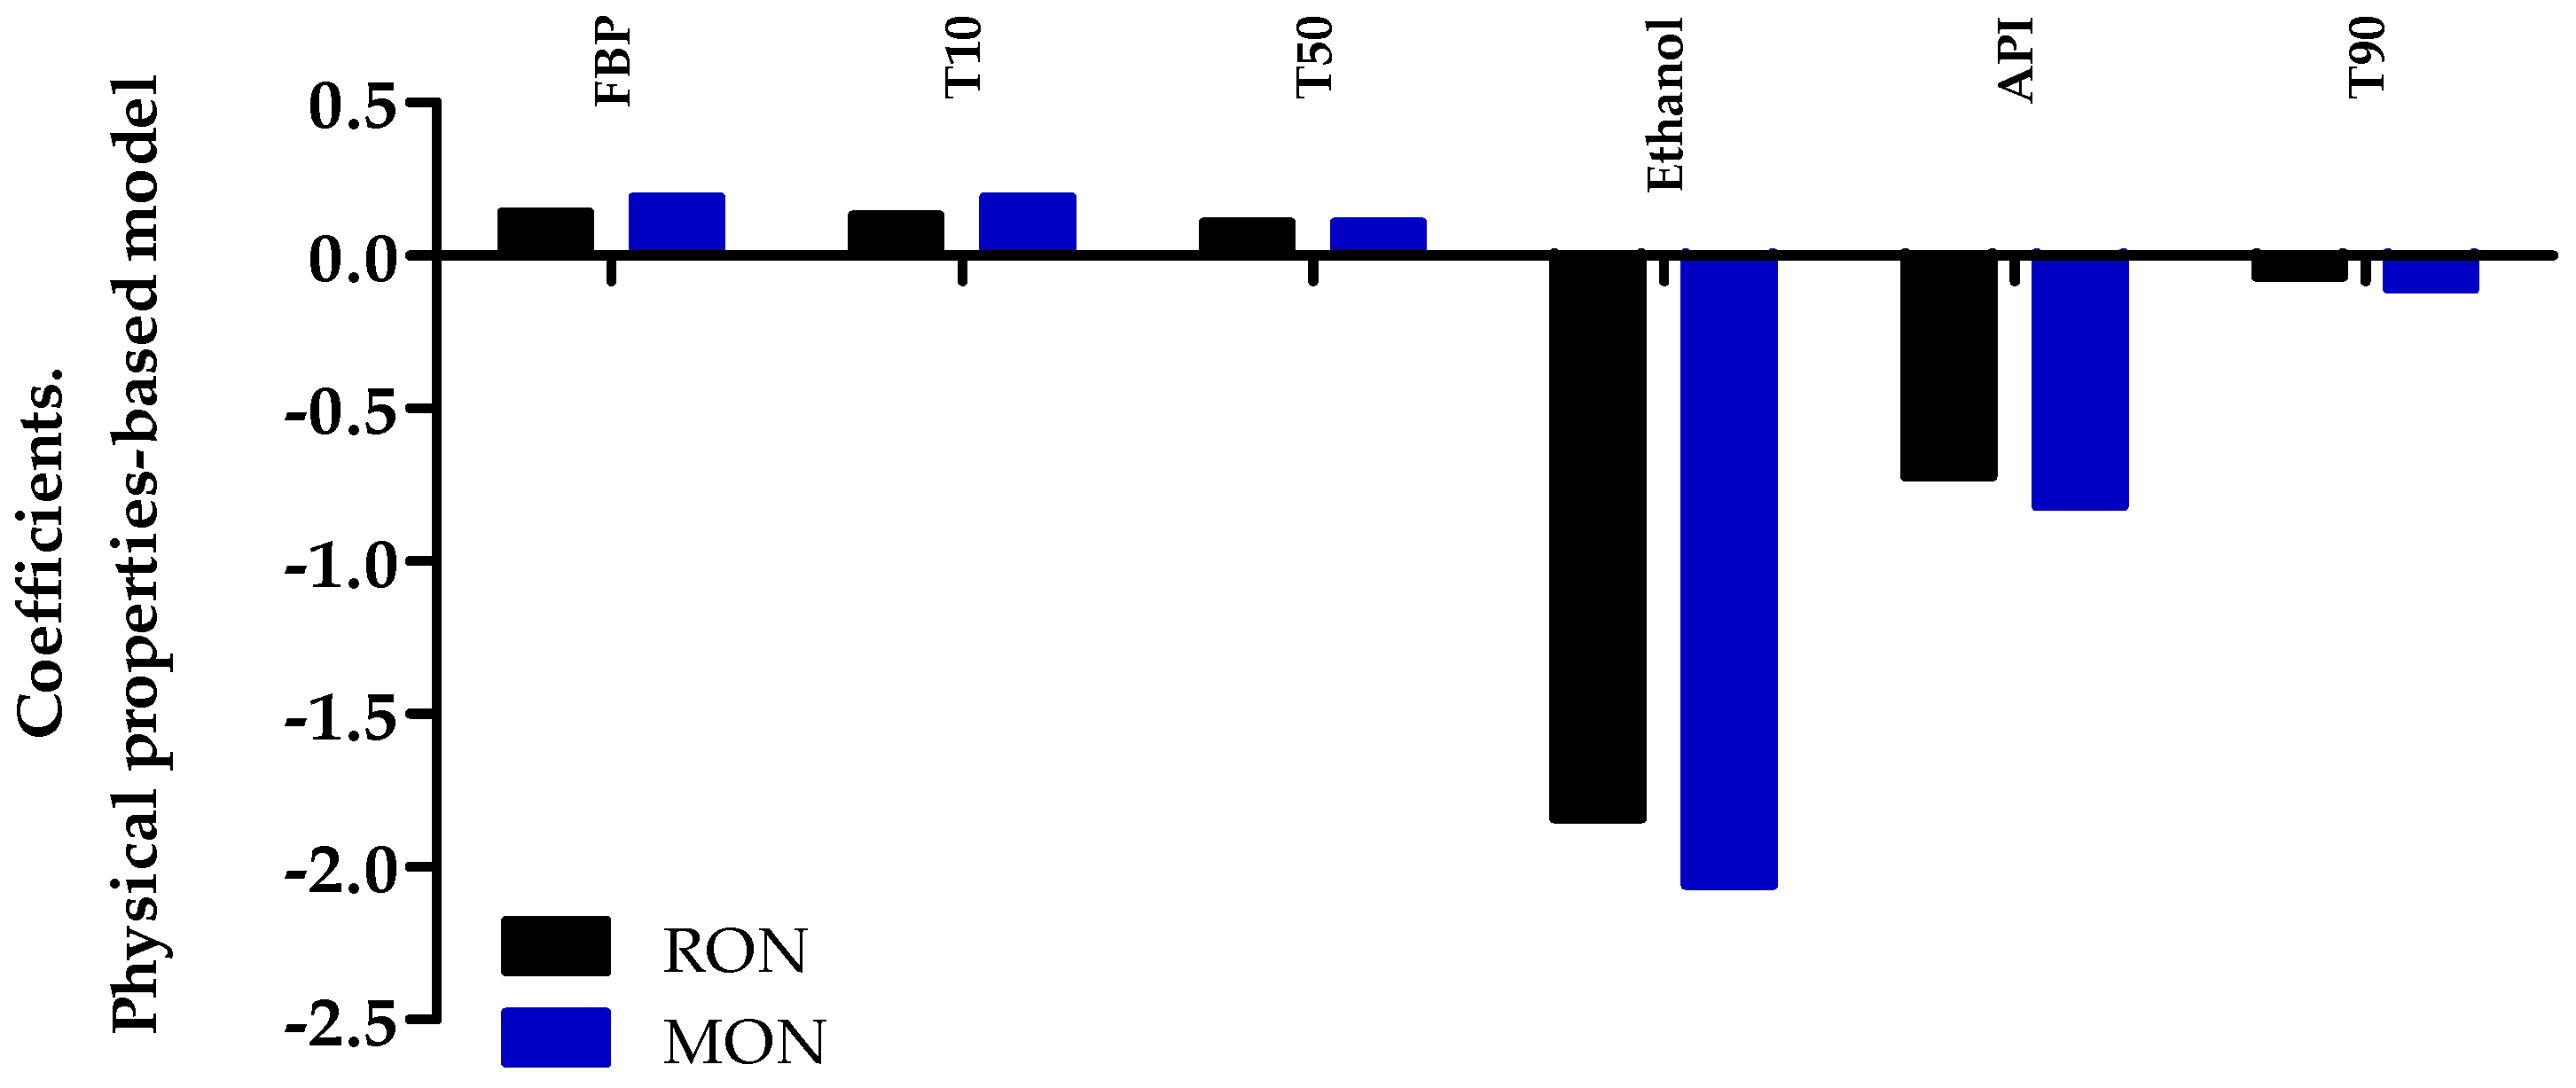
3.3. Physical-Properties-Based Model

Five points of the distillation curve (IBP, T10, T50, T90, and FBP), the API gravity, and ethanol content were selected as input features for the models. Regarding ethanol content, only a small variation (from 9 to 11%) was considered, since all types of gasoline (extra and regular) sold in Colombia must have 10% added ethanol. As a preliminary analysis, the variation in the MON and RON with the chosen features was analyzed. Well-defined trends were only identified in the cases of T50 and API gravity, as shown in Figure 9.
To determine the existence of significant linear relationships between the input variables, a correlation matrix was calculated, finding strong linear relationships between most of the variables. The results of the physical-properties-based models for the RON and MON are shown in Figure 10. These models explained 82% of the variation in both ON measurements. Figure 11 shows the coefficients of the linear regression models for all of the explanatory variables considered. According to the magnitude of these coefficients, the variables with the greater contribution to the predicted values of the MON and RON are ethanol content and API gravity. Although an increase in the ON of gasoline fuels is expected with the addition of ethanol, the estimation of the RON or MON of the blend on a volumetric basis has a limited application because the value of these parameters also varies with the composition of the base fuel. Furthermore, it has been well established that the increases in RON and MON with the addition of ethanol are approximately linear when compositions are expressed in molar concentrations [41]. In the case of API gravity, there was a correspondence between model structure and physical sense. As can be seen in Figure 11, this variable has a coefficient with a negative sign (−0.72 for RON and −0.82 for MON), indicating that the ON increases as API gravity decreases or density increases. This trend can be checked in the case of the pure hydrocarbons present in gasoline fuels and is representative of the main groups (paraffinic, naphthenic, and aromatic) as shown in Table 2.
One way to evaluate the performance of the proposed prediction methods is to consider the uncertainty generated in the measurement procedures and to check whether the predicted values are within the reproducibility of the standards adopted in gasoline conformity assessments. Then, an adequate evaluation criterion can be used to compare the difference between the predicted and measured values (residuals) with the sum of the reproducibility and the uncertainty established by the method. The standard test method for the measurement of RON in spark-ignition motor fuels, such as ASTM D2699-19, states a reproducibility value of 0.8, and the uncertainty estimated from this value was 0.56 [4]. Adding the reproducibility and the uncertainty, a value of 1.36 was obtained. According to Figure 12, the best performance corresponded with the composition-based model, since about 80% of residuals were within the established criterion. This result agreed with the lowest value of the MAE obtained with this model. In the case of the MIR and physical-properties-based models, those proportions were about 67% and 47%, respectively. Although the physical-properties-based method showed an unacceptable performance according to the established criterion, its use could be recommended in cases of scarce data since it showed an acceptable value of R2 and physical consistency. As can be shown in Figure 12, this method tended to underestimate the value of the RON for most of the samples.
In the case of the MON, the sum of the reproducibility and the uncertainty was 1.54 [5]. According to Figure 13, the best performance also corresponded with the composition-based model, since about 83.3% of residuals were within the established criterion. In the case of the MIR and physical-properties-based models, these proportions were about 60% and 73.3%, respectively. The results also showed a better performance of the physical-properties-based method in comparison with the RON prediction.

4. Conclusions

Three models for predicting the ON of petroleum-derived gasoline fuels using MIR spectra, GC-MS, and routine test data as input features were developed and evaluated. In all cases, the chosen analytical method was partial least squares regression (PLSR). According to the results obtained, the following conclusions can be drawn:
  • Despite their empirical nature, the proposed prediction models had the potential to predict the RON and MON of real gasoline fuels commercialized in Colombia.
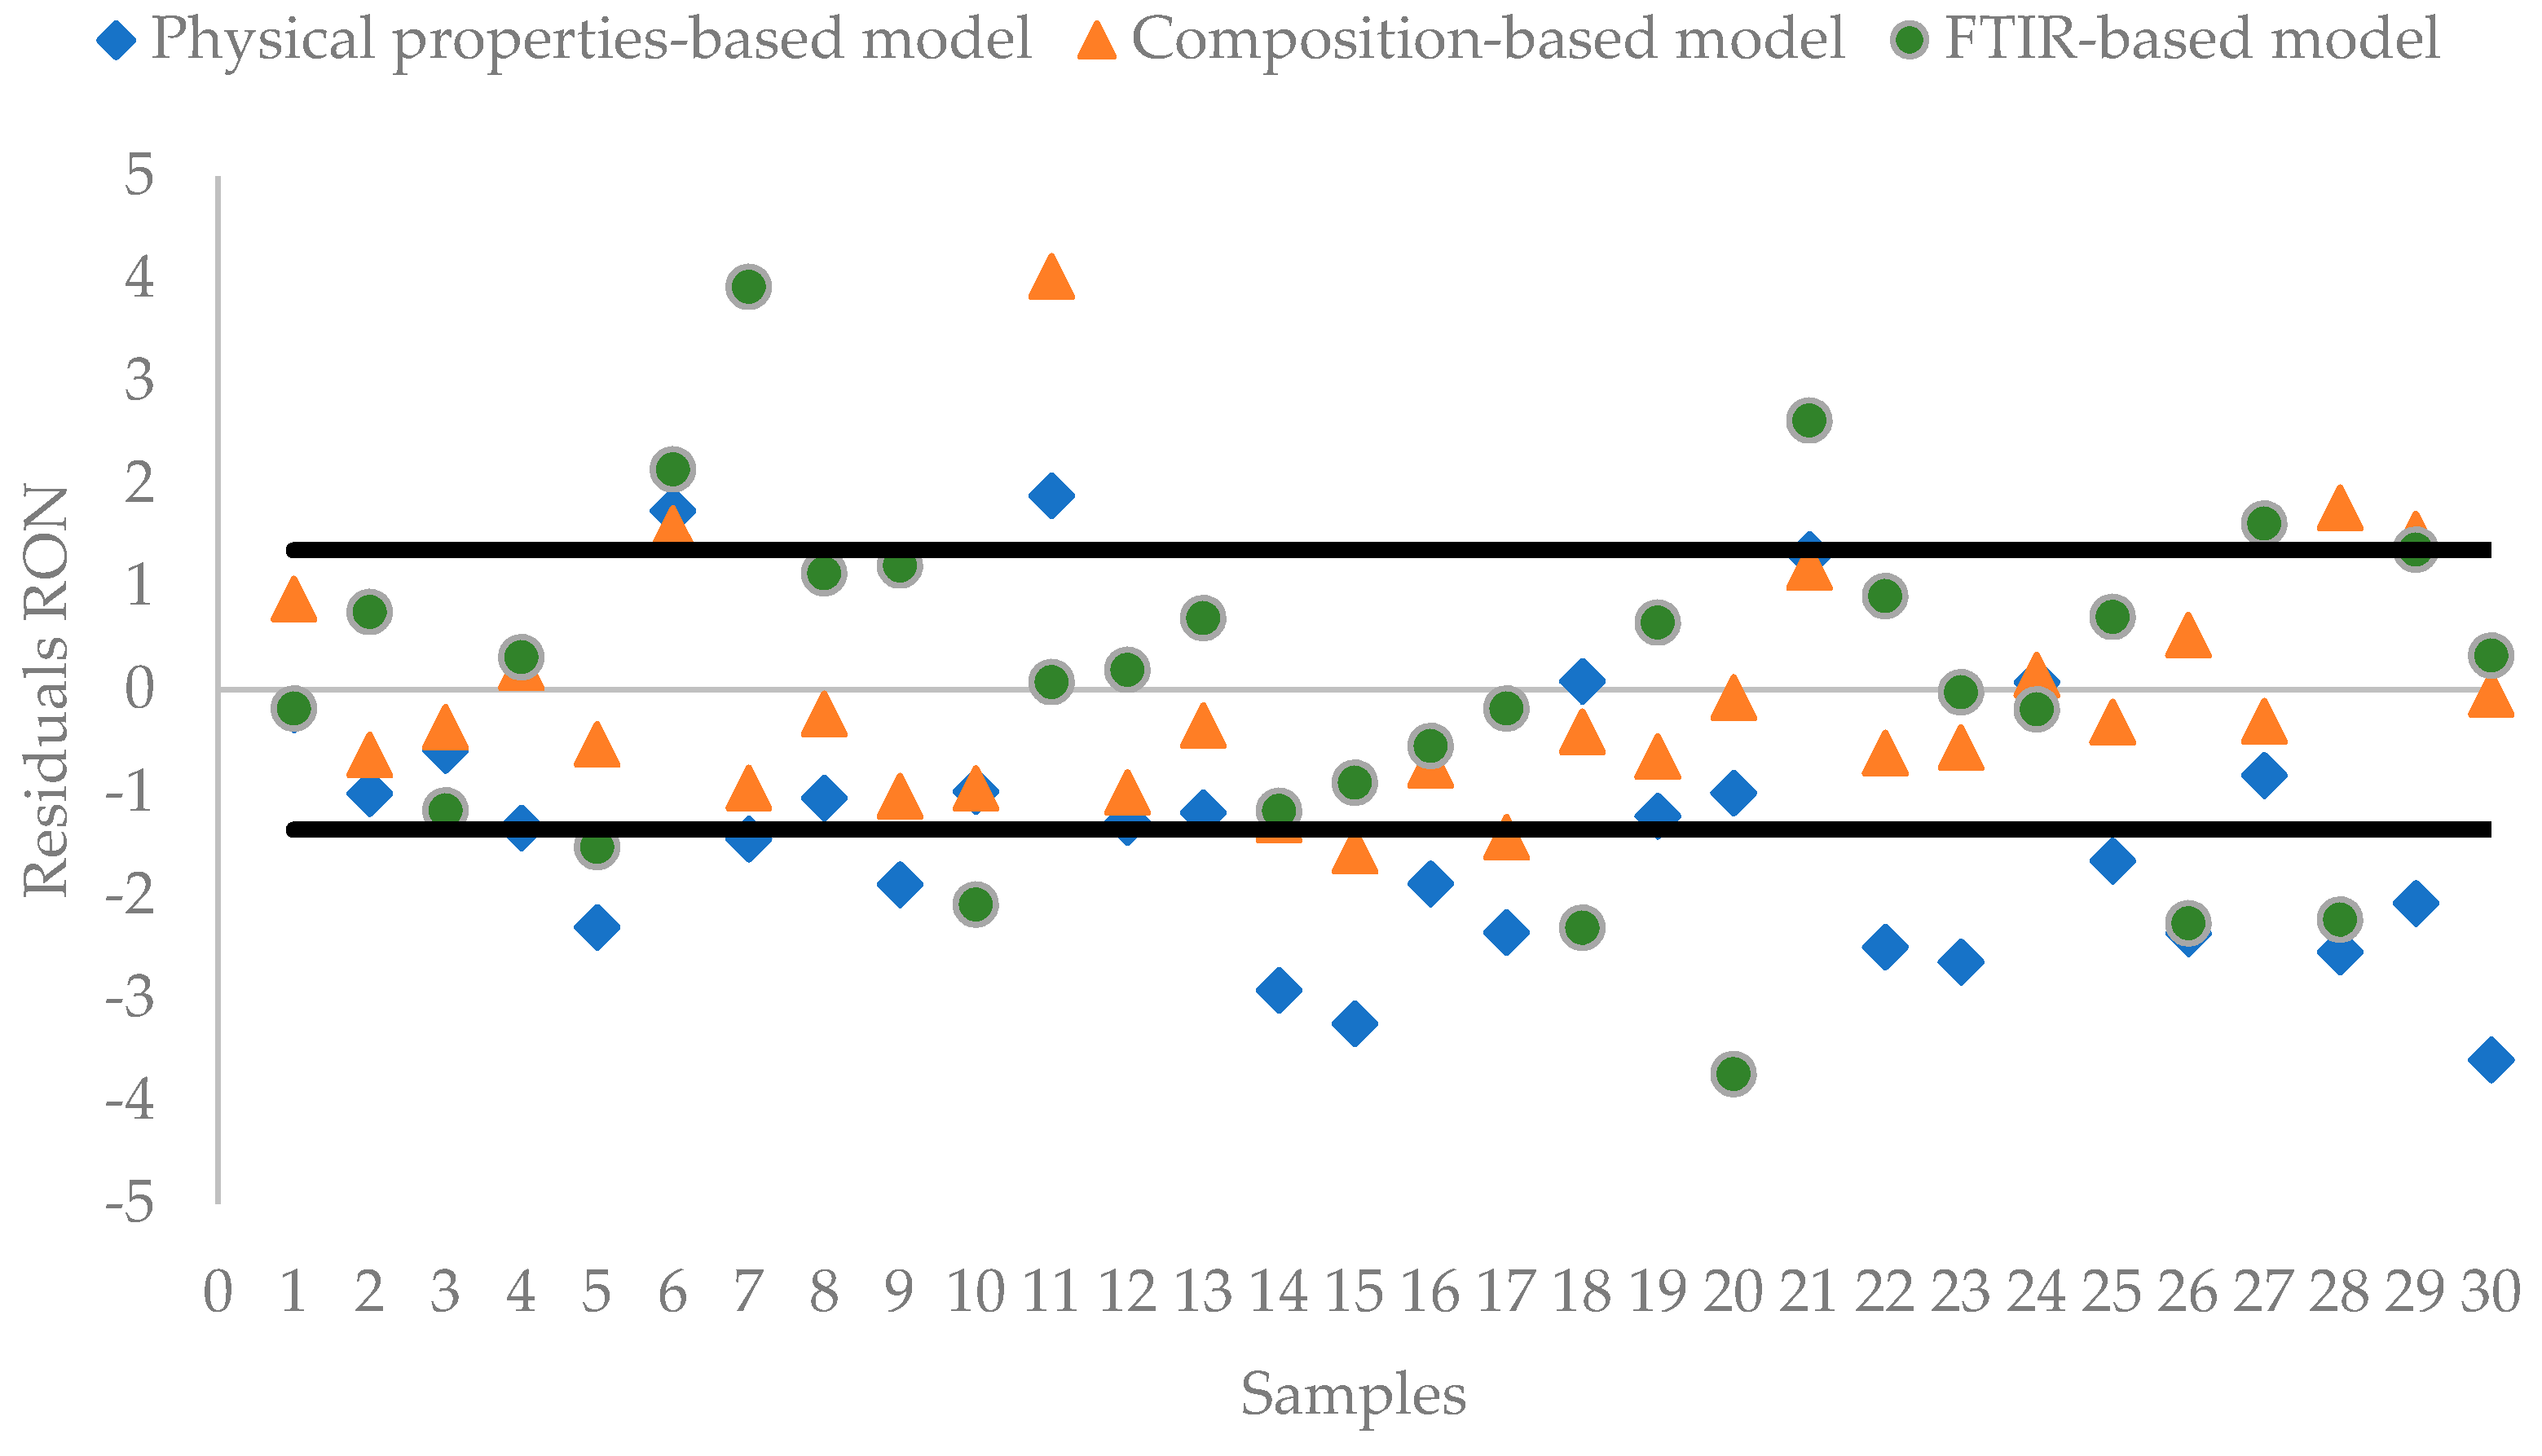
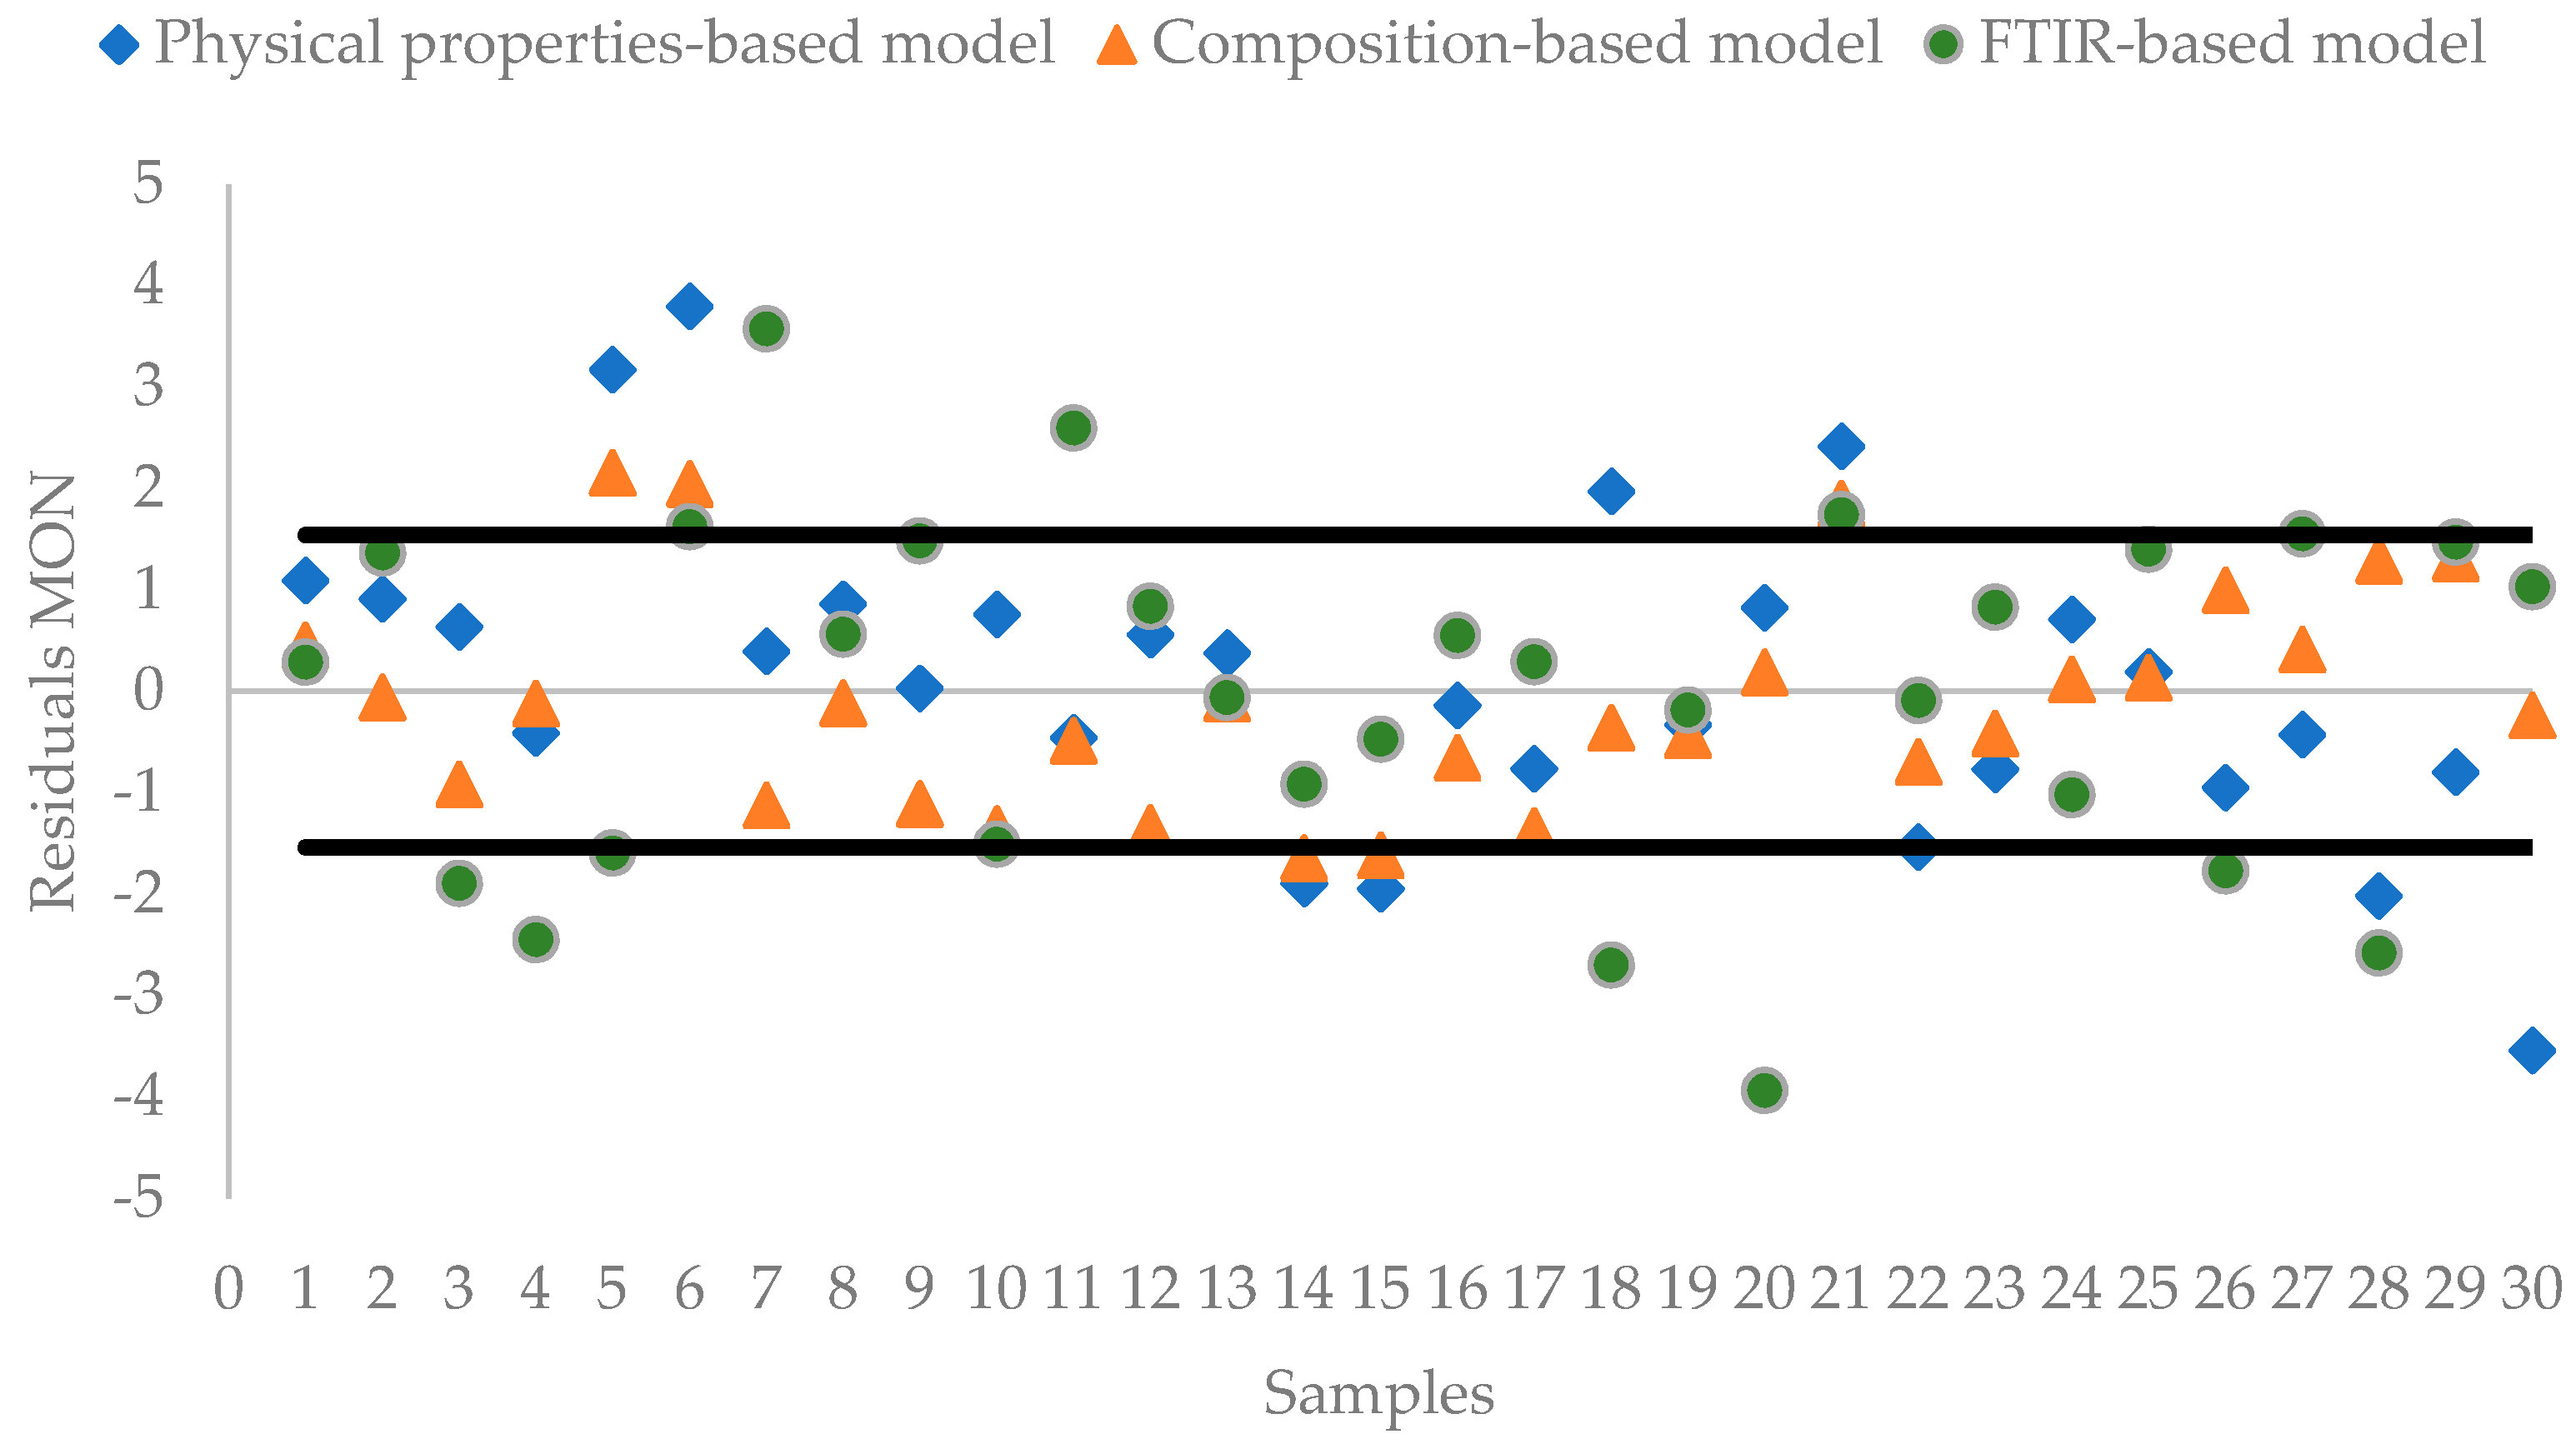
  • The results showed that the best performance for both MON and RON prediction corresponded with the composition-based model, since it presented lesser evaluation indices (RMSE, MAE, and R2) and more than 80% of residuals were within the established criteria (sum of the reproducibility and the uncertainty of the standard method).
  • Although the routine-test-data-based method performed poorly according to the established criterion, its use could be recommended in cases of scarce data since it showed an acceptable value of R2 and physical consistency. The main novelty of the last method is to correlate a complex parameter such as ON with simple and easy-to-measure fuel properties such as the API gravity and representative points of the distillation curve.

Author Contributions

Conceptualization, P.B., A.B. and C.Z.; methodology, A.B. and C.Z.; formal analysis, A.B. and C.Z.; investigation, A.B. and C.Z.; resources, F.B.C., M.A.R. and C.A.F.; writing—original draft preparation, A.B. and P.B.; writing—review and editing, P.B. and A.B.; supervision, P.B.; funding acquisition, F.B.C., M.A.R. and C.A.F. All authors have read and agreed to the published version of the manuscript.

Funding

The APC was funded by Faculty of Mines—Michael Polanyi Surface Phenomena Laboratory.

Acknowledgments

The authors are grateful to the Crudes and Products Laboratory and Universidad Nacional de Colombia, for logistic and financial support.

Conflicts of Interest

The authors declare no conflict of interest.

References

  1. Morgan, N.; Smallbone, A.; Bhave, A.; Kraft, M.; Cracknell, R.; Kalghatci, G. Mapping surrogate compositions into RON/MON space. Combust. Flames 2010, 157, 1122–1131. [Google Scholar] [CrossRef]
  2. Jameel, A.G.A.; Van Oudenhoven, V.; Emwas, A.H.; Sarathy, S.M. Predicting octane number using nuclear magnetic resonance spectroscopy and artificial neural networks. Energy Fuels 2018, 32, 6309–6329. [Google Scholar] [CrossRef]
  3. Pasadakis, N.; Gaganis, V.; Foteinopoulos, C. Octane number prediction for gasoline blends. Fuel Process. Technol. 2006, 87, 505–509. [Google Scholar] [CrossRef]
  4. ASTM D 2699-19; Standard Test Method for Research Octane Number of Spark-Ignition Engine Fuel. ASTM: West Conshohocken, PA, USA, 2019.
  5. ASTM D2700-19; Standard Test Method for Motor Octane Number of Spark-Ignition Engine Fuel. ASTM: West Conshohocken, PA, USA, 2019.
  6. Ma, Y.; Yu, Z.; Wang, Y.; Xie, D.; Jiaqiang, E. Investigation on the influence of initial thermodynamic conditions and fuel compositions on gasoline octane number based on a data-driven approach. Fuel 2021, 291, 120124. [Google Scholar] [CrossRef]
  7. Wu, Y.; Xinling, Y.L.; Huang, L.Z.; Han, D. Gasoline octane number prediction from near-infrared spectroscopy with an ANN-based model. Fuel 2022, 318, 123543. [Google Scholar] [CrossRef]
  8. Albahri, T.A. Structural group contribution method for predicting the octane number of pure hydrocarbon liquids. Ind. Eng. Chem. Res. 2003, 42, 657–662. [Google Scholar] [CrossRef]
  9. Daly, S.R.; Niemeyer, K.E.; Cannella, W.J.; Hagen, C.L. Predicting fuel research octane number using Fourier-transform infrared absorption spectra of neat hydrocarbons. Fuel 2016, 183, 359–365. [Google Scholar] [CrossRef]
  10. Kelly, J.J.; Barlow, C.H.; Jinguji, T.M.; Callis, J.B. Prediction of gasoline octane numbers from near-infrared spectral features in the range 660–1215 nm. Anal. Chem. 1989, 61, 313–320. [Google Scholar] [CrossRef]
  11. Ghosh, P.; Hickey, K.J.; Jaffe, S.B. Development of a detailed gasoline composition-based octane model. Ind. Eng. Chem. Res. 2006, 45, 337–345. [Google Scholar] [CrossRef]
  12. Tipler, S.; D’Alessio, G.; Van Haute, Q.; Parente, A.; Contino, F.; Coussement, A. Predicting octane numbers relying on principal component analysis and artificial neural network. Comput. Chem. Eng. 2022, 161, 107784. [Google Scholar] [CrossRef]
  13. Anderson, J.E.; Wallington, T.J. Novel method to estimate the octane ratings of ethanol-gasoline mixtures using base fuel properties. Energy Fuels 2020, 34, 4632–4642. [Google Scholar] [CrossRef]
  14. Van Leeuwen, J.A.; Jonker, R.J.; Gill, R. Octane number prediction based on gas chromatographic analysis with non-linear regression techniques. Chemom. Intell. Lab. Syst. 1994, 25, 325–340. [Google Scholar] [CrossRef]
  15. Lee, D.M.; Lee, D.H.; Hwang, I.H. Gasoline quality assessment using fast gas chromatography and partial least-squares regression for the detection of adulterated gasoline. Energy Fuels 2018, 32, 10556–10562. [Google Scholar] [CrossRef]
  16. Bohács, G.; Ovádi, Z.; Salgó, A. Prediction of gasoline properties with near-infrared spectroscopy. J. Near Infrared Spectrosc. 1998, 6, 341–348. [Google Scholar] [CrossRef]
  17. Jeong, H.I.; Lee, H.S.; Jeon, J.H. Determination of research octane number using NIR spectral data and ridge regression. Bull Korean Chem. Soc. 2001, 22, 37–42. [Google Scholar]
  18. Felício, C.C.; Brás, L.P.; Lopes, J.A.; Cabrita, L.; Menezes, J.C. Comparison of PLS algorithms in gasoline and gas oil parameter monitoring with MIR and NIR. Chemom. Intell. Lab. Syst. 2005, 78, 74–80. [Google Scholar] [CrossRef]
  19. Kardamakis, A.A.; Pasadakis, N. Autoregressive modeling of near-IR spectra and MLR to predict RON values of gasolines. Fuel 2010, 89, 158–161. [Google Scholar] [CrossRef]
  20. Tian, Y.; You, X.; Huang, X. SDAE-BP based octane number soft sensor using near-infrared spectroscopy in gasoline blending process. Symmetry 2018, 10, 770. [Google Scholar] [CrossRef]
  21. Al Ibrahim, E.; Farooq, A. Octane Prediction from Infrared Spectroscopic Data. Energy Fuels 2020, 34, 817–826. [Google Scholar] [CrossRef]
  22. Cooper, J.B.; Wise, K.L.; Groves, J.; Welch, W.T. Determination of octane numbers and Reid vapor pressure of commercial petroleum fuels using FT-Raman spectroscopy and partial least-squares regression analysis. Anal. Chem. 1995, 67, 4096–4100. [Google Scholar] [CrossRef]
  23. Voigt, M.; Legner, R.; Haefner, S.; Friesen, A.; Wirtz, A.; Jaeger, M. Using fieldable spectrometers and chemometric methods to determine RON of gasoline from petrol stations: A comparison of low-field 1H NMR@80 MHz, handheld RAMAN and benchtop NIR. Fuel 2019, 236, 829–835. [Google Scholar] [CrossRef]
  24. Teixeira, L.S.G.; Dantas, M.S.G.; Guimaraes, P.R.B.; Teixeira, W.; Vargas, H.; Lima, J.A.P. Correlation of PVR, octane numbers and distillation curve of gasoline with data from a thermal wave interferometer. Comput. Aided Chem. Eng. 2009, 27, 759–764. [Google Scholar]
  25. De Paulo, J.M.; Barros, J.E.M.; Barbeira, P.J.S. A PLS regression model using flame spectroscopy emission for determination of octane numbers in gasoline. Fuel 2016, 176, 216–221. [Google Scholar] [CrossRef]
  26. Wang, S.; Liu, S.; Zhang, J.; Che, X.; Wang, Z.; Kong, D. Feasibility study on prediction of gasoline octane number using NIR spectroscopy combined with manifold learning and neural network. Spectrochim. Acta A Mol. Biomol. Spectrosc. 2020, 228, 117836. [Google Scholar] [CrossRef]
  27. Naser, N.; Jameel, A.G.A.; Emwas, A.H.; Singh, E.; Chung, S.H.; Sarathy, S.M. The influence of chemical composition on ignition delay times of gasoline fractions. Combust. Flame 2019, 209, 418–429. [Google Scholar] [CrossRef]
  28. Tipler, S.; Fürst, M.; Van Haute, Q.; Contino, F.; Coussement, A. Prediction of the octane number: A bayesian pseudo-component method. Energy Fuels 2020, 34, 12598–12605. [Google Scholar] [CrossRef]
  29. Demirbas, A.; Balubaid, M.A.; Basahel, A.M.; Ahmad, W.; Sheikh, M.H. Octane rating of gasoline and octane booster additives. Pet. Sci. Technol. 2015, 33, 1190–1197. [Google Scholar] [CrossRef]
  30. Perdih, A.; Perdih, F. Chemical interpretation of octane number. Acta Chim. Slov. 2006, 53, 306–315. [Google Scholar]
  31. Nikolaou, N.; Papadopoulos, C.; Gaglias, I.; Pitarakis, K. A new non-linear calculation method of isomerisation gasoline research octane number based on gas chromatographic data. Fuel 2004, 83, 517–523. [Google Scholar] [CrossRef]
  32. Alexandrovna, S.J.; Tuyen, D.C. Development of a detailed model for calculating the octane numbers of gasoline blends. In Proceedings of the International Forum on Strategic Technology 2010, Ulsan, Republic of Korea, 13–15 October 2010; pp. 430–432. [Google Scholar]
  33. Da Silva, N.C.; De Góes, M.A.R.C.; Domingos, D.; Amigo, J.M.; Das Virgens Rebouças, M.; Pasquini, C.; Pimentel, M.F. NIR-based octane rating simulator for use in gasoline compounding processes. Fuel 2019, 243, 381–389. [Google Scholar] [CrossRef]
  34. Mendes, G.; Aleme, H.G.; Barbeira, P.J.S. Determination of octane numbers in gasoline by distillation curves and partial least squares regression. Fuel 2012, 97, 131–136. [Google Scholar] [CrossRef]
  35. Hernández, R.; Fernández, C.; Baptista, P. Metodología de la Investigación; MCGRAW-HILL: Mexico City, Mexico, 2014. [Google Scholar]
  36. Shimadzu Corporation. Analysis of Gasoline Using a GC-MS. 2011. Available online: https://www.shimadzu.com/an/sites/shimadzu.com.an/files/pim/pim_document_file/applications/application_note/12909/jpo212076.pdf (accessed on 25 November 2021).
  37. Conklin, J.A.; Goldcamp, M.J.; Barret, J. Determination of ethanol in gasoline by FT-IR spectroscopy. J. Chem. Educ. 2014, 91, 889–891. [Google Scholar] [CrossRef]
  38. ASTM D287-12b; Standard Test Method for API Gravity of Crude Petroleum and Petroleum Products (Hydrometer Method). ASTM: West Conshohocken, PA, USA, 2019.
  39. ASTM D86-19; Standard Test Method for Distillation of Petroleum Products and Liquid Fuels at Atmospheric Pressure. ASTM: West Conshohocken, PA, USA, 2019.
  40. Garthwaite, P.H. An interpretation of partial least squares. J. Am. Stat. Assoc. 1994, 89, 122–127. [Google Scholar] [CrossRef]
  41. Anderson, J.E.; Kramer, U.; Mueller, S.A.; Wallington, T.J. Octane numbers of ethanol− and methanol−gasoline blends estimated from molar concentrations. Energy Fuels 2010, 24, 6576–6585. [Google Scholar] [CrossRef]
Figure 1. Chromatograms of representative samples of extra and regular gasoline fuels (M201 sample: extra, M211 sample: regular).
Processes 11 01437 g001
Figure 2. Individual hydrocarbons with greater mass percent in representative gasoline samples (M201 sample: extra, M211 sample: regular).
Processes 11 01437 g002
Figure 3. Comparison of predicted and measured octane numbers. Composition-based models.
Processes 11 01437 g003
Figure 4. Variables (mass percent of individual hydrocarbons) with coefficients of greater absolute values in the linear-composition-based models.
Processes 11 01437 g004
Figure 5. FTIR absorbance spectra for a representative sample of extra gasoline.
Processes 11 01437 g005
Figure 6. FTIR second derivative spectra for a representative sample of extra gasoline.
Processes 11 01437 g006
Figure 7. Comparison of predicted and measured octane numbers. MIR-based models.
Processes 11 01437 g007
Figure 8. Variables (wavenumber points) with coefficients of greater absolute values in the linear MIR-based models.
Processes 11 01437 g008
Figure 9. Variation in the RON with API gravity and T50.
Processes 11 01437 g009
Figure 10. Comparison of predicted and measured octane numbers. Physical-properties-based models.
Processes 11 01437 g010
Figure 11. Explanatory variables and their coefficients in the linear physical-properties-based models.
Processes 11 01437 g011
Figure 12. Performance of the RON prediction methods.
Processes 11 01437 g012
Figure 13. Performance of the MON prediction methods.
Processes 11 01437 g013
Table 1. Summary of the representative literature models for ON prediction.
AuthorInput FeatureAnalytical
Method
RON
Range
R2RMSE
Wu et al. [7]NIRANN90–1000.9700.125
De Paulo et al. [25]FES: flame spectroscopy emissionPLS92–1000.9550.167
Mendes et al. [34]Distillation curvesPLS97.4–101.4-0.085
Kardamakis et al. [19]NIRMLR and LPC
(Linear predictive coding)
90.7–102.20.9870.310
Felicío et al. [18]NIRSerial PLS89–101-0.270
Jameel et al. [2]NMRANN-0.990-
Kelly et al. [10]NIRPLS91–98-0.230
Jeon et al. [17]NIRRidge regression90–98-0.067
Cooper et al. [22]RamanPLS--0.535
Van Leeuwen et al. [14]GCANN--0.350
Table 2. Density and ON of representative hydrocarbons present in commercial gasoline fuels [21].
NameFormulaDensity
g/cm3 at 20 °C
RONMON
HexaneC6H140.659024.826
CyclohexaneC6H120.77818377.2
BenzeneC6H60.8756105102.5
Disclaimer/Publisher’s Note: The statements, opinions and data contained in all publications are solely those of the individual author(s) and contributor(s) and not of MDPI and/or the editor(s). MDPI and/or the editor(s) disclaim responsibility for any injury to people or property resulting from any ideas, methods, instructions or products referred to in the content.

