1. Introduction
The assembly process is an important aspect in the manufacturing industry as it involves the joining of various parts to form a complete product. Over the years, various techniques have been developed to improve the assembly manufacturing process. Prior researchers have developed different techniques to make production processes effective, balanced, with minimum waste, and efficient. Each technique has its own characteristics and uniqueness. Prior research classified tools commonly used in lean manufacturing, which included among others cellular layout, six sigma, and value stream mapping (VSM) [
1]. The classification found that VSM provides a comprehensive view of the flow of materials and information at all levels of the industry. Another research project confirmed the benefits of VSM by showing that it is a tool used to identify areas with potential for improvement. It accomplishes this by eliminating waste in the product development process while other tools only perform analysis [
2]. For the straight-line configurations, prior authors compared 20 different heuristic methods on 100 assembly problems and found that the RPW heuristic method showed better results [
3].
This study aims to improve the assembly manufacturing process in the defense industry. The defense industry is known for its strict quality control standards and is constantly under pressure to improve its processes to meet these standards. This study focuses on a defense manufacturing firm located in Indonesia. Specifically, the assembly process being studied is for the Assault Rifle X (henceforth ARX) product. The ARX is the firm’s leading product with the highest demand and most complex assembly process compared to other weapons. The goal is to increase production from 200 to 300 ARX per day. The workers have to pay close attention to the assembly process because most of it is performed manually. Special machines are employed in the assembly process in order to assemble components that require high precision that cannot be achieved manually.
The weapon division responsible for the ARX assembly process has 56 operations/tasks distributed among 43 workstations, with a total of 155 components. Preliminary analysis shows that almost all workstations have a cycle time greater than the required takt time, leading to an imbalance in workloads. One station has a workload of 67 s, while another has a workload of 253 s, causing a bottleneck at the station with the heaviest workload and affecting the overall assembly line efficiency.
Basing their work on the unique characteristics of different assembly line balancing techniques compared by previous researchers and researchers’ preliminary analysis, researchers are encouraged to combine the value stream mapping (VSM) and ranked positional weight (RPW) methods to improve the ARX weapon assembly process [
4]. Preliminary analysis is conducted to ensure that the main analysis can be carried out effectively [
5,
6]. Combining the VSM method, used in lean manufacturing, with the RPW method for line balancing, is expected to improve the ARX weapon assembly process in the weapon division of the firm. This combination is anticipated to provide clear mapping of material and information flows and to calculate the performance indicator value of the ARX weapon assembly, thereby possibly helping the weapon division to achieve its production target.
The remainder of the paper is structured as follows, each with a distinct focus. The next section presents a literature review on three key concepts: lean manufacturing, value stream mapping, and ranked positional weight. In the third section, the materials and methods used in the research are explained, with a particular focus on the six stages of the research. In the fourth section, the current process and performance are described, providing context for the improvements that will be suggested in the following section. The fifth section explores the potential benefits of combining value stream mapping and ranked positional weight, and how these two concepts can be used to drive improvements in the organization. Discussion is provided in the sixth section. In the last section, the implications of the study are discussed, as well as potential future directions for research in this field.
2. Literature Review
The assembly process is a critical stage in the manufacturing industry, where different components are put together to form a final product. It is a complex procedure that requires coordination and efficient management of various activities, including material handling, assembly operations, and quality control [
7,
8,
9]. The success of an assembly process depends on various factors, including the design of the assembly line, the type of equipment used, the skills of the workers, and the implementation of an effective line balancing technique. The assembly process is also influenced by the type of product being manufactured, the volume of production, and the available working time [
10]. To achieve an efficient assembly process, it is essential to balance the workloads at each workstation and to minimize the cycle time for each operation. The use of lean manufacturing techniques, such as value stream mapping, can help to streamline the assembly process and optimize the use of resources.
Prior research on the use of VSM as a lean tool has been conducted by various scholars. For instance, VSM was applied to the process of raw materials until the production of finished products in the motorcycle industry. As a result, the production lead time decreased significantly from 3.215 days to 0.54 days, processing time decreased from 15.67 min to 14.13 min, and the production output per worker increased from 13.95 frames to 17.54 frames [
11]. VSM was also used to eliminate waste gas turbine product development. The result was a 50% reduction in the lead time for the product design stage, which reduced the overall lead time [
2].
More specifically, the application of VSM to assembly processes has been studied in the assembly process of Printed Circuit Board (PCB) for the production of smart vehicle tags. The focus of the research was on workstations with a cycle time that exceeded the takt time. VSM can identify the causes of high cycle times in these workstations, enabling improvements and resulting in a 63% reduction in machine setup time [
12]. The study also demonstrates that the application of VSM can not only be implemented in the entire supply chain management activities of a company, but also in one of the activities, such as the product assembly process. This is because each part of the supply chain management activities always involves the flow of materials and information that are interrelated and have the same goal, which is to focus on maximizing value for end customers. Lean thinking with the application of VSM was also used during the pandemic by previous researchers in non-manufacturing environments [
13]. The pandemic is an event that has had a wide-ranging impact both on manufacturing and non-manufacturing and has drawn the attention of academics from various disciplines [
14]. The VSM method can also be applied to small businesses or creative enterprises [
15]. These types of businesses have different characteristics compared to large organizations [
16,
17].
Meanwhile, studies aimed at improving the performance indicators of the assembly process, one of which is line efficiency, have focused on using line balancing techniques with different methods. The computer method for sequencing operations for assembly lines (COMSOAL), ranked positional weight (RPW), and largest candidate rule (LCR) methods were applied to improve line efficiency in the automotive industry. The report showed that all heuristic methods could provide good solutions for straight-line balancing problems. Fathi et al. (2018) compared 20 different heuristic methods on 100 assembly problems and found that the RPW heuristic method showed better results in providing solutions to industries that run assembly functions with straight-line configurations [
18]. These diverse tools are expected to ultimately help managers in making a better decision for the organization [
19,
20].
The Helgeson–Birnie method (RPW), Kilbridge–Wester Heuristic, and Moddie Young were implemented in line welding with the aim of improving line efficiency. The research results showed that the line efficiency and balance delay performance indicators had the same value when the three methods were applied. However, there was a difference in the smoothness index value. The Helgeson–Birnie (RPW) method showed the best smoothness index value [
21]. The RPW method used to balance the assembly line for a parts product was applied in different scenarios. The results showed that the RPW method produced a balanced assembly line with high line efficiency when there were no resource constraints at each workstation. The study also showed a significant decrease in the number of workstations required from 61 to only 27 [
22].
In sum, previous studies have been exclusive to certain methods, and few have combined various techniques to achieve optimal results for unique problem-solving in the field. Based on the firm’s needs in this study, and considering the advantages of the VSM method in the application of lean manufacturing concepts and the RPW method in line balancing techniques, the researchers were motivated to combine the two methods in improving the assembly process.
2.1. Lean Manufacturing
Lean manufacturing originated with the Toyota Production System (TPS) and was gradually adopted by Toyota in the 1950s. By the 1980s, Toyota was widely recognized for its successful implementation of the just-in-time (JIT) system and is now regarded as a leading firm in efficient and effective lean manufacturing practices. The term “Lean Manufacturing”, or “Lean Production”, was first introduced in the book
The Machine that Changed the World in 1990 [
23].
Lean manufacturing is a set of principles and methods aimed at eliminating waste in the production process. The objective is to reduce costs, increase output, and shorten lead times by removing anything that does not add value from the customer’s perspective. Standard processes involve detailed production guidelines to eliminate variation in worker tasks. Continuous flow aims to achieve a constant flow of processes to avoid bottlenecks and interruptions. Pull-production ensures that goods are produced only when needed and in the correct quantity. Quality at the source eliminates defects at the start of the production process and at the end leads to customer satisfaction [
23,
24]. Continuous improvement requires worker involvement in the pursuit of perfection through the elimination of waste [
23,
25].
Lean principles are primarily applied in industries that involve assembly-based processes or repetitive manual processes. These are typically industries where worker efficiency and attention to detail play a significant role in productivity. The implementation of improved systems can result in the elimination of significant waste and inefficiencies. Industries such as wood processing, garment manufacturing, automobile assembly, electronics assembly, and equipment manufacturing are all examples that have adopted lean concepts [
26].
2.2. Value Stream Mapping
Value stream mapping is a visual representation tool that helps companies to identify sources of waste in their production processes. It helps evaluate the current process and create an ideal future strategy. The mapping process evaluates the time required for value-added activities, non-value-added activities, cycle time, and changeover time. By identifying these factors, the company can eliminate waste and apply lean principles to improve its processes [
27].
The purpose of VSM is to visualize and identify the sources of waste in a company’s production process. The VSM team then creates a plan to eliminate these wastes and improve productivity by creating a blueprint for lean activities. There are two main steps in creating a VSM map: (1) a current state map, where the existing production system is analyzed and waste is identified; and (2) a future state map, where a plan to eliminate waste is developed and a continuous flow of products is established. Vital elements of VSM include understanding customer requirements, process steps, lead time, and takt time.
There are circumstances where some workstations cannot adopt a continuous flow process and must instead use a batch system. This can be due to processes located far apart from each other, requiring a changeover for fast or long cycle times, or having excessive waiting times. To control production flow in these cases, a pull system based on supermarkets is commonly used. The pull system acts as a link between two processes, providing proper production orders and serving as a scheduling tool in the supply process.
2.3. Ranked Positional Weight (RPW)
The RPW method was invented by Helgeson and Birnie in 1961 at General Electric [
22]. It is a commonly used heuristic method for line balancing and is known for providing higher line efficiency compared to other methods, such as the probabilistic line balancing method, the Hoffman method, and the Kilbridge and Wester Column method. The RPW method prioritizes work elements with the longest processing time and assigns a weight (rank) to each work element based on their precedence relationship and processing time. The method involves arranging the sequence of work elements, evaluating their working time, calculating the weight of each position, arranging work elements based on weight, setting the cycle time, calculating the number of workstations required, and assigning tasks to workstations to maximize efficiency. The RPW method has practical steps, a short completion time, and a low cost compared to other methods.
3. Materials and Methods
The research proceeds in six stages: (1) data collection to create a current state map, (2) creation of current state maps, (3) calculation of performance indicators, (4) identification of waste and proposal of improvements, (5) design of a future state map, and (6) re-calculation of performance indicators. The final results will be compared to the initial values to determine the effectiveness of the improvements. The stages are illustrated in a process flow diagram in
Figure 1.
3.1. VSM Data Analysis
In mapping the ARX weapon assembly process, the following data will be collected: process flow, cycle time, transport time, changeover time, number of operators, working time availability, and uptime information. Cycle time is the duration of processing a single product before the next one arrives. Changeover time is the time taken to switch from one product to another. Uptime is calculated as the percentage of machine availability for processing. Transport time is the duration of moving the product from one station to another.
To create current state maps, the flow of information and materials on the actual assembly line will be observed and the collected data will be represented graphically on the map. The analysis of the current state maps will reveal opportunities for improvement that will be incorporated in the design of future state maps aimed at reducing waste and optimizing the overall process.
3.2. RPW Data Analysis
The data needed for the rapid process walk (RPW) method include cycle time, available time, the number of workstations, and total working time. These data will be used to calculate assembly performance indicators, such as balance delay, line efficiency, and smoothness index [
22]:
Balance delay (BD) indicates the proportion of waiting time to the total time spent on the assembly line. A low BD value is desirable and indicates efficient use of time, as it means there is no waiting time for the operator to perform the next task. The BD is calculated using an equation [
7]:
- 2.
Line efficiency
Line efficiency is the ratio of total time at workstations to cycle time multiplied by the number of workstations. Line efficiency is the most critical performance indicator of an assembly line because the higher the line efficiency value, the better the assembly utilization. The line efficiency is calculated by the equation [
7]:
- 3.
Smoothness index
The smoothness index is an index that shows the relative waiting time of an assembly line. Perfect balance is indicated by the minimum smoothness index value of 0 (zero). In other words, the distribution of the workload on the assembly line is said to be even if the smoothness index value is getting closer to 0 (zero). The smoothness index is calculated by the equation [
7]:
Si shows the i-th workstation, TSi is the total working time at the Si station, m is the number of workstations, and TSmax is the maximum time available at the workstation.
4. Current Process and Performance
In the ARX weapon assembly process, the work areas are divided into eight component sub-assemblies:
Barrel and Upper Receiver Sub-Assembly
Bolt and Bolt Carrier Sub-Assembly
Lower Receiver Sub-Assembly
Butt Stock Sub-Assembly
Complete Barrel Sub-Assembly
Complete Weapon Sub-Assembly
Washing and Packing of Weapon
Weapon Accessories Sub-Assembly
Some of these sub-assemblies are performed in parallel, while others are carried out in series, meaning that the preceding process must be completed first. The work process of these eight sub-assemblies is depicted in
Figure 2.
Figure 2 shows that the Barrel and Upper Receiver, Bolt and Bolt Carrier, Lower Receiver and Weapon Accessories sub-assemblies can be performed simultaneously, while the Complete Barrel sub-assembly can only start after the completion of the Barrel and Upper Receiver sub-assembly. The Butt Stock sub-assembly can be done after the Lower Receiver sub-assembly. The Complete Weapon sub-assembly can only be done when the Complete Barrel, Bolt and Bolt Carrier, and Butt Stock sub-assemblies are completed. The assembly process is followed by weapon testing, washing, and packing, where the results of the Weapon Accessories sub-assembly are included in the packing process. Finally, the packaged weapons are stored in the warehouse.
4.1. Barrel and Upper Receiver Sub Assembly
The Barrel and Upper Receiver sub-assembly consists of 11 operations divided into nine work stations, with a total operating time of 1222 s across all stations (
Figure 3).
In the Barrel and Upper Receiver sub-assembly, only two workstations (A5 and A7) have a cycle time lower than the takt time. The process ratio is 1.26%, indicating a low level of value-adding activity compared to non-value-adding activities, due to a large amount of inventory and WIP between workstations, leading to long waiting times and extended production lead times.
4.2. Bolt and Bolt Carrier Sub-Assembly
The Bolt and Bolt Carrier sub-assembly involves eight operations split across five workstations, with a total operating time of 684 s for all stations (
Figure 4).
All stations in the Bolt and Bolt Carrier sub-assembly have a cycle time greater than the takt time. The sub-assembly ends with an inventory of 300 components, resulting in a low process ratio of 1.29%.
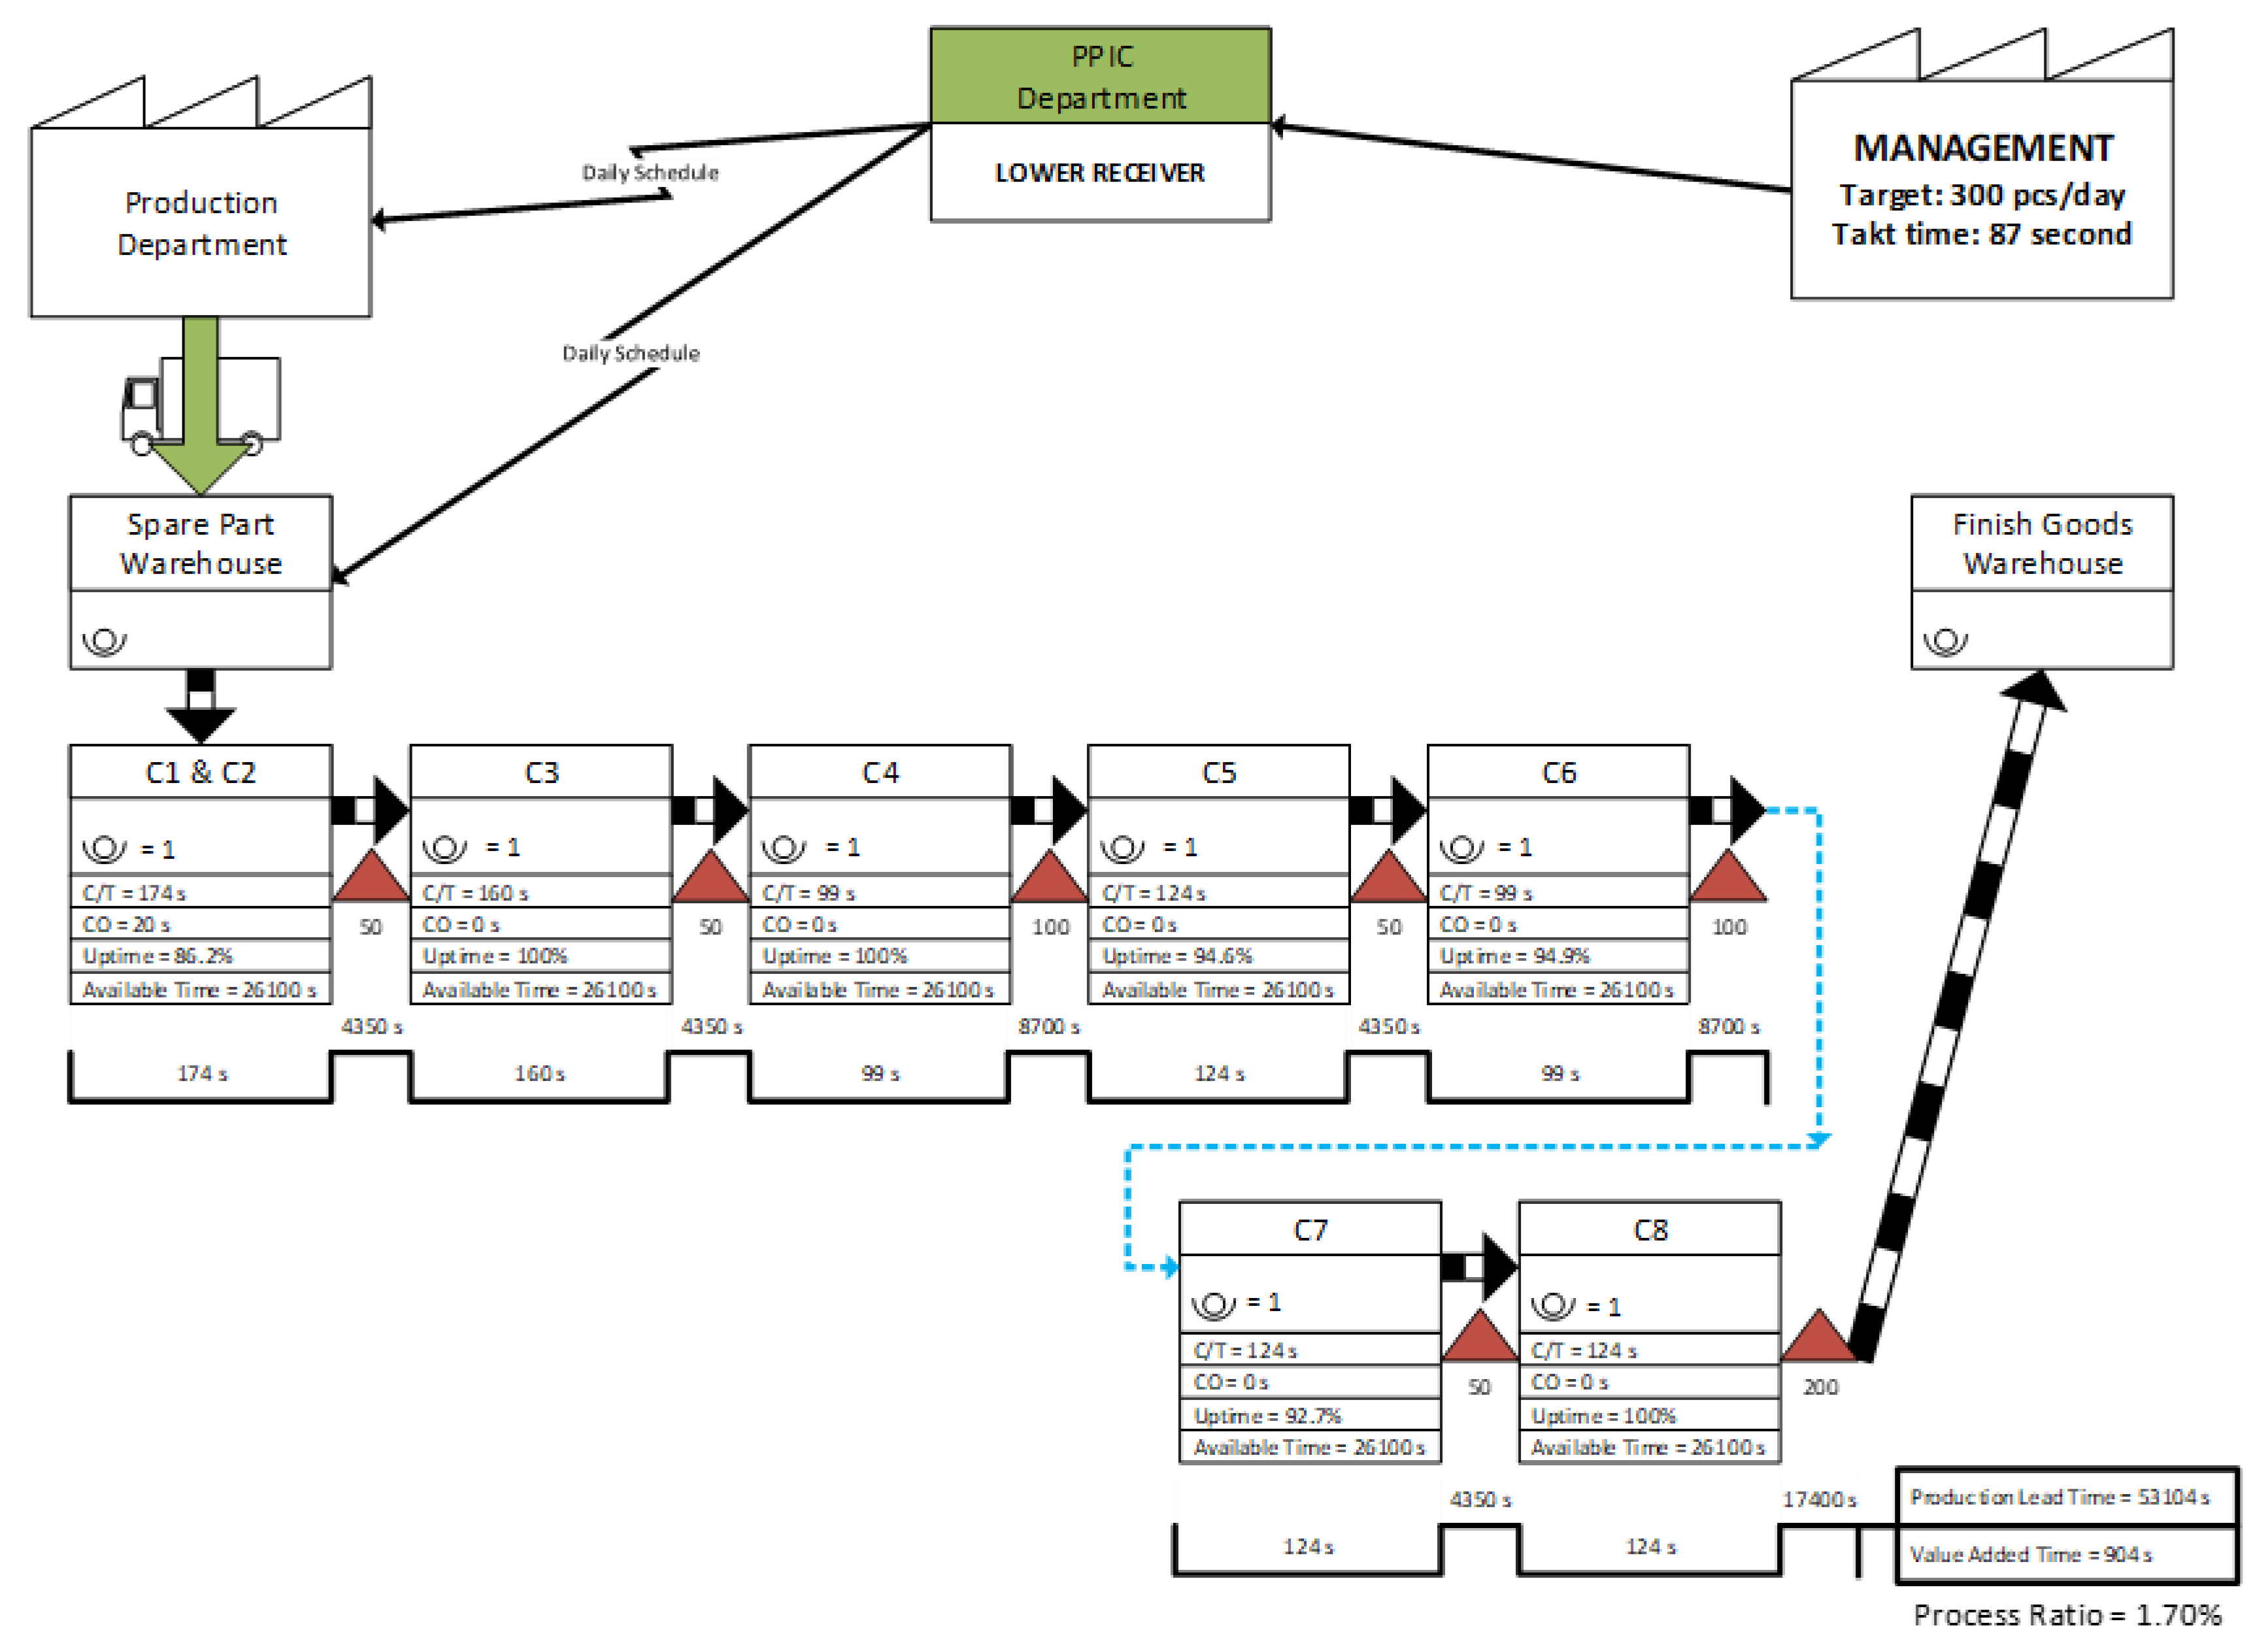
4.3. Lower Receiver Sub-Assemblies
The number of operations in this sub-assembly is eight processes divided into seven workstations, with a total operating time of 904 s (
Figure 5).
Only one station uses machine assistance in the Lower Receiver sub-assembly, namely the C1 + C2 operation. All stations in the Lower Receiver sub-assembly have a higher cycle time than the takt time.
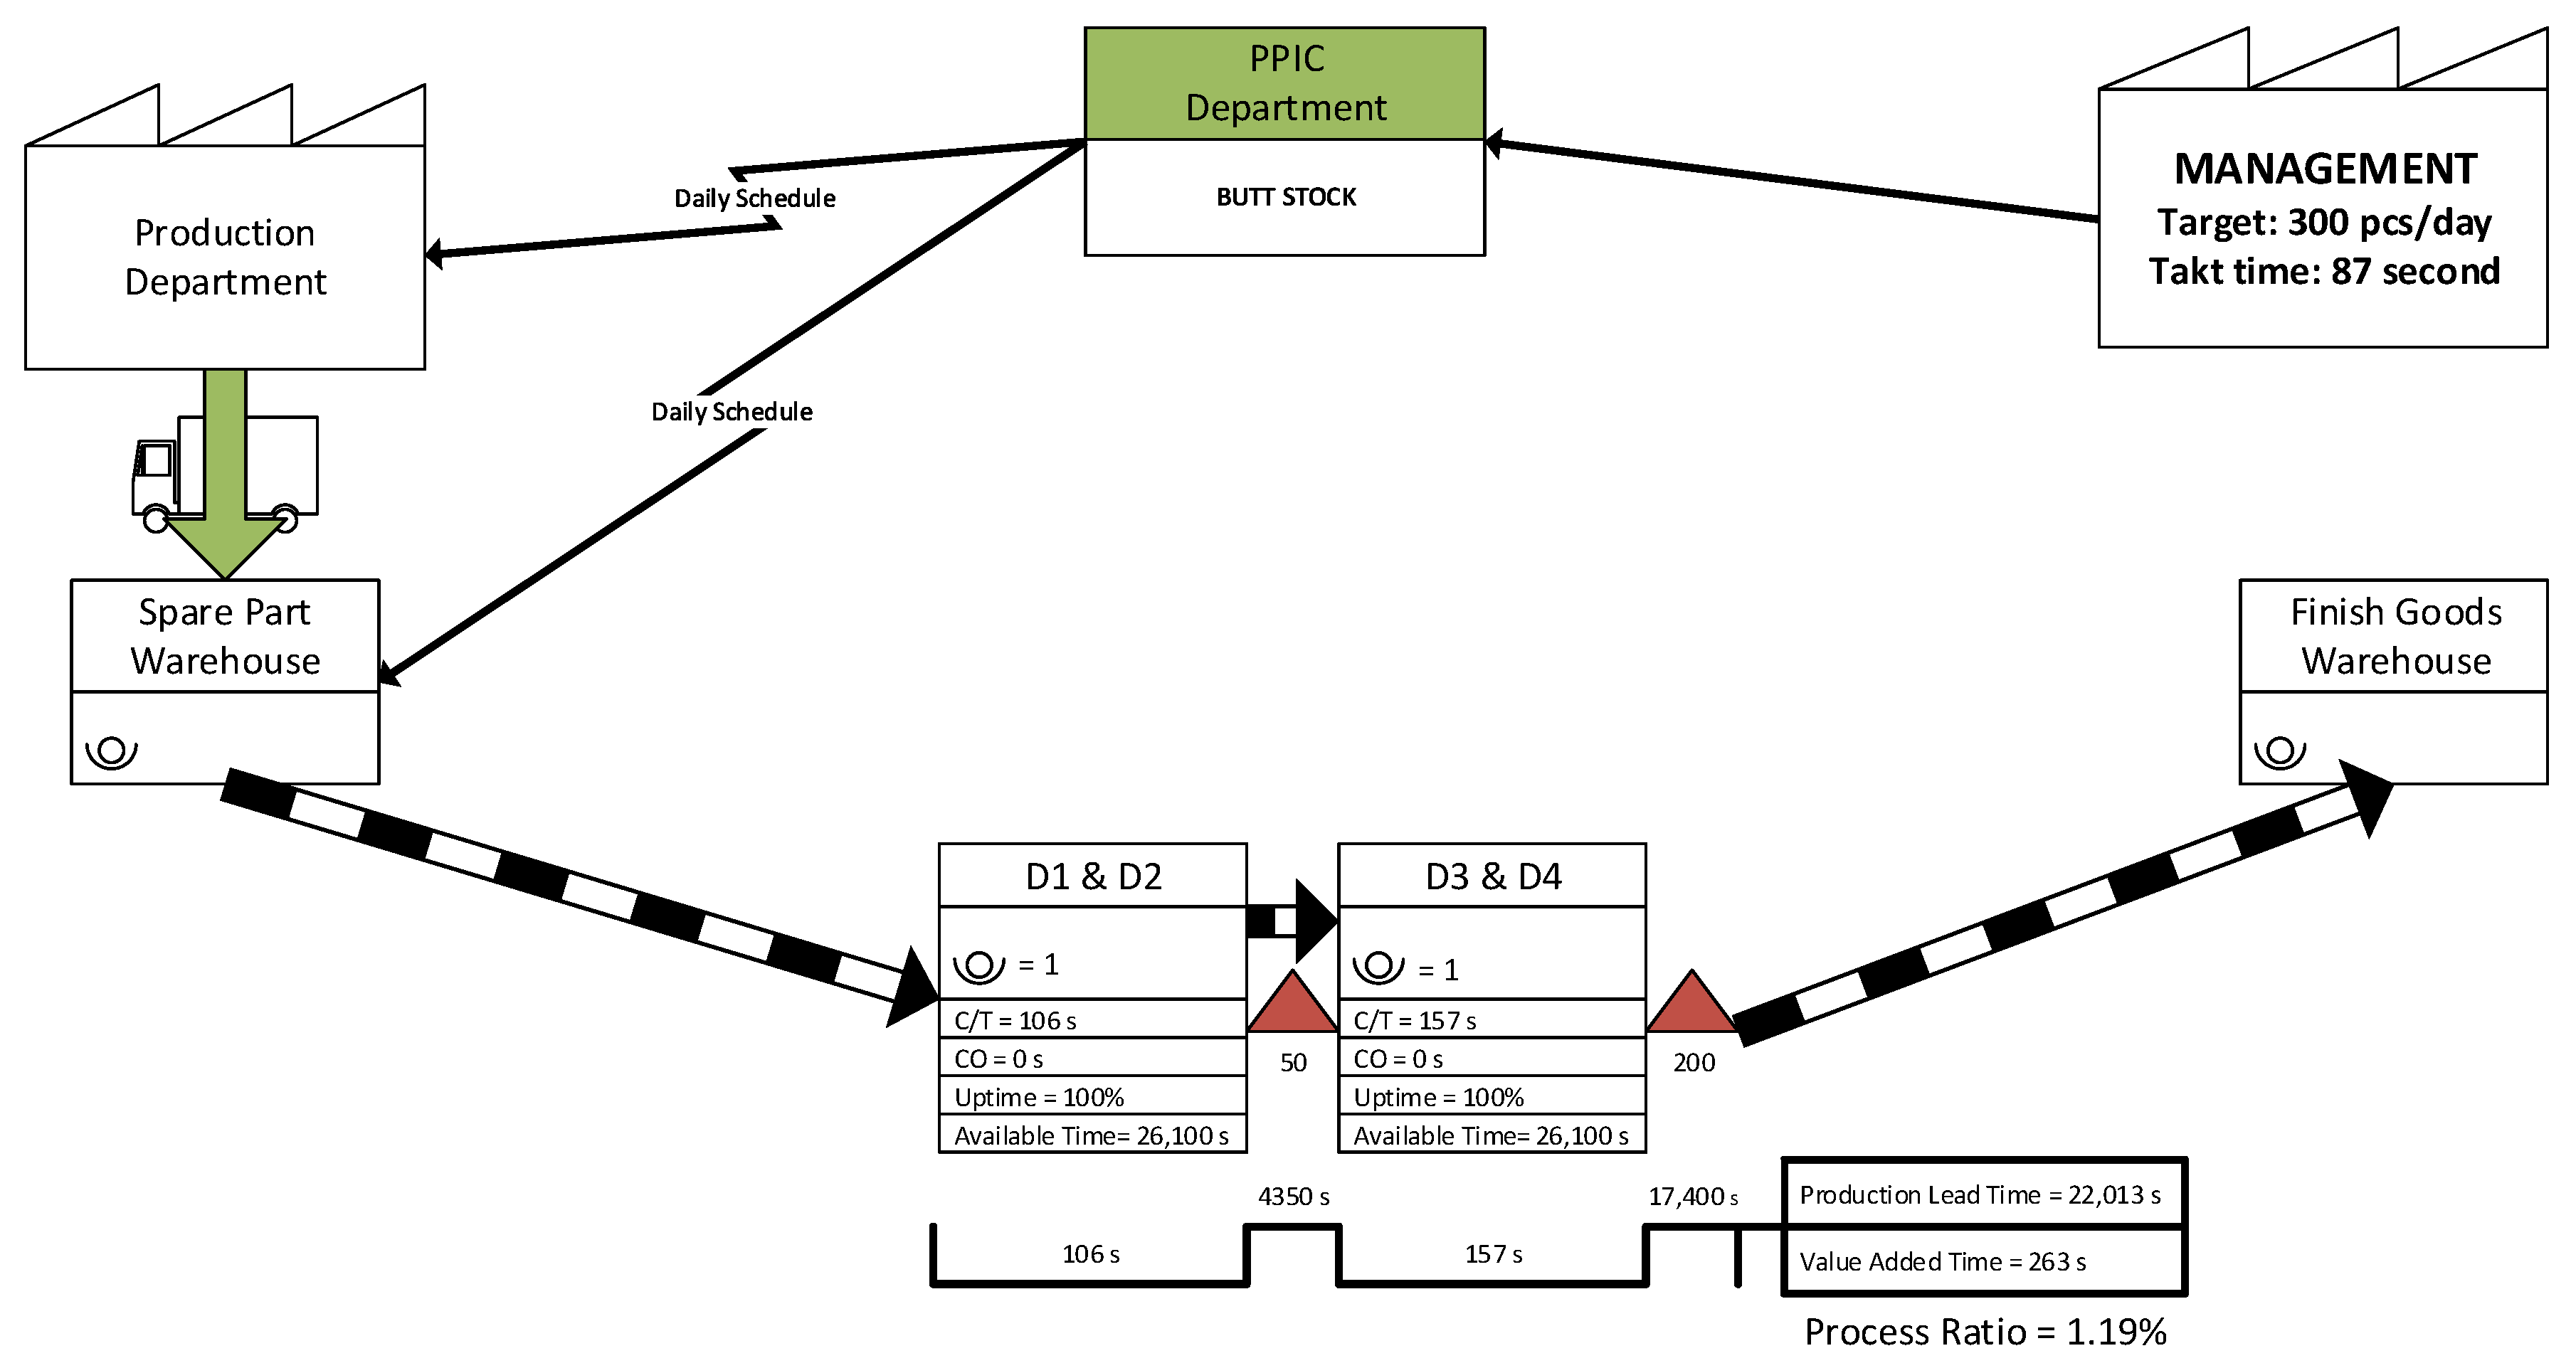
4.4. Butt Stock Sub-Assembly
This sub-assembly has four operations divided into two workstations with a total operating time of 263 s (
Figure 6).
The entire process on the Butt Stock sub-assembly is performed manually and requires simple tools for assembly. However, because installing components on the auxiliary equipment (fixture) takes a long time, all stations in this sub-assembly have a higher cycle time than the takt time. The process ratio on the Butt Stock sub-assemblies is only 1.19% due to the large inventory/WIP at the end of the process.
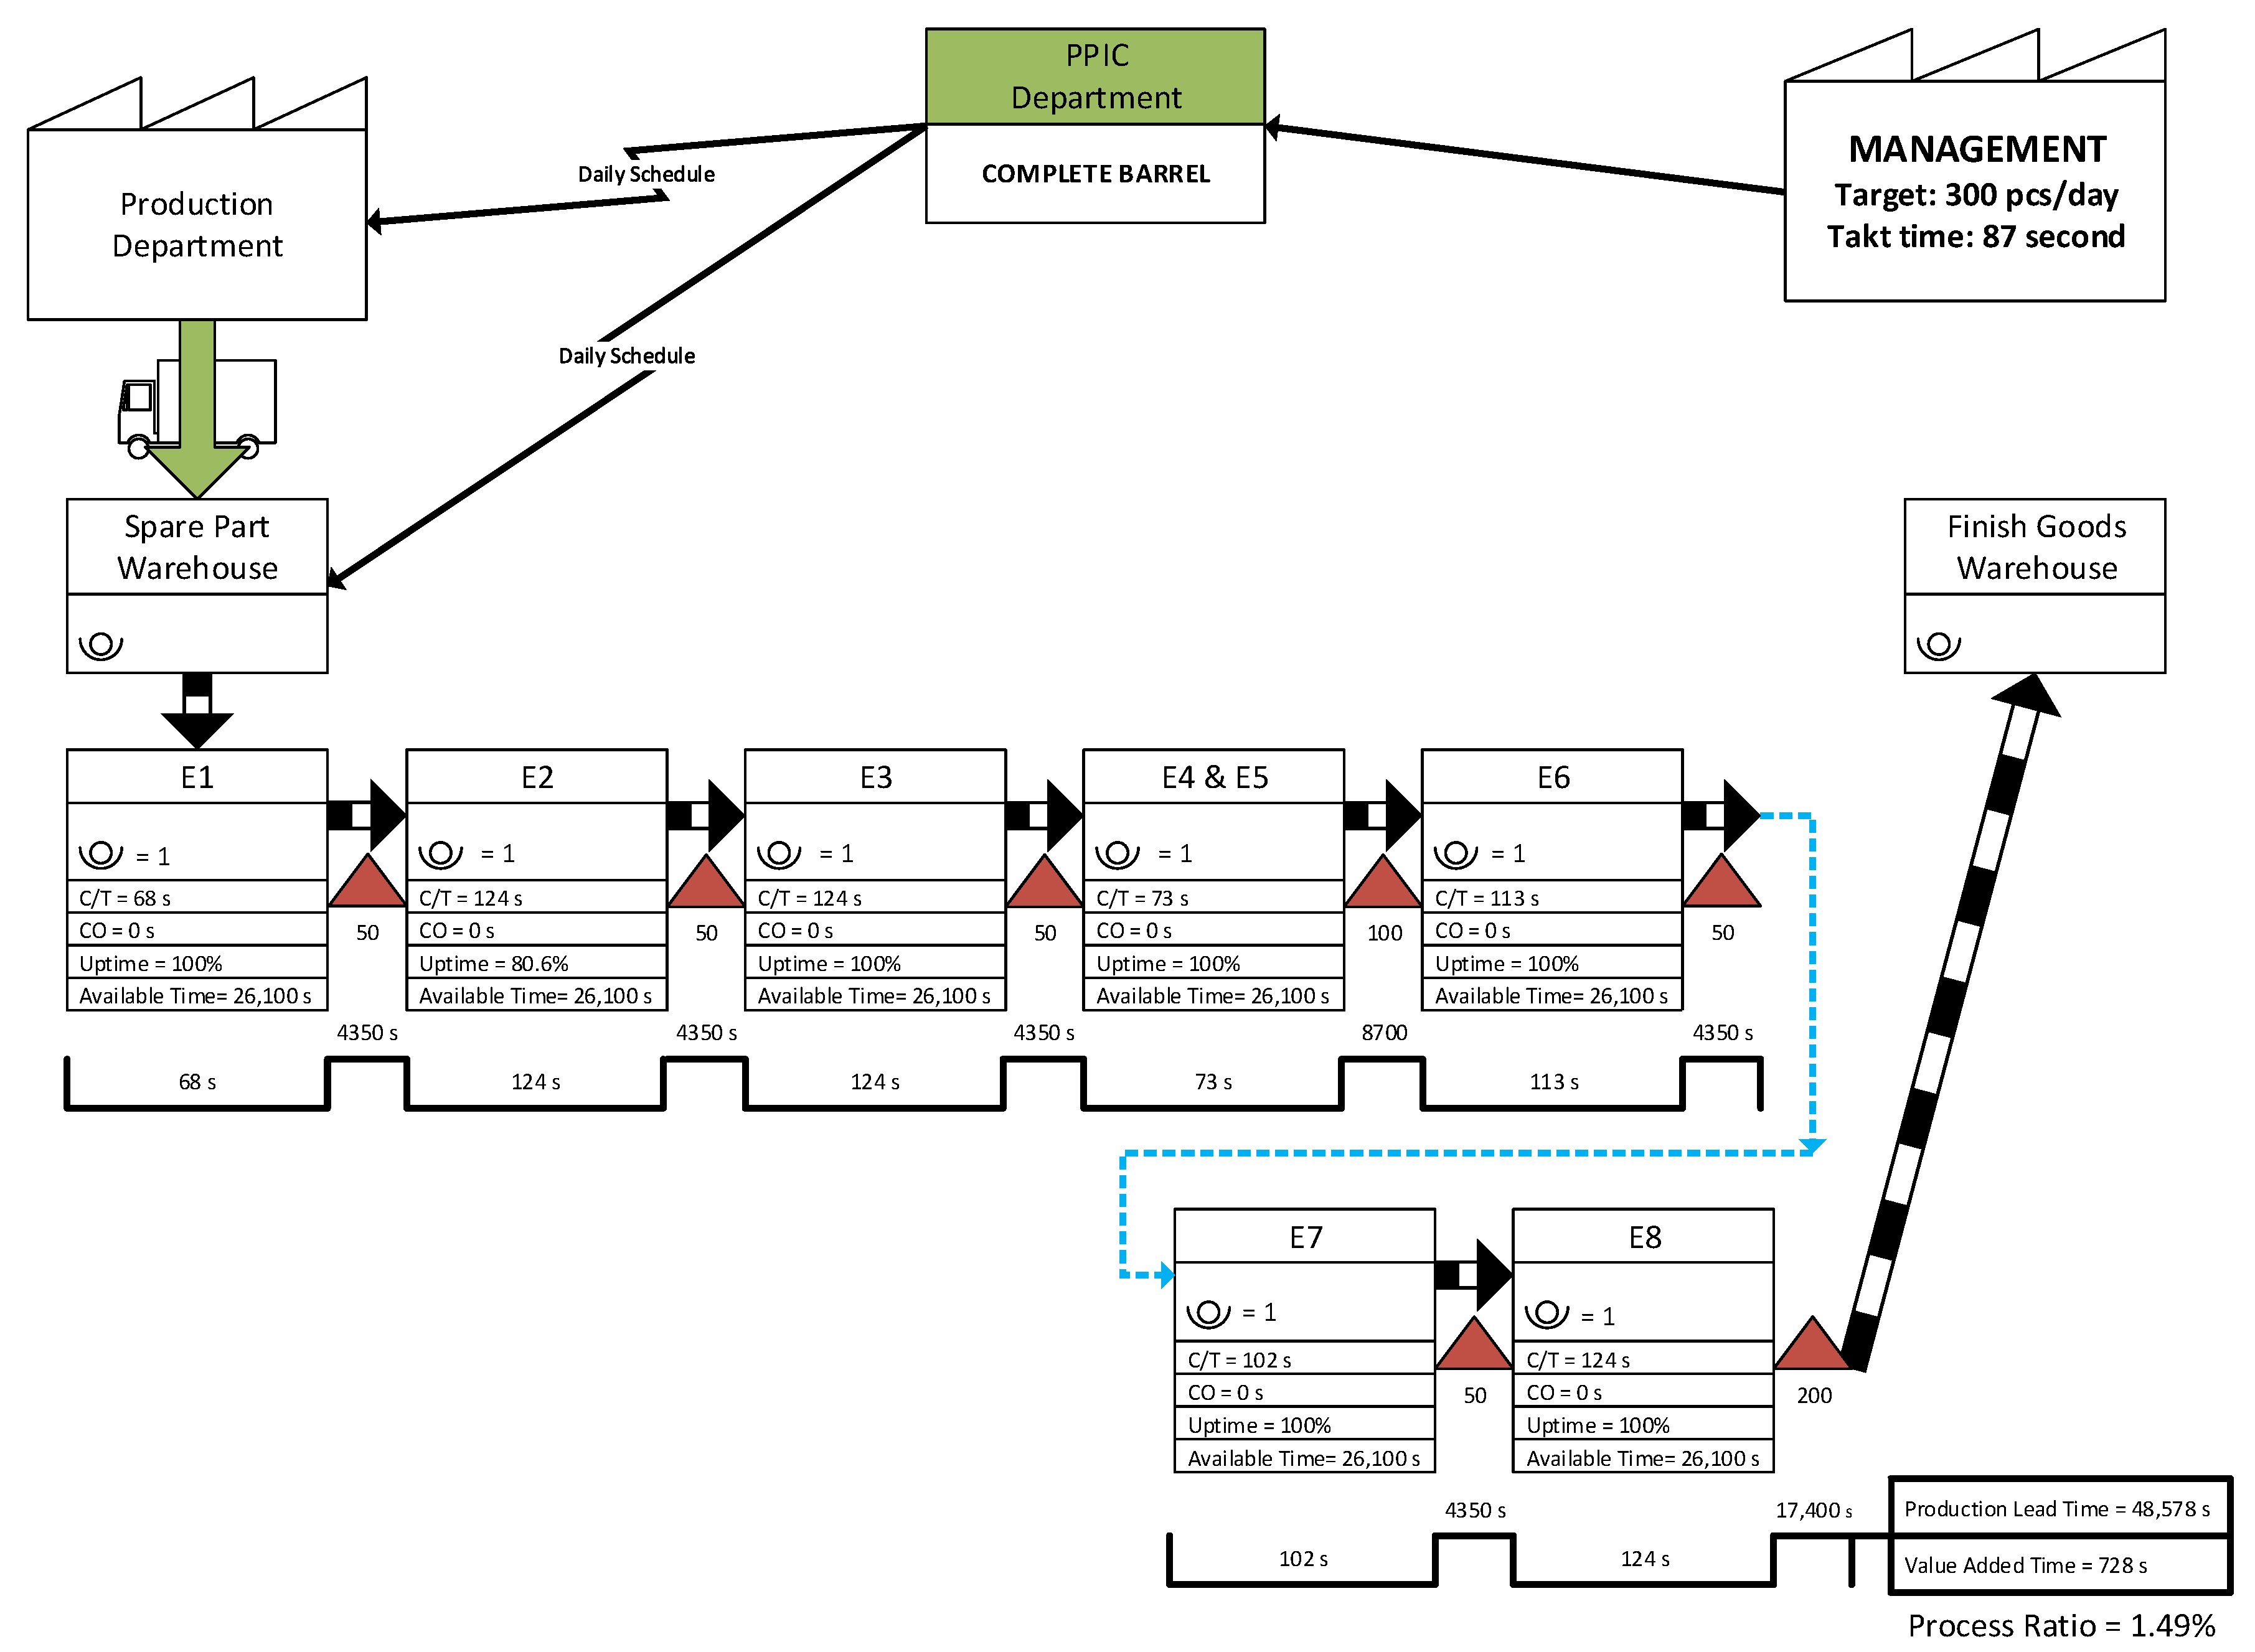
4.5. Complete Barrel Sub-Assembly
There are eight operations in the Complete Barrel sub-assembly to combine the Barrel component with its supporting elements. The eight operations are divided into seven workstations with a total operating time of 728 s. In this sub-assembly, two workstations have a lower cycle than the takt time, namely the E1 and E4 + E5 operations. The inventory/WIP at the end of the process is relatively high, causing the process ratio in this sub-assembly to become low (
Figure 7).
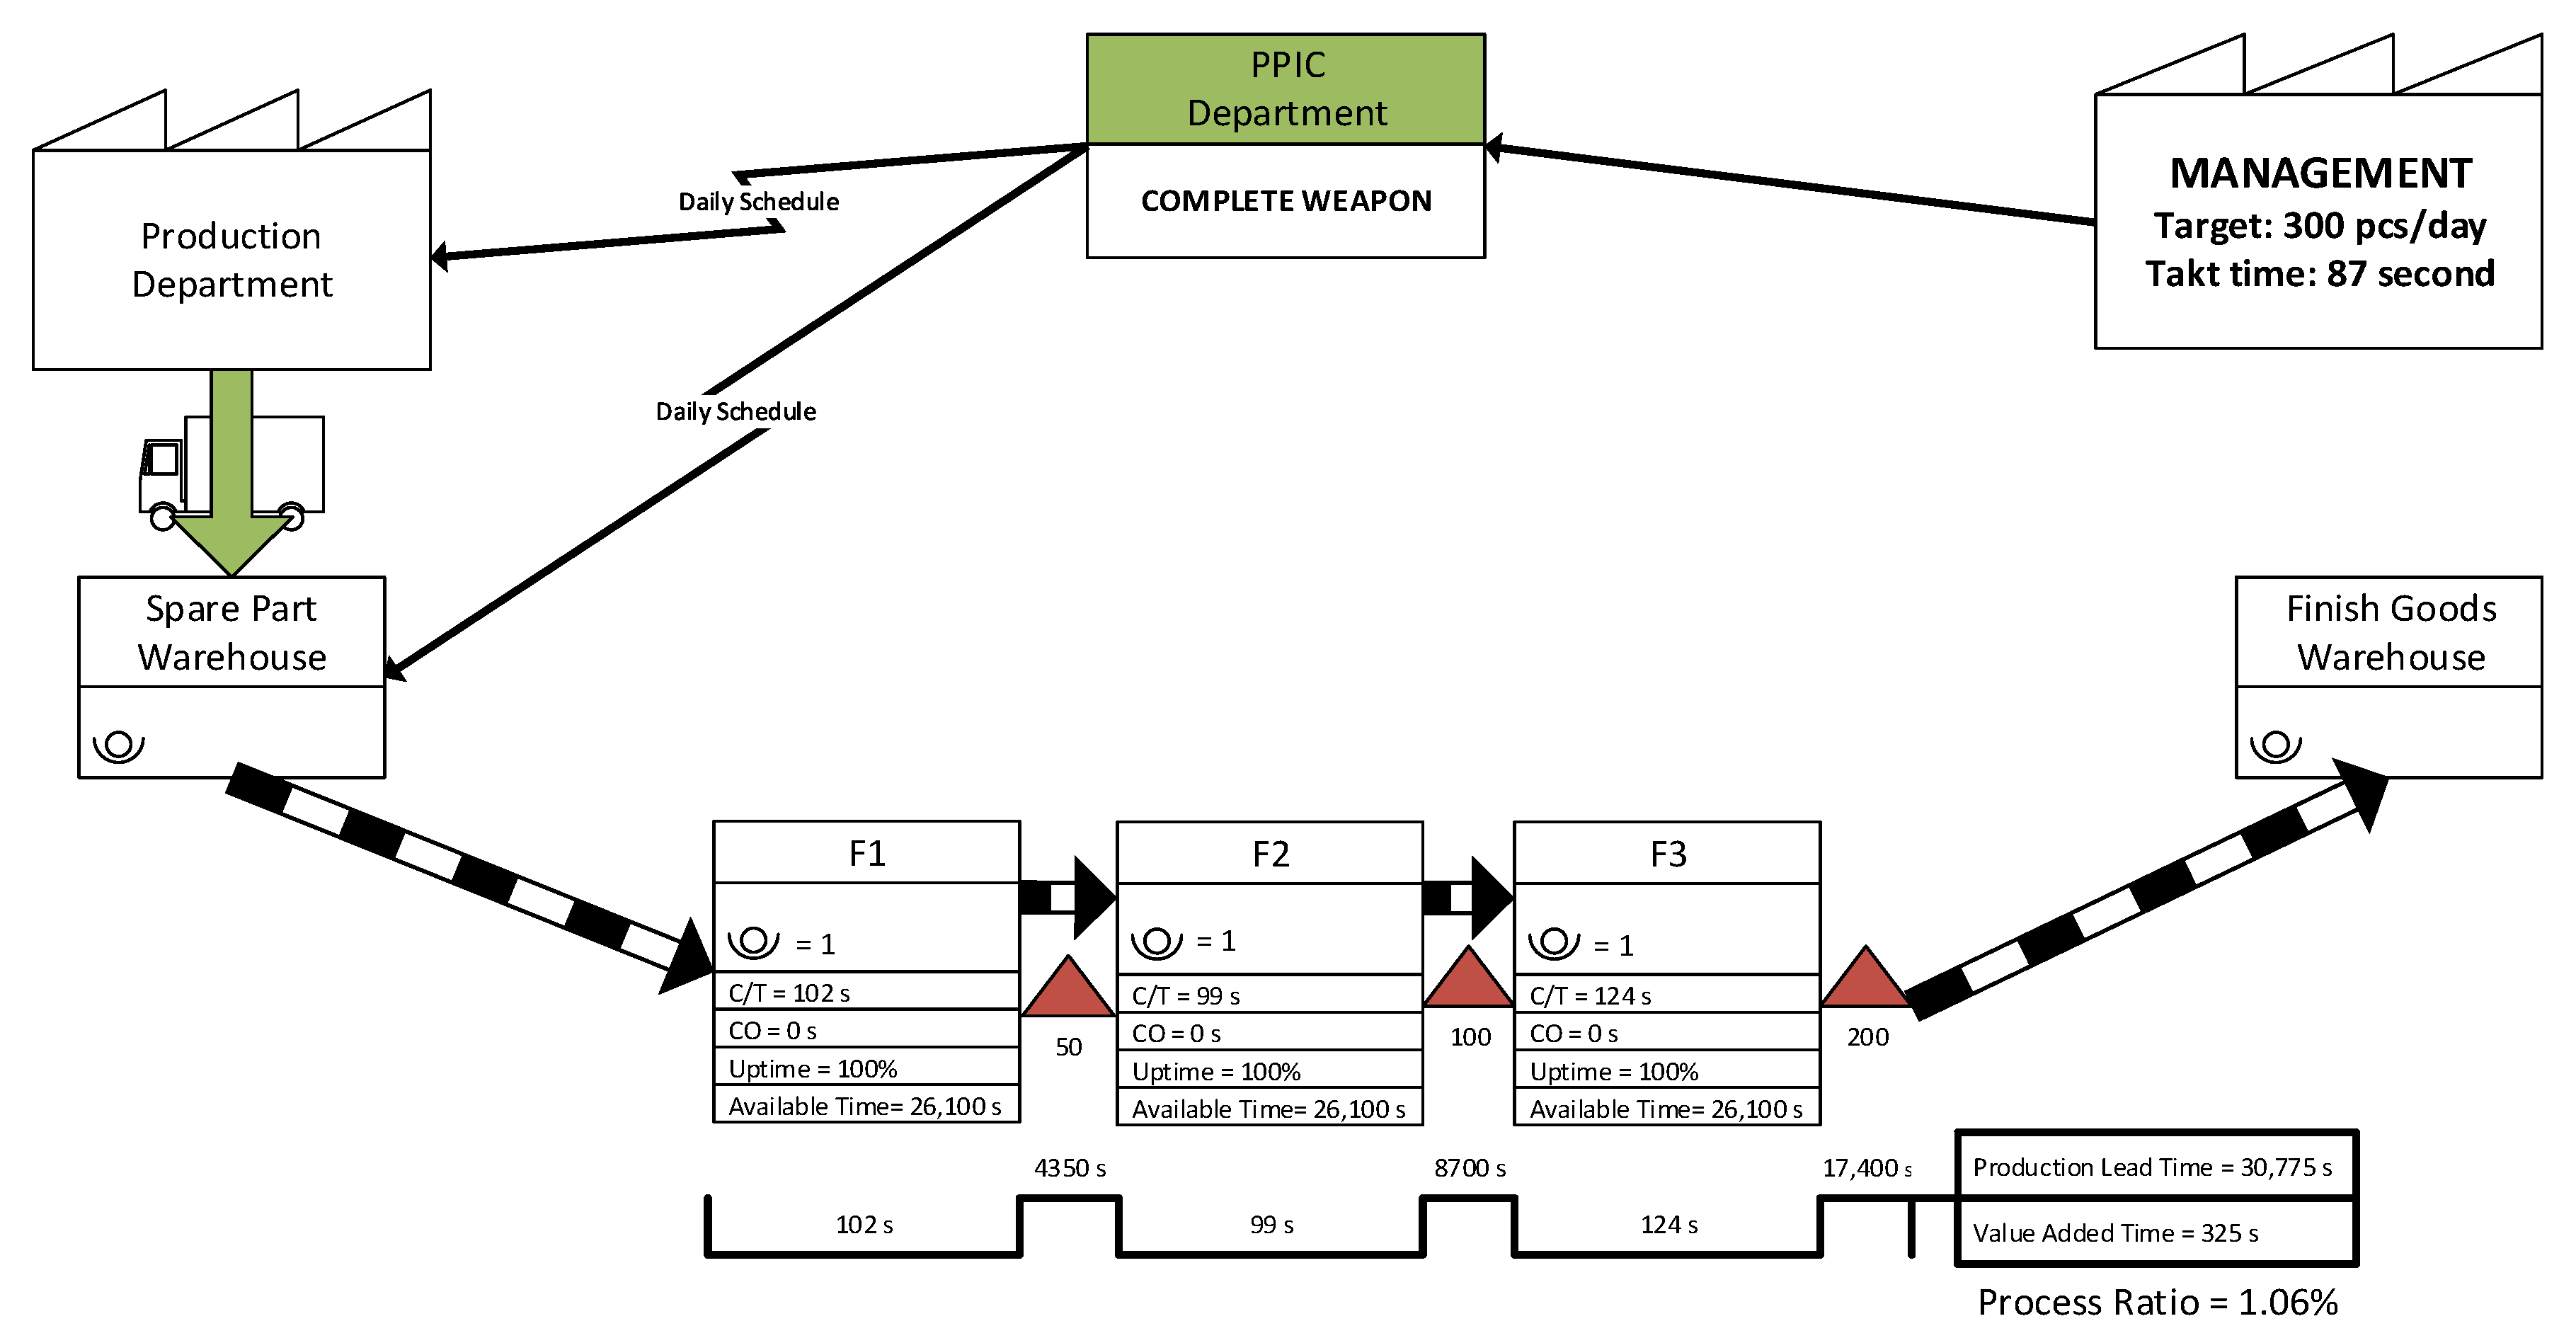
4.6. Complete Weapon Sub-Assembly
There are three operations and three workstations on the Complete Weapons sub-assembly, with a total working time of 325 s (
Figure 8).
The Complete Weapons sub-assembly combines components from previous sub-assemblies and is conducted manually, simulating the ability to disassemble a fully assembled weapon with bare hands. The process across all stations has a cycle time higher than the takt time, resulting in a low process ratio due to the significant inventory/work in process (WIP) at the end of the process.
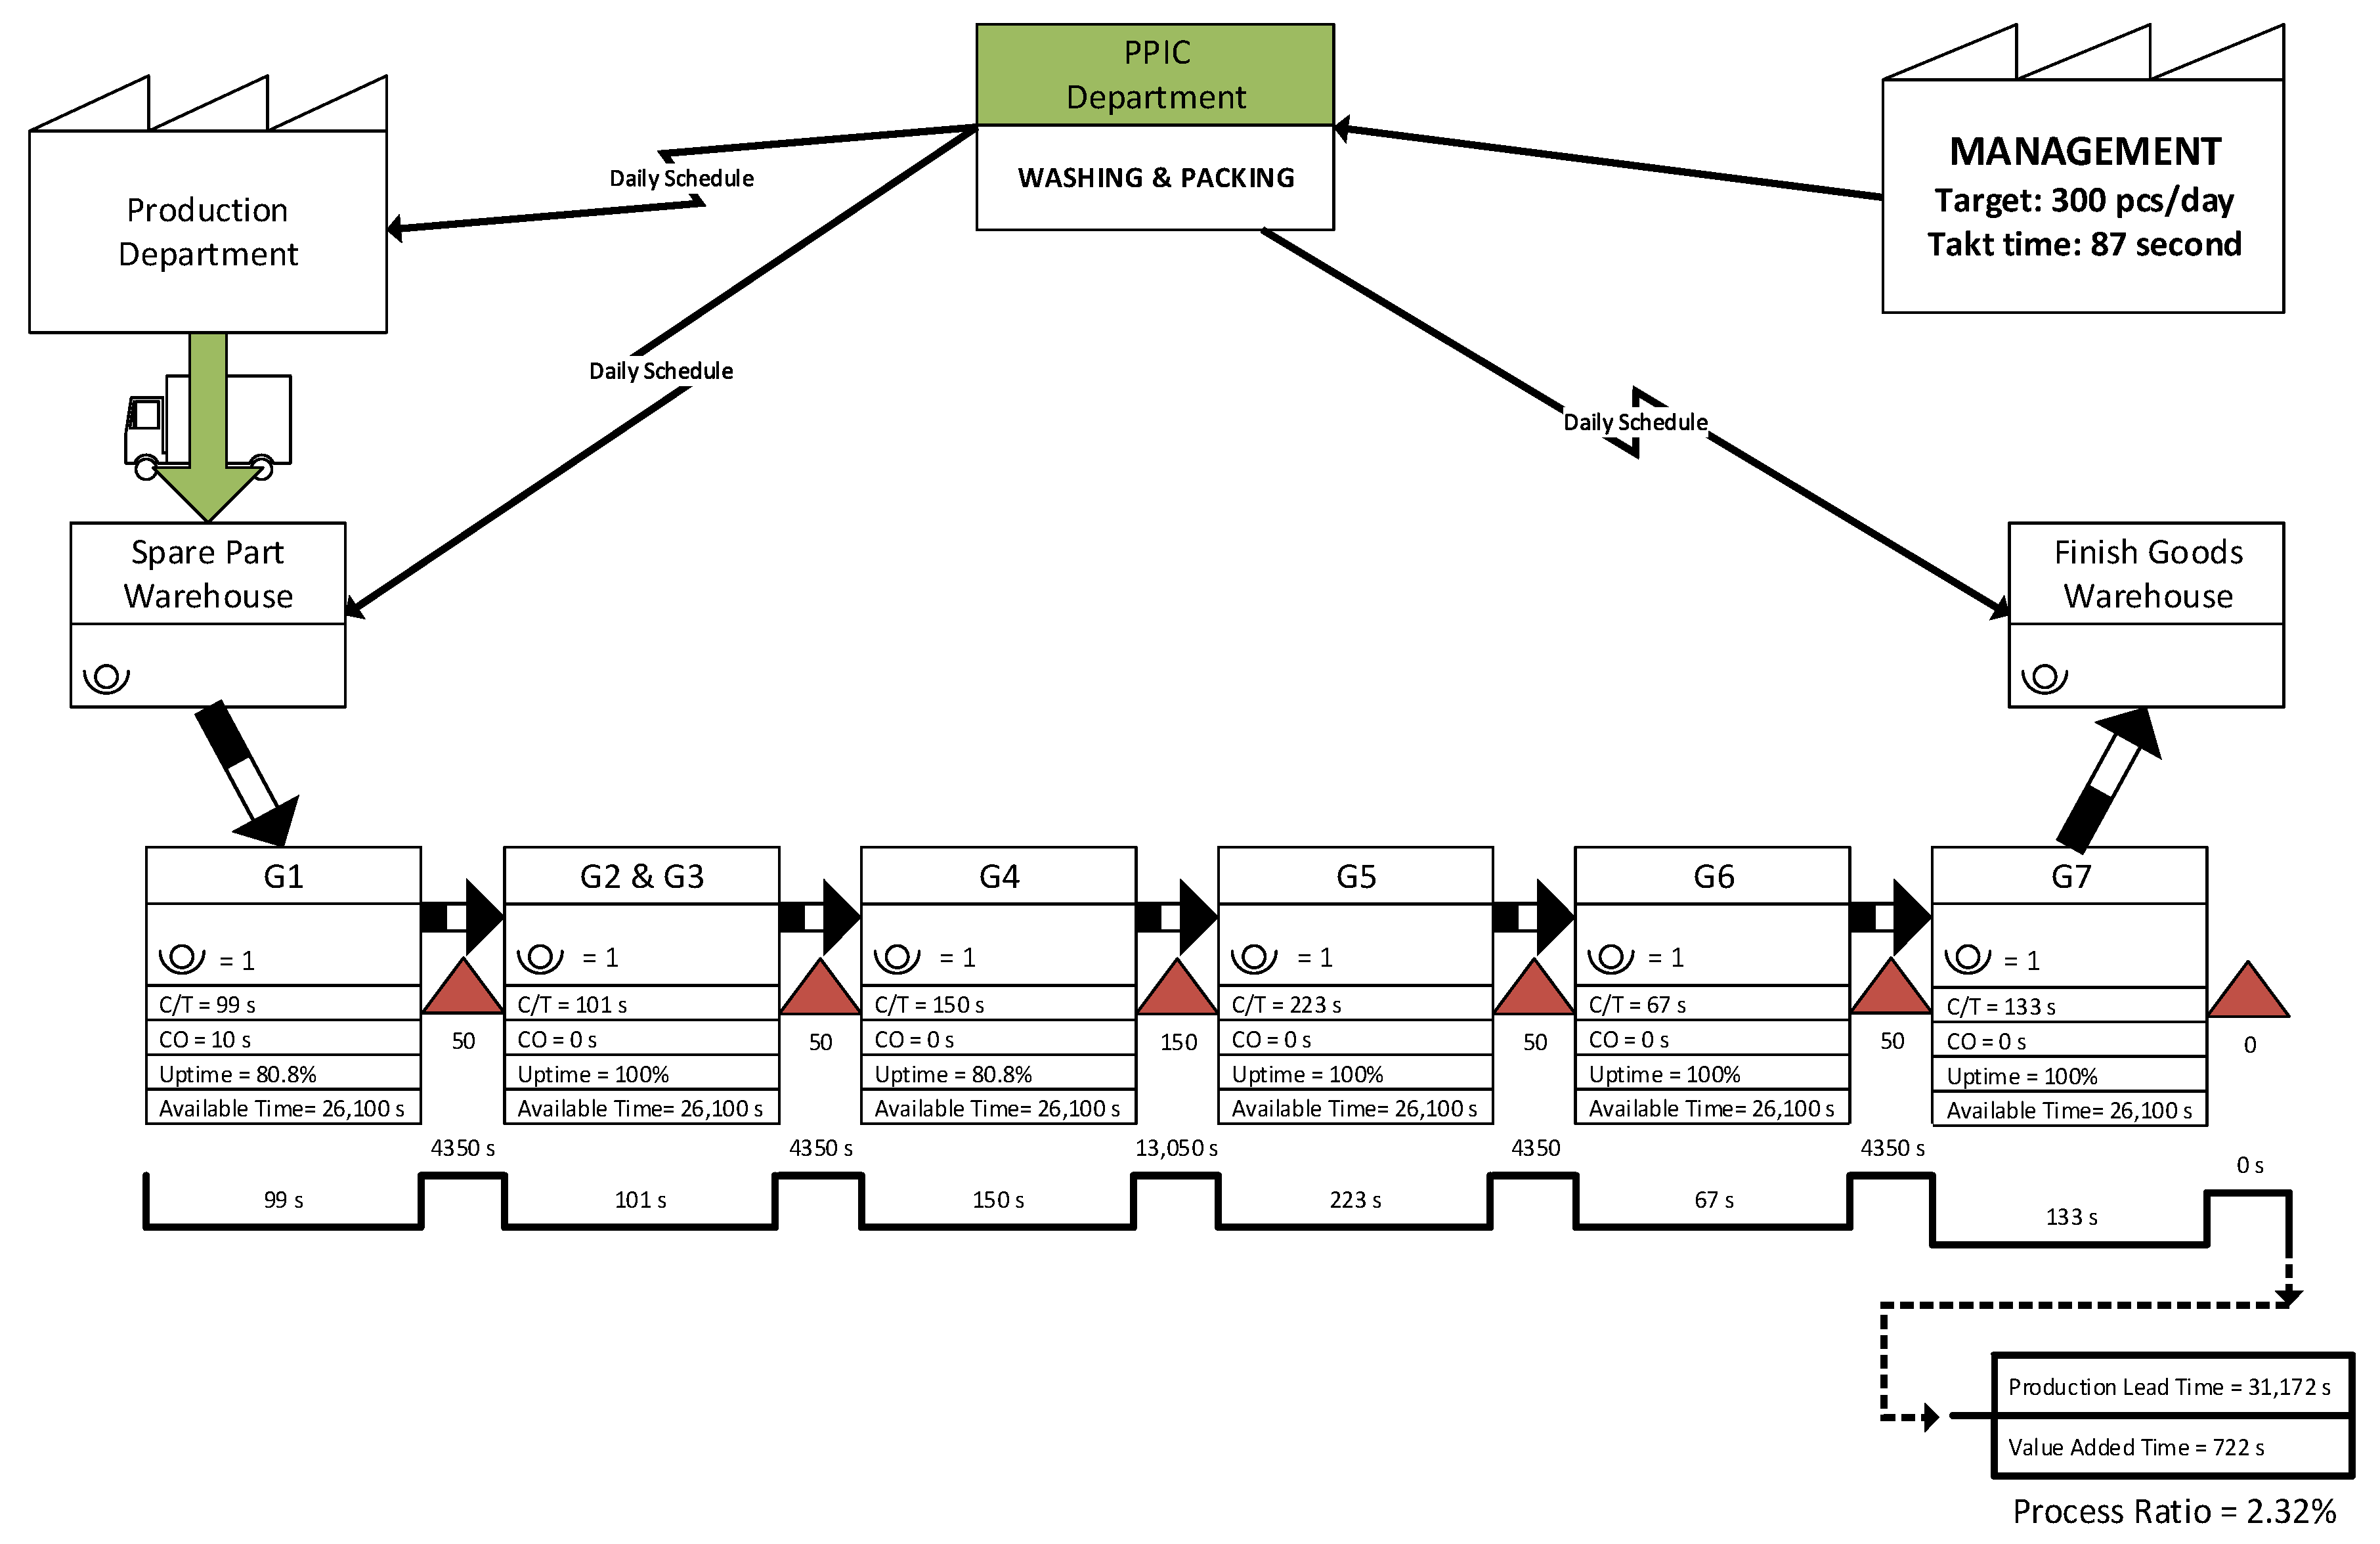
4.7. Washing and Packing of Weapon
The number of operations on Washing and Packing are seven processes divided into eight workstations with a total working time of 722 s. Due to the lengthy process, there are two workstations in each washing process (Operation G5) and case sealing process (Operation G7) (
Figure 9).
One workstation in this subsection has a lower cycle time than takt time, namely in the G6 operation. The location of the weapons case sealing that is integrated with the warehouse causes no inventory/WIP at the end of the process. The process ratio in this process is highest compared to the others.
4.8. Weapon Accessories Sub-Assembly
In the Weapon Accessories sub-assembly, seven operations are divided into two workstations with a total working time of 273 s (
Figure 10).
Each workstation in the assembly process performs operations with a cycle time lower than the takt time, but because each operation is carried out by a single person, the station’s overall cycle time exceeds the takt time, resulting in an inability to reach production targets. The end of the process in this sub-assembly additionally has a relatively high inventory/WIP, leading to a process ratio of only 1.24%. Performance indicators such as balance delay, line efficiency, and smoothness index are calculated to assess the efficiency and workload uniformity of the assembly process.
The minus value in the balance delay calculation indicates that the workload received by the assembly personnel to meet the target of 300 ARX per day is excessive.
The higher the line efficiency value is, the more maximal will be the utilization of product utility. However, if the value is more than 100%, it also shows an overload production indicator.
A higher smoothness index value indicates an uneven distribution of workload on the current assembly line; therefore, improvements are needed in order that the smoothness index value gets closer to 0 (zero).
5. Improvements by Combining VSM and RPW
5.1. Value Stream Mapping (VSM)
Based on the results of the VSM analysis, improvement efforts for the process include:
1. Setting up a more ergonomic workstation
The position of components on the workbench was rearranged based on ergonomic principles, with a focus on optimizing the reach zone [
28]. The components on the workbench were arranged to fall within the operator’s reach, reducing the time it takes to retrieve and place parts during assembly. An experiment showed that this resulted in a 23% reduction in average cycle time, demonstrating that the placement of components has a significant impact on cycle time in manual assembly processes.
2. Changing machining process parameters.
The assembly process improvement was achieved by adjusting the machining process parameters using machine assistance. The parameters adjusted include the rotating speed of the tools, feed rate, and engine power. The changes were made while taking into consideration the machine’s maximum capability and preventive maintenance plan. The combination of rearranging components on the workbench and adjusting machine parameters resulted in a 35% reduction in average cycle time. This method of reducing the cycle time by adjusting machining parameters was also supported by prior research where the speed and feed of the machine in roughing and finishing operations was increased, reducing the cycle time from 140 to 111 s with no negative impact on product quality [
27].
3. Investing in new machines.
This improvement focuses on the weapon washing operation (G5) at the workstation. The implementation of an ultrasonic cleaning machine can enhance the speed and efficiency of the washing process while also promoting a healthier work environment by reducing the usage of harmful chemicals.
4. Maximizing the use of electronic information.
The proposed improvement involves implementing ERP software to improve communication and coordination between the assembly and warehouse areas. The ERP software will help keep track of the number of components processed in the assembly area, allowing the warehouse to schedule handling of WIP more effectively. The use of electronic information has already been successful in reducing the inventory at suppliers from three days to a half-day [
11].
5.2. Ranked Positional Weight (RPW)
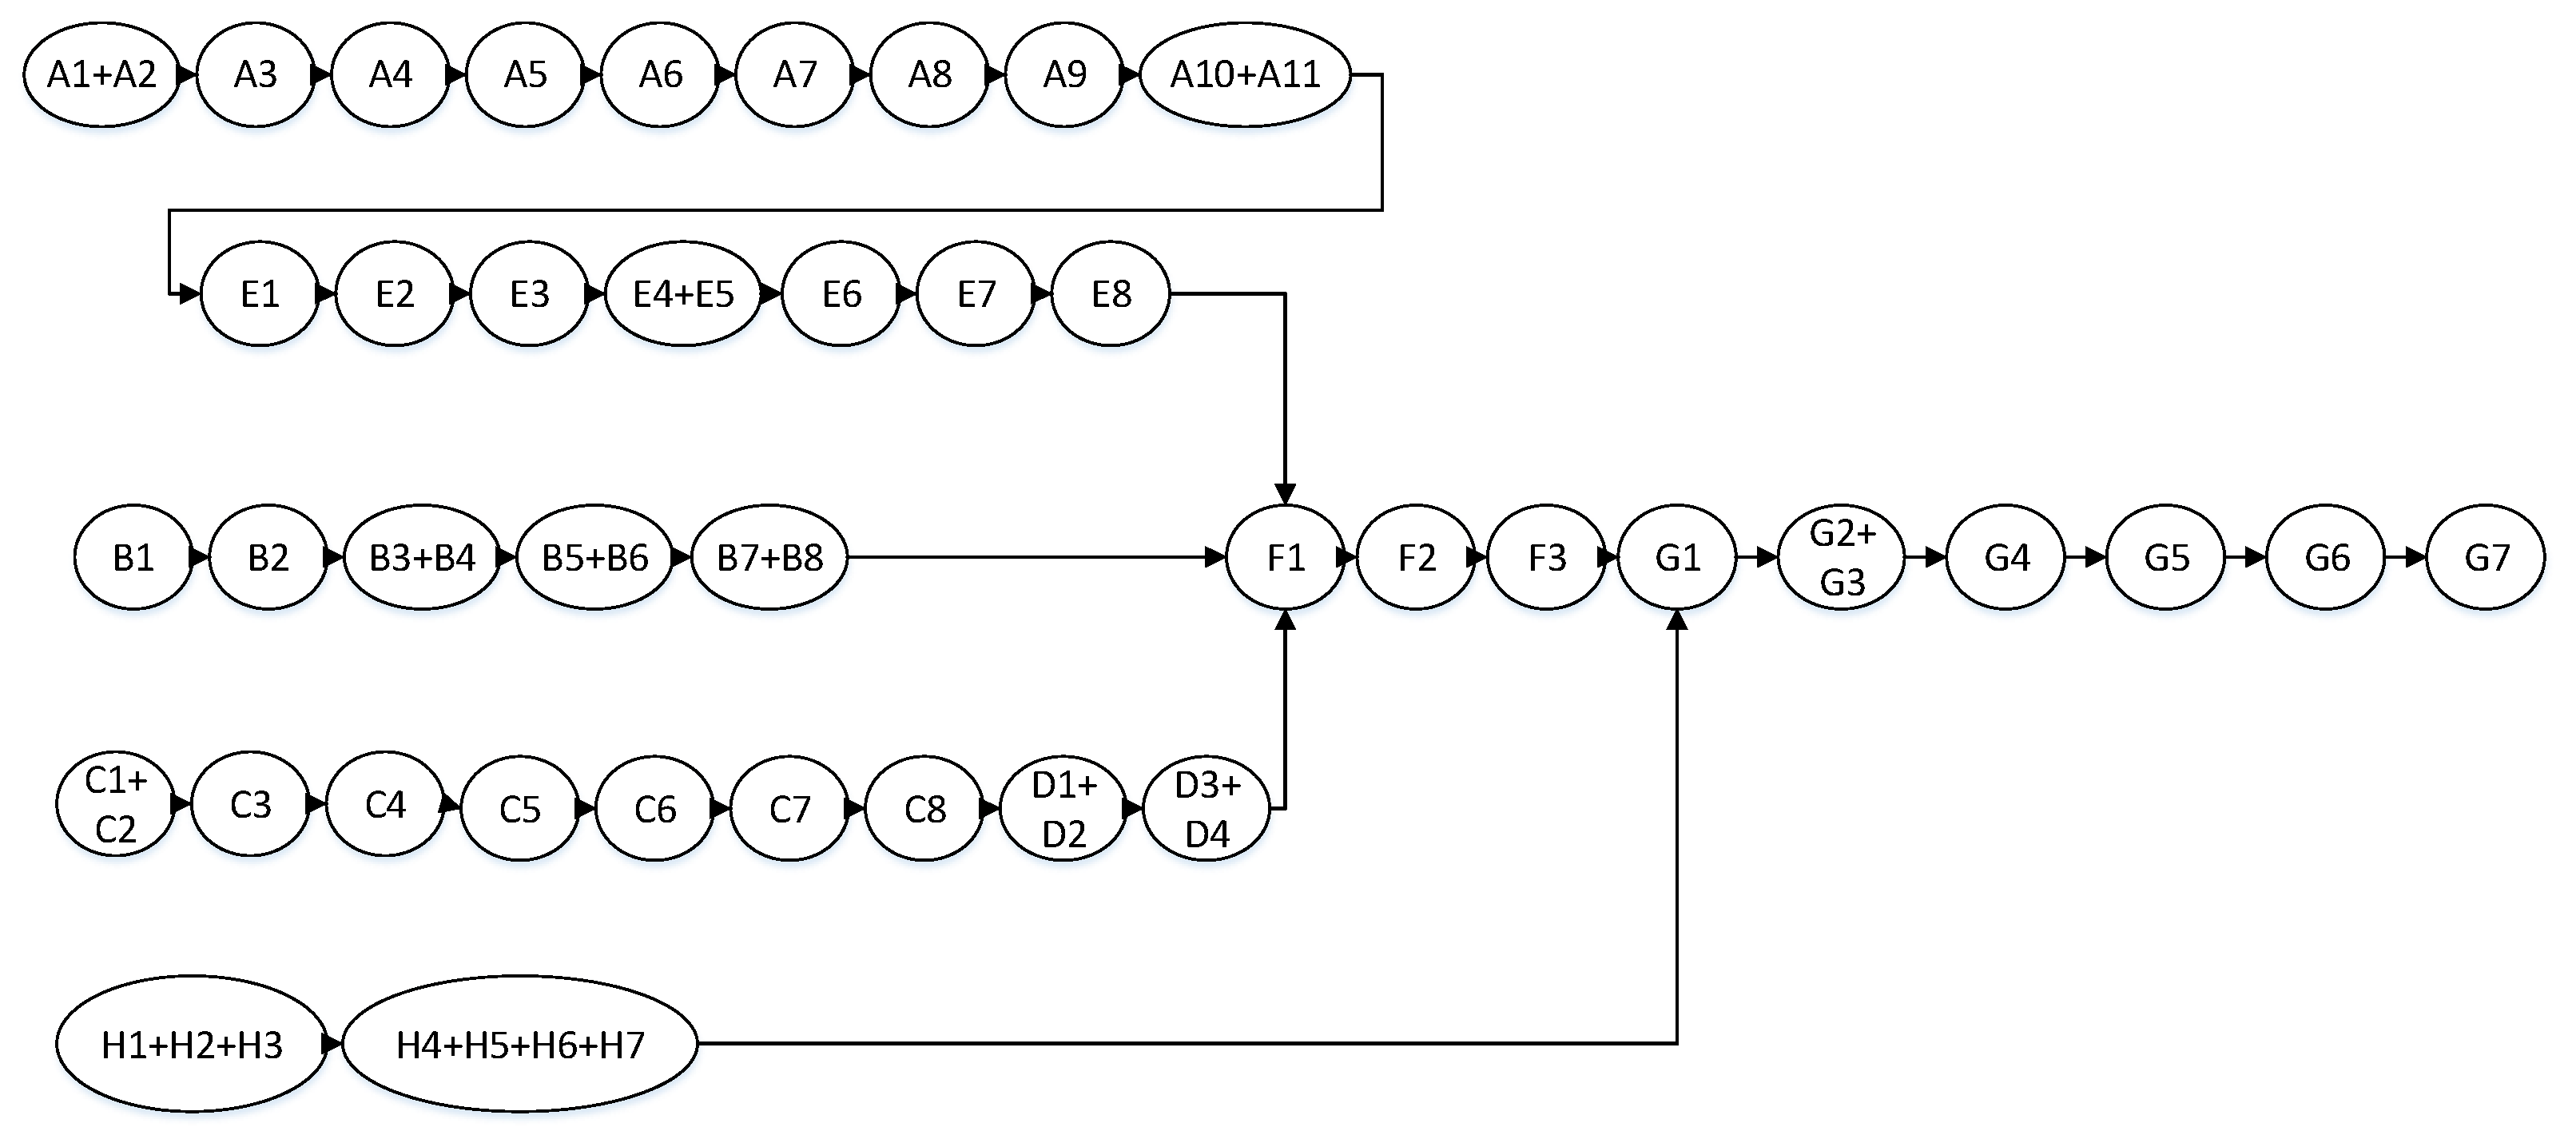
The positional weight calculation starts by creating a precedence diagram, and the positional weight of each workstation is subsequently determined. The ARX weapon assembly precedence diagram is depicted in
Figure 11.
The positional weight calculation for each work element is carried out by first creating a precedence diagram and determining the weight of each workstation. The weighting process is based on the precedence diagram in
Figure 11, which is used to sort the work elements from highest to lowest weight. The task assignment at each workstation is then determined by assigning the work elements with the highest weight first. Combining two or more work elements at a station is possible, provided their combined cycle time does not exceed the takt time (87 s). If a single work element has a cycle time that exceeds the takt time, it must be assigned to its own station and cannot be combined with other elements. The results of this task assignment are shown in
Table 1.
5.3. Future State Maps
The current state map of the ARX weapon assembly was analyzed, together with proposed improvements and experimentation results, leading to the creation of the future state map.
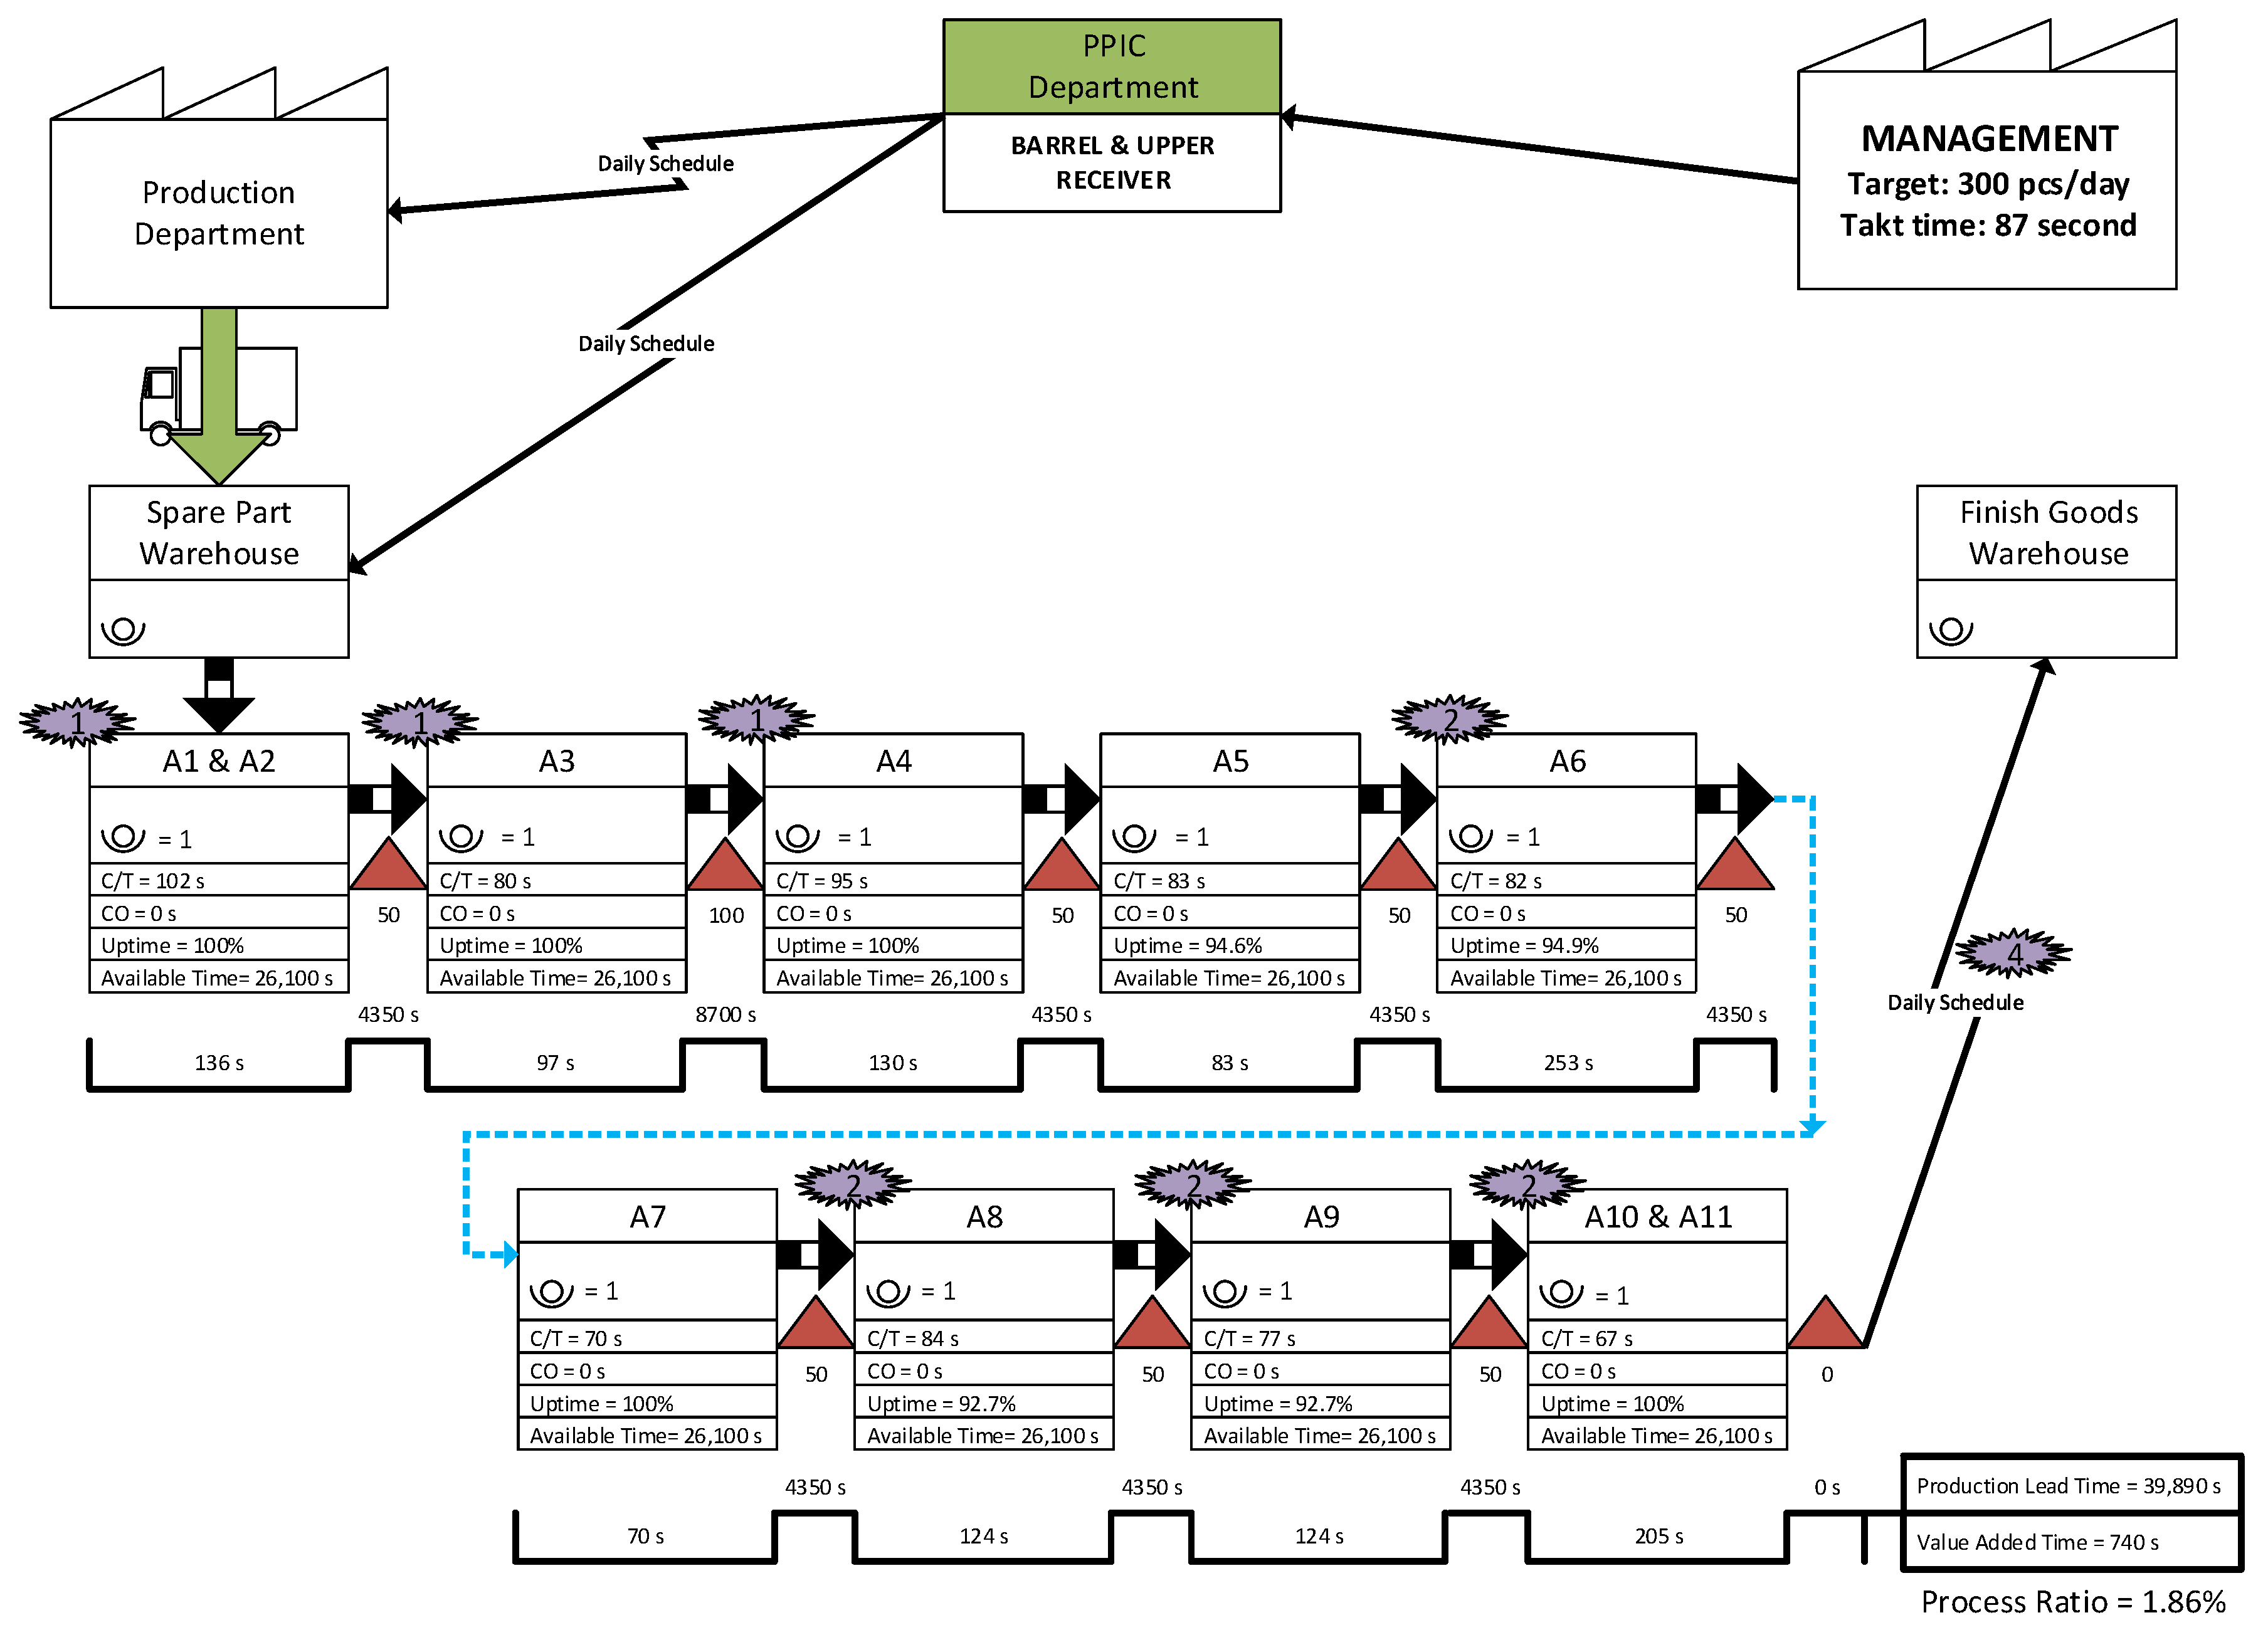
5.3.1. Future State Maps of the Barrel and Upper Receiver Sub-Assembly
The Barrel and Upper Receiver sub-assembly will still have nine workstations, but the overall operating time of these nine workstations has been decreased from 1222 s to 740 s (
Figure 12).
Operations A1 + A2, A3, and A4 are improved by performing more ergonomic workstation arrangements, while the operation of A6, A8, A9, and A10 + A11 made additional improvements by changing the machine parameters. The problem of stockpiling inventory/WIP at the end of the process is solved by using electronic information through ERP software.
The process ratio of the Barrel and Upper Receiver sub-assembly increased from 1.26% to 1.86%, which indicates that the value-adding activity of this sub-assembly is greater than in the previous condition.
5.3.2. Future State Maps of the Bolt and Bolt Carrier Sub-Assembly
In the Bolt and Bolt Carrier sub-assembly, eight operations are grouped into five workstations. The improvements suggested led to a reduction in the total operating time of these five workstations, from 684 s to 505 s. This resulted in an increase in the process ratio of this sub-assembly, from 1.29% to 1.89%.
5.3.3. Future State Maps of the Lower Receiver Sub-Assembly
The total operating time of the seven workstations that compose the Lower Receiver sub-assembly was reduced from 904 s to 673 s and the process ratio of this sub-assembly is 1.89%.
5.3.4. Future State Maps of the Butt Stock Sub-Assembly
The total time of four operations divided into two workstations on the Butt Stock sub-assembly was reduced from 263 s to 203 s. Because all processes in the Butt Stock sub-assembly are performed manually, repairs are made by setting up more ergonomic workstations. The process ratio of the Butt Stock sub-assembly increased relatively sharply from 1.19% to 4.46% due to the loss of inventory/WIP at the end of the process.
5.3.5. Future State Maps of the Complete Barrel Sub-Assembly
Total operating time on the Complete Barrel sub-assembly that consists of seven workstations was reduced from 728 s to 578 s by arranging more ergonomic workstations and changing the machine parameters. The process ratio in this sub-assembly was 1.86%.
5.3.6. Future State Maps of the Complete Weapon Sub-Assembly
The total working time of the Complete Weapon sub-assembly was reduced to 250 s from the original 325 s. By placing components on a workbench within easy reach of the operator, the working time of assembling components compared to the previous condition was much reduced. The process ratio value also increased from 1.06% to 1.88%.
5.3.7. Future State Maps of the Washing and Packing
Total working time on Washing and Packing consisting of eight workstations was reduced from 722 s to 461 s. Even after the improvement, there was an insignificant decrease in the process ratio from 2.32% to 2.07%. However, almost all workstations have a lower cycle time than the takt time. Only stations in the G7 operation have a cycle time higher than the takt time.
5.3.8. Future State Maps of the Weapon Accessories Sub-Assembly
The Weapon Accessories sub-assembly with two workstations decreased the total working time from the original 273 s to 210 s. The arrangement of a more ergonomic workstation and electronic information to reduce inventory/WIP at the end of the process can increase the process ratio from 1.24% to 4.61%.
5.4. Performance Indicators after VSM and RPW Implementation
The calculation of performance indicators post-VSM and RPW implementation was carried out to conduct a comparison with the current state and evaluate the changes made.
There is no minus value in the balance delay after improvement with the application of VSM and RPW, which means that the production target of 300 ARX per day is possible to achieve. A low balance delay value shows good assembly performance because the operator has no waiting time before the next job.
The value of the line efficiency after improvement with the VSM and RPW is close to 100%. It means the utilization of production utilities is close to the maximum.
The smoothness index score after improvement with VSM and RPW is lower than the current condition. A smoothness index score closer to 0 (zero) indicates that the workload distribution on the assembly line is more even than before.
6. Discussion
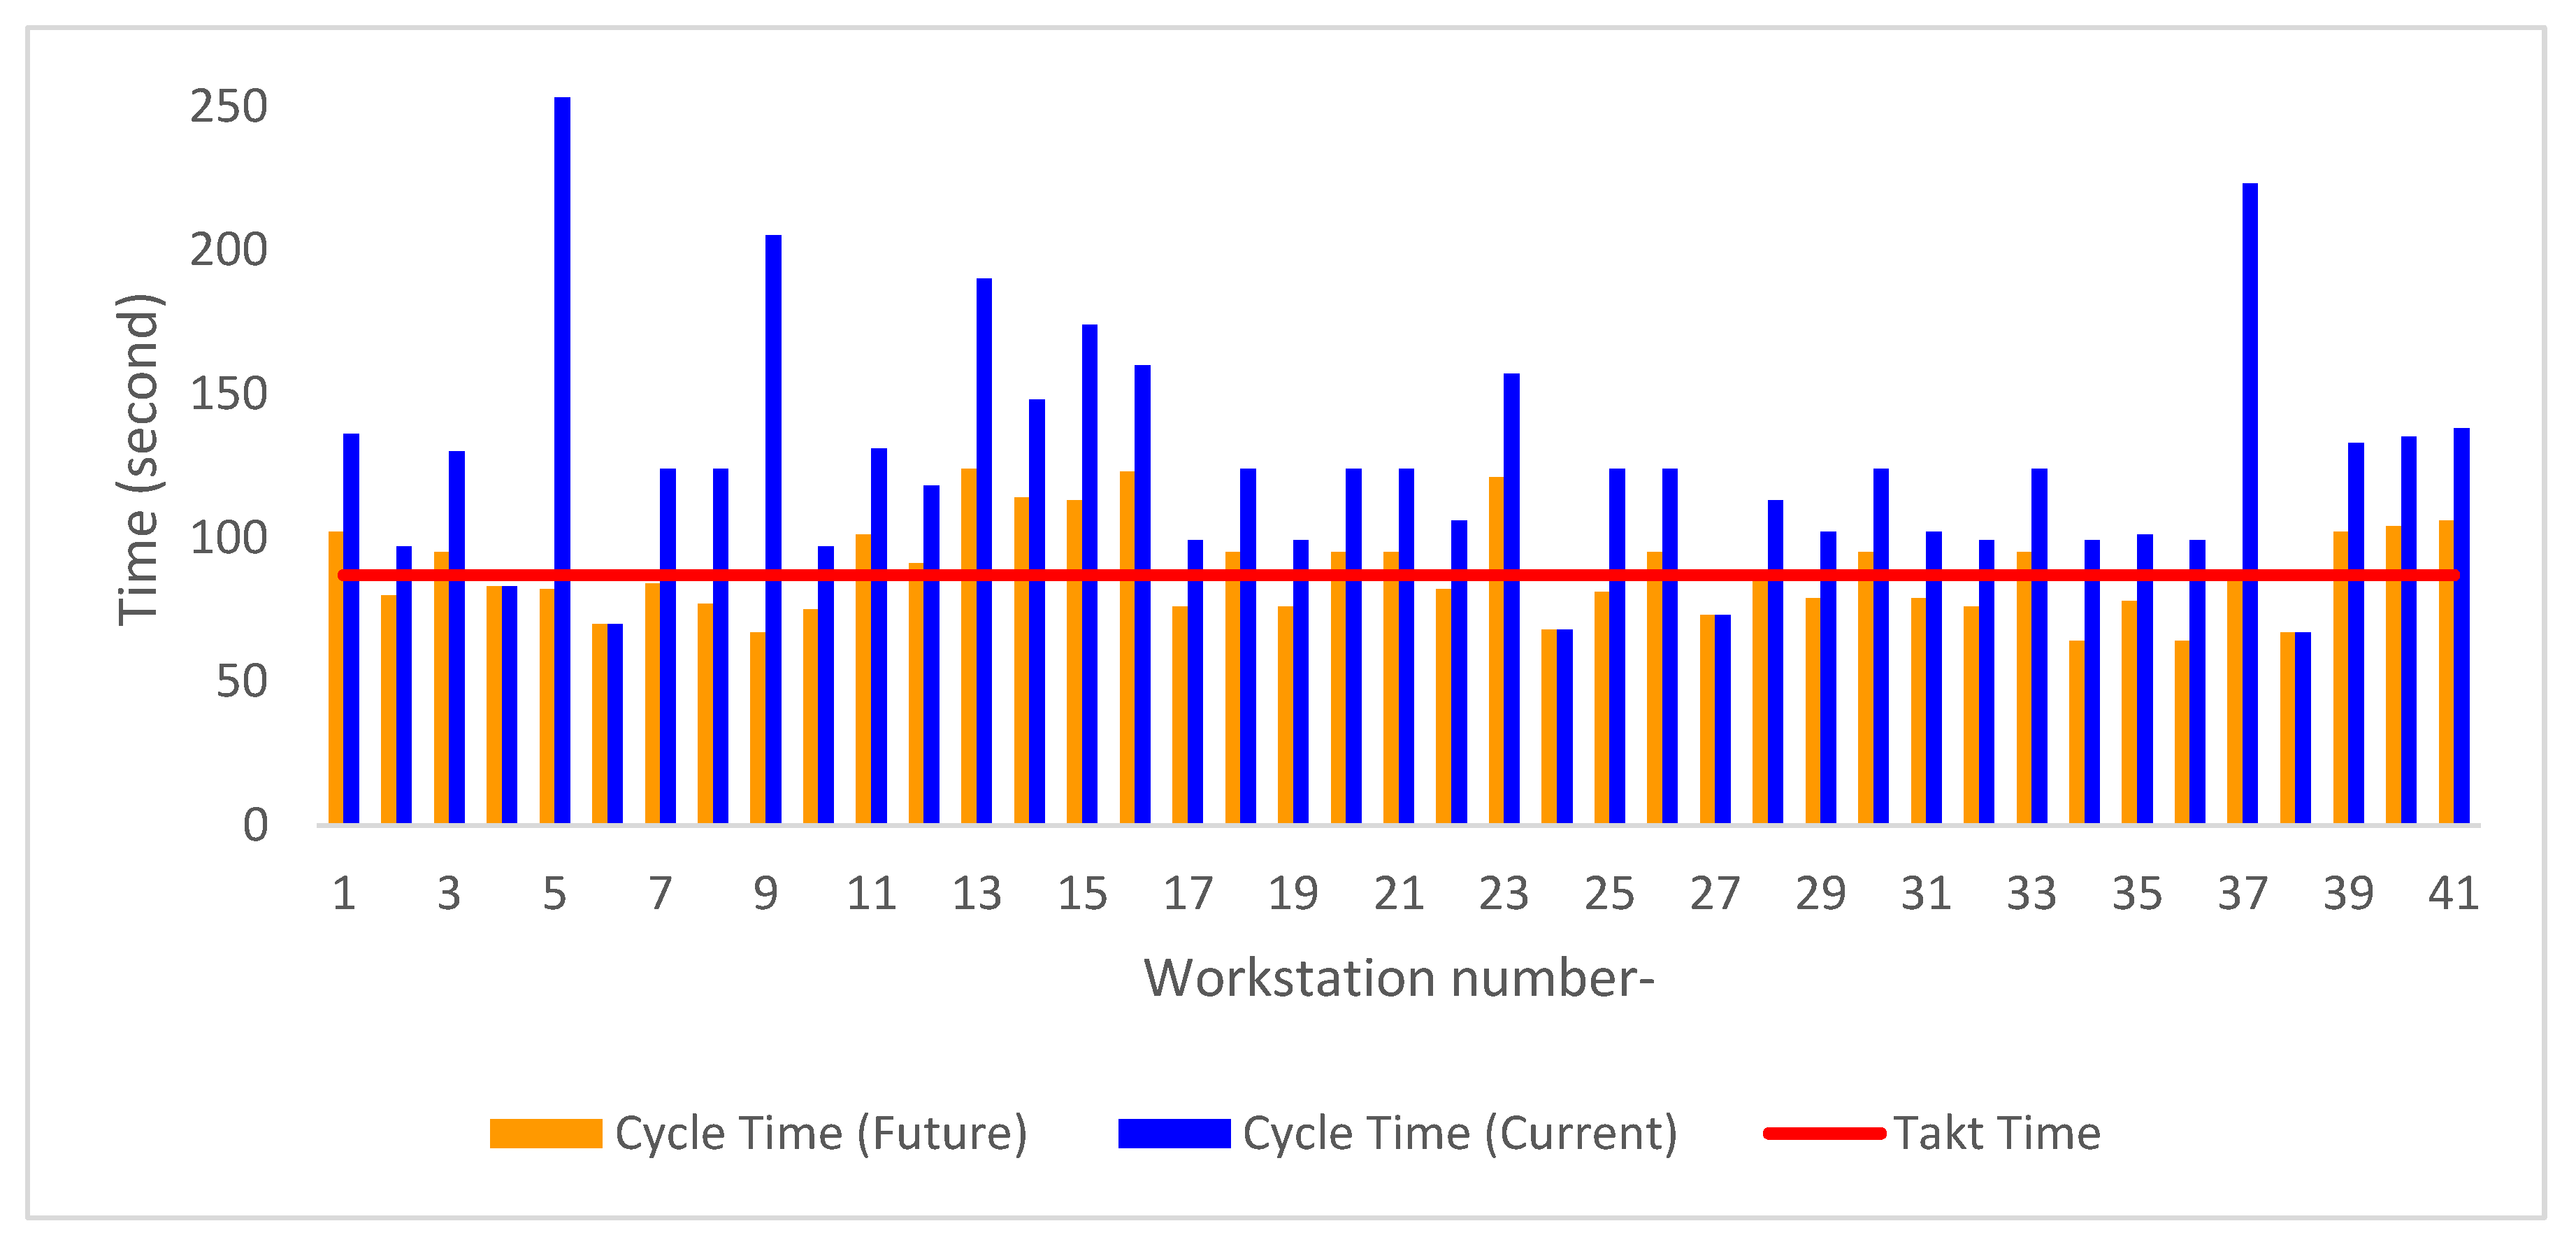
A comparison of the weapon assembly process’s cycle time before and after the implementation of VSM and RPW is illustrated in
Figure 13.
The implementation of VSM and RPW has resulted in a significant reduction in the cycle time of the weapon assembly process. This can be seen in the comparison chart in
Figure 13, where the total cycle time has decreased from 5121 s to 3620 s, which is a decrease of 29.3%. This reduction in the cycle time is higher compared to the results of similar research conducted by previous researchers who obtained a reduction of 20.8% and 31.7% by combining VSM with line balancing techniques [
29,
30]. This shows the effectiveness of combining VSM and RPW in improving productivity in the manufacturing industry by reducing the production cycle time. The comparison of performance indicators, including balance delay, line efficiency, and smoothness index, is shown in
Table 2.
The results of the application of VSM and RPW to the weapon assembly process are shown in
Table 2. It reveals that the performance of the process has improved, with an increase in the balance delay value from negative to positive, and a line efficiency value that does not exceed 100%. These improvements mean that it is now possible to meet the production target of 300 ARX per day, compared to the current conditions where it was not possible due to an excessive workload. Additionally, the smoothness index value being closer to 0 shows that the workload at each station is more evenly distributed after the improvements.
This study’s findings corroborate previous research in manufacturing processes, indicating that implementing lean tools such as VSM and line balancing techniques such as RPW can enhance a firm’s operational performance. For instance, this study aligns with previous research in the textile products industry, where the use of VSM reduced lead times significantly from 20 to three days [
31]. Similarly, a study in the wiring production process found that the use of lean tools, such as VMS, reduced cable-cutting processes by 14.9% and enhanced the work environment through broader work autonomy for employees [
32].
Prior studies have examined partial processes, and others have evaluated the entire process of implementing lean tools. Despite the varied implementation scope, previous studies show that VSM has the ability to reduce the lead time. For instance, a study conducted on gas turbine production found that improvements in the design phase could reduce the lead time by 50% [
2]. In the camshaft industry in India, the application of VSM increased on-time delivery by 15% [
33]. The efficiency improvement found in this study aligns with previous findings that RPW produces a balanced assembly line with a high line efficiency when there is no resource constraint at each workstation [
22].
Line balancing techniques such as RPW provide the best solution for various straight-line balancing issues [
18]. Additionally, previous studies suggest that the RPW method provides the best smoothness index value [
21]. The combination of lean techniques with line balancing techniques, as performed in this study, indicates that the combination of these tools is possible and useful for improving production performance. For example, the combination of VSM with RPW and work standardization can optimize the layout by reducing the number of workstations and the lead time [
30]. This combination has also been applied in the manufacture of bus bodies and can reduce the production cycle time by more than 10%. The results of these studies indicate that combining different methods can be useful for improving a firm’s production process performance.
7. Implication and Future Direction
Overall, the application of VSM and RPW has improved the performance of the weapon assembly process, as indicated by the comparison data of the performance indicators. Based on the conclusion that the application of VSM and RPW can improve the overall performance of the weapon assembly process, there are several conclusions that can be drawn. Academically, the combination of VSM and RPW can help to reduce the cycle time and improve the balance delay, line efficiency, and smoothness index of the weapon assembly process, leading to an increase in productivity. Practically, the improved weapon assembly process, such as the preparation of more ergonomic workstations, can help to improve the work conditions for assembly operators, leading to an increase in their efficiency. This can have a positive impact on employee morale and can contribute to a healthier and more productive work environment. Further, by minimizing waste due to transportation and excess inventory, practitioners can optimize the weapon assembly process, leading to better inventory management. This can help firms to reduce their inventory carrying costs, improve their cash flow, and minimize stockouts. By reducing excess inventory, practitioners can free up valuable warehouse space, which can be used for other purposes. Finally, the application of VSM and RPW can help firms to become more competitive in the marketplace. By improving productivity, work conditions, and inventory management, firms can offer better products at a lower cost. This can help them to increase their market share, attract more customers, and ultimately increase their profitability.
The limitations of this study suggest future research directions to further improve and expand the results. The current research was conducted in a specific context and for a specific assembly process. In addition, the study only evaluated the changes in performance indicators after the implementation of VSM and RPW, without further exploring the long-term effects or sustainability of these improvements. Another limitation of the study is that it only used quantitative data and did not include qualitative data to provide more in-depth insights into the improvement process. Considering these limitations, future research could focus on exploring other areas of the weapon assembly process to identify and minimize waste, evaluating the long-term effects and sustainability of the improvements, and incorporating both quantitative and qualitative data to provide a more comprehensive understanding of the improvement process. It is also important to evaluate the scalability of the VSM and RPW method to other types of manufacturing processes, and to understand how these techniques can be best implemented in practice to achieve continuous improvement.
Author Contributions
Conceptualization, F.A., B.H. and A.Y.; methodology, F.A., B.H. and A.Y.; software, F.A.; formal analysis, F.A.; writing—original draft preparation, F.A. and B.H.; Writing—Review and Editing, B.H., supervision, B.H. and A.Y. All authors have read and agreed to the published version of the manuscript.
Funding
This research received no external funding and the APC was funded by UNIVERSITAS PADJADJARAN.
Institutional Review Board Statement
Not applicable.
Informed Consent Statement
Not applicable.
Data Availability Statement
Data sharing is not applicable to this article due to confidentiality.
Conflicts of Interest
The authors declare no conflict of interest.
References
- Pavnaskar, S.J.; Gershenson, J.K.; Jambekar, A.B. Classification Scheme for Lean Manufacturing Tools. Int. J. Prod. Res. 2003, 41, 3075–3090. [Google Scholar] [CrossRef]
- Tyagi, S.; Choudhary, A.; Cai, X.; Yang, K. Value Stream Mapping to Reduce the Lead-Time of A Product Development Process. Int. J. Prod. Econ. 2015, 160, 202–212. [Google Scholar] [CrossRef]
- Fathi, M.; Fontes, D.B.; Urenda Moris, M.; Ghobakhloo, M. Assembly Line Balancing Problem: A Comparative Evaluation of Heuristics and A Computational Assessment of Objectives. J. Model. Manag. 2018, 13, 455–474. [Google Scholar] [CrossRef]
- Achmadi, F.; Harsanto, B.; Yunani, A. Analisis Cycle Time Proses Perakitan Senjata Di PT Pindad (Persero). J. Oper. Excell. J. Appl. Ind. Eng. 2021, 13, 159–168. [Google Scholar] [CrossRef]
- van Teijlingen, E.R.; Hundley, V. The Importance of Pilot Study. Soc. Res. Update 2001, 35, 1–4. [Google Scholar]
- Harsanto, B.; Michaelides, R.; Drummond, H. Sustainability-Oriented Innovation (SOI) in Emerging Economies: A Preliminary Investigation from Indonesia. In Proceedings of the 2018 IEEE International Conference on Industrial Engineering and Engineering Management (IEEM), Bangkok, Thailand, 16–19 December 2018; IEEE: Bangkok, Thailand, 2018; pp. 1553–1557. [Google Scholar]
- Wemmerlöv, U. Assemble-to-Order Manufacturing: Implications for Materials Management. J. Oper. Manag. 1984, 4, 347–368. [Google Scholar] [CrossRef]
- Hu, S.J.; Ko, J.; Weyand, L.; ElMaraghy, H.A.; Lien, T.K.; Koren, Y.; Bley, H.; Chryssolouris, G.; Nasr, N.; Shpitalni, M. Assembly System Design and Operations for Product Variety. CIRP Ann. 2011, 60, 715–733. [Google Scholar] [CrossRef]
- Harsanto, B. Dasar-Dasar Manajemen Operasi: Konsep, Batang Tubuh Ilmu Dan Industri 4.0; Prenada Media: East Jakarta, Indonesia, 2022. [Google Scholar]
- van Hoek, R. Postponed Manufacturing: A Case Study in the Food Supply Chain. Supply Chain. Manag. Int. J. 1997, 2, 63–75. [Google Scholar] [CrossRef]
- Seth, D.; Gupta, V. Application of Value Stream Mapping for Lean Operations and Cycle Time Reduction: An Indian Case Study. Prod. Plan. Control 2005, 16, 44–59. [Google Scholar] [CrossRef]
- Azizi, A.; Manoharan, T.a/p. Designing a Future Value Stream Mapping to Reduce Lead Time Using SMED-A Case Study. Procedia Manuf. 2015, 2, 153–158. [Google Scholar] [CrossRef]
- de Guimarães, L.A.; Jardim, E.G.M.; Guimarães Marujo, L. Value Stream Mapping from the Customer’s Perspective: Expanding Concepts, Representations and Key Performance Indicators Based on a Typical Real Case Study. Int. J. Lean Six Sigma 2022, 14, 429–450. [Google Scholar] [CrossRef]
- Harsanto, B. The First-Three-Month Review of Research on COVID-19: A Scientometrics Analysis. In Proceedings of the IEEE International Conference on Engineering, Technology and Innovation (ICE/ITMC), Cardiff, UK, 21–23 June 2020. [Google Scholar]
- Huang, Z.; Kim, J.; Sadri, A.; Dowey, S.; Dargusch, M.S. Industry 4.0: Development of a Multi-Agent System for Dynamic Value Stream Mapping in SMEs. J. Manuf. Syst. 2019, 52, 1–12. [Google Scholar] [CrossRef]
- Harsanto, B.; Permana, C.T. Sustainability-Oriented Innovation (SOI) in the Cultural Village: An Actor-Network Perspective in the Case of Laweyan Batik Village. J. Cult. Herit. Manag. Sustain. Dev. 2021, 11, 297–311. [Google Scholar] [CrossRef]
- Azis, Y.; Darun, M.R.; Kartini, D.; Bernik, M.; Harsanto, B. A Model of Managing Innovation of SMEs in Indonesia Creative Industries. Int. J. Bus. Soc. 2017, 18, 391–408. [Google Scholar]
- Tomar, A.; Manoria, A. Increasing Line Efficiency with COMSOAL, RPW and LCR Methods of Assembly Line Balancing Problem. Int. J. Softw. Hardw. Res. Eng. 2016, 4, 23–27. [Google Scholar]
- Gumbira, G.; Harsanto, B. Decision Support System for an Eco-Friendly Integrated Coastal Zone Management (ICZM) in Indonesia. Int. J. Adv. Sci. Eng. Inf. Technol. 2019, 9, 1177–1182. [Google Scholar] [CrossRef]
- Salvador, R.; Barros, M.V.; dos Santos, G.E.T.; van Mierlo, K.G.; Piekarski, C.M.; de Francisco, A.C. Towards a Green and Fast Production System: Integrating Life Cycle Assessment and Value Stream Mapping for Decision Making. Environ. Impact. Assess. Rev. 2021, 87, 106519. [Google Scholar] [CrossRef]
- Azwir, H.H.; Pratomo, H.W. Implementasi Line Balancing Untuk Peningkatan Efisiensi Di Line Welding Studi Kasus: PT X. J. Rekayasa Sist. Ind. 2017, 6, 57. [Google Scholar] [CrossRef]
- Bongomin, O.; Mwasiagi, J.I.; Nganyi, E.O.; Nibikora, I. Improvement of Garment Assembly Line Efficiency Using Line Balancing Technique. Eng. Rep. 2020, 2, e12157. [Google Scholar] [CrossRef]
- Mekong, C. Introduction to Lean Manufacturing for Vietnam; Mekong Capital Ltd.: Ho Chi Minh City, Vietnam, 2004. [Google Scholar]
- Prayudha, A.N.; Harsanto, B. Measuring Service Quality in Hotel X Bandung. In Proceedings of the ISTMET 2014—1st International Symposium on Technology Management and Emerging Technologies, Bandung, Indonesia, 27–29 May 2014; Volume 1, pp. 230–234. [Google Scholar]
- Usman, A.; Azis, Y.; Harsanto, B.; Azis, A.M. Airport Service Quality Dimension and Measurement: A Systematic Literature Review and Future Research Agenda. Int. J. Qual. Reliab. Manag. 2021, 39, 2302–2322. [Google Scholar] [CrossRef]
- Kumar Chakrabortty, R.; Kumar Paul, S. Study and Implementation of Lean Manufacturing in a Garment Manufacturing Company: Bangladesh Perspective. J. Optim. Ind. Eng. 2011, 4, 11–22. [Google Scholar]
- Venkataraman, K.; Ramnath, B.V.; Kumar, V.M.; Elanchezhian, C. Application of Value Stream Mapping for Reduction of Cycle Time in a Machining Process. Procedia Mater. Sci. 2014, 6, 1187–1196. [Google Scholar] [CrossRef]
- Rexroth Bosch Group. Ergonomics Guidebook for Manual Production Systems; Rexroth Bosch Group: Stuttgart, Germany, 2012. [Google Scholar]
- Ayu, F.T.B. Rekayasa Perbaikan Proses Produksi Boneka Dengan Integrasi Metode Line Balancing Dan Value Stream Mapping. Oper. Excell. J. Appl. Ind. Eng. 2018, 10, 294. [Google Scholar] [CrossRef]
- Nallusamy, S.; Saravanan, V. Enhancement of Overall Output in a Small Scale Industry through VSM, Line Balancing and Work Standardization. Int. J. Eng. Res. Afr. 2016, 26, 176–183. [Google Scholar] [CrossRef]
- Suhardi, B.; Hermas Putri KS, M.; Jauhari, W.A. Implementation of Value Stream Mapping to Reduce Waste in a Textile Products Industry. Cogent. Eng. 2020, 7, 1842148. [Google Scholar] [CrossRef]
- Pena, R.; Ferreira, L.P.; Silva, F.J.G.; Sá, J.C.; Fernandes, N.O.; Pereira, T. Lean Manufacturing Applied to A Wiring Production Process. Procedia Manuf. 2020, 51, 1387–1394. [Google Scholar] [CrossRef]
- Vinodh, S.; Arvind, K.R.; Somanaathan, M. Application of Value Stream Mapping in an Indian Camshaft Manufacturing Organisation. J. Manuf. Technol. Manag. 2010, 21, 888–900. [Google Scholar] [CrossRef]
| Disclaimer/Publisher’s Note: The statements, opinions and data contained in all publications are solely those of the individual author(s) and contributor(s) and not of MDPI and/or the editor(s). MDPI and/or the editor(s) disclaim responsibility for any injury to people or property resulting from any ideas, methods, instructions or products referred to in the content. |
© 2023 by the authors. Licensee MDPI, Basel, Switzerland. This article is an open access article distributed under the terms and conditions of the Creative Commons Attribution (CC BY) license (https://creativecommons.org/licenses/by/4.0/).


