
The Impact of Capital Structure on the Profitability Performance of ICT Firms


Abstract
:1. Introduction
- Leverage affects the FV of an ICT company.
- Liquidity affects the FV of an ICT company.
- The FV of an ICT company varies according to firm size.
2. Literature Review
2.1. Determinants of Capital Structure
2.1.1. Firm Size
2.1.2. Leverage
2.1.3. Liquidity
2.2. Profitability Efficiency
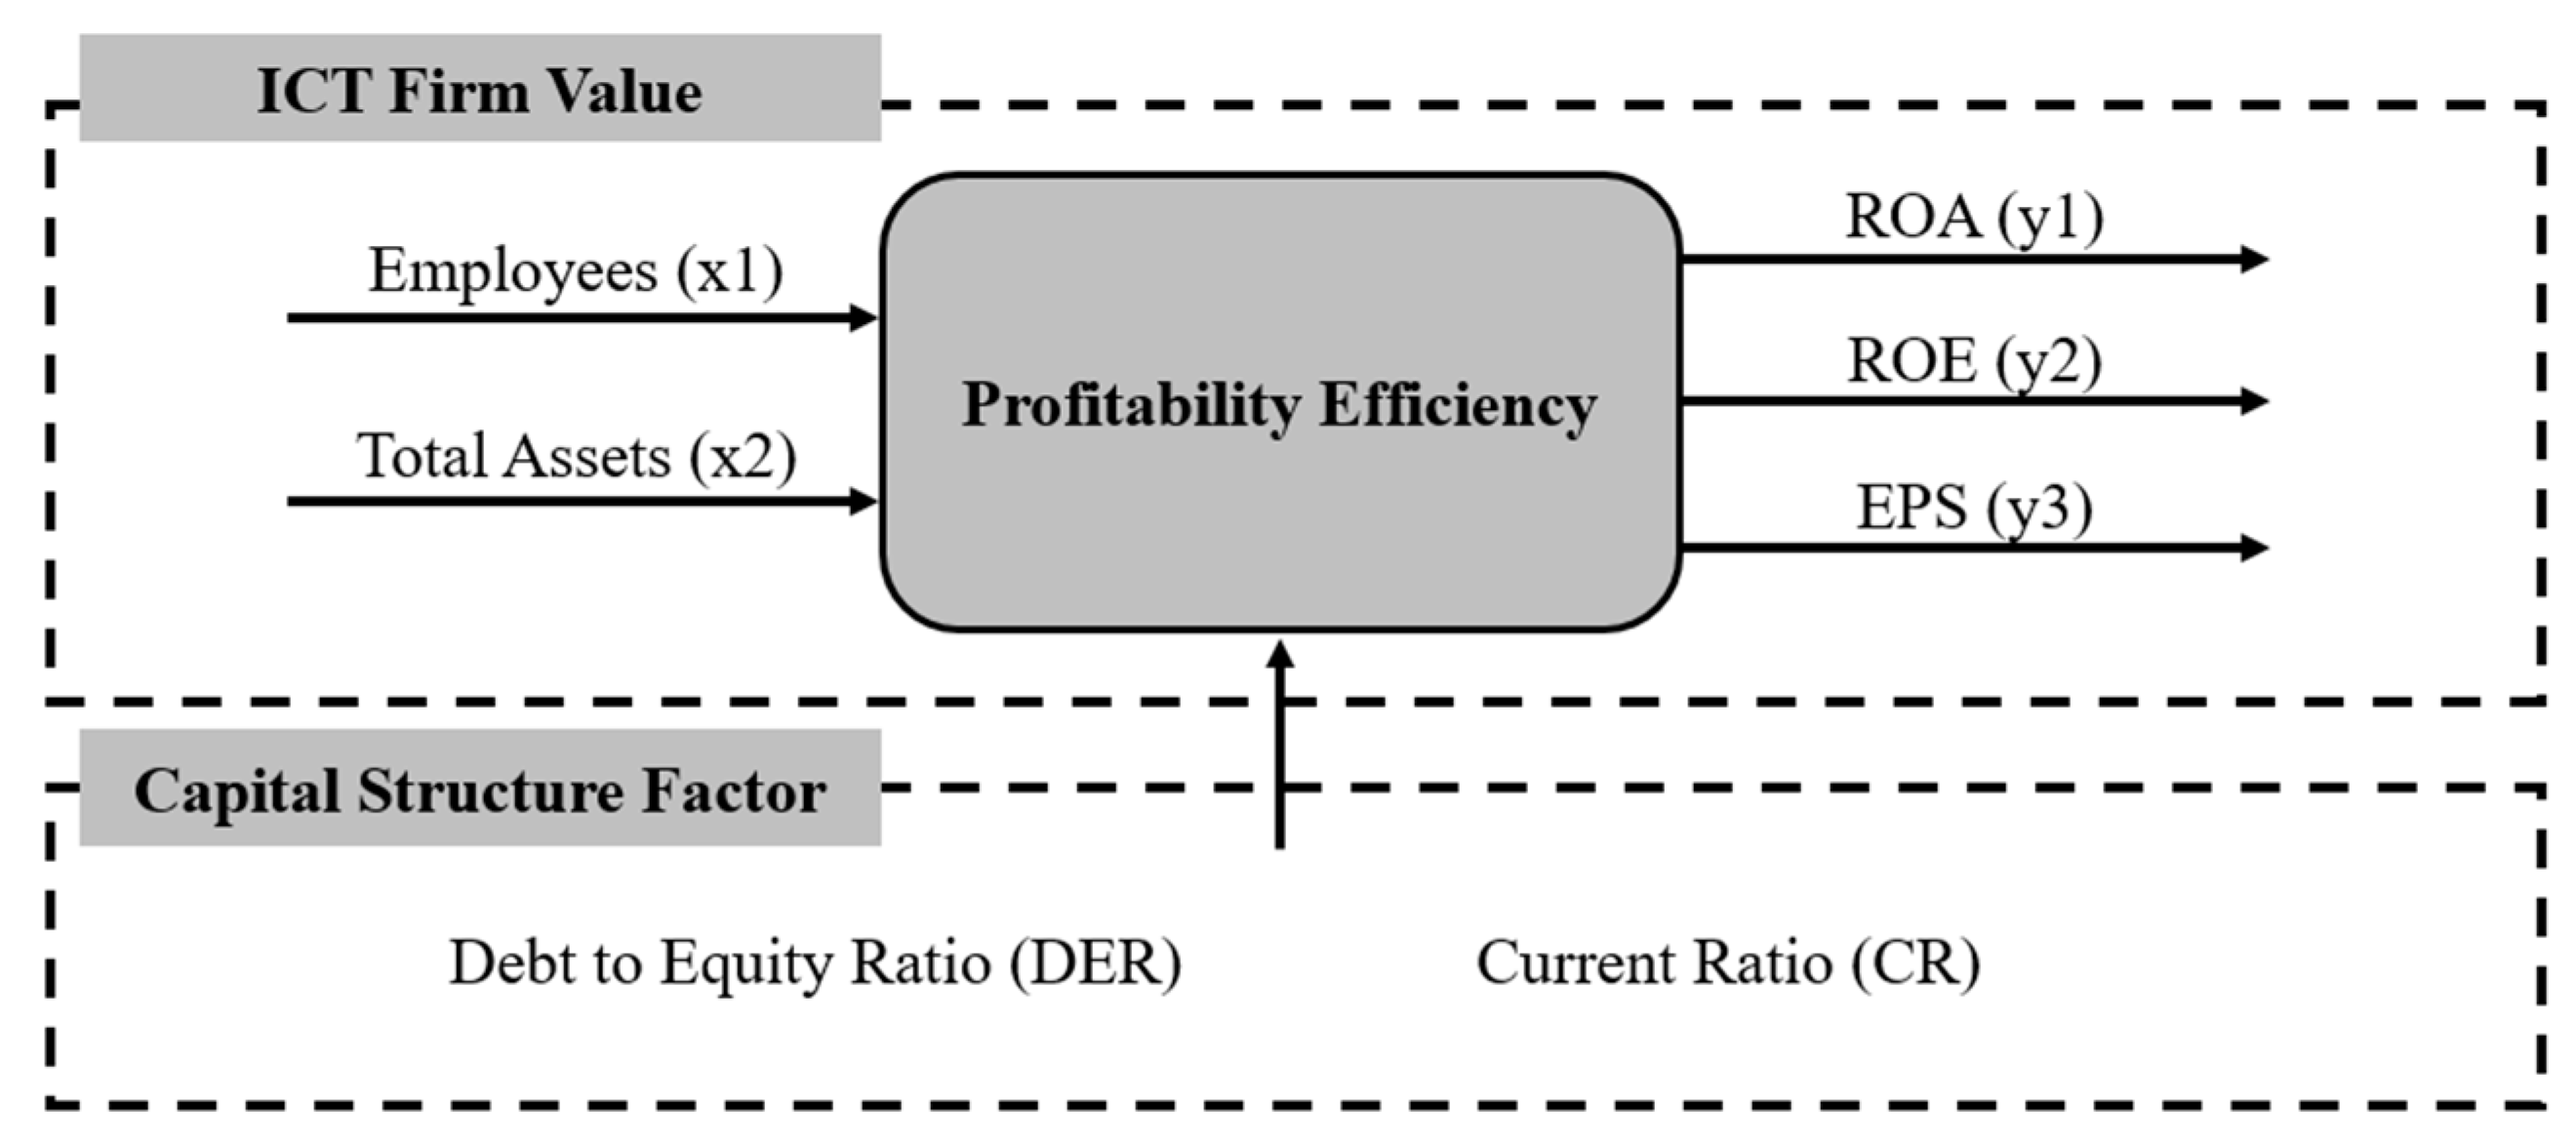
3. Methodology
3.1. Efficiency Evalutaion
3.2. Data
3.3. Research Model
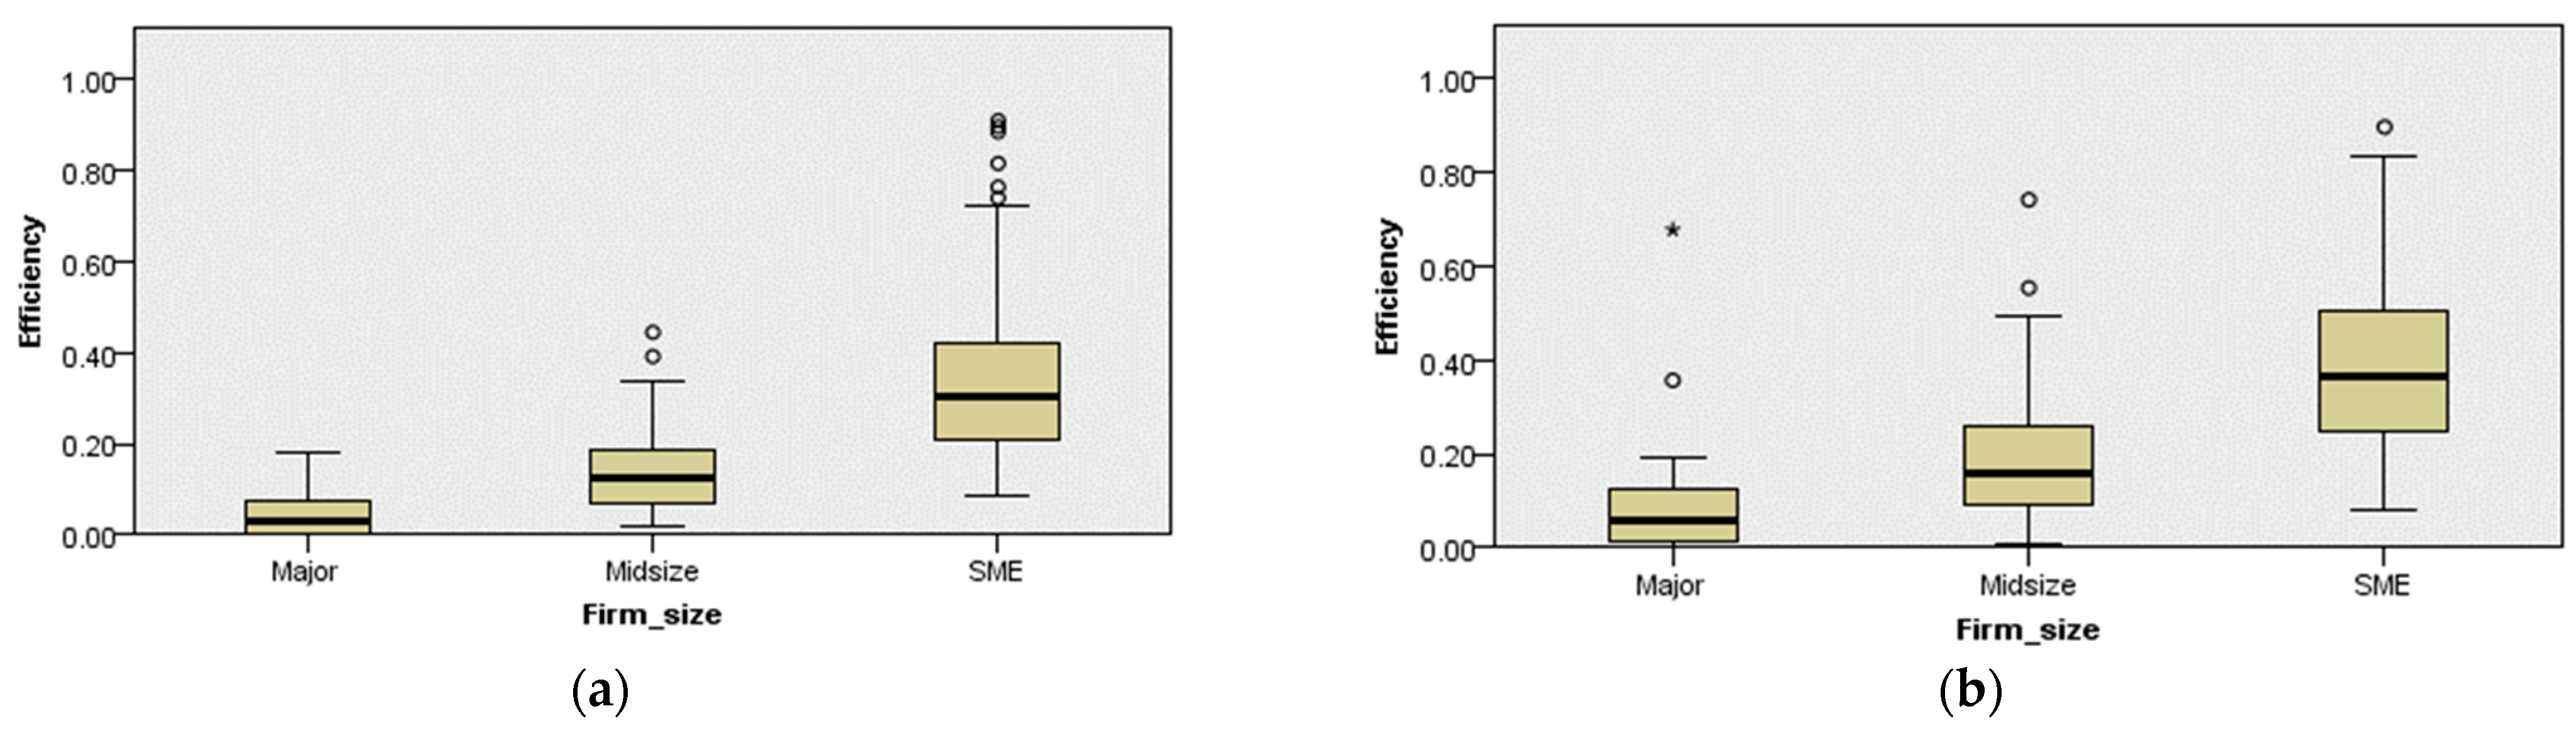
4. Results
4.1. Kruskal-Wallis One-Way ANOVA Results
4.2. Tobit Regression Results
5. Discussion
6. Conclusions
7. Limitations and Future Research
Author Contributions
Funding
Institutional Review Board Statement
Informed Consent Statement
Data Availability Statement
Conflicts of Interest
References
- Hoe, L.W.; Siew, L.W.; Fai, L.K. Improvement on the efficiency of technology companies in Malaysia with Data Envelopment Analysis model. In International Visual Informatics Conference; Springer: Cham, Switzerland, 2017; pp. 19–30. [Google Scholar]
- Husna, A.; Satria, I. Effects of return on asset, debt to asset ratio, current ratio, firm size, and dividend payout ratio on firm value. Int. J. Econ. Financ. Issues 2019, 9, 50. [Google Scholar] [CrossRef] [Green Version]
- Barney, J. Firm resources and sustained competitive advantage. J. Manag. 1991, 17, 99–120. [Google Scholar] [CrossRef]
- Zeb, S.; Rashid, A. Impact of Financial Health and Capital Structure on Firm’s Value, with Moderating Role of Intangible Assets. Glob. Manag. J. Acad. Corp. Stud. 2016, 6, 37. [Google Scholar]
- Abid, F.; Mseddi, S. The impact of operating and financial leverages and intrinsic business risk on firm value. 2004. Available online: https://papers.ssrn.com/sol3/papers.cfm?abstract_id=942029 (accessed on 3 November 2022).
- Bandanuji, A.; Khoiruddin, M. The Effect of Business Risk and Firm Size on Firm Value with Debt Policy as Intervening Variable. Manag. Anal. J. 2020, 9, 200–210. [Google Scholar] [CrossRef]
- Abdullah, M.H.S.B.; Janor, H.; Hamid, M.A.; Yatim, P. The Effect of Enterprise Risk Management on Firm Value: Evidence from Malaysian Technology Firms. J. Pengur. 2017, 49, 3–11. [Google Scholar] [CrossRef]
- Lin, Y.; Wen, M.M.; Yu, J. Enterprise risk management: Strategic antecedents, risk integration, and performance. North Am. Actuar. J. 2012, 16, 1–28. [Google Scholar] [CrossRef]
- Khanh, V.; Hung, D.; Van, V.; Huyen, H. A study on the effect of corporate governance and capital structure on firm value in Vietnam. Accounting 2020, 6, 221–230. [Google Scholar] [CrossRef]
- Canarella, G.; Miller, S.M. Determinants of optimal capital structure and speed of adjustment: Evidence from the US ICT sector. 2019. Available online: https://papers.ssrn.com/sol3/papers.cfm?abstract_id=3354975 (accessed on 3 November 2022).
- Singh, A.K.; Bansal, P. Impact of financial leverage on firm’s performance and valuation: A panel data analysis. Indian J. Account. 2016, 2, 73–80. [Google Scholar]
- Modigliani, F.; Miller, M.H. The cost of capital, corporation finance and the theory of investment. Am. Econ. Rev. 1958, 48, 261–297. [Google Scholar]
- Walter, J.E. Dividend policy: Its influence on the value of the enterprise. J. Financ. 1963, 18, 280–291. [Google Scholar] [CrossRef]
- Warner, J. Bankruptcy costs: Some evidence. J. Financ. 1977, 32, 337–347. [Google Scholar] [CrossRef]
- Myers, S.C. Determinants of corporate borrowing. J. Financ. Econ. 1977, 5, 147–175. [Google Scholar] [CrossRef] [Green Version]
- Deangelo, H.; Masulis, R. Optimal capital structure under corporate and personal taxation. J. Financ. Econ. 1980, 8, 3–29. [Google Scholar] [CrossRef]
- Cuong, N.T.; Canh, N.T. The effect of capital structure on firm value for Vietnam’s seafood processing enterprises. Int. Res. J. Financ. Econ. 2012, 89, 221–233. [Google Scholar]
- Ayaz, M.; Zabri, S.M.; Ahmad, K. An empirical investigation on the impact of capital structure on firm performance: Evidence from Malaysia. Manag. Financ. 2021, 47, 1107–1127. [Google Scholar] [CrossRef]
- Aggarwal, D.; Padhan, P.C. Impact of capital structure on firm value: Evidence from Indian hospitality industry. Theor. Econ. Lett. 2017, 7, 982–1000. [Google Scholar] [CrossRef] [Green Version]
- Jensen, M.C.; Meckling, W.H. Theory of the firm: Managerial behavior, agency costs and ownership structure. J. Financ. Econ. 1976, 3, 305–360. [Google Scholar] [CrossRef]
- Jensen, M.C. Agency costs of free cash flow, corporate finance, and takeovers. Am. Econ. Rev. 1986, 76, 323–329. [Google Scholar]
- Carter, D.A.; Rogers, D.A.; Simkins, B.J. Hedging and value in the US airline industry. J. Appl. Corp. Financ. 2006, 18, 21–33. [Google Scholar] [CrossRef]
- Tahir, I.M.; Razali, A.R. The relationship between enterprise risk management (ERM) and firm value: Evidence from Malaysian public listed companies. Int. J. Econ. Manag. Sci. 2011, 1, 32–41. [Google Scholar]
- Majumdar, S.K. The impact of size and age on firm-level performance: Some evidence from India. Rev. Ind. Organ. 1997, 12, 231–241. [Google Scholar] [CrossRef]
- Jin, Y.; Jorion, P. Firm value and hedging: Evidence from US oil and gas producers. J. Financ. 2006, 61, 893–919. [Google Scholar] [CrossRef]
- Beasley, M.; Pagach, D.; Warr, R. Information conveyed in hiring announcements of senior executives overseeing enterprise-wide risk management processes. J. Account. Audit. Financ. 2008, 23, 311–332. [Google Scholar] [CrossRef]
- Hoyt, R.E.; Liebenberg, A.P. The value of enterprise risk management. J. Risk Insur. 2011, 78, 795–822. [Google Scholar] [CrossRef]
- McShane, M.K.; Nair, A.; Rustambekov, E. Does enterprise risk management increase firm value? J. Account. Audit. Financ. 2011, 26, 641–658. [Google Scholar] [CrossRef]
- Smith, C.W.; Stulz, R.M. The determinants of firms’ hedging policies. J. Financ. Quant. Anal. 1985, 20, 391–405. [Google Scholar] [CrossRef]
- Eng, T.Y.; Spickett-Jones, J.G. An investigation of marketing capabilities and upgrading performance of manufacturers in mainland China and Hong Kong. J. World Bus. 2009, 44, 463–475. [Google Scholar] [CrossRef]
- Mutmainah, M. Analisis good corporate governance terhadap nilai Perusahaan. E-J. Stiedewantara 2015, 10, 182–195. [Google Scholar] [CrossRef]
- Nur’ainy, R.; Nurcahyo, B.; Sri Kurniasih, A.; Sugiharti, B. Implementation of good corporate governance and its impact on corporate performance: The mediation role of firm size (empirical study from Indonesia). Glob. Bus. Manag. Res. 2013, 5, 91–104. [Google Scholar]
- Vatansever, M.; Hepsen, A. Determining impacts on non-performing loan ratio in Turkey. J. Financ. Invest. Anal. 2013, 2, 119–129. [Google Scholar]
- Creamer, G.G.; Freund, Y. Predicting performance and quantifying corporate governance risk for Latin American ADRS and banks. In Financial Engineering and Applications; MIT: Cambridge, MA, USA, 2004. [Google Scholar]
- Kapelko, M.; Oude Lansink, A. Examining the relation between intangible assets and technical efficiency in the international textile and clothing industry. J. Text. Inst. 2013, 105, 491–501. [Google Scholar] [CrossRef]
- Dybvig, P.H.; Warachka, M. Tobin’s Q does not measure firm performance: Theory, empirics, and alternative measures. 2012. Available online: https://ifs.swufe.edu.cn/__local/0/EA/7E/8DE64F39E48112F72EF8F40A62A_0D48ACB5_30C7E.pdf (accessed on 4 November 2022).
- Munari, F.; Oriani, R. Privatization and R&D performance: An empirical analysis based on Tobin’s Q. 2002. Available online: https://papers.ssrn.com/sol3/papers.cfm?abstract_id=331720 (accessed on 4 November 2022).
- Montgomery, C.A.; Wernerfelt, B. Diversification, Ricardian rents, and Tobin’s Q. Rand J. Econ. 1988, 19, 623–632. [Google Scholar] [CrossRef] [Green Version]
- Anderson, E.W.; Fornell, C.; Mazvanchery, S.K. Customer satisfaction and shareholder value. J. Mark. 2004, 68, 172–185. [Google Scholar] [CrossRef]
- Sueyoshi, T.; Goto, M. A use of DEA–DA to measure importance of R&D expenditure in Japanese information technology industry. Decis. Support Syst. 2013, 54, 941–952. [Google Scholar]
- Le, T.P.V.; Phan, T.B.N. Capital structure and firm performance: Empirical evidence from a small transition country. Res. Int. Bus. Financ. 2017, 42, 710–726. [Google Scholar] [CrossRef]
- King, S.F.; Liou, J.S. A framework for internet channel evaluation. Int. J. Inf. Manag. 2004, 24, 473–488. [Google Scholar] [CrossRef]
- Tu, H.J. Performance implications of internet channels in financial services: A comprehensive perspective. Electron. Mark. 2012, 22, 243–254. [Google Scholar] [CrossRef]
- Arbelo, A.; Arbelo-Pérez, M.; Pérez-Gómez, P. Profit efficiency as a measure of performance and frontier models: A resource-based view. BRQ Bus. Res. Q. 2021, 24, 143–159. [Google Scholar] [CrossRef]
- He, F.; Chen, R. Innovation, firm efficiency and firm value: Firm-level evidence in Japanese electricity machinery industry. In Proceedings of the 2007 International Conference on Wireless Communications, Networking and Mobile Computing, Honolulu, HI, USA, 12–16 August 2007; pp. 4217–4220. [Google Scholar]
- Allayannis, G.; Weston, J.P. The use of foreign currency derivatives and firm market value. Rev. Financ. Stud. 2001, 14, 243–276. [Google Scholar] [CrossRef]
- Modigliani, F.; Miller, M.H. Corporate income taxes and the cost of capital: A correction. Am. Econ. Rev. 1963, 53, 433–443. [Google Scholar]
- Razali, A.R.; Tahir, I.M. The determinants of enterprise risk management (ERM) practices in Malaysian public listed companies. J. Soc. Dev. Sci. 2011, 1, 202–207. [Google Scholar] [CrossRef] [Green Version]
- Barth, M.E.; Landsman, W.R. How did financial reporting contribute to the financial crisis? Eur. Account. Rev. 2010, 19, 399–423. [Google Scholar] [CrossRef]
- Muthoni, J.; Shimelis, H.; Melis, R. Potato production in Kenya: Farming systems and production constraints. J. Agric. Sci. 2013, 5, 182. [Google Scholar] [CrossRef]
- Luo, X. Evaluating the profitability and marketability efficiency of large banks: An application of data envelopment analysis. J. Bus. Res. 2003, 56, 627–635. [Google Scholar] [CrossRef]
- Wen, H.J.; Lim, B.; Huang, H.L. Measuring e-commerce efficiency: A data envelopment analysis (DEA) approach. Ind. Manag. Data Syst. 2003, 103, 703–710. [Google Scholar] [CrossRef]
- Ravanshad, M.R.; Amiri, A.; Salari, H.; Khodadadi, D. Application of the two-stage DEA model for evaluating the efficiency and investigating the relationship between managerial ability and firm performance. Adv. Math. Financ. Appl. 2020, 5, 229–245. [Google Scholar]
- Halkos, G.E.; Salamouris, D.S. Efficiency measurement of the Greek commercial banks with the use of financial ratios: A data envelopment analysis approach. Manag. Account. Res. 2004, 15, 201–224. [Google Scholar] [CrossRef]
- Feroz, E.H.; Kim, S.; Raab, R.L. Financial statement analysis: A data envelopment analysis approach. J. Oper. Res. Soc. 2003, 54, 48–58. [Google Scholar] [CrossRef]
- Yu, Y.S.; Barros, A.; Wu, W.H. Data envelopment analysis and financial ratio: A new approach to estimate the efficiency of Taiwan computer’s peripheral industry. J. Inf. Optim. Sci. 2013, 34, 69–84. [Google Scholar] [CrossRef]
- Seiford, L.M.; Zhu, J. Profitability and marketability of the top 55 U.S. commercial banks. Manag. Sci. 1999, 45, 1270–1288. [Google Scholar] [CrossRef] [Green Version]
- Zhu, J. Multi-factor performance measure model with an application to Fortune 500 companies. Eur. J. Oper. Res. 2000, 123, 105–124. [Google Scholar] [CrossRef]
- Charnes, A.; Cooper, W.W.; Rhodes, E. Measuring the efficiency of decision making units. Eur. J. Oper. Res. 1978, 2, 429–444. [Google Scholar] [CrossRef]
- Banker, R.D.; Charnes, A.; Cooper, W.W. Some models for estimating technical and scale inefficiencies in data envelopment analysis. Manag. Sci. 1984, 30, 1078–1092. [Google Scholar] [CrossRef] [Green Version]
- Simar, L.; Wilson, P.W. Sensitivity analysis of efficiency scores: How to bootstrap in nonparametric frontier models. Manag. Sci. 1998, 44, 49–61. [Google Scholar] [CrossRef] [Green Version]
- Simar, L.; Wilson, P.W. A general methodology for bootstrapping in non-parametric frontier models. J. Appl. Stat. 2000, 27, 779–802. [Google Scholar] [CrossRef]
- Kneip, A.; Simar, L.; Wilson, P.W. Asymptotics and consistent bootstraps for DEA estimators in nonparametric frontier models. Econom. Theory 2008, 24, 1663–1697. [Google Scholar] [CrossRef] [Green Version]
- Crane, A.D.; Michenaud, S.; Weston, J.P. The effect of institutional ownership on payout policy: Evidence from index thresholds. Rev. Financ. Stud. 2016, 29, 1377–1408. [Google Scholar] [CrossRef]
- López, F.J.; Ho, J.C.; Ruiz-Torres, A.J. A computational analysis of the impact of correlation and data translation on DEA efficiency scores. J. Ind. Prod. Eng. 2016, 33, 192–204. [Google Scholar] [CrossRef]
- Cheng, M.C.; Tzeng, Z.C. The effect of leverage on firm value and how the firm financial quality influence on this effect. World J. Manag. 2011, 3, 30–53. [Google Scholar]
- Hadinugroho, B.; Haryono, T.; Payamta; Trinugroho, I. Leverage, firm value and competitive strategy: Evidence from Indonesia. Int. J. Econ. Policy Emerg. Econ. 2018, 11, 487–508. [Google Scholar] [CrossRef]
- Fender, I.; Lewrick, U. Calibrating the leverage ratio. In BIS Quarterly Review; Bank for International Settlements (BIS): Basel, Switzerland, 2015. [Google Scholar]
- Kartikasari, D.; Merianti, M. The effect of leverage and firm size to profitability of public manufacturing companies in Indonesia. Int. J. Econ. Financ. Issues 2016, 6, 409–413. [Google Scholar]
- Abor, J. The effect of capital structure on profitability: An empirical analysis of listed firms in Ghana. J. Risk Financ. 2005, 6, 438–445. [Google Scholar] [CrossRef]
- Gill, A.; Biger, N.; Mathur, N. The effect of capital structure on profitability: Evidence from the United States. International J. Manag. 2011, 28, 3. [Google Scholar]
- O’Donnell, C.J.; Rao, D.S.; Battese, G.E. Metafrontier frameworks for the study of firm-level efficiencies and technology ratios. Empir. Econ. 2008, 34, 231–255. [Google Scholar] [CrossRef]
- Avkiran, N.K.; Tone, K.; Tsutsui, M. Bridging radial and non-radial measures of efficiency in DEA. Ann. Oper. Res. 2008, 164, 127–138. [Google Scholar] [CrossRef]
- Kedzior, M.; Grabinska, B.; Grabinski, K.; Kedzior, D. Capital structure choices in technology firms: Empirical results from Polish listed companies. J. Risk Financ. Manag. 2020, 13, 221. [Google Scholar] [CrossRef]
- Minola, T.; Cassia, L.; Criaco, G. Financing patterns in new technology-based firms: An extension of the pecking order theory. Int. J. Entrep. Small Bus. 2013, 19, 212–233. [Google Scholar] [CrossRef]
- Carpenter, R.E.; Petersen, B.C. Capital market imperfections, high-tech investment, and new equity financing. Econ. J. 2020, 112, F54–F72. [Google Scholar] [CrossRef] [Green Version]


| Citation | DMUs | Input Factor | Output Factor | Method |
|---|---|---|---|---|
| Seiford and Zhu [57] | 55 U.S. commercial banks | Market capital, Total assets, Employees, Stockholder’s equity | Price earnings ratio (P/E ratio), Earning per share (EPS), Market to book ratio (M/B ratio), Profit, Total return to investors (TRI), Turnover ratio | DEA |
| Zhu [58] | Fortune 500 companies | Market value, Total assets, No. of employees, Stockholder’s equity | EPS, Revenue or Sales, Profit, TRI | Network DEA |
| Luo [51] | 245 banks from the Compustat Disk in the year 2000 | Market capital, Total assets, Employees | ROE, ROA, EPS, Revenue or Sales, Profit, Stock price | DEA |
| Wen et al. [52] | 12 e-commerce firms | Employees, Investment, operating expenses | Profit margin (PM), Return of capital employed (ROCE), ROE, Days receivables, Revenue or Sales | DEA |
| Hoe et al. [1] | 18 technology companies in Malaysia for the period of 2011–2015 | Current ratio, Debt to assets ratio, Debt to equity ratio | EPS, ROA, ROE | DEA |
| Ravanshad and Amiri [53] | 60 firms listed on the Tehran Stock Exchange | Total liabilities, Total equity ratio | 1st stage: ROA, ROE 2nd stage: t: B/M ratio(book-to- market equity), E/P RATIO(ratios of earnings to price) | Network DEA |
| Employees | Total Assets | ROA | ROE | EPS | DER | CR | ||
|---|---|---|---|---|---|---|---|---|
| Major | Max | 105,257 | 216,180.92 | 0.94 | 5.79 | 13,223.00 | 1,557.38 | 355.83 |
| Median | 8891 | 5070.13 | 0.87 | 5.20 | 8007.00 | 51.44 | 187.34 | |
| Min | 226 | 175.83 | 0.75 | 4.33 | 1.00 | −1353.40 | 73.05 | |
| Mean | 20,302 | 31,010.59 | 0.87 | 5.03 | 8051.73 | 159.94 | 174.57 | |
| St.dev | 29,962 | 61,086.62 | 0.06 | 0.42 | 3215.41 | 670.39 | 85.13 | |
| Midsize | Max | 2560 | 1185.88 | 1.10 | 12.36 | 13,446.00 | 6482.76 | 2287.01 |
| Median | 432 | 261.35 | 0.87 | 5.24 | 7542.00 | 56.41 | 151.22 | |
| Min | 17 | 76.73 | 0.60 | 0.36 | 2112.00 | −3510.63 | 17.26 | |
| Mean | 501 | 308.68 | 0.87 | 5.33 | 7790.56 | −2.17 | 254.20 | |
| St.dev | 467 | 221.95 | 0.08 | 1.37 | 1404.12 | 1060.30 | 354.22 | |
| SME | Max | 1397 | 387.71 | 1.11 | 33.22 | 12,234.00 | 4789.66 | 3406.95 |
| Median | 108 | 83.36 | 0.86 | 5.19 | 7423.00 | 49.72 | 213.56 | |
| Min | 8 | 11.82 | 0.00 | 0.00 | 3754.00 | −3151.08 | 27.50 | |
| Mean | 148 | 94.36 | 0.82 | 5.61 | 7473.93 | 48.84 | 380.17 | |
| St.dev | 159 | 60.00 | 0.15 | 3.28 | 941.33 | 684.20 | 442.55 | |
| Employees | Total Assets | ROA | ROE | EPS | DER | CR | ||
|---|---|---|---|---|---|---|---|---|
| Major | Max | 23,372 | 30,839.37 | 0.93 | 7.70 | 25,221.00 | 2,098.74 | 664.38 |
| Median | 1,124 | 850.16 | 0.88 | 5.28 | 8398.50 | 75.35 | 165.03 | |
| Min | 118 | 100.35 | 0.80 | 4.85 | 4121.00 | −7759.84 | 56.87 | |
| Mean | 3991 | 5491.00 | 0.88 | 5.58 | 10,032.89 | −156.98 | 218.17 | |
| St.dev | 5930 | 9309.24 | 0.04 | 0.81 | 5269.77 | 1922.10 | 161.07 | |
| Midsize | Max | 3942 | 6671.59 | 1.18 | 8.39 | 22,306.00 | 17,880.15 | 1512.25 |
| Median | 276 | 205.30 | 0.87 | 5.21 | 7587.00 | 43.68 | 217.24 | |
| Min | 7 | 39.36 | 0.33 | 3.41 | 4077.00 | −1010.52 | 24.74 | |
| Mean | 478 | 537.96 | 0.87 | 5.25 | 8318.18 | 364.76 | 338.01 | |
| St.dev | 701 | 1101.99 | 0.11 | 0.58 | 2718.80 | 2,377.59 | 319.31 | |
| SME | Max | 837 | 734.89 | 1.05 | 29.14 | 18,987.00 | 7006.57 | 19,080.41 |
| Median | 104 | 61.92 | 0.86 | 5.21 | 7410.00 | 51.57 | 246.86 | |
| Min | 5 | 8.57 | 0.08 | 1.51 | 3614.00 | −7151.80 | 17.54 | |
| Mean | 138 | 79.99 | 0.80 | 5.65 | 7506.35 | 11.46 | 581.42 | |
| St.dev | 134 | 79.89 | 0.18 | 2.87 | 1442.65 | 1011.97 | 1783.32 | |
| Employee | Assets | ROA | ROE | EPS | CR | DER | ||
|---|---|---|---|---|---|---|---|---|
| Employee | Correlation | 1 | ||||||
| Sig. | ||||||||
| Assets | Correlation | 0.956 ** | 1 | |||||
| Sig. | 0.000 | |||||||
| ROA | Correlation | 0.048 | 0.042 | 1 | ||||
| Sig. | 0.322 | 0.392 | ||||||
| ROE | Correlation | −0.015 | −0.012 | −0.040 | 1 | |||
| Sig | 0.759 | 0.803 | 0.416 | |||||
| EPS | Correlation | 0.071 | 0.095 * | 0.437 ** | 0.014 | 1 | ||
| Sig. | 0.145 | 0.050 | 0.000 | 0.776 | ||||
| CR | Correlation | −0.031 | −0.021 | 0.035 | 0.008 | 0.015 | 1 | |
| Sig. | 0.524 | 0.669 | 0.474 | 0.864 | 0.751 | |||
| DER | Correlation | 0.004 | 0.005 | 0.081 | −0.071 | 0.058 | −0.004 | 1 |
| Sig. | 0.938 | 0.926 | 0.096 | 0.142 | 0.235 | 0.928 |
| Comparison | Manufacturing | Services | ||||||
|---|---|---|---|---|---|---|---|---|
| Test Statistic | Std. Error | Std. Test Statistic | Sig. Test Statistic | Test Statistic | Std. Error | Std. Test Statistic | Sig. Test Statistic | |
| Major-Mid | −44.206 | 21.390 | −2.067 | 0.116 | −30.523 | 15.213 | −2.006 | 0.134 |
| Major-SME | −127.783 | 20.729 | −6.164 | 0.000 *** | −86.618 | 14.192 | −6.103 | 0.000 *** |
| Mid-SME | −83.577 | 9.445 | −8.849 | 0.000 *** | −56.095 | 9.086 | −6.174 | 0.000 *** |
| Size | Factor | Manufacturing | Services | ||||||
|---|---|---|---|---|---|---|---|---|---|
| Coefficient | Std. Error | z-Value | Sig. | Coefficient | Std. Error | z-Value | Sig. | ||
| Major | Liquidity | 0.000 | 0.000 | 1.330 | 0.183 | 0.001 | 0.003 | 0.520 | 0.603 |
| Leverage | 0.000 | 0.000 | 0.421 | 0.674 | 0.000 | 0.000 | 1.774 | 0.076 | |
| Mid | Liquidity | 0.000 | 0.000 | 0.827 | 0.408 | 0.000 | 0.000 | 1.287 | 0.198 |
| Leverage | 0.000 | 0.000 | 0.142 | 0.887 | 0.000 | 0.000 | 3.152 | 0.002 *** | |
| SME | Liquidity | 0.000 | 0.000 | 4.446 | 0.000 *** | 0.000 | 0.000 | 1.078 | 0.281 |
| Leverage | 0.000 | 0.000 | −1.185 | 0.236 | 0.000 | 0.000 | 0.139 | 0.890 | |
Disclaimer/Publisher’s Note: The statements, opinions and data contained in all publications are solely those of the individual author(s) and contributor(s) and not of MDPI and/or the editor(s). MDPI and/or the editor(s) disclaim responsibility for any injury to people or property resulting from any ideas, methods, instructions or products referred to in the content. |
© 2023 by the authors. Licensee MDPI, Basel, Switzerland. This article is an open access article distributed under the terms and conditions of the Creative Commons Attribution (CC BY) license (https://creativecommons.org/licenses/by/4.0/).
Share and Cite
Kim, Y.; Jung, S.; Kim, C. The Impact of Capital Structure on the Profitability Performance of ICT Firms. Processes 2023, 11, 635. https://doi.org/10.3390/pr11020635
Kim Y, Jung S, Kim C. The Impact of Capital Structure on the Profitability Performance of ICT Firms. Processes. 2023; 11(2):635. https://doi.org/10.3390/pr11020635
Chicago/Turabian StyleKim, Yeongjun, Sungwook Jung, and Changhee Kim. 2023. "The Impact of Capital Structure on the Profitability Performance of ICT Firms" Processes 11, no. 2: 635. https://doi.org/10.3390/pr11020635