
Correction of Light and Heavy Hydrocarbons and Their Application in a Shale Oil Reservoir in Gaoyou Sag, Subei Basin—A Case Study from Well SX84

Abstract
:1. Introduction
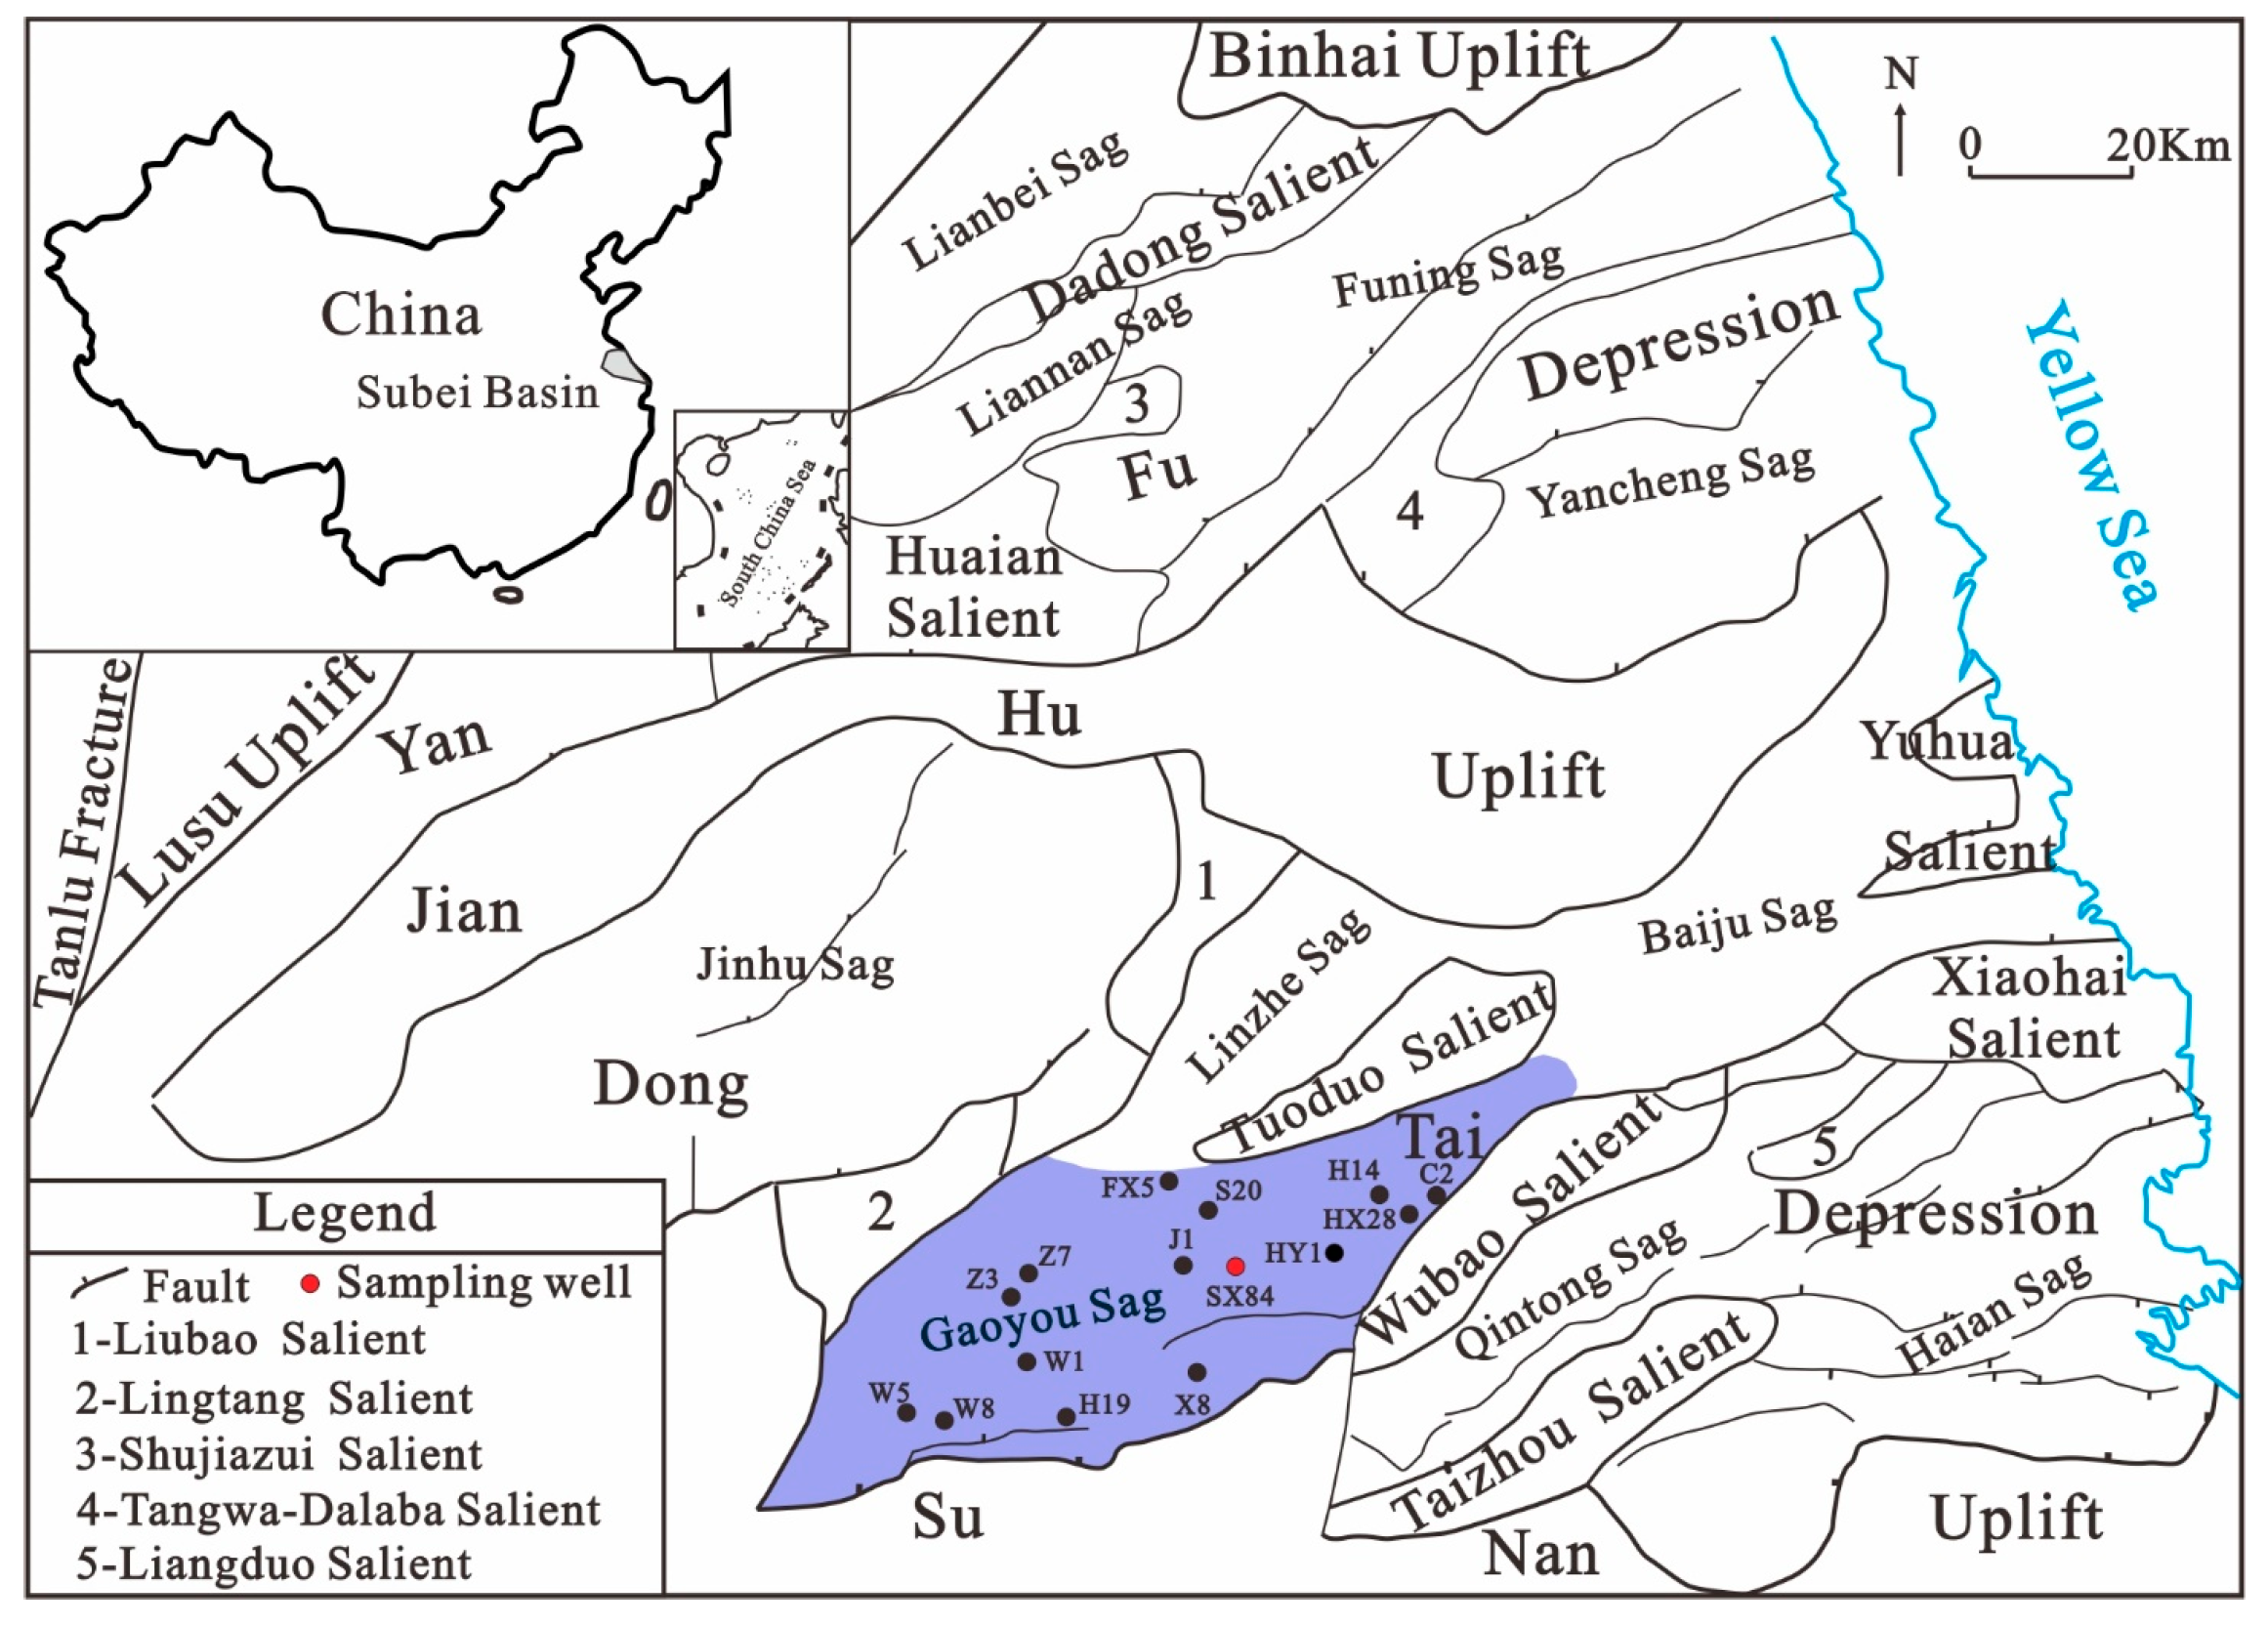
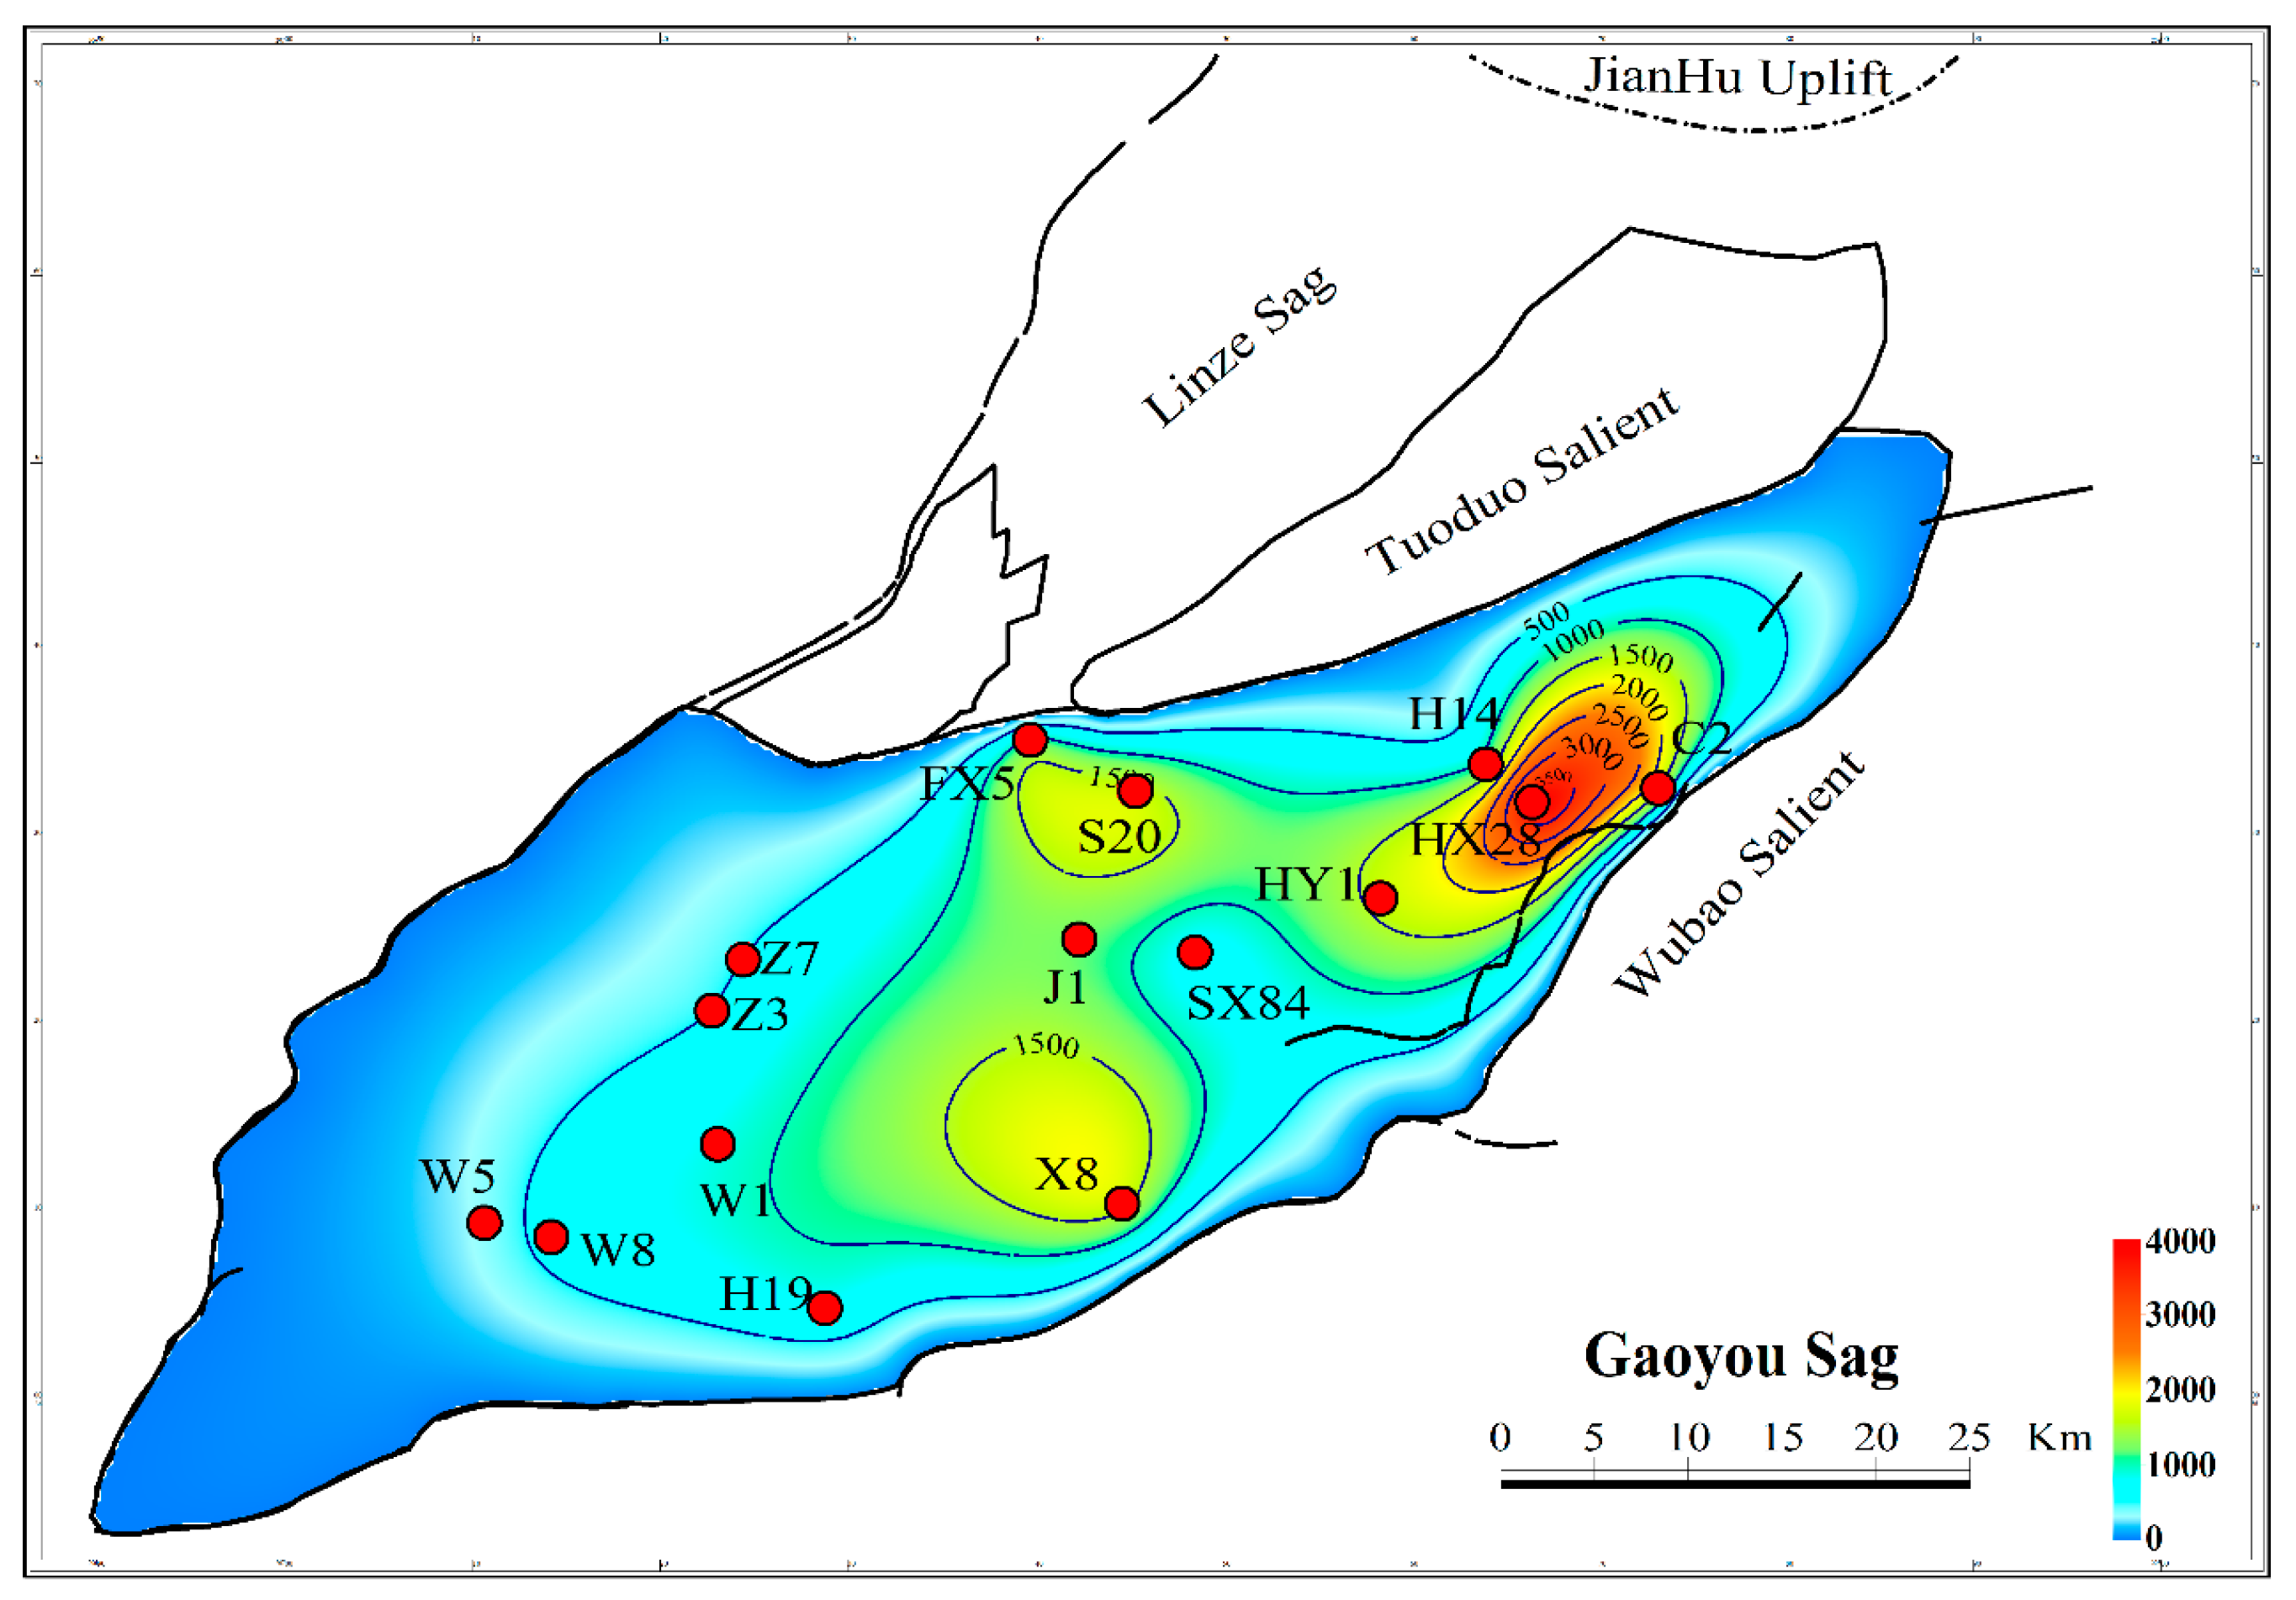
2. Geology Setting
3. Methodology
3.1. Samples and Experiments
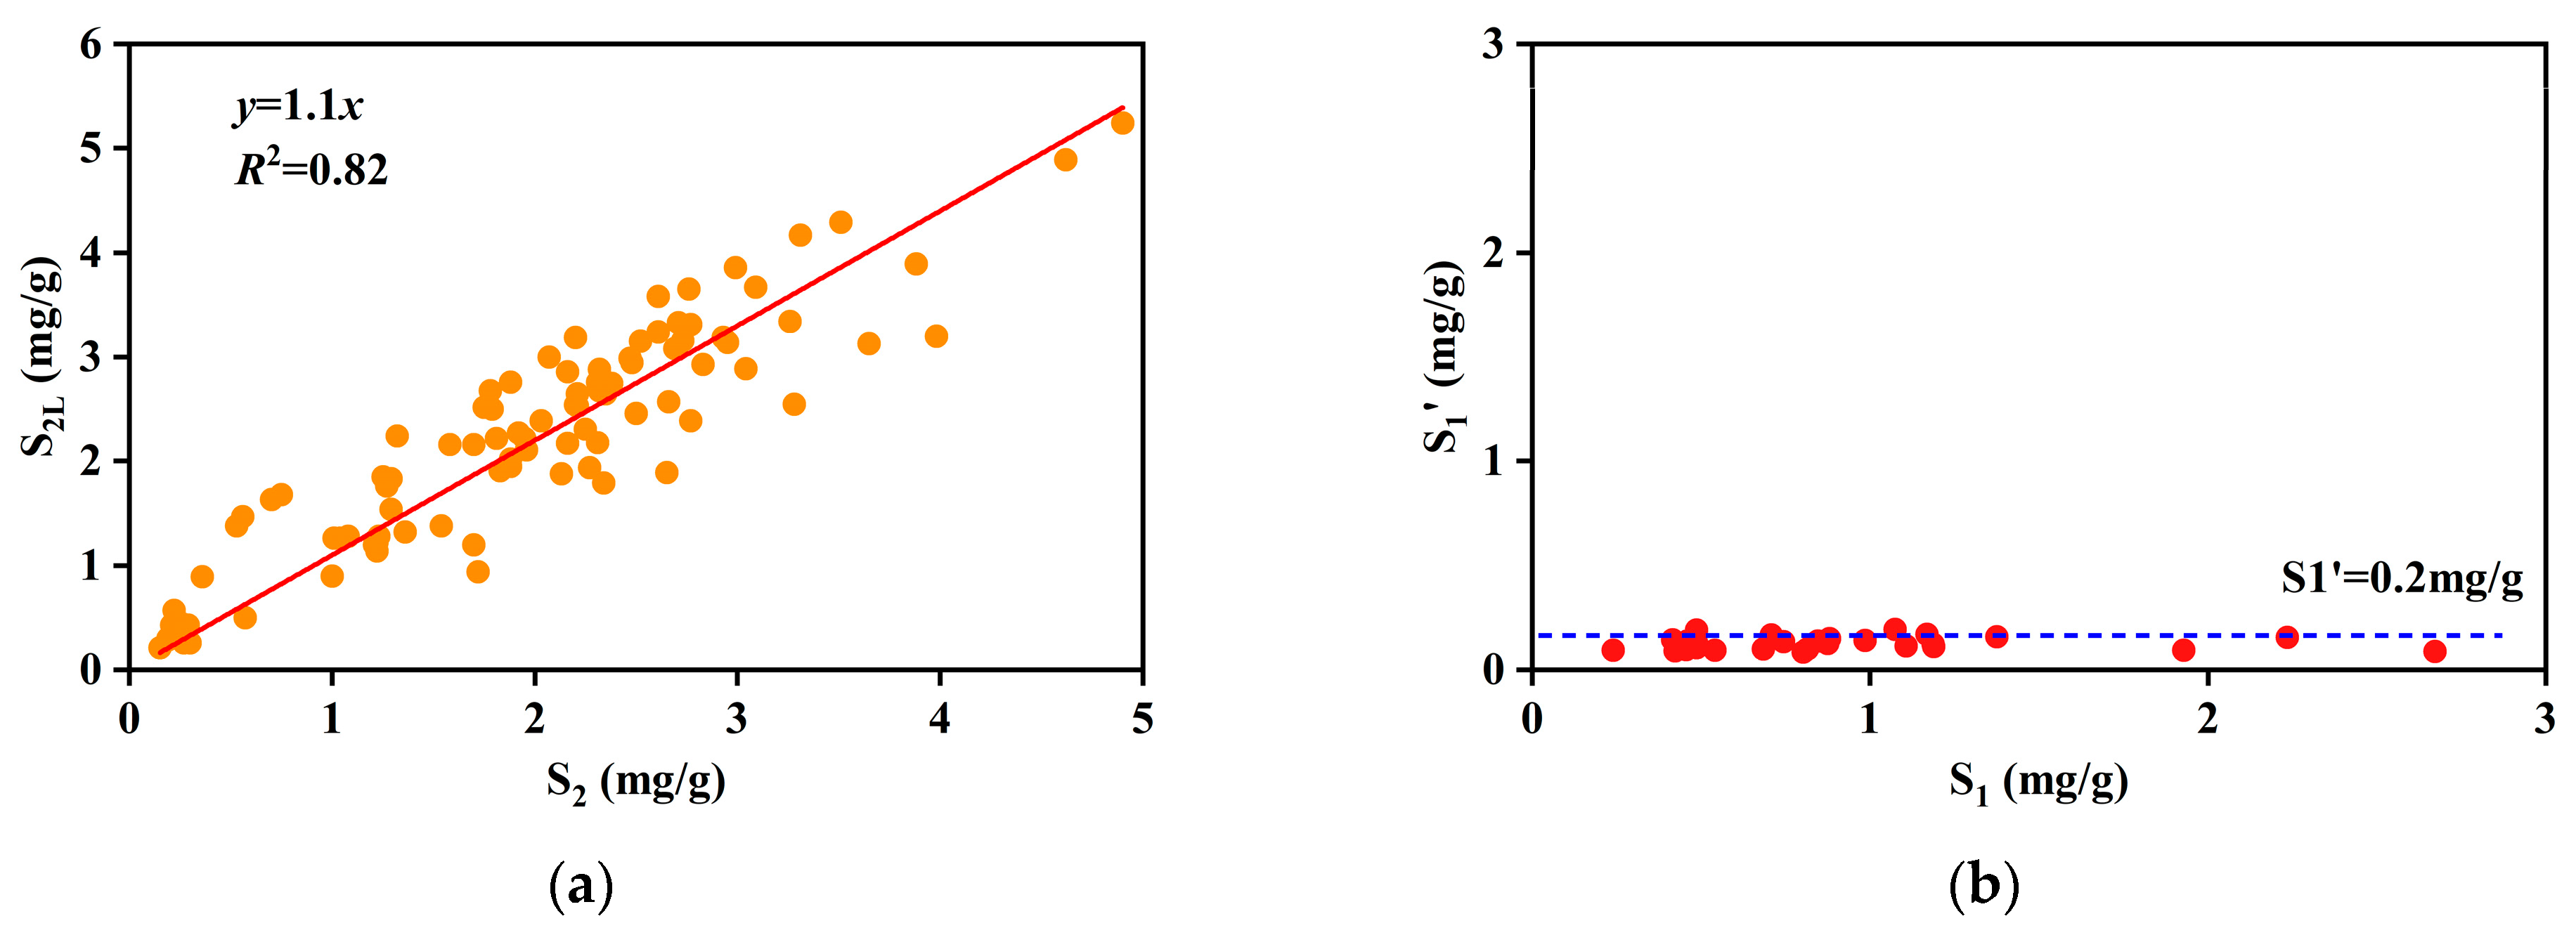
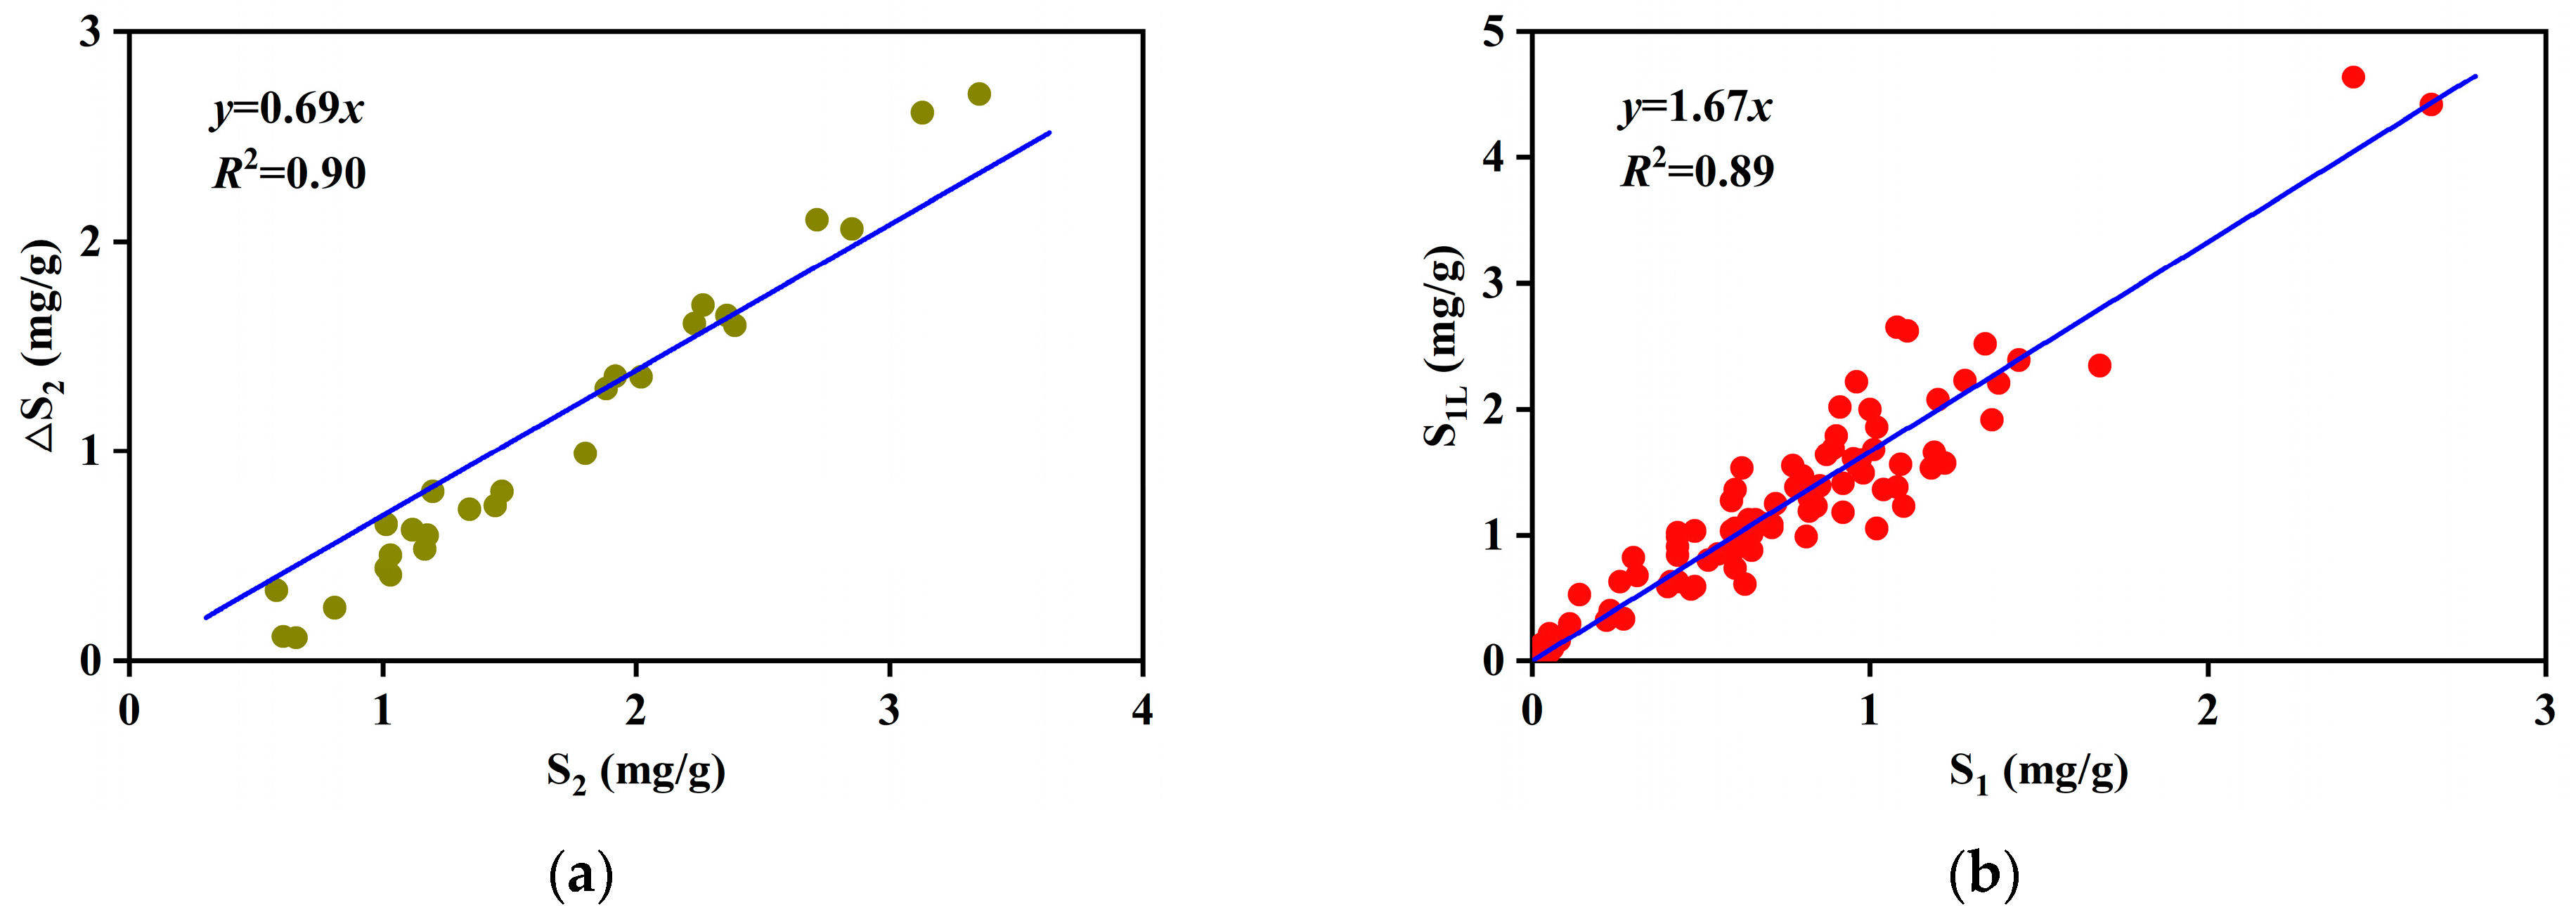
3.2. Correction of Light and Heavy Hydrocarbon Loss for S1
3.3. ΔlogR Method
4. Results and Discussion
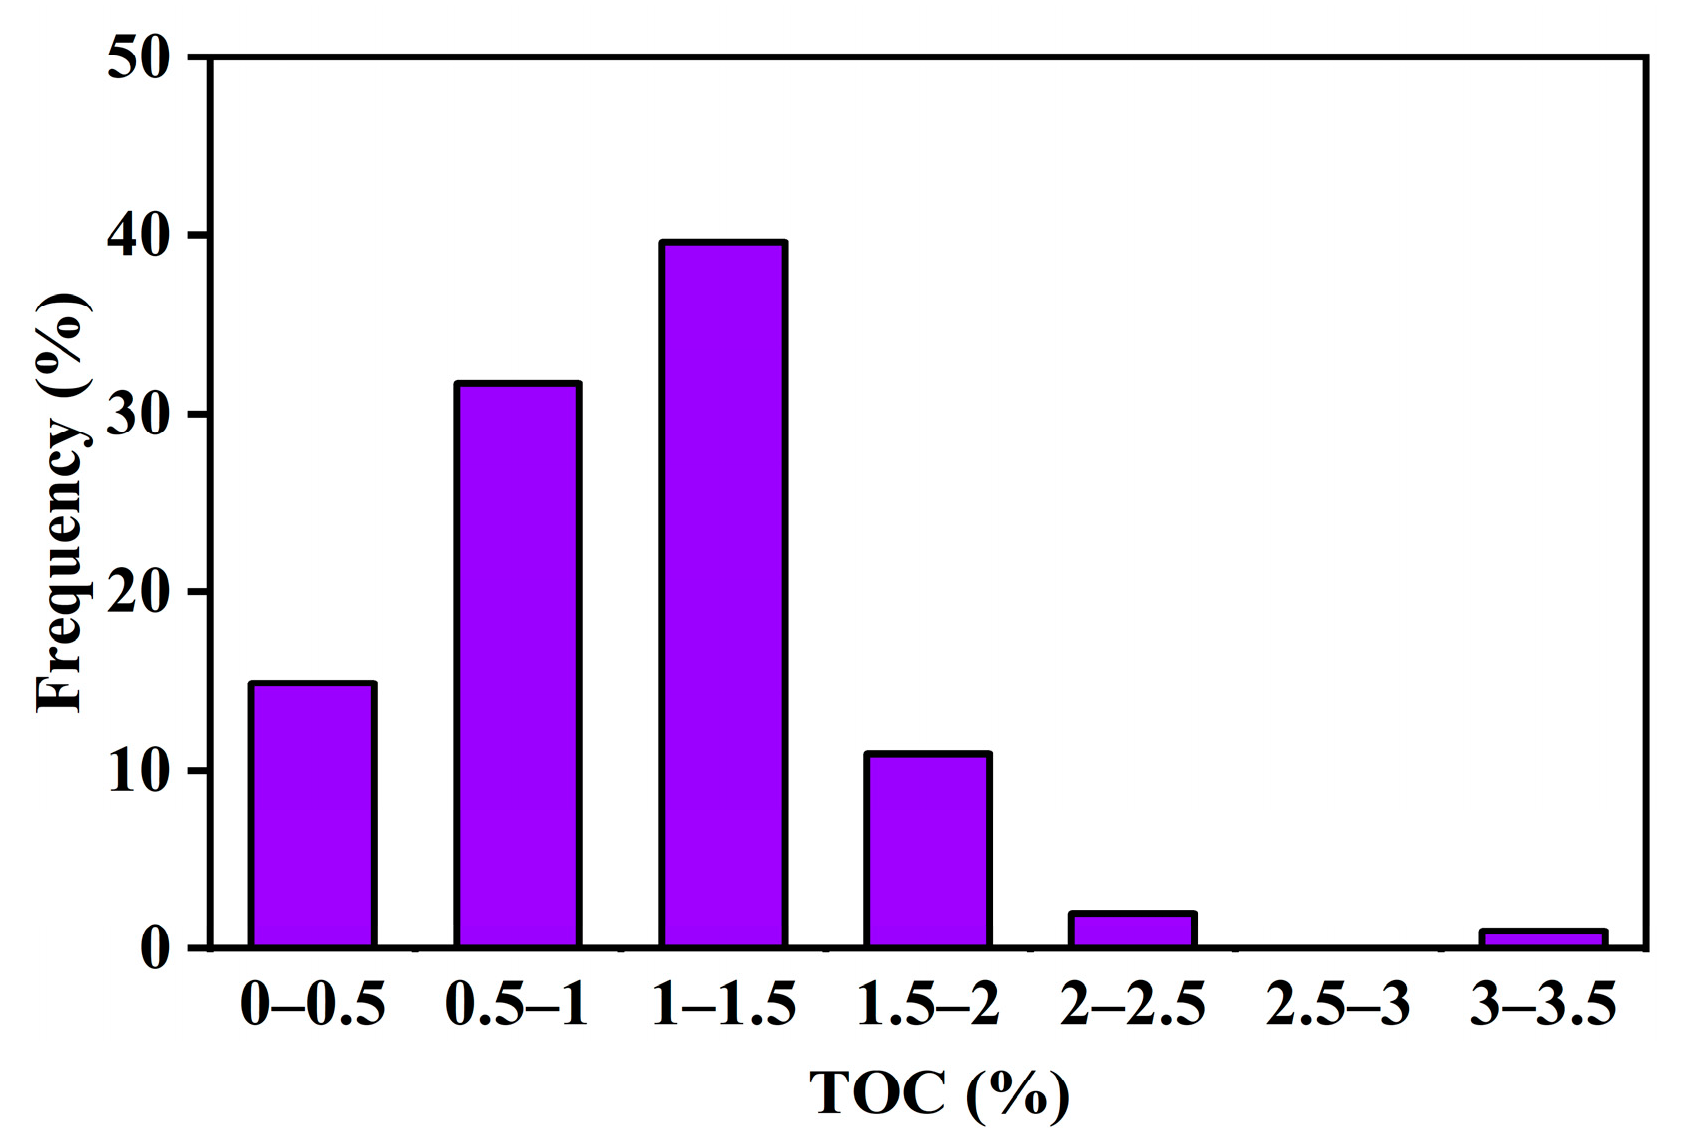
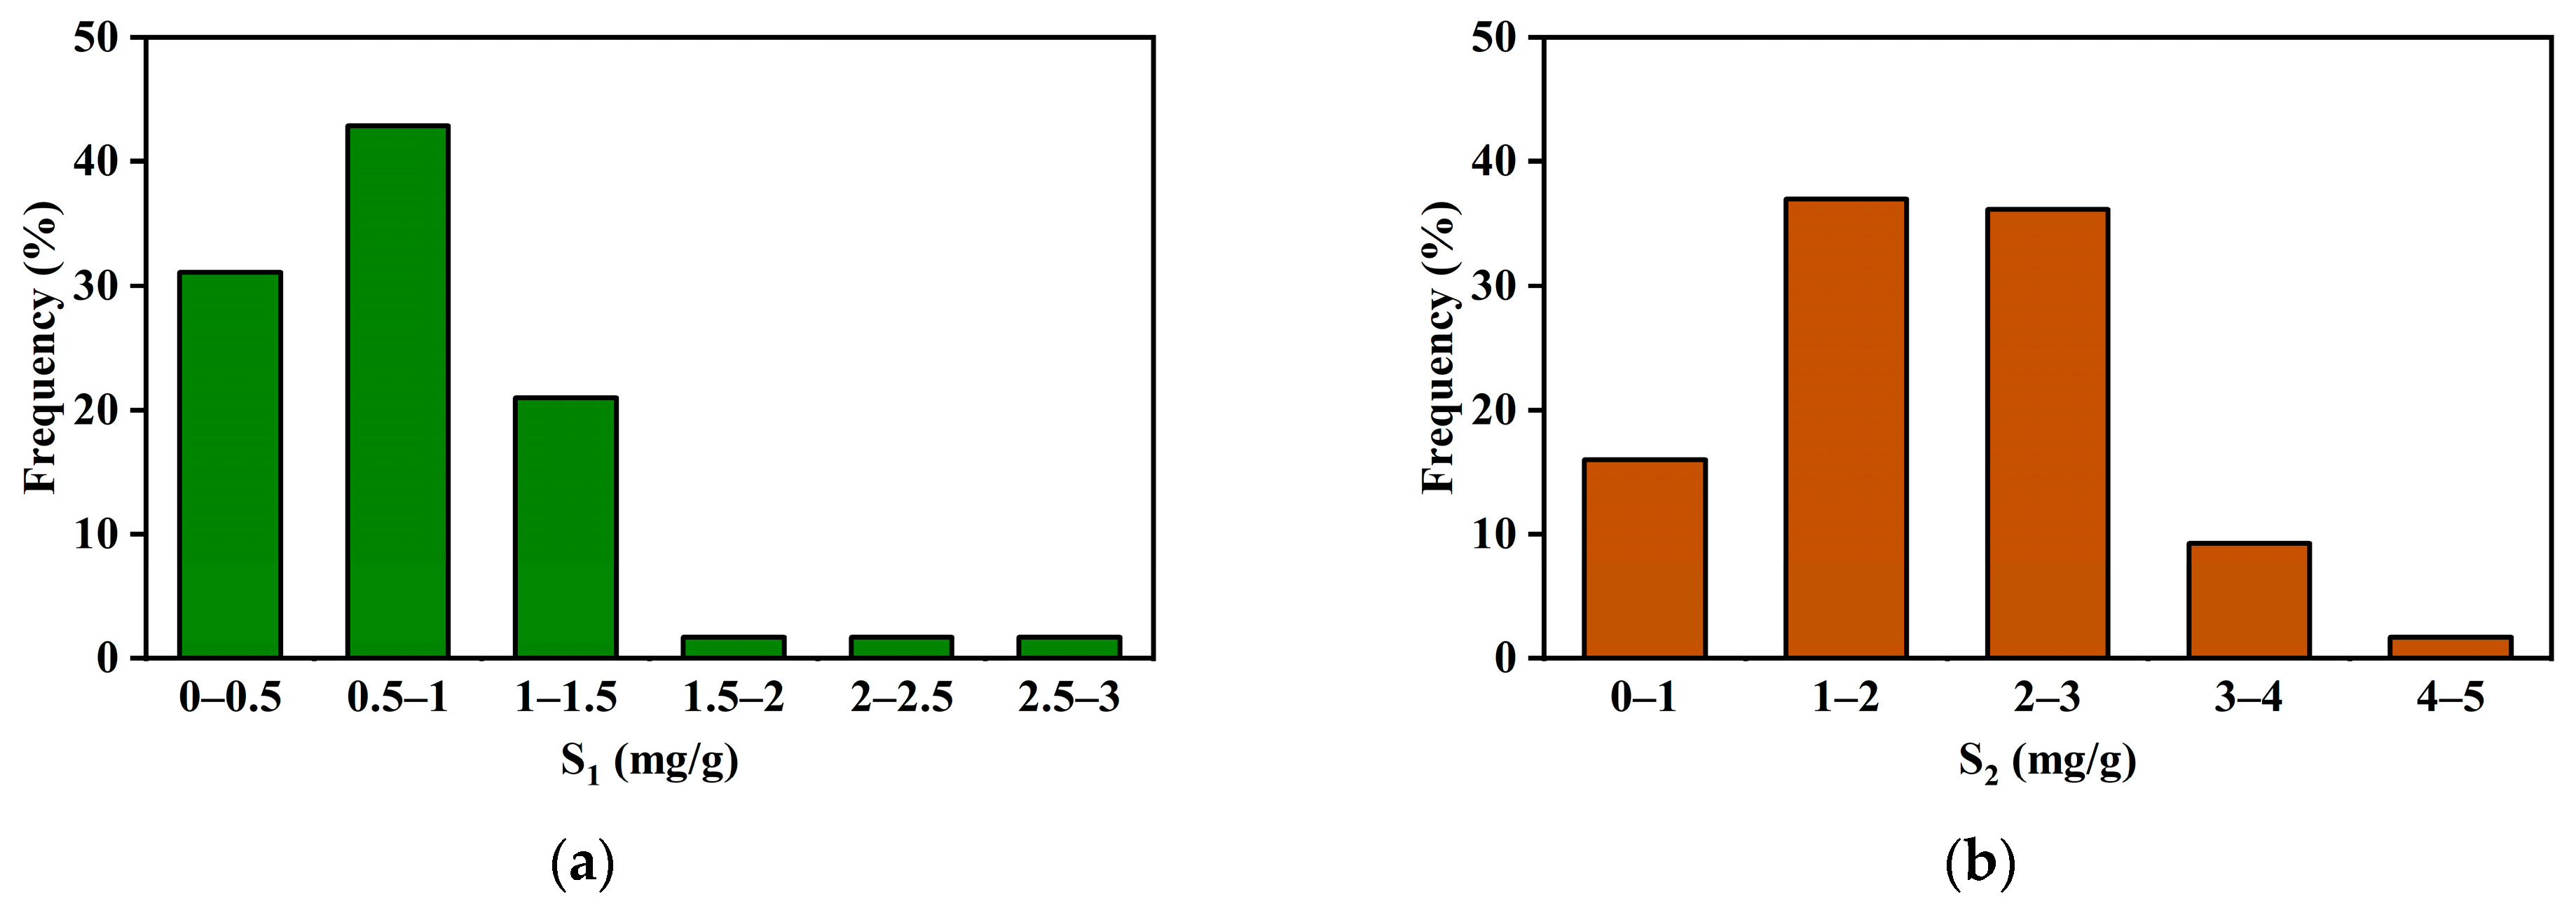
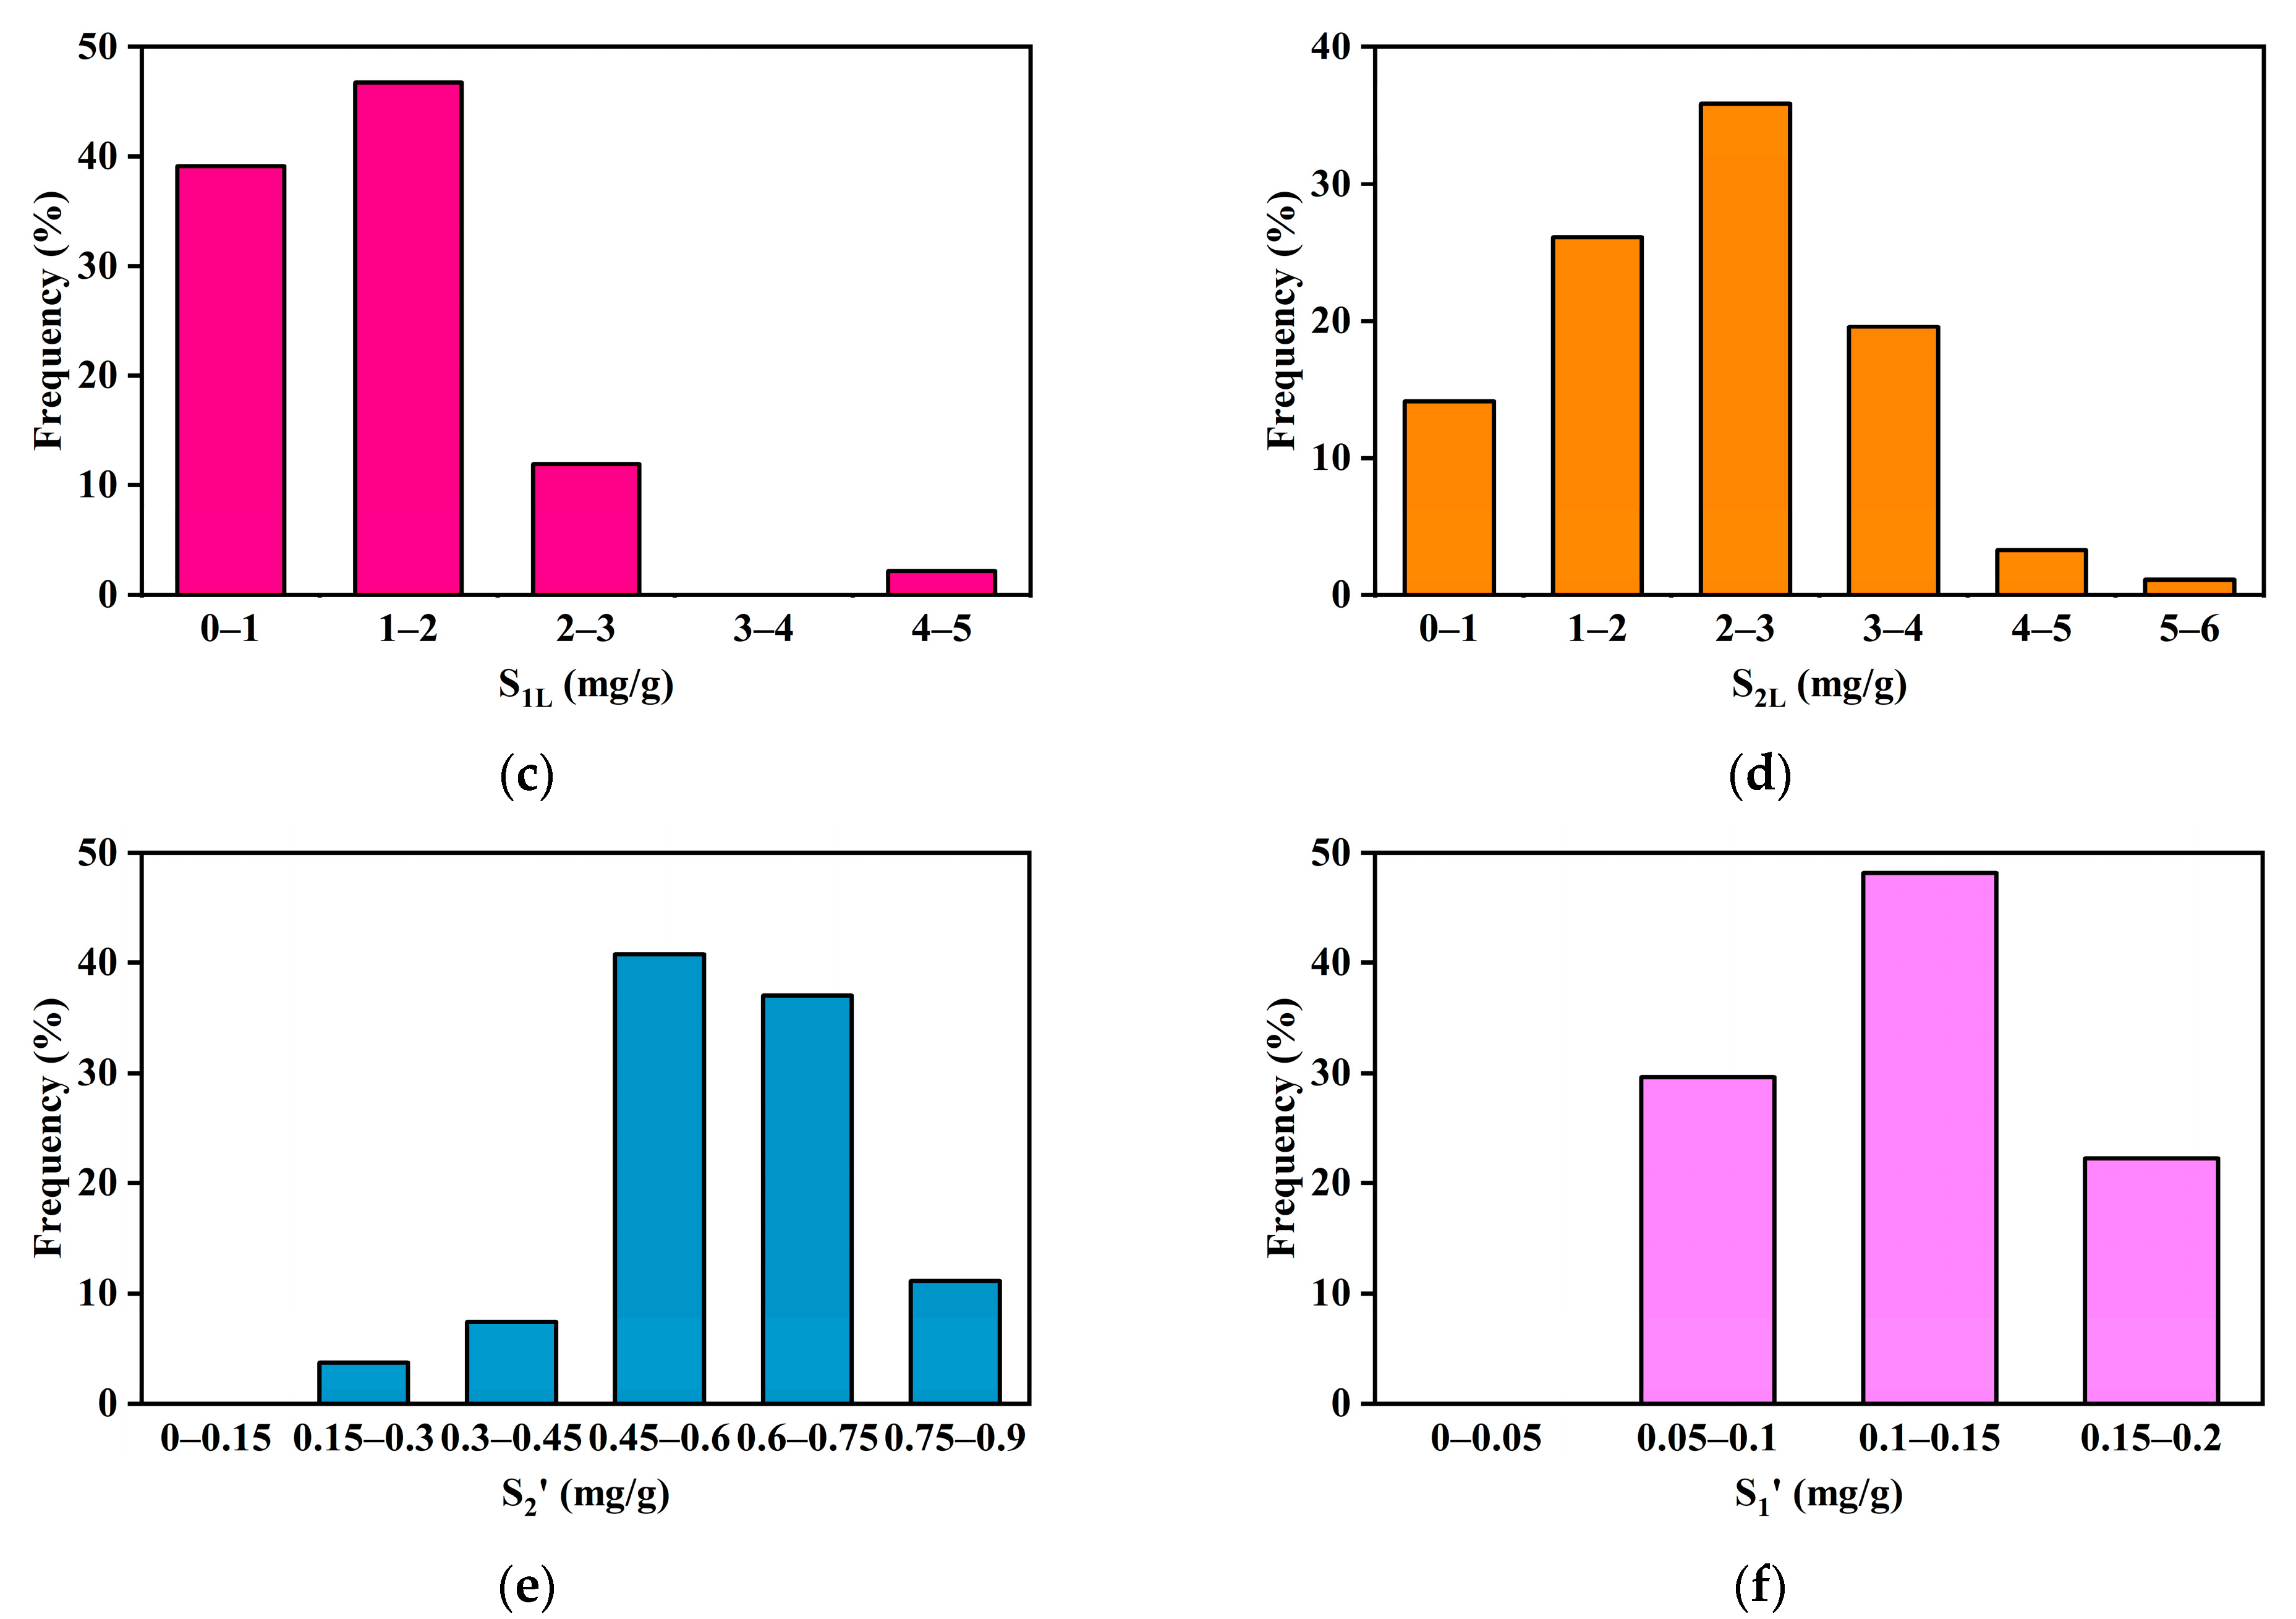
4.1. Shale Organic Geochemical Characteristics
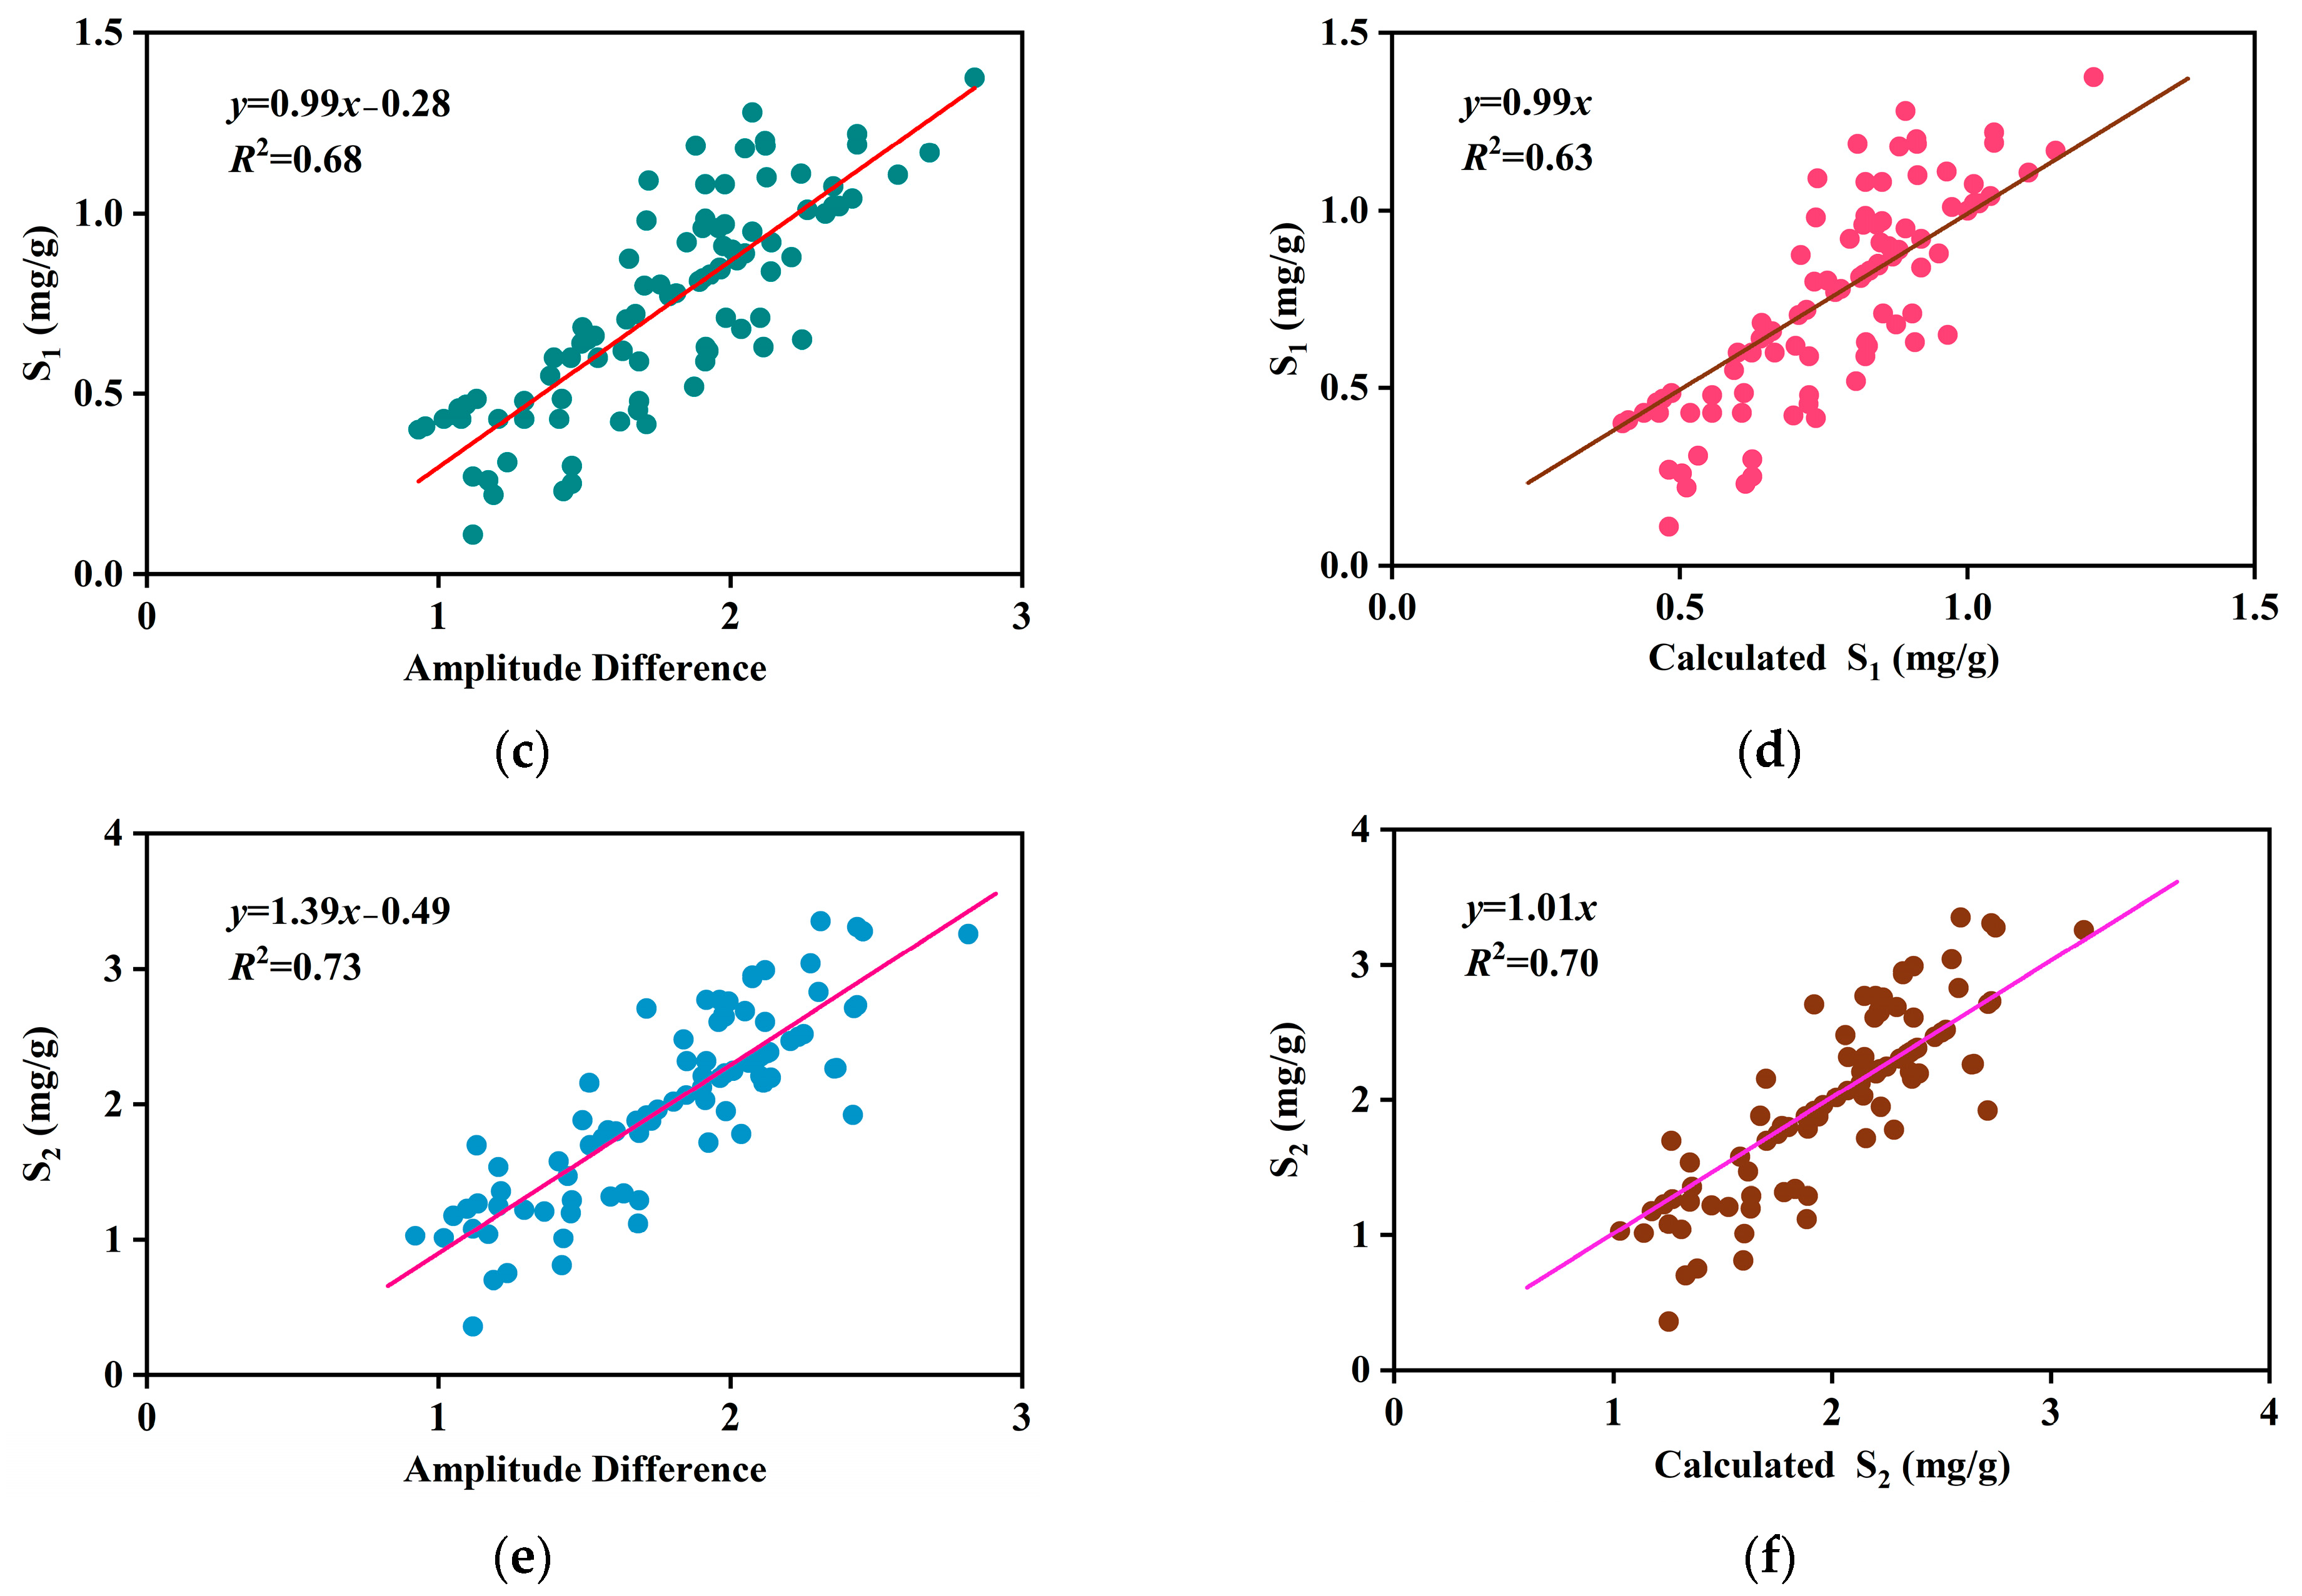
4.2. Correction Model of Heavy and Light Hydrocarbon Loss for S1
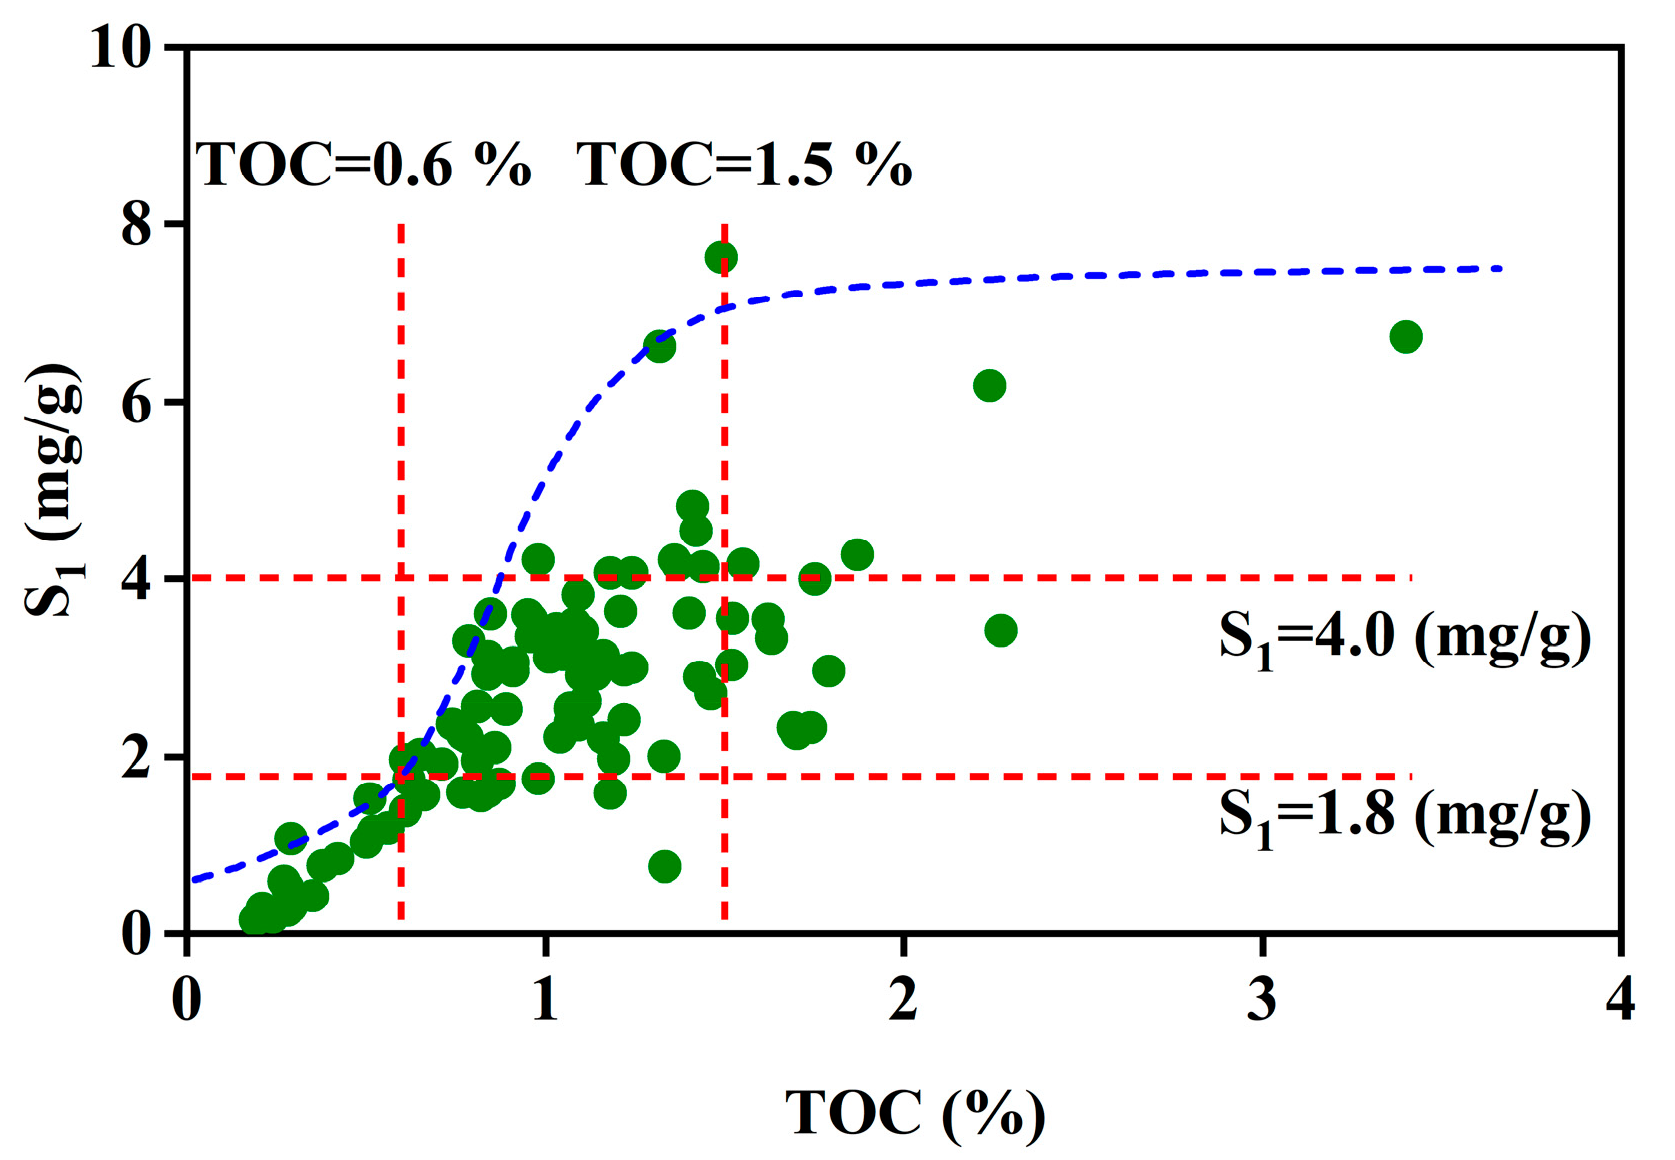
4.3. Classification of Shale Oil Resource
4.4. Estimation of Shale Oil Resource
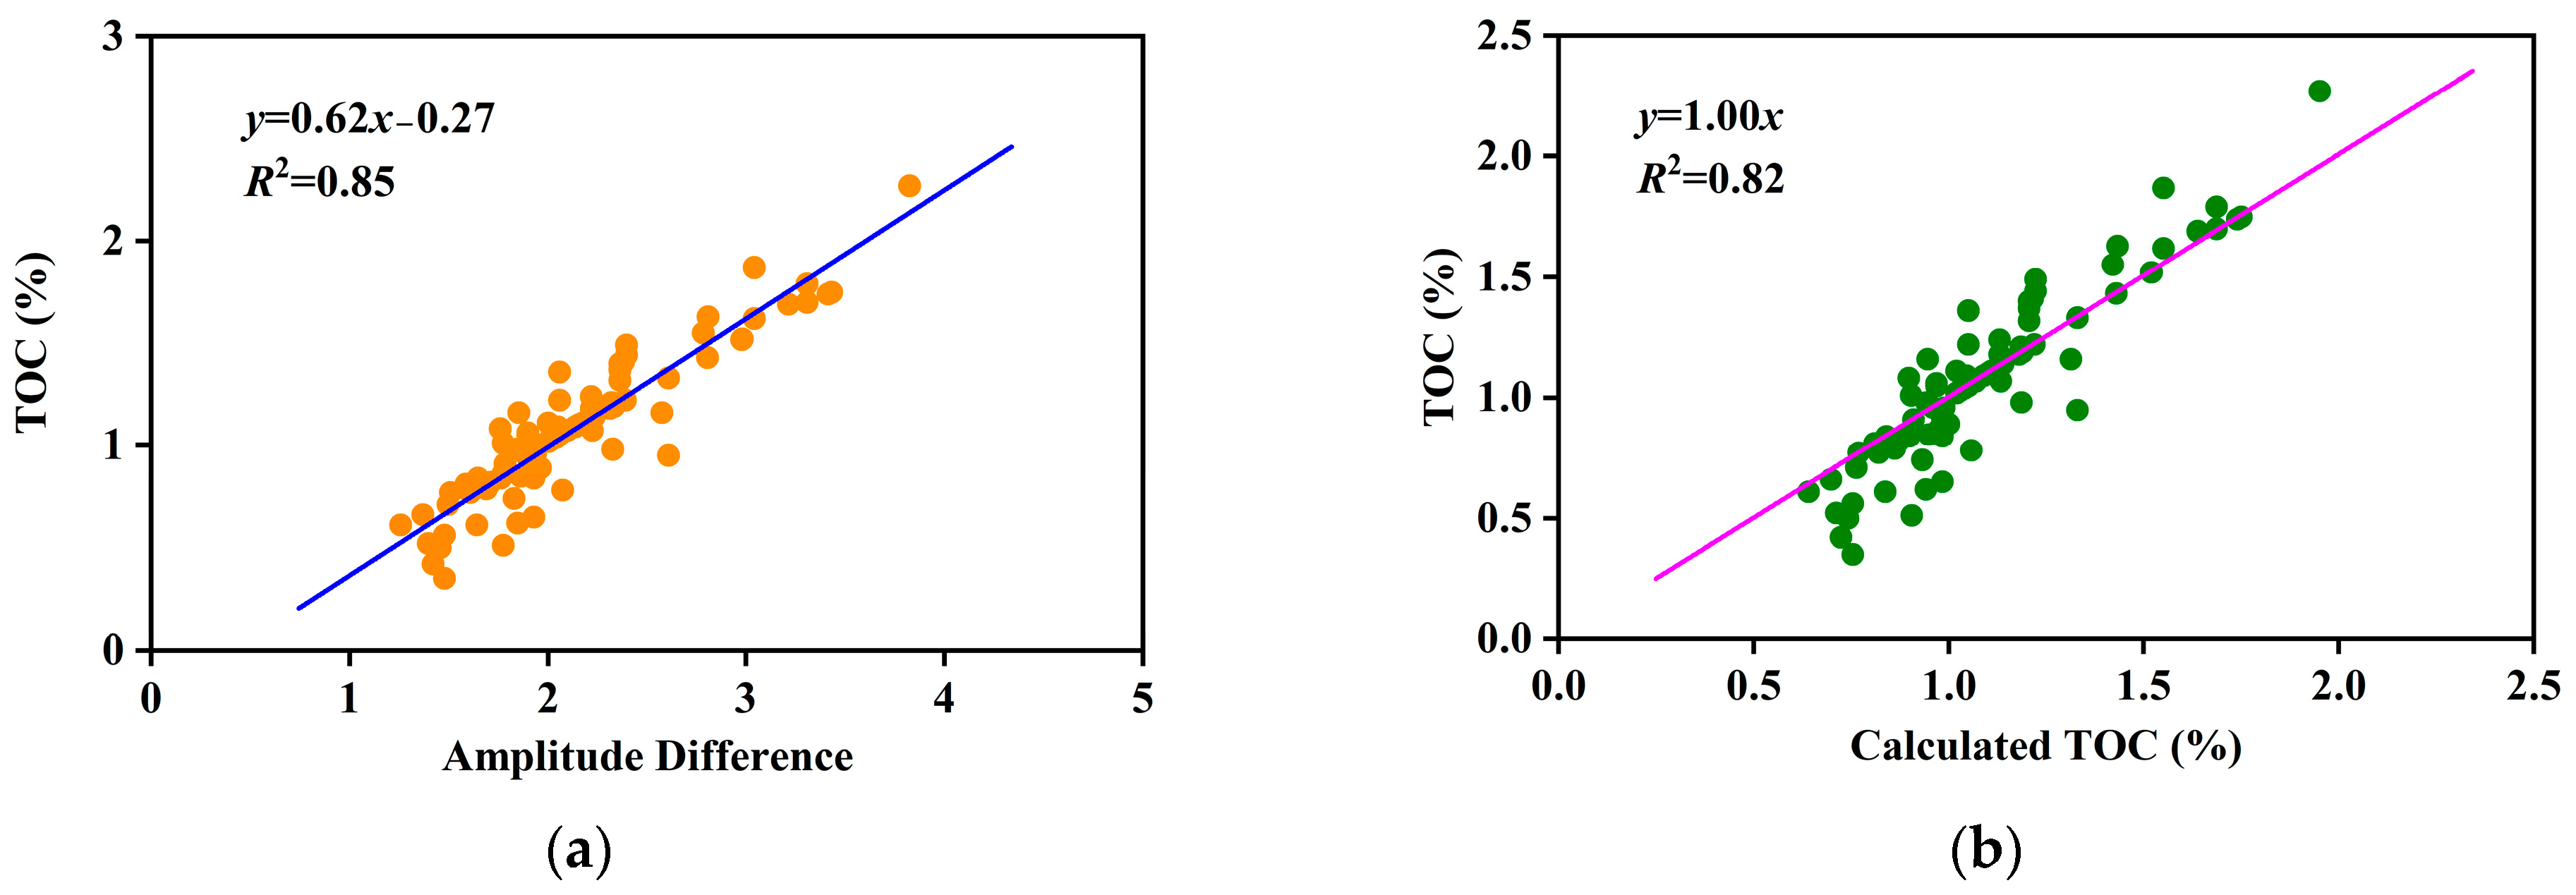
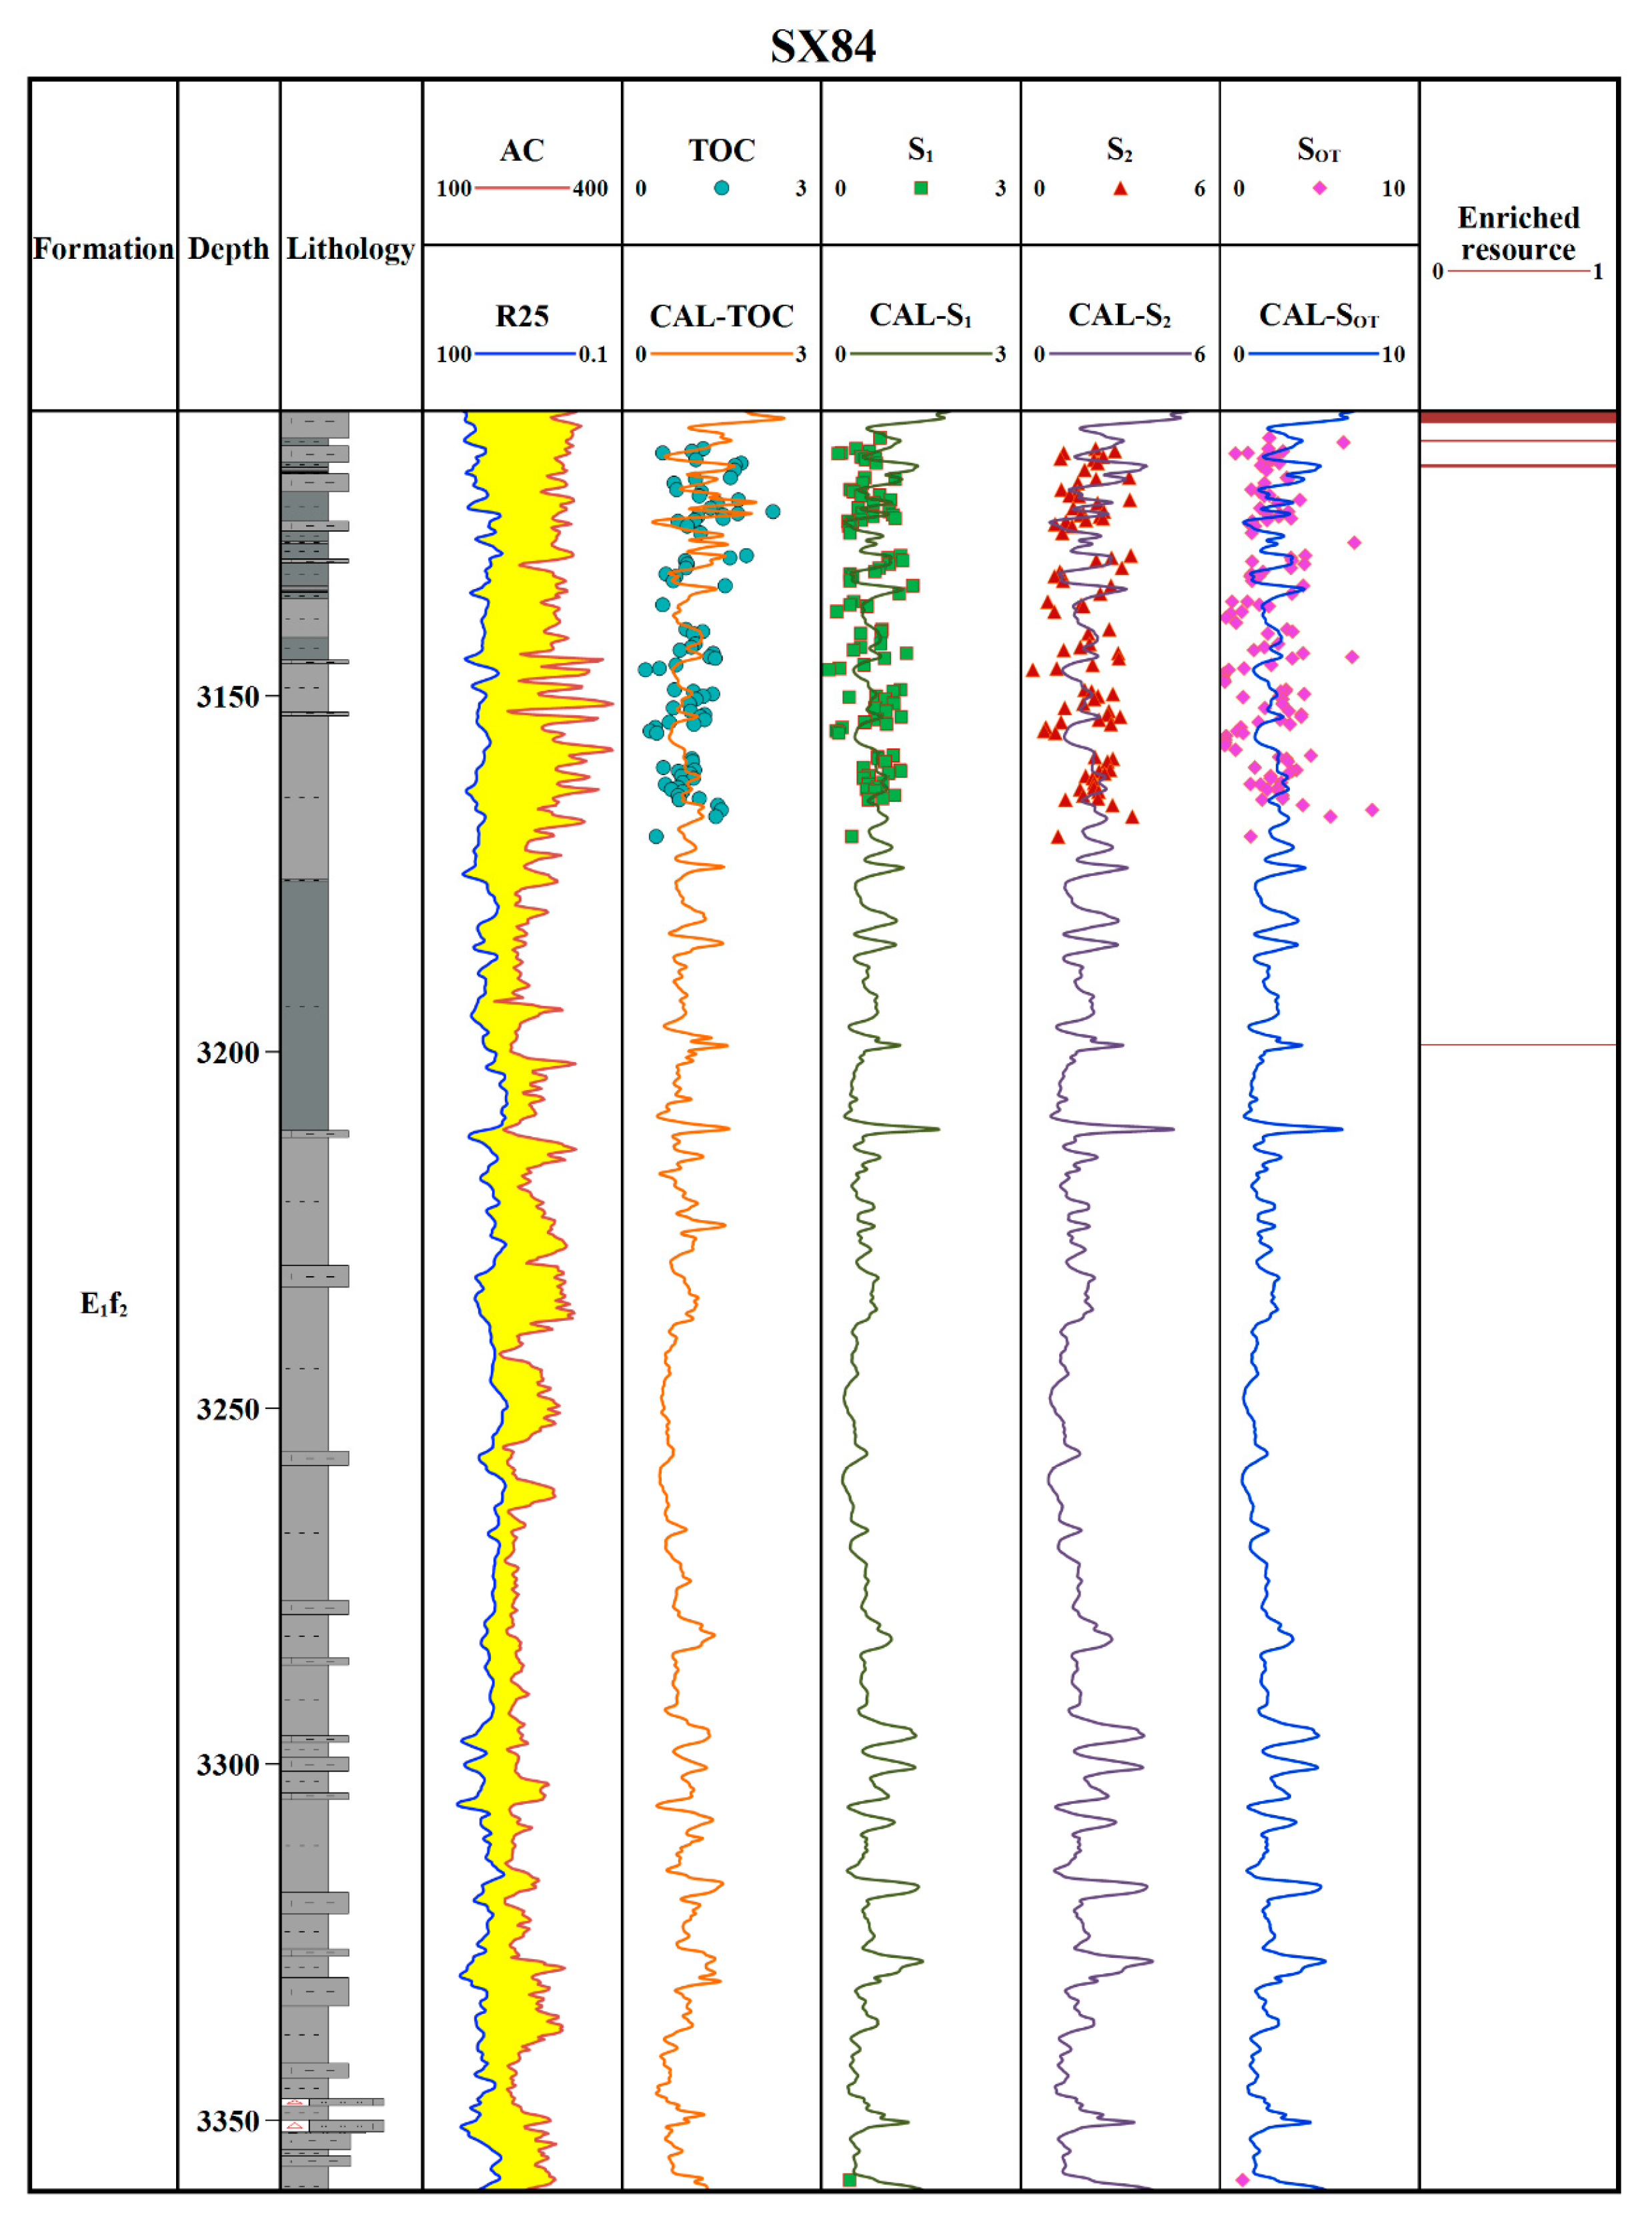
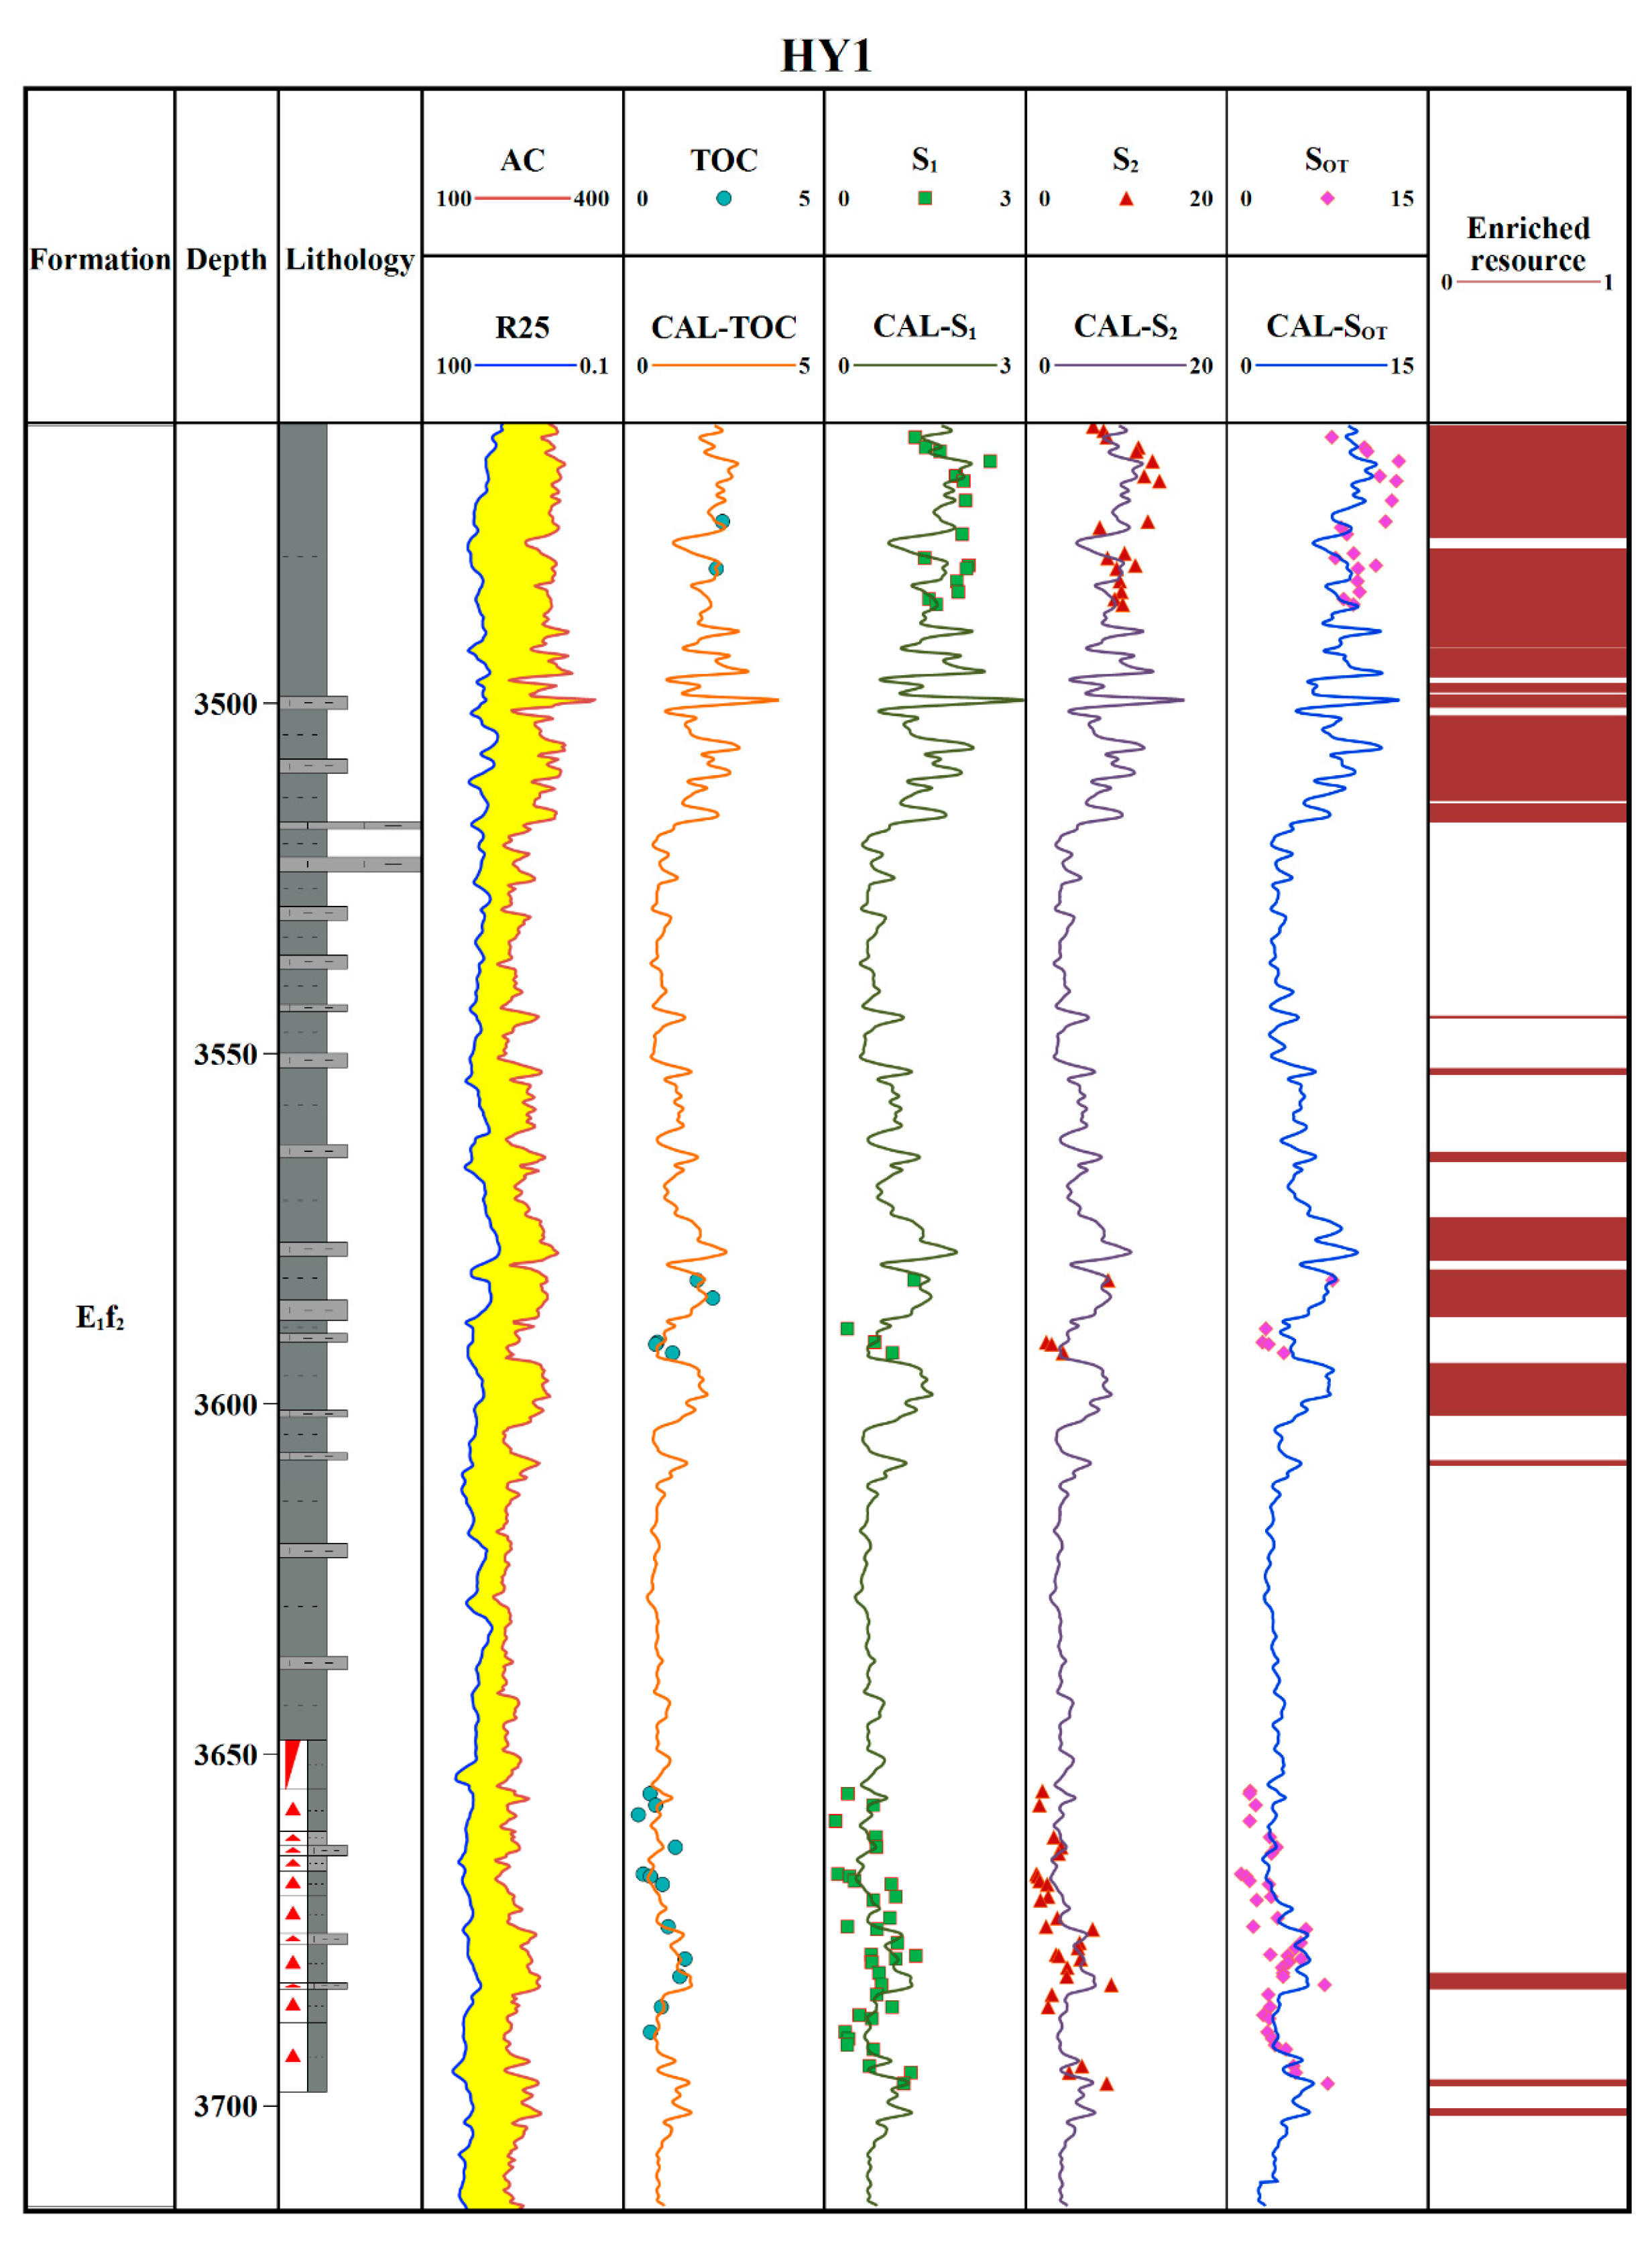
4.4.1. Calculations of TOC, S1, and S2 by ΔlogR
4.4.2. Shale Oil Resource in Gaoyou Sag
5. Conclusions
Author Contributions
Funding
Institutional Review Board Statement
Informed Consent Statement
Data Availability Statement
Conflicts of Interest
Nomenclature
| S1 | residual hydrocarbon obtained from room-temperature shale using rock pyrolysis, mg/g; |
| S2 | hydrocarbon from kerogen pyrolysis obtained from room-temperature shale using rock pyrolysis, mg/g; |
| S1L | residual hydrocarbon obtained from liquefrozen shale using rock pyrolysis, mg/g; |
| S2L | hydrocarbon from kerogen pyrolysis obtained from liquefrozen shale using rock pyrolysis, mg/g; |
| S1′ | residual hydrocarbon obtained from room-temperature shale after oil-washed using rock pyrolysis, mg/g; |
| S2′ | hydrocarbon from kerogen pyrolysis obtained from oil-washed shale using rock pyrolysis, mg/g; |
| ΔS2 | difference between S2 and S2′, mg/g; |
| S1O | total oil, mg/g. |
References
- Cheng, K.; Wu, W.; Holditch, S.; Walter, A.; Duane, M. Assessment of the Distribution of Technically Recoverable Resources in North American Basins. In Proceedings of the Canadian Unconventional Resources and International Petroleum Conference, Calgary, AB, Canada, 19–21 October 2010. [Google Scholar]
- Zhang, J.; Lin, L.; Li, Y.; Tang, X.; Zhu, L.; Xing, Y.; Jiang, S.; Jing, T.; Yang, S. Classification and evaluation of shale oil. Earth Sci. Front. 2021, 19, 322–331. [Google Scholar]
- Liu, B.; Lu, Y.; Zhao, R.; Tu, X.; Guo, X.; Shen, Y. Formation overpressure and shale oil enrichment in the shale system of Lucaogou Formation, Malang Sag, Santanghu Basin, NW China. Pet. Explor. Dev. 2012, 39, 744–750. [Google Scholar] [CrossRef]
- Zhang, W.; Liu, X.; Zhang, Y. Worldwide Tight Oil and Its Current Exploration & Development Conditions. Oil Forum 2013, 13, 2812–2822. [Google Scholar]
- Zou, C.; Yang, Z.; Cui, J.; Zhu, R.; Hou, L.; Tao, S.; Yuan, X.; Wu, S.; Lin, S.; Wang, L.; et al. Formation mechanism, geological characteristics and development strategy of nonmarine shale oil in China. Pet. Explor. Dev. 2013, 40, 15–27. [Google Scholar] [CrossRef]
- Zhang, T.; Peng, Z.; Yang, W.; Ma, Y.; Zhang, J. Enlightenments of American shale oil research towards China. Lithol. Reserv. 2015, 27, 1–10. [Google Scholar]
- U.S. Energy Information Administration (EIA). Technically Recoverable Shale Oil and Shale Gas Resources: An Assessment of 137 Shale Formations in 41 Countries; U.S. Energy Information Administration (EIA): Washington, DC, USA, 2013.
- Fu, S.; Jin, Z.; Fu, J.; Li, S.; Yang, W. Transformation of understanding from tight oil to shale oil in the Member 7 of Yanchang Formation in Ordos Basin and its significance of exploration and development. Acta Pet. Sin. 2021, 42, 561–569. [Google Scholar]
- He, W.; Bai, X.; Meng, Q.; Li, J.; Zhang, D.; Wang, Y. Accumulation geological characteristics and major discoveries of lacustrine shale oil in Sichuan Basin. Acta Pet. Sin. 2022, 43, 885–898. [Google Scholar]
- Sun, L.; Liu, H.; He, W.; Li, G.; Zhang, S.; Zhu, R.; Jin, X.; Meng, S.; Jiang, H. An analysis of major scientific problems and research paths of Gulong shale oil in Daqing Oilfield, NE China. Pet. Explor. Dev. 2021, 48, 453–463. [Google Scholar] [CrossRef]
- Liu, H.; Hu, S.; Li, J.; Wang, J.; Wang, Q.; Jiang, Y.; Jiang, T.; Zhao, C.; Zhang, C.; Wu, F. Controlling factors of shale oil enrichment and exploration potential in lacustrine Bohai Bay Basin. Nat. Gas Geosci. 2019, 30, 1190–1198. [Google Scholar]
- Xue, H.; Tian, S.; Wang, W.; Zhang, W.; Du, T.; Mu, G. Correction of oil content-one key parameter in shale oil resource assessment. Oil Gas Geol. 2016, 37, 15–22. [Google Scholar]
- Li, J.; Lu, S.; Cai, J.; Zhang, P.; Xue, H.; Zhao, X. Adsorbed and Free Oil in Lacustrine Nanoporous Shale: A Theoretical Model and a Case Study. Energy Fuels 2018, 32, 12247–12258. [Google Scholar] [CrossRef]
- Lu, S.; Chen, G.; Wang, M.; Li, J.; Wang, X.; Shan, J.; Hu, Y.; Mao, J. Potential evaluation of enriched shale oil resource of Member 4 of the Shahejie Formation in the Damintun Sag, Liaohe Depression. Oil Gas Geol. 2016, 37, 8–14. [Google Scholar]
- Jarvie, D.M. Shale Resource Systems for Oil and Gas: Part 1—Shale-gas Resource Systems. AAPG Mem. 2012, 97, 69–87. [Google Scholar]
- Jarvie, D.M. Shale Resource Systems for Oil and Gas: Part 2—Shale-gas Resource Systems. AAPG Mem. 2012, 97, 89–119. [Google Scholar]
- Lin, Z.; Wang, M.; Zhang, P.; Lu, S.; Zhi, Q.; Wang, J.; Huang, H. Organic fluid migration in low permeability reservoirs restricted by pore structure parameters. J. Pet. Sci. Eng. 2022, 218, 111028. [Google Scholar] [CrossRef]
- Li, J.; Wang, S.; Lu, S.; Zhang, P.; Zhao, J.; Cai, J.; Li, W. Microdistribution and mobility of water in gas shale: A theoretical and experimental study. Mar. Pet. Geol. 2019, 102, 496–507. [Google Scholar] [CrossRef]
- Lu, S.; Huang, W.; Chen, F.; Li, J.; Wang, M.; Xue, H.; Wang, W.; Cai, X. Classification and evaluation criteria of shale oil and gas resources: Discussion and application. Pet. Explor. Dev. 2012, 39, 268–276. [Google Scholar] [CrossRef]
- Mcglade, C.; Speirs, J.; Sorrell, S. Methods of estimating shale gas resources—Comparison, evaluation and implications. Energy 2013, 59, 116–125. [Google Scholar] [CrossRef]
- Zhang, L.; Li, Z.; Kong, X.; Xu, X.; Liu, Q.; Liu, H.; Wang, R. Study on evaluation method of petroleum resources in mature exploration area: Taking Niuzhuang Sag of bohaiwan basin as an example. Nat. Gas Geosci. 2014, 25, 477–489. [Google Scholar]
- Zhao, Y.; Zhao, Y. Classification, Content and Extension of Evaluation Methods for Oil and Gas Resources. J. Southwest Pet. Univ. (Sci. Technol. Ed.) 2019, 41, 64–74. [Google Scholar]
- Guo, Q.; Bai, X.; He, W.; Fan, L.; Wang, J.; Jiang, Y.; Liu, Z.; Chen, N. Shale oil resource assessment methods, parameter standards and typical case studies. China Pet. Explor. 2022, 27, 27–41. [Google Scholar]
- Chen, Q.; Zhang, M.; Li, H. Anomalous distribution of steranes in deep lacustrine facies low maturity-maturity source rocks and oil of Funing formation in Subei Basin. J. Pet. Sci. Eng. 2019, 181, 106190. [Google Scholar] [CrossRef]
- Liu, S.; Duan, H.; Zhang, Y.; Wang, H.; Gao, J. Analysis of Oil and Gas Exploration Potential in F2 Member Continental Shale of Subei Basin. Offshore Oil 2014, 34, 27–33. [Google Scholar]
- Zhang, P.; Lu, S.; Lin, Z.; Duan, H.; Chang, X.; Qiu, Y.; Fu, Q.; Zhi, Q.; Wang, J.; Huang, H. Key Oil Content Parameter Correction of Shale Oil Resources: A Case Study of the Paleogene Funing Formation, Subei Basin, China. Energy Fuels 2022, 36, 5316–5326. [Google Scholar] [CrossRef]
- Passey, Q.R.; Creaney, S.; Kulla, J.B.; Moretti, F.J.; Stroud, J.D. A practical model for organic richness from porosity and resistivity logs. AAPG Bull. 1990, 74, 1777–1794. [Google Scholar]
- Liu, C.; Lu, S.; Xue, H. Variable-coefficient ΔlogR model and its application in shale organic evaluation. Prog. Geophys. 2014, 29, 312–317. [Google Scholar]
- Huang, W.; Deng, S.; Lu, S.; Yu, L.; Hu, S.; Zhang, J. Shale organic heterogeneity evaluation method and its application to shale oil resource evaluation—A case study from Qingshankou Formation, southern Songliao Basin. Oil Gas Geol. 2014, 35, 704–711. [Google Scholar]


Disclaimer/Publisher’s Note: The statements, opinions and data contained in all publications are solely those of the individual author(s) and contributor(s) and not of MDPI and/or the editor(s). MDPI and/or the editor(s) disclaim responsibility for any injury to people or property resulting from any ideas, methods, instructions or products referred to in the content. |
© 2023 by the authors. Licensee MDPI, Basel, Switzerland. This article is an open access article distributed under the terms and conditions of the Creative Commons Attribution (CC BY) license (https://creativecommons.org/licenses/by/4.0/).
Share and Cite
Zhi, Q.; Lu, S.; Zhang, P.; Huang, H.; Wang, J.; Lin, Z. Correction of Light and Heavy Hydrocarbons and Their Application in a Shale Oil Reservoir in Gaoyou Sag, Subei Basin—A Case Study from Well SX84. Processes 2023, 11, 572. https://doi.org/10.3390/pr11020572
Zhi Q, Lu S, Zhang P, Huang H, Wang J, Lin Z. Correction of Light and Heavy Hydrocarbons and Their Application in a Shale Oil Reservoir in Gaoyou Sag, Subei Basin—A Case Study from Well SX84. Processes. 2023; 11(2):572. https://doi.org/10.3390/pr11020572
Chicago/Turabian StyleZhi, Qi, Shuangfang Lu, Pengfei Zhang, Hongsheng Huang, Junjie Wang, and Zizhi Lin. 2023. "Correction of Light and Heavy Hydrocarbons and Their Application in a Shale Oil Reservoir in Gaoyou Sag, Subei Basin—A Case Study from Well SX84" Processes 11, no. 2: 572. https://doi.org/10.3390/pr11020572