Article

Production and Evaluation of Yogurt Colored with Anthocyanin-Rich Pigment Prepared from Jabuticaba (Myrciaria cauliflora Mart.) Skin

by
Keithy Renata Domingos Machado
1,
Fabricio Luiz Tulini
2,
Judite das Graças Lapa Guimarães
1,
Izabel Cristina Freitas Moraes
1,
Cynthia Ditchfield
1,
Cesar Gonçalves de Lima
1,
Vivian Lara dos Santos Silva
1 and
Carmen Sílvia Favaro-Trindade
1,*
1
Universidade de São Paulo (USP), Faculdade de Zootecnia e Engenharia de Alimentos (FZEA), Departamento de Engenharia de Alimentos (ZEA), Avenida Duque de Caxias Norte, 225, Pirassununga 13635-900, SP, Brazil
2
Universidade Federal do Oeste da Bahia (UFOB), Centro das Ciências Biológicas e da Saúde (CCBS), Rua Professor José Seabra de Lemos–Lado Par, Recanto dos Pássaros, Barreiras 47808-021, BA, Brazil
*
Author to whom correspondence should be addressed.
Processes 2023, 11(2), 526; https://doi.org/10.3390/pr11020526
Submission received: 2 January 2023 / Revised: 2 February 2023 / Accepted: 3 February 2023 / Published: 9 February 2023

Abstract

:
Yogurt is known as a healthy food, but some synthetic additives that are commonly added to it can be one of the factors that restricts yogurt’s consumption. The aims of this study were to prepare and evaluate yogurts with the addition of spray-dried, anthocyanin-rich colorant extracted from jabuticaba (Myrciaria cauliflora Mart.) skin. The concentrated extract was spray-dried using maltodextrin (20 g/100 g w/w) as a carrier and added to yogurts in the concentrations of 0.5, 1.0, 1.5, and 2.0 g/100 g w/w. The yogurts were stored for up to 28 days under refrigeration and periodically evaluated. Except for the yogurts to which 1.5 g of extract was added, all samples had a slight pH reduction in the first 7 days of storage. Throughout the yogurts’ storage period, the anthocyanin and a* values were slightly reduced (p < 0.05), indicating some anthocyanin instability. The rheological behavior was typical for yogurts, but the casein gel network was probably disrupted by the jabuticaba extract incorporation, reducing the yogurt’s apparent viscosity. Panelists showed good acceptance for the attributes of taste, color, aroma, appearance, texture, and overall impression, indicating that this natural pigment has the potential to be a substitute synthetic color additive for the production of mixed berry yogurts, contributing to the reduction of waste.

1. Introduction

The global yogurt market is predicted to register a Compound Annual Growth Rate (CAGR) of 4.5% during the period of 2019–2024 and is projected to reach USD 106.6 billion by 2024 [1]. The main drivers for this are the association of yogurt with a healthy lifestyle and the increasing consumer awareness of health and diet. However, some synthetic compounds, usually found in yogurts, are one of the few factors expected to limit these products’ consumption [2], therefore limiting market growth. This increases the demand for natural food additives and ongoing research for new sources.
Many food processing industrial by-products are rich sources of additives and bioactive compounds, including some substances that possess both functions (additive and bioactive), such as anthocyanins, that can be employed as colorants, antioxidants, and antimicrobials and have many biological properties [3]. Jabuticaba is a Brazilian fruit with white pulp and black, anthocyanin-rich skin [4]. Jabuticaba skin is a processing by-product whose disposal can cause environmental impact. Employment of this by-product could reduce environmental impact, aggregate value to this fruit processing chain, satisfy consumer demands for natural additives, and provide lower-cost additive alternatives for food industries [5].
Ingredients based on anthocyanins present several desirable characteristics since they act as antioxidants and have numerous health benefits. Anthocyanins can interrupt or reverse carcinogenesis, operating on intracellular signaling molecules associated with cancer initiation and/or propagation [6].
Synthetic color additives approved by Brazilian legislation include tartrazine, sunset yellow, ponceau 4R, red 40, Bordeaux S, erythrosine, and indigotine. However, there are concerns related to their toxicity and other health risks and the number of approved pigments is decreasing as they are gradually substituted by natural pigments. The main natural color additives employed by the food industry are annatto extracts, cochineal extract, curcumin, anthocyanins, and betalains [7]. Anthocyanins can be used as pigments in foods that do not undergo thermal treatment, have a short shelf-life, and whose packaging presents low light, oxygen, and moisture transmission [8]. The anthocyanin-rich pigment extracted from jabuticaba skin could therefore be employed in yogurts [9].
Anthocyanins are water-soluble, which is desirable for pigment production. Recently, their applications as natural color additives have increased as their color and stability properties have improved [10,11,12,13,14,15]. There are some factors that can affect anthocyanin application, such as product exposure to oxygen, high temperatures, light, extreme pH, and the presence of enzymes and metals [16].
Previous works have studied how to prepare the powdered pigment extracted from jabuticaba skins encapsulated by spray-drying [12,17]. The powdered pigment presented intense pink coloration and antioxidant and antimicrobial activity, and the anthocyanins were stable during 120 days of storage. These results indicated that this material could be applied as a natural food additive. The powder was then employed as a color additive in fresh sausage with satisfactory results since the samples with 2% of this pigment presented analogous sensory acceptance to the carmine and control treatments in all attributes but color [17], confirming its potential as a color additive for foods and the necessity for more evaluations of the functionality of this material.
Within this context, the aim of this study was to analyze the effect of the addition of this powdered extract in plain sweetened whole-fat yogurt on pH, total solids content, anthocyanin content, instrumental color throughout the product shelf-life, as well as rheological properties and sensory acceptance to evaluate the possibility of replacement of the color additives currently employed by the dairy industry with a natural pigment obtained from jabuticaba skin by-product.

2. Material and Methods

2.1. Materials

Jabuticabas from the “Sabará” variety were obtained from the local commerce. Maltodextrin MOR-REX® 1910 DE10 (Ingredion, Mogi-Guaçu, SP, Brazil) was employed as carrier for extract spray-drying. For the preliminary assays and sensory analysis, plain whole-fat sweetened yogurt was donated by the company Letti SA (Descalvado, SP, Brazil). For the other analyses, plain whole-fat sweetened yogurt was bought from the local commerce (Danone Ltd.a., Poços de Caldas/MG, Brazil). The flavor additive used for sensory analysis was also donated by the company Letti SA (Descalvado, SP, Brazil). Analytical-grade potassium sorbate (C6H7KO2, Dinâmica Química Contemporânea Ltd.a., Diadema, SP, Brazil) was used as preservative.

2.2. Production of the Jabuticaba Skin Extract

Approximately 5 kg of jabuticaba were washed and blanched in boiling water for 5 min. After blanching, the fruit was peeled, and the skins were separated from the pulp. The pigment was extracted according to Silva et al. [12]. Water was added at a ratio of 3 L of water to 1 kg of jabuticaba skins (3:1 w/v) and mechanically agitated for 8 h at room temperature, resulting in an aqueous extract. The extract was filtered in cotton cloth to remove solid residues and concentrated in a rotary evaporator at 60 °C and set to reach room temperature. Maltodextrin was added to the concentrated aqueous extract at a concentration of 20 g/100 g (w/w) and spray dried (Terroni, São Carlos, SP, Brazil) at 150 °C with a flow rate of 30 mL/min.

2.3. Yogurt Preparation

On the first day (day 0), the plain yogurt was mixed with the powdered extract at the concentration levels 0.5, 1.0, 1.5, and 2.0 g/100 g (w/w). A control sample without extract addition was also prepared for comparison. Potassium sorbate was added along with the extract at the following amounts: 2.5 mg for the sample with 0.5 g/100 g of extract; 5.0 mg for the sample with 1.0 g/100 g of extract; 7.5 mg for the sample with 1.5 g/100 g of extract; and 10.0 mg for the sample with 2.0 g/100 g of extract. According to Brazilian regulations (CNS/MS Resolution Nº 04), the maximum level for potassium sorbate (INS 202) addition to fruit products added to yogurts is 0.20 g/100 g [18]. A mixer (Philips Walita RI1364 400 W) was employed to blend the extract and potassium sorbate with the yogurt, causing disruption of the gel. The control sample was also beaten to avoid differences. The samples were stored in plastic bottles and kept refrigerated in the dark. Analyses were carried out periodically (on days 0, 7, 14, 21, and 28 of storage) at least in triplicate (except for sensory analysis).

2.4. pH and Total Solids

pH was measured using a potentiometer (model PG 2000, Gehaka, São Paulo, SP, Brazil) [19], and the total solids content was calculated by difference from moisture, determined using a moisture analyzer balance (model MB35, Ohaus, Greifensee, Switzerland) [12].

2.5. Anthocyanin Content

To determine anthocyanin content in yogurt, an extract was prepared by centrifuging yogurt in a centrifuge (model 5430 R, Eppendorf, Stevenage, UK) with ethanol and HCl 1.5 M at the ratio 1:5 (w/v), respectively, for 5 min, at 5000 rpm, according to a method adapted from Francis [20]. A 1.0 mL sample of the centrifuged extract was added to 4.0 mL of potassium chloride buffer (pH 1.0) in test tubes, homogenized, and stored for 15 min in the absence of light. Absorbance was measured at 535 nm using a spectrophotometer (model DR 2800, Hach, Düsseldorf, Germany), with potassium chloride buffer as blank. Total anthocyanin content was expressed as cyanidin-3-glucoside using the absorption coefficient (ε) 982 L mol−1 cm−1 [21] and Equation (1).
a n t h o c y a n i n s mg kg = A × V × 10 3 ε × L × m × 10 3
where:
A = absorbance at 535 nm
V = extraction volume (L)
L = cuvette width (cm)
m= sample weight (g)

2.6. Instrumental Color Analysis

Color was measured with a Miniscan XE Plus colorimeter (HunterLab, Reston, VA, USA) in yogurt samples placed in Petri dishes. The CIEL*a*b* parameters were determined: L* (luminosity), a* (red/green color component), and b* (yellow/blue color component). Chroma (C*) was calculated from the L*, a*, and b* values. The observer angle was 10°, and a D65 standard illuminant was used.

2.7. Flow Curves

Flow curves were obtained for yogurt (control sample and samples containing the extract at the different concentration levels) with a rheometer (AR2000 Advanced Rheometer; TA Instruments, New Castle, DE, USA) after 14 days of refrigerated storage. A concentric cylinder geometry was employed (inner radius = 14.0 mm; outer radius = 15.0 mm; height = 42.0 mm, and gap 5920 μm). Yogurts were analyzed at 10 °C and were allowed to equilibrate for 2 min after loading before each assay. The shear rate was increased from 0.01 to 300 s−1 and decreased in the same manner. Rheology Advantage Data Analysis V.5.3.1 (TA Instruments) was the software used for data analysis.

2.8. Yogurt Sensory Acceptance

Sensory acceptance assay was evaluated for yogurts containing 0.5 g/100 g (w/w) of pigment and 0.4 mL/100 mL (v/v) of flavor additive according to the results of a preliminary assay. A mixer (Philips Walita RI1364 400 W, Largo do Arouche, SP, Brazil) was used to blend the yogurt and additives. The analysis was performed in the Laboratory of Sensory Analysis of the Food Engineering Department in individual cabins with fluorescent lights. A total of 131 untrained panelists were recruited based on their interest in collaborating with this research and selected according to their yogurt consumption frequency (at least once a week). The sample was served refrigerated (4 to 8 °C) in 50 mL coded plastic cups. A nine-point hedonic scale was applied to determine sensory acceptance [22]; the values 1 to 9 represented “dislike extremely” to “like extremely”. The attributes were taste, appearance, aroma, color, texture, and overall acceptance. The analysis with humans was previously approved by the Ethics in Research Committee of the Faculty of Animal Science and Food Engineering of the University of São Paulo, SP, Brazil (protocol number 08111219.3.0000.5422).

2.9. Statistical Analysis

The data were submitted to ANOVA, with the MIXED procedure, and when significant differences were perceived (p < 0.05), regression tests were applied. The observation means were compared using the GLIMMIX procedure, using Tukey’s multiple comparison test (α = 0.05). The program SAS v. 9.1.3 (SAS Institute, 2004) was employed.

3. Results and Discussion

The appearance of the yogurts after blending with the jabuticaba skin powdered extract at concentration levels 0.5, 1.0, 1.5, and 2.0 g/100 g (w/w) is shown in Figure 1. The extract was dispersed homogeneously within the product with no sediments or stains. As expected, the produced color became more intense with the increasing extract concentrations. The extract was therefore able to impart color to the yogurts.

3.1. Influence of Pigment Addition on pH and Total Solids and Variation during Storage

Table 1 contains the results for pH variation during storage. Comparing pH values on the first day, concentration level 2.0 g/100 g presented lower value than the control, but 0.5, 1.0 and 1.5 g/100 g were statistically similar to the control, so this effect is not necessarily related to the pigment addition. Analyzing pH variation during the storage period, the variation was small, and no post-acidification was observed. pH reduction during storage is usually attributed to lactose consumption by Lactobacillus delbrueckii subsp. bulgaricus, with the consequent production of lactic acid, altering the product’s sensory characteristics. The initial pH of the product was low, approximately 4.2, which might indicate that there was little lactose present to promote lactic culture metabolic activity. The pH values are consistent with those determined for yogurts (between 4.2 and 4.5) [23]. It was verified that shorter storage times were associated with increased acidity and lower pH values [24]. During the first 7 days, there was a pH reduction, which may be due to the proteolytic activity that occurs in the first hours of fermentation and releases amino acid in the mean [25]. After that period, pH values were greater than the initial values (except for the 1.5 g/100 g extract concentration), which can be associated with the consumption of the free amino acid released in the first period of storage [25]. The yogurts’ total solids content varied between 21 and 24 g/100 g, and there was no clear correlation to the increase in extract concentration. According to Tamime & Robinson [26], plain whole-fat yogurts have between 23 and 25 g/100 g of total solids.

3.2. Anthocyanin Content and Stability during Storage

The anthocyanin content of all samples (except for the control that had no extract addition) is presented in Table 2. Initially, the content varied from 1.26 to 4.83 mg cyanidin-3-glucoside equivalent, according to the increase of extract concentration added. The addition of 0.5, 1.0, and 1.5 g/100 g of the extract showed a similar behavior during storage, with a statistically significant decrease in anthocyanin content with time. This result indicates that this pigment may have undergone some degradation, which could lead to loss of its biological activity, and change of product color. The yogurt with a concentration of 2.0 g/100 g, however, adjusted to a line with a positive slope, while the others presented a negative slope. Despite the positive slope, there was no significant difference in the anthocyanin values of the yogurt containing 2.0 g/100 g of extract after 14, 21, and 28 days of refrigerated storage.

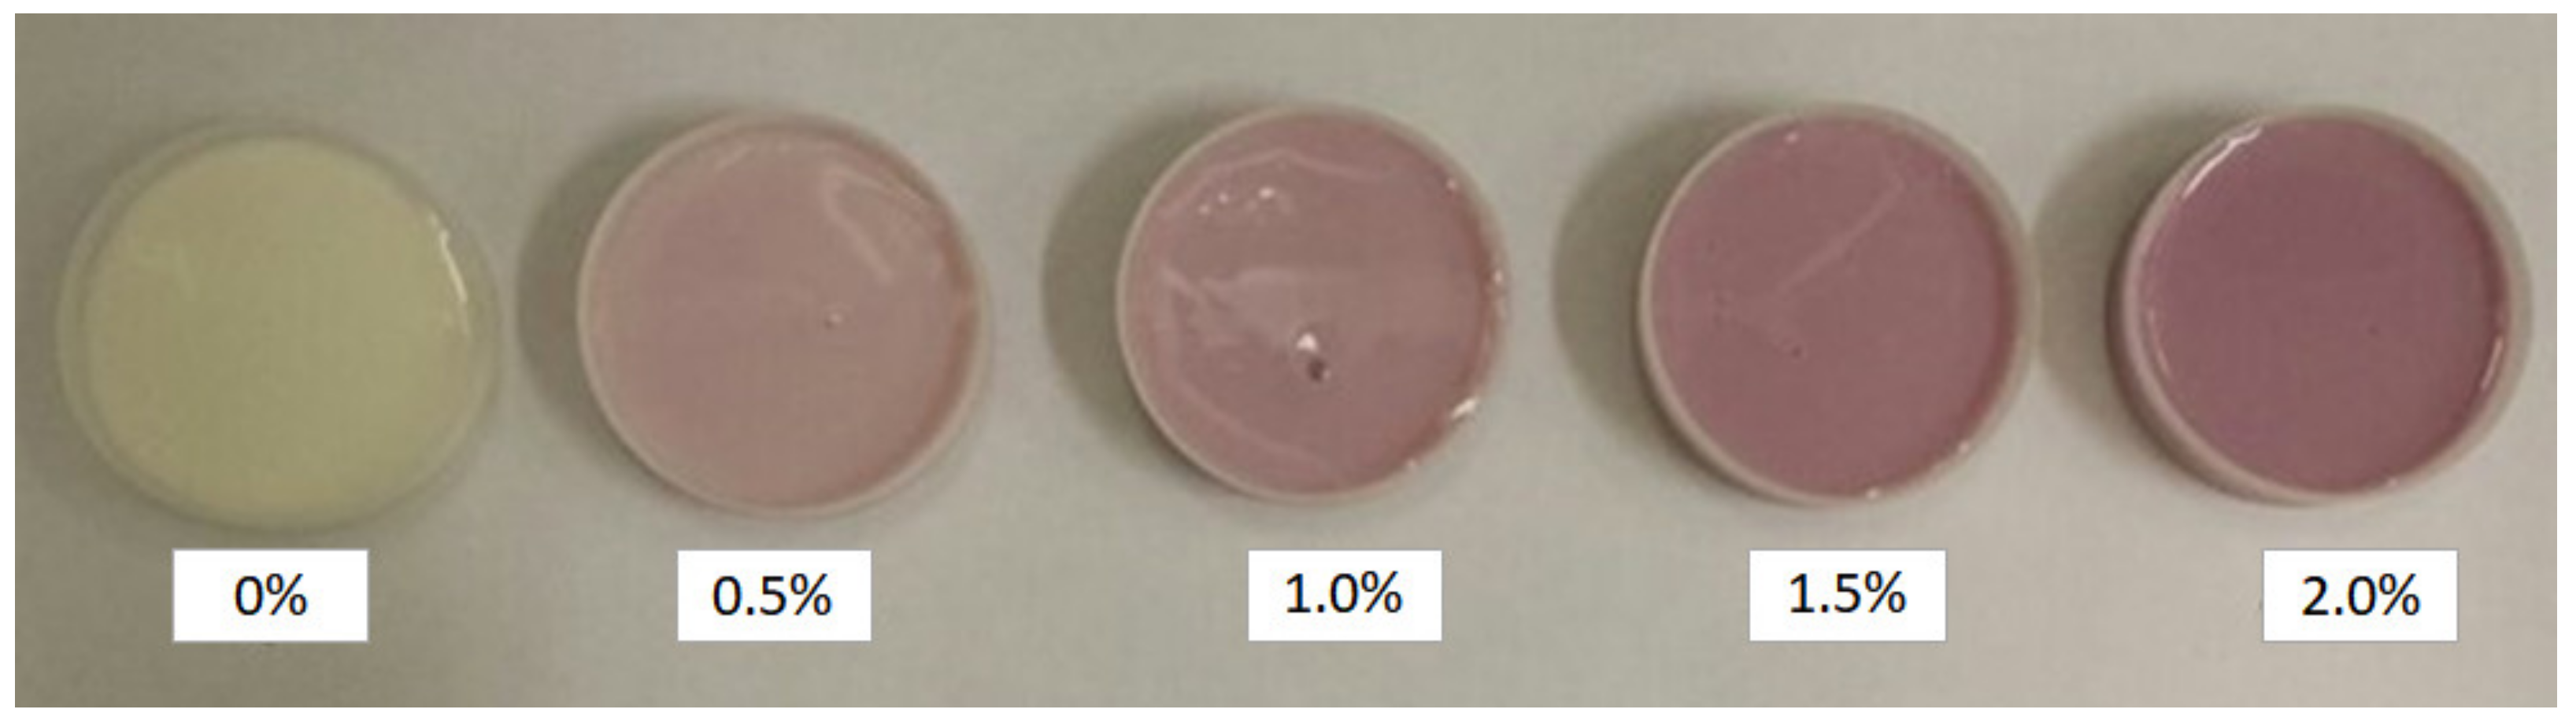
3.3. Instrumental Color Analysis and Stability during Storage
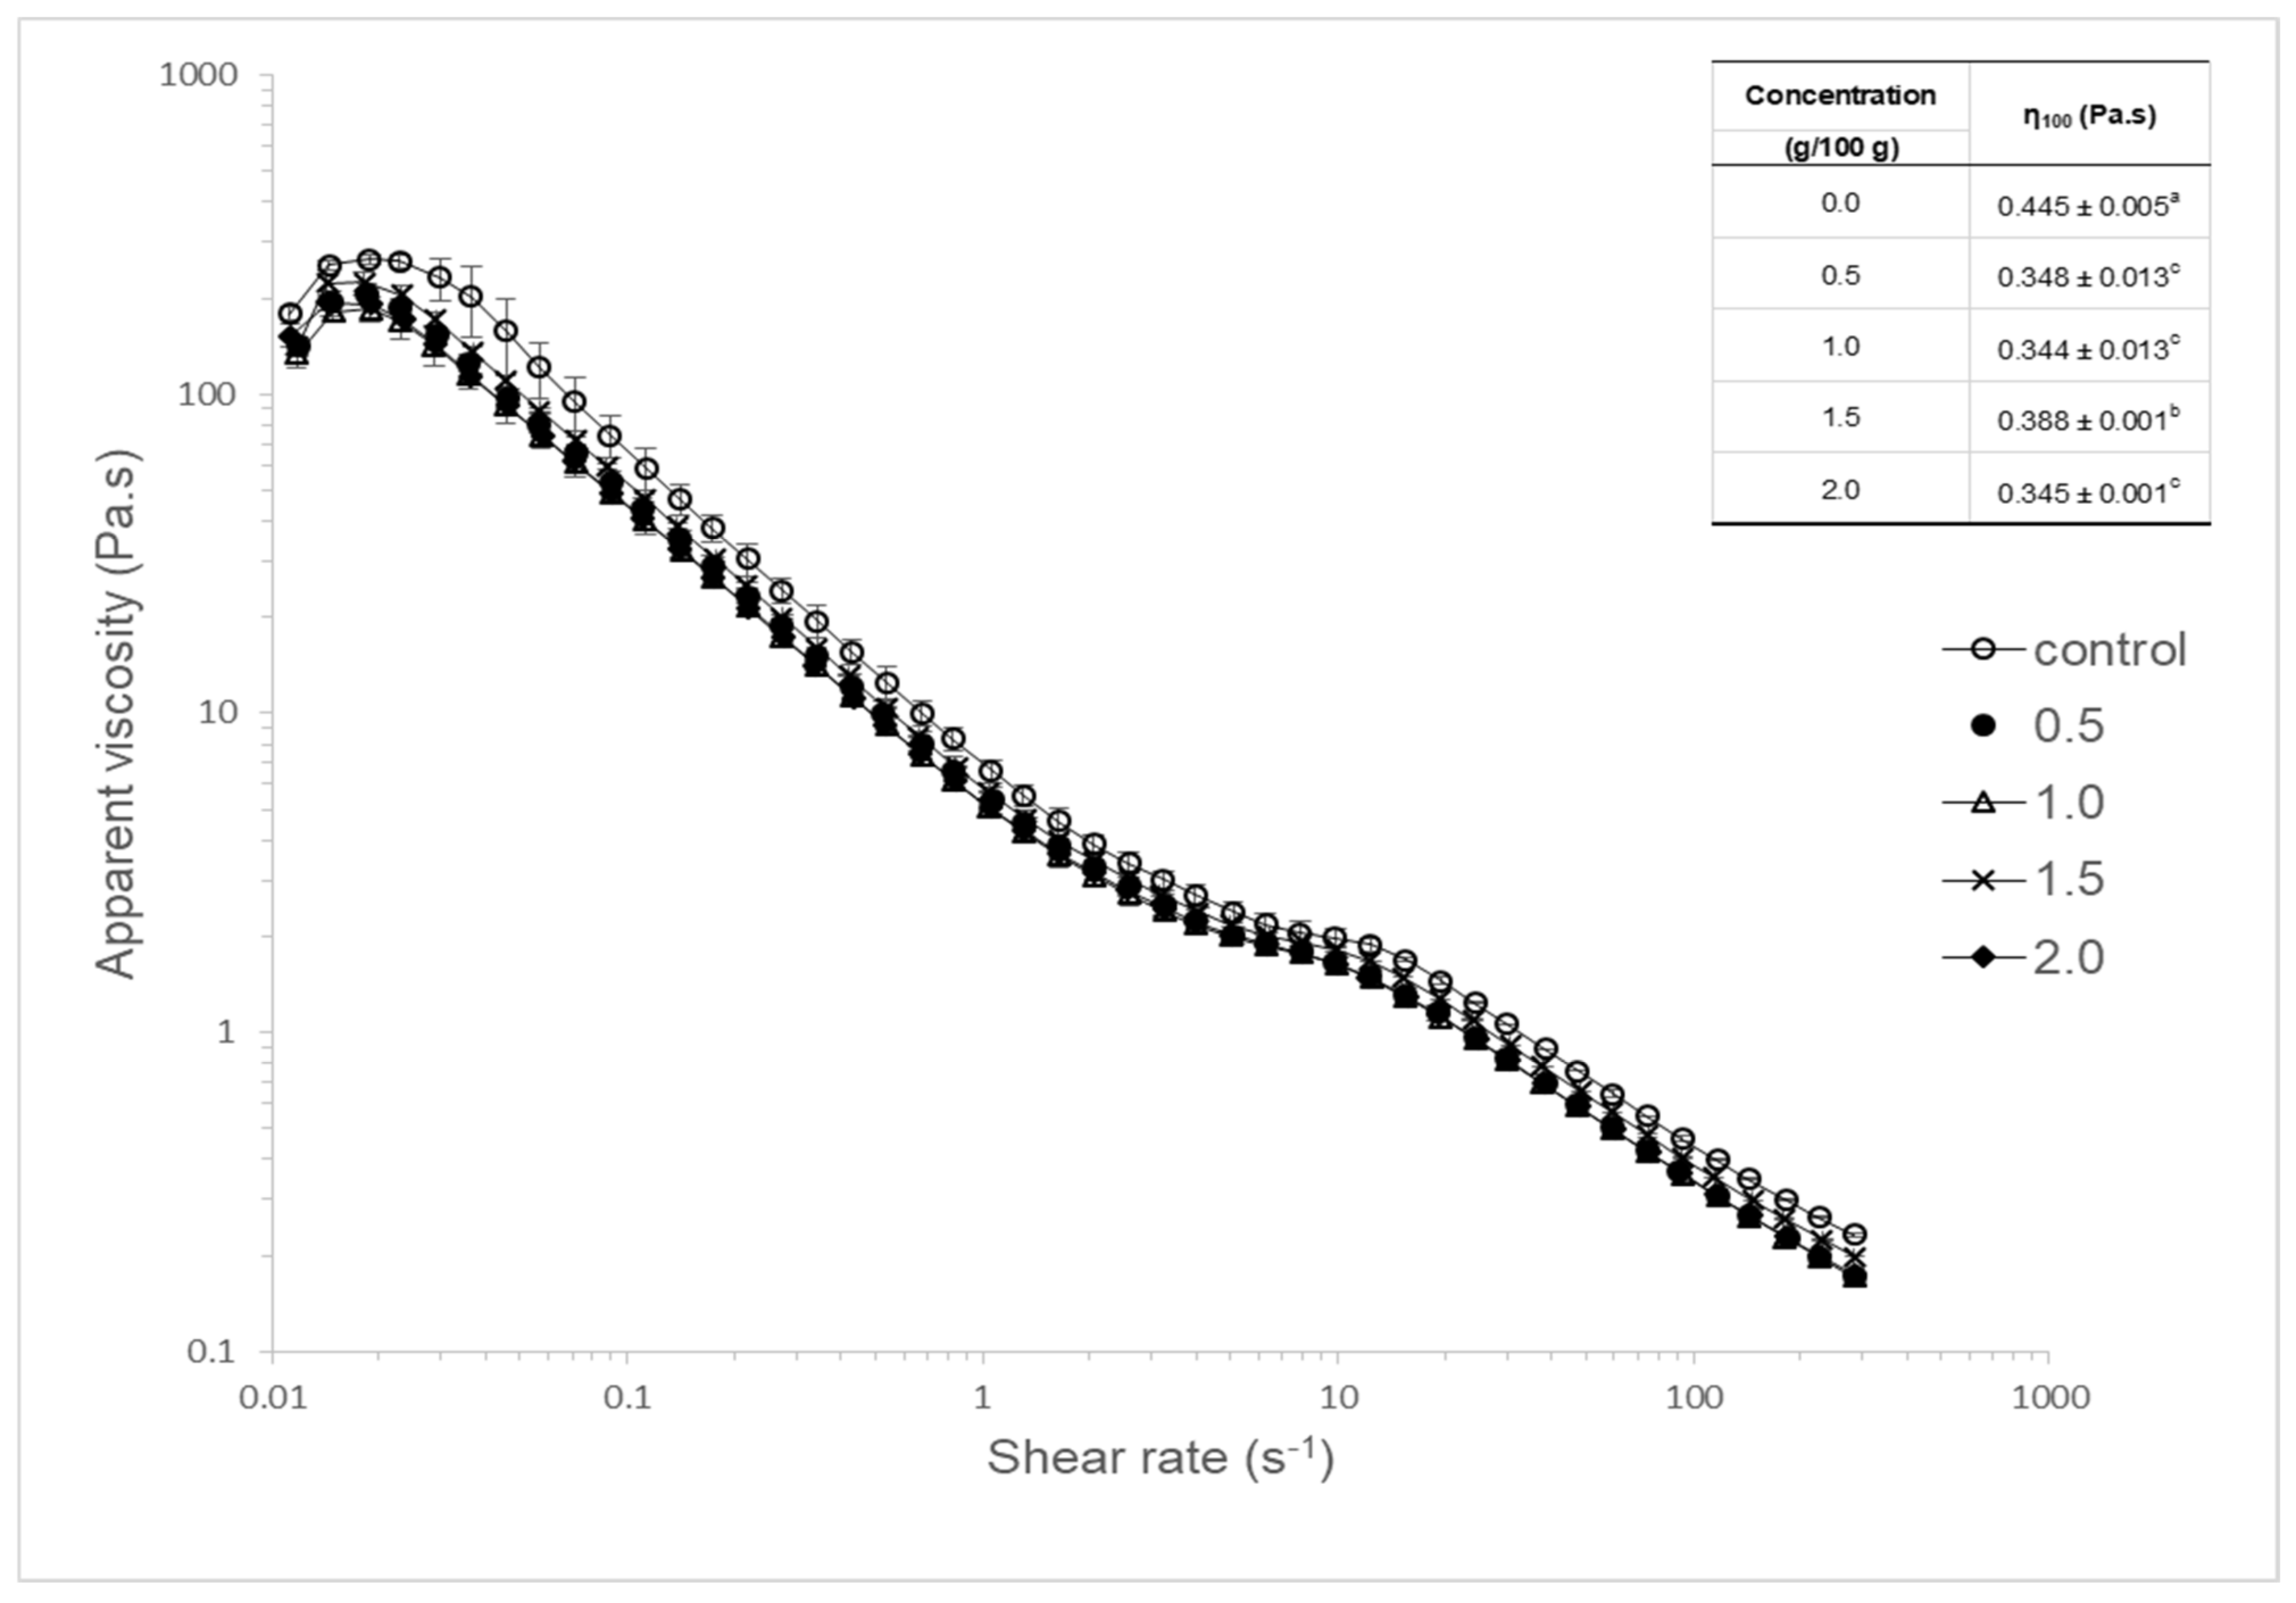
The color parameters L*, a*, b*, and C* are shown in Table 3. Analyzing color parameter L* of the samples, it can be noticed that extract addition significantly (p < 0.05) decreased yogurt luminosity with progressively lower values with increasing extract concentration. This agrees with the sample appearance shown in Figure 1 since the color became visually darker with increasing extract addition and the anthocyanin content shown in Table 2 since the anthocyanins impart color to the samples. When looking at the storage period, L* varied for all concentration levels, but although these variations were considered statistically significant (p < 0.05), the behavior was similar for all samples and slight, so from a technological point of view, it should not affect visual perception.
The a* color component was very sensitive to extract addition and changed during the storage; even at the lowest concentration (0.5 g/100 g), the value changed from negative to positive, indicating the predominance of a red color. Increasing the extract concentration produced yogurts with significantly greater a* values, and these differences were observed throughout the storage period. In general, a* was reduced during storage, especially for the higher concentration levels, which could indicate anthocyanin degradation. These results correlate with anthocyanin content presented in Table 2, for the 0.5 g/100 g concentration level, there was no significant decrease in content during storage despite the significant variation in a* values up to 28 days of storage.
The b* color component tended to decrease with extract addition and concentration. For concentrations above 1.0 g/100 g, the values changed from positive to negative, indicating a predominantly blue color. The powdered jabuticaba skin extract has a pink color but according to Terci & Rossi [27], anthocyanins present a light purple color at acidic pH values (pH~4,0). The b* values changed significantly during storage but with no clear tendency.
Chroma (C*) indicates color intensity so the samples with greater extract concentrations also presented higher C* values. These results are related to sample appearance (Figure 1) and to anthocyanin determination. The C* values are calculated from a* and b* values and so a direct relation is expected. Regarding its variation during storage, it presented a tendency to decrease with storage time as observed with a* values, probably due to anthocyanin degradation.
In order to evaluate yogurt color with jabuticaba extract addition, and since the objective is to replace artificial color additives, the comparison with color parameters of fruit flavor yogurts can verify the substitution potential. Jaros & Rohm [28] studied the color parameters of commercial strawberry-flavored yogurts and obtained average values of 67.84 ± 1.66 for L*, 7.41 ± 4.81 for a*, and 3.29 ± 1.92 for b*. For blueberry yogurt with an artificial color additive, the values were 65.4 ± 0.6 for L*, 10.0 ± 0.2 for a*, and −3.47 ± 0.1 for b* [29]. Based on these values, the jabuticaba skin extract could be used as a color additive in mixed berry yogurt since the L*, a*, and b* color parameters for the samples with 0.5 g/100 g of extract at the start of the storage period (day 0) were between those determined for the strawberry and blueberry yogurts (62.98 ± 0.01, 4.00 ± 0.08 and 0.03 ± 0.03, respectively).

3.4. Flow Curves

The rheological behavior observed in Figure 2 was typical for yogurts, as reported by other authors [30,31,32,33,34]. The yogurts presented an increase in apparent viscosity at low shear rates due to viscoelasticity (solid gel-like structure), but once the yield stress was reached, a non-Newtonian time-dependent shear thinning behavior was observed. The down curves did not present this increase in apparent viscosity at low shear rates because the structure had already been disrupted by the up curve [31,34]. The extract addition at different concentration levels did not alter the observed rheological behavior since the viscosity curves almost overlapped.
Yogurt is a gel network of casein micelles containing entrapped water [35] whose apparent viscosity depends on the casein micelle structure, its spatial distribution, and the strength and number of bonds between the micelles [36]. The jabuticaba extract addition probably disrupted the casein gel network, therefore decreasing the yogurts’ apparent viscosity, as shown in Figure 2. Izadi et al. [35] observed a similar decrease in apparent viscosity when comparing a phytosterol-enriched yogurt to the control.
There have been many attempts to correlate viscosity data to sensory perception (thickness and creaminess). In-mouth movements have been correlated to viscosity at a shear rate of 100 s−1. The results presented in Figure 2 show that the viscosities at 100 s−1 were significantly lower (p < 0.05) for samples containing jabuticaba extract when compared to the control. Laiho et al. [31] reported a viscosity of 0.40 Pa.s at a shear rate of 100 s−1 for fat-free stirred yogurt with 50% of whey protein isolate, while Ng et al. [32] obtained values between 0.1 Pa.s to 0.5 Pa.s for stirred yogurts with different functional ingredients, so the results in Figure 2 are close to the typical range for stirred yogurts.

3.5. Yogurt Sensory Acceptance

To evaluate sensory acceptance, yogurt samples containing 0.5 g/100 g of jabuticaba skin powdered extract were produced. This concentration was chosen because its color would be similar to a mixed berry commercial product; it presented greater stability during storage (lower anthocyanin degradation), as well as a lower production cost due to the reduced extract concentration.
The sensory evaluation results presented in Table 4 show that panelists attributed scores between 7 and 8, (“like moderately” and “like very much”) for all attributes, indicating that the product was well accepted. Although the extract addition lowered yogurt viscosity at a shear rate of 100 s−1, the average score for texture was 7.7, indicating that consumers perceived viscosity as expected for a stirred yogurt. Therefore, jabuticaba skin extract could be used as a mixed berry yogurt color additive since the panelists did not perceive negative effects on the attributes of appearance, color, aroma, texture, taste, and overall impression. This result was similar to that obtained by Pereira et al. [37] when evaluating sensory acceptance of Petit Suisse cheese with jabuticaba skin extract and the ones reported by Rubio et al. [38] when these authors colored yogurts using colorants extracted from grape pomace and jabuticaba by-products and encapsulated by spray-drying using brewer’s spent yeast as carrier.

4. Conclusions

The results indicate that jabuticaba skin powdered extract did not significantly affect the pH and total solids content of sweetened plain whole-fat yogurts. The anthocyanin content increased with extract addition and the extract imparted color to the yogurts as verified by the instrumental color analysis. Since the anthocyanin content was slightly affected throughout the refrigerated storage period (28 days), there was little variation in the color parameters. The color parameters were like those of commercial mixed berry yogurts. The yogurts’ apparent viscosity was lowered with the extract addition, but the rheological behavior was the same as for the control. The sensory acceptance test showed that the product attributes of appearance, color, aroma, texture, taste, and overall impression were positively evaluated by the panelists. Therefore, this extract can potentially be used as a substitute for the color additives currently employed for mixed berry yogurts with the advantage of reducing waste, increasing antioxidant content, and constituting a natural vegetable-based alternative to existing color additives.

Author Contributions

Conceptualization, K.R.D.M. and C.S.F.-T.; methodology, K.R.D.M., F.L.T., J.G.L.G., I.C.F.M., C.D., C.G.L. and V.L.S.S.; formal analysis, K.R.D.M.; investigation, K.R.D.M. and F.L.T.; data curation, K.R.D.M., F.L.T., J.G.L.G., I.C.F.M., C.D., C.G.L. and V.L.S.S.; writing—original draft preparation, K.R.D.M., F.L.T., J.G.L.G., I.C.F.M., C.D. and C.S.F.-T.; writing—review and editing, K.R.D.M. and C.S.F.-T.; supervision, C.S.F.-T. All authors have read and agreed to the published version of the manuscript.

Funding

This research received no external funding.

Data Availability Statement

Not applicable.

Acknowledgments

Authors thank Coordenação de Aperfeiçoamento de Pessoal de Nível Superior–Brazil (CAPES)–Finance Code 001.

Conflicts of Interest

The authors declare no conflict of interest.

Correction Statement

This article has been republished with a minor correction to the author name and Author Contributions. This change does not affect the scientific content of the article.

References

  1. Mordor Intelligence Yogurt Market—Growth, Trends and Forecasts (2019–2024). Available online: https://www.mordorintelligence.com/industry-reports/yogurt-market?gclid=EAIaIQobChMI2canxanx4gIVDguRCh3WaQS7EAAYASAAEgKgGPD_BwE (accessed on 6 May 2019).
  2. Tetra Pak Consumer Yoghurt Trends and What They Mean for Producers. Available online: https://www.tetrapak.com/insights/cases-articles/consumer-yoghurt-trends (accessed on 11 January 2023).
  3. Ferretti, G.; Bacchetti, T.; Belleggia, A.; Neri, D. Cherry Antioxidants: From Farm to Table. Molecules 2010, 15, 6993–7005. [Google Scholar] [CrossRef] [PubMed]
  4. Boari Lima, A.J.; Duarte Corrêa, A.; Carvalho Alves, A.P.; Patto Abreu, C.M.; Dantas-Barros, A.M. Caracterização Química Do Fruto Jabuticaba (Myrciaria Cauliflora Berg) e de Suas Frações. Arch. Lat. Nutr. 2008, 58, 416–421. [Google Scholar]
  5. Ueda, J.M.; Pedrosa, M.C.; Heleno, S.A.; Carocho, M.; Ferreira, I.C.F.R.; Barros, L. Food Additives from Fruit and Vegetable By-Products and Bio-Residues: A Comprehensive Review Focused on Sustainability. Sustainability 2022, 14, 5212. [Google Scholar] [CrossRef]
  6. Bakowska-Barczak, A.M.; Kolodziejczyk, P.P. Black Currant Polyphenols: Their Storage Stability and Microencapsulation. Ind. Crop. Prod. 2011, 34, 1301–1309. [Google Scholar] [CrossRef]
  7. Silva, G.J.F.; Constant, P.B.L.; Figueiredo, R.W.; Moura, S.M. Formulação e Estabilidade de Corantes de Antocianinas Extraídas Das Cascas de Jabuticaba (Myrciaria ssp.). Alim. Nutr. Araraquara 2010, 21, 429–436. [Google Scholar]
  8. Fennema, O.R. Química de Los Alimentos, 2nd ed.; Acribia Editorial: Zaragoza, Spain, 2000. [Google Scholar]
  9. Santos, D.T.; Veggi, P.C.; Meireles, M.A.A. Extraction of Antioxidant Compounds from Jabuticaba (Myrciaria cauliflora) Skins: Yield, Composition and Economical Evaluation. J. Food Eng. 2010, 101, 23–31. [Google Scholar] [CrossRef]
  10. Rosso, V.V.; Mercadante, A.Z. Evaluation of Colour and Stability of Anthocyanins from Tropical Fruits in an Isotonic Soft Drink System. Innov. Food Sci. Emerg. Technol. 2007, 8, 347–352. [Google Scholar] [CrossRef]
  11. Silva, F.C.; Fonseca, C.R.; Alencar, S.M.; Thomazini, M.; Carvalho Balieiro, J.C.; Pittia, P.; Fávaro-Trindade, C.S. Assessment of Production Efficiency, Physicochemical Properties and Storage Stability of Spray-Dried Propolis, a Natural Food Additive, Using Gum Arabic and OSA Starch-Based Carrier Systems. Food Bioprod. Process. 2013, 91, 28–36. [Google Scholar] [CrossRef]
  12. Silva, M.C.; Souza, V.B.; Thomazini, M.; Silva, E.R.; Smaniotto, T.; Carvalho, R.A.; Genovese, M.I.; Favaro-Trindade, C.S. Use of the Jabuticaba (Myrciaria cauliflora) Depulping Residue to Produce a Natural Pigment Powder with Functional Properties. LWT-Food Sci. Technol. 2014, 55, 203–209. [Google Scholar] [CrossRef]
  13. Souza, V.B.; Fujita, A.; Thomazini, M.; Silva, E.R.; Lucon, J.F.; Genovese, M.I.; Favaro-Trindade, C.S. Functional Properties and Stability of Spray-Dried Pigments from Bordo Grape (Vitis labrusca) Winemaking Pomace. Food Chem. 2014, 164, 380–386. [Google Scholar] [CrossRef]
  14. Valle Calomeni, A.; Souza, V.B.; Tulini, F.L.; Thomazini, M.; Ostroschi, L.C.; Alencar, S.M.; Massarioli, A.P.; Carvalho Balieiro, J.C.; Carvalho, R.A.; Favaro-Trindade, C.S. Characterization of Antioxidant and Antimicrobial Properties of Spray-Dried Extracts from Peanut Skins. Food Bioprod. Process. 2017, 105, 215–223. [Google Scholar] [CrossRef]
  15. Voith, M. Coloring Food, Naturally: The effort to eliminate synthetics gives chemists the blues; The American Chemical Society: Washington, DC, USA, 2008; pp. 18–19. [Google Scholar]
  16. Bąkowska, A.; Kucharska, A.Z.; Oszmiański, J. The Effects of Heating, UV Irradiation, and Storage on Stability of the Anthocyanin–Polyphenol Copigment Complex. Food Chem. 2003, 81, 349–355. [Google Scholar] [CrossRef]
  17. Baldin, J.C.; Michelin, E.C.; Polizer, Y.J.; Rodrigues, I.; Godoy, S.H.S.; Fregonesi, R.P.; Pires, M.A.; Carvalho, L.T.; Fávaro-Trindade, C.S.; Lima, C.G.; et al. Microencapsulated Jabuticaba (Myrciaria cauliflora) Extract Added to Fresh Sausage as Natural Dye with Antioxidant and Antimicrobial Activity. Meat Sci. 2016, 118, 15–21. [Google Scholar] [CrossRef]
  18. Anvisa Resolução CNS/MS N.o 04, de 24 de Novembro de 1988. Available online: http://portal.anvisa.gov.br/documents/33916/391619/Resolucao_04_1988.pdf/7311a4d9-d5db-44d6-adbd-c7e6891d079d (accessed on 21 February 2019.).
  19. AOAC. Official Methods of Analysis, 16th ed.; Association of Official Analytical Chemists, Ed.; AOAC: Arlington, TX, USA, 1995. [Google Scholar]
  20. Francis, F.J. Analysis of Anthocyanins. In Anthocyanins As Food Colors; Elsevier: Amsterdam, The Netherlands, 1982; pp. 181–207. [Google Scholar]
  21. Zanatta, C.F.; Cuevas, E.; Bobbio, F.O.; Winterhalter, P.; Mercadante, A.Z. Determination of Anthocyanins from Camu-Camu (Myrciaria Dubia) by HPLC−PDA, HPLC−MS, and NMR. J. Agric. Food Chem. 2005, 53, 9531–9535. [Google Scholar] [CrossRef]
  22. Carpenter, R.P.; Lyon, D.H.; Hasdell, T.A. Guidelines for Sensory Analysis in Food Product Development and Quality Control; Aspen Publishers: Boston, MA, USA, 2000; ISBN 0834216426. [Google Scholar]
  23. Moreira, S.R.; Schwan, R.F.; Carvalho, E.P.; Ferreira, C. Análise Microbiológica e Química de Iogurtes Comercializados Em Lavras—MG. Ciência Tecnol. Aliment. 1999, 19, 147–152. [Google Scholar] [CrossRef]
  24. Al-Kadamany, E.; Khattar, M.; Haddad, T.; Toufeili, I. Estimation of Shelf-Life of Concentrated Yogurt by Monitoring Selected Microbiological and Physicochemical Changes during Storage. LWT-Food Sci. Technol. 2003, 36, 407–414. [Google Scholar] [CrossRef]
  25. Akan, E. The Effect of Fermentation Time and Yogurt Bacteria on the Physicochemical, Microbiological and Antioxidant Properties of Probiotic Goat Yogurts. Acad. Bras. Cienc. 2022, 94, e20210875. [Google Scholar] [CrossRef]
  26. Tamime, A.Y.; Robinson, R.K. Yoghurt: Science and Technology; CRC Press: Boca Raton, FL, USA, 1999; ISBN 1855733994. [Google Scholar]
  27. Terci, D.B.L.; Rossi, A.V. Indicadores Naturais de PH: Usar Papel Ou Solução? Quim. Nova 2002, 25, 684–688. [Google Scholar] [CrossRef]
  28. Jaros, D.; Rohm, H. Identification of Sensory Color Optima of Strawberry Yogurt. J. Food Qual. 2001, 24, 79–86. [Google Scholar] [CrossRef]
  29. Wallace, T.C.; Giusti, M.M. Determination of Color, Pigment, and Phenolic Stability in Yogurt Systems Colored with Nonacylated Anthocyanins from Berberis Boliviana L. as Compared to Other Natural/Synthetic Colorants. J. Food. Sci. 2008, 73, C241–C248. [Google Scholar] [CrossRef]
  30. Krzeminski, A.; Großhable, K.; Hinrichs, J. Structural Properties of Stirred Yoghurt as Influenced by Whey Proteins. LWT-Food Sci. Technol. 2011, 44, 2134–2140. [Google Scholar] [CrossRef]
  31. Laiho, S.; Williams, R.P.W.; Poelman, A.; Appelqvist, I.; Logan, A. Effect of Whey Protein Phase Volume on the Tribology, Rheology and Sensory Properties of Fat-Free Stirred Yoghurts. Food Hydrocoll. 2017, 67, 166–177. [Google Scholar] [CrossRef]
  32. Ng, S.B.X.; Nguyen, P.T.M.; Bhandari, B.; Prakash, S. Influence of Different Functional Ingredients on Physical Properties, Rheology, Tribology, and Oral Perceptions of No Fat Stirred Yoghurt. J. Texture Stud. 2018, 49, 274–285. [Google Scholar] [CrossRef] [PubMed]
  33. Nguyen, P.T.M.; Kravchuk, O.; Bhandari, B.; Prakash, S. Effect of Different Hydrocolloids on Texture, Rheology, Tribology and Sensory Perception of Texture and Mouthfeel of Low-Fat Pot-Set Yoghurt. Food Hydrocoll. 2017, 72, 90–104. [Google Scholar] [CrossRef]
  34. Torres, I.C.; Amigo, J.M.; Knudsen, J.C.; Tolkach, A.; Mikkelsen, B.Ø.; Ipsen, R. Rheology and Microstructure of Low-Fat Yoghurt Produced with Whey Protein Microparticles as Fat Replacer. Int. Dairy J. 2018, 81, 62–71. [Google Scholar] [CrossRef]
  35. Izadi, Z.; Nasirpour, A.; Garoosi, G.A.; Tamjidi, F. Rheological and Physical Properties of Yogurt Enriched with Phytosterol during Storage. J. Food Sci. Technol. 2015, 52, 5341–5346. [Google Scholar] [CrossRef]
  36. Lucey, J.A.; Singh, H. Formation and Physical Properties of Acid Milk Gels: A Review. Food Res. Int. 1997, 30, 529–542. [Google Scholar] [CrossRef]
  37. Pereira, E.P.R.; Faria, J.A.F.; Cavalcanti, R.N.; Garcia, R.K.A.; Silva, R.; Esmerino, E.A.; Cappato, L.P.; Arellano, D.B.; Raices, R.S.L.; Silva, M.C.; et al. Oxidative Stress in Probiotic Petit Suisse: Is the Jabuticaba Skin Extract a Potential Option? Food Res. Int. 2016, 81, 149–156. [Google Scholar] [CrossRef]
  38. Rubio, F.T.V.; Haminiuk, C.W.I.; Santos, M.M.; Thomazini, M.; Moraes, I.C.F.; Martelli-Tosi, M.; Fávaro-Trindade, C.S. Development of Natural Pigments Microencapsulated in Waste Yeast Saccharomyces Cerevisiae Using Spray Drying Technology and Their Application in Yogurt. Food Funct 2021, 12, 8946–8959. [Google Scholar] [CrossRef]
Figure 1. Appearance of the sweetened plain whole-fat yogurt control sample (0%, without pigment) and samples with jabuticaba skin powdered extract addition at different concentration levels immediately after blending (w/w).
Processes 11 00526 g001
Figure 2. Apparent viscosity of sweetened plain whole-fat yogurts with addition of jabuticaba skin powdered extract at different concentration levels (control-0.0, 0.5, 1.0, 1.5, and 2.0 g/100 g) after 14 days of refrigerated storage with increasing shear rate (up flow curve). Apparent viscosity at a shear rate of 100 s−1100). Means ± standard deviation. Means in the same column followed by same lower-case letter do not differ significantly (p > 0.05) according to Tukey’s multiple comparison test.
Processes 11 00526 g002
Table 1. pH values of sweetened plain whole-fat yogurts with addition of jabuticaba skin powdered extract at different concentration levels during refrigerated storage.
Concentration (g/100 g)Time (days)
07142128
0.04.27 ± 0.01 ab,C4.26 ± 0.05 a,C4.30 ± 0.04 a,BC4.36 ± 0.05 a,B4.54 ± 0.06 a,A
0.54.27 ± 0.01 ab,C4.20 ± 0.02 ab,D4.28 ± 0.02 ab,C4.36 ± 0.03 a,B4.45 ± 0.02 b,A
1.04.23 ± 0.01 bc,B4.20 ± 0.03 ab,B4.23 ± 0.02 bc,BC4.28 ± 0.03 b,B4.36 ± 0.02 c,A
1.54.30 ± 0.03 a,A4.16 ± 0.02 b,B4.21 ± 0.03 c,B4.25 ± 0.01 b,A4.34 ± 0.01 c,A
2.04.17 ± 0.01 c,C4.16 ± 0.02 b,C4.19 ± 0.02 c,BC4.24 ± 0.01 b,B4.33 ± 0.01 c,A
Means ± standard deviation. Means in the same column followed by same lowercase letter and means in the same row followed by the same upper case letter do not differ significantly (p > 0.05) according to Tukey’s multiple comparison test.
Table 2. Anthocyanin (mg cyanidine-3-glucoside/kg sample) extracted from sweetened plain whole-fat yogurts with addition of jabuticaba skin powdered extract at different concentration levels during refrigerated storage.
Concentration (g/100 g)Time (days)
07142128
0.51.26 ± 0.26 c,A1.54 ± 0.16 d,A1.37 ± 0.13 c,A1.32 ± 0.03 d,A1.03 ± 0.12 c,A
1.03.21 ± 0.17 b,A2.50 ± 0.14 c,AB2.32 ± 0.10 b,B2.22 ± 0.19 c,B2.09 ± 0.27 b,B
1.54.68 ± 0.17 a,A3.65 ± 0.52 b,BC3.87 ± 0.60 a,BC3.12 ± 0.41 b,C3.98 ± 0.30 a,AB
2.04.83 ± 0.47 a,B5.87 ± 0.05 a,A4.55 ± 0.35 a,B4.80 ± 0.19 a,B4.54 ± 0.71 a,B
Means ± standard deviation. Means in the same column followed by same lowercase letter and means in the same row followed by the same upper case letter do not differ significantly (p > 0.05) according to Tukey’s multiple comparison test.
Table 3. Color parameters L*, a*, b*, and C* of sweetened plain whole-fat yogurts with addition of jabuticaba skin powdered extract at different concentration levels during refrigerated storage.
L* (Luminosity)
Concentration (g/100 g)Time (Days)
07142128
0.070.40 ± 0.01 a,C72.15 ± 0.21 a,A70.67 ± 0.04 a,B70.73 ± 0.02 a,B69.84 ± 0.06 a,D
0.562.98 ± 0.01 b,D65.41 ± 0.03 b,A63.44 ± 0.05 b,C63.97 ± 0.04 b,B62.67 ± 0.04 b,E
1.058.90 ± 0.05 c,D61.21 ± 0.06 c,A59.23 ± 0.04 c,C59.90 ± 0.01 c,B58.58 ± 0.30 c,E
1.555.96 ± 0.06 d,D58.37 ± 0.01 d,A56.19 ± 0.04 d,C56.93 ± 0.03 d,B55.32 ± 0.04 d,E
2.053.10 ± 0.03 e,D55.49 ± 0.02 e,A53.30 ± 0.02 e,C54.48 ± 0.03 e,B52.63 ± 0.02 e,E
a* (red/green color component)
Concentration (g/100 g)Time (days)
07142128
0.0−1.69 ± 0.01 e,B−1.58 ± 0.01 e,A−1.67 ± 0.04 e,B−1.65 ± 0.02 e,AB−1.67 ± 0.01 e,B
0.54.00 ± 0.08 d,A3.74 ± 0.03 d,B3.63 ± 0.04 d,C3.45 ± 0.04 d,E3.54 ± 0.02 d,D
1.06.61 ± 0.03 c,A6.35 ± 0.02 c,B6.27 ± 0.04 c,C6.15 ± 0.03 c,D6.06 ± 0.02 c,E
1.58.31 ± 0.04 b,A8.07 ± 0.04 b,B7.97 ± 0.01 b,C8.00 ± 0.01 b,BC7.74 ± 0.03 b,D
2.09.80 ± 0.01 a,A9.52 ± 0.03 a,B9.39 ± 0.03 a,C9.42 ± 0.06 a,C9.14 ± 0.03 a,D
b* (yellow/blue color component)
Concentration (g/100 g)Time (days)
07142128
0.03.57 ± 0.01 a,AB3.42 ± 0.02 a,C3.51 ± 0.01 a,B3.62 ± 0.02 a,A3.55 ± 0.03 a,AB
0.50.03 ± 0.03 b,D0.18 ± 0.01 b,C0.30 ± 0.03 b,B0.33 ± 0.03 b,B0.45 ± 0.03 b,A
1.0−1.03 ± 0.05 c,D−0.93 ± 0.07 c,C−0.71 ± 0.01 c,C−0.87 ± 0.04 c,B−0.51 ± 0.05 c,A
1.5−1.59 ± 0.01 d,B−1.57 ± 0.07 d,B−1.26 ± 0.04 d,A−1.56 ± 0.05 d,B−1.23 ± 0.04 d,A
2.0−2.05 ± 0.06 e,BC−2.01 ± 0.01 e,B−1.75 ± 0.05 e,A−2.13 ± 0.05 e,C−1.76 ± 0.03 e,A
C* (Chroma)
Concentration (g/100 g)Time (days)
07142128
0.03.95 ± 0.01 d,A3.77 ± 0.01 d,C3.89 ± 0.01 d,B3.97 ± 0.01 d,A3.93 ± 0.03 d,AB
0.54.01 ± 0.08 d,A3.74 ± 0.02 d,B3.64 ± 0.03 e,C3.47 ± 0.03 e,D3.57 ± 0.01 e,C
1.06.71 ± 0.04 c,A6.42 ± 0.03 c,B6.31 ± 0.04 c,C6.21 ± 0.03 c,D6.09 ± 0.03 c,E
1.58.47 ± 0.03 b,A8.22 ± 0.05 b,B8.07 ± 0.01 b,C8.15 ± 0.01 b,B7.84 ± 0.04 b,D
2.010.01 ± 0.03 a,A9.73 ± 0.03 a,B9.55 ± 0.03 a,C9.66 ± 0.05 a,B9.30 ± 0.03 a,D
Means ± standard deviation. Means in the same column followed by same lower case letter and means in the same row followed by the same upper case letter do not differ significantly (p > 0.05) according to Tukey’s multiple comparison test.
Table 4. Sensory acceptance of sweetened plain whole-fat yogurts with addition of jabuticaba skin powdered extract at 0.5 g/100 g concentration level.
AttributesAppearanceColorAromaTextureTasteOverall Impression
Means ± SD7.4 ± 1.37.1 ± 1.37.8 ± 1.17.7 ± 1.27.6 ± 1.37.5 ± 1.0
ScoreFrequency
1000000
2000000
3110010
4351610
56115176
6191613101611
7344214262438
8443664564753
9242034323522
Means ± SD = Means ± standard deviation. Frequency considered how many times each score occurred according to the panelists’ impressions.
Disclaimer/Publisher’s Note: The statements, opinions and data contained in all publications are solely those of the individual author(s) and contributor(s) and not of MDPI and/or the editor(s). MDPI and/or the editor(s) disclaim responsibility for any injury to people or property resulting from any ideas, methods, instructions or products referred to in the content.

