

Effects of Contact Conditions at Wire–Die Interface on Temperature Distribution during Wire Drawing

Abstract
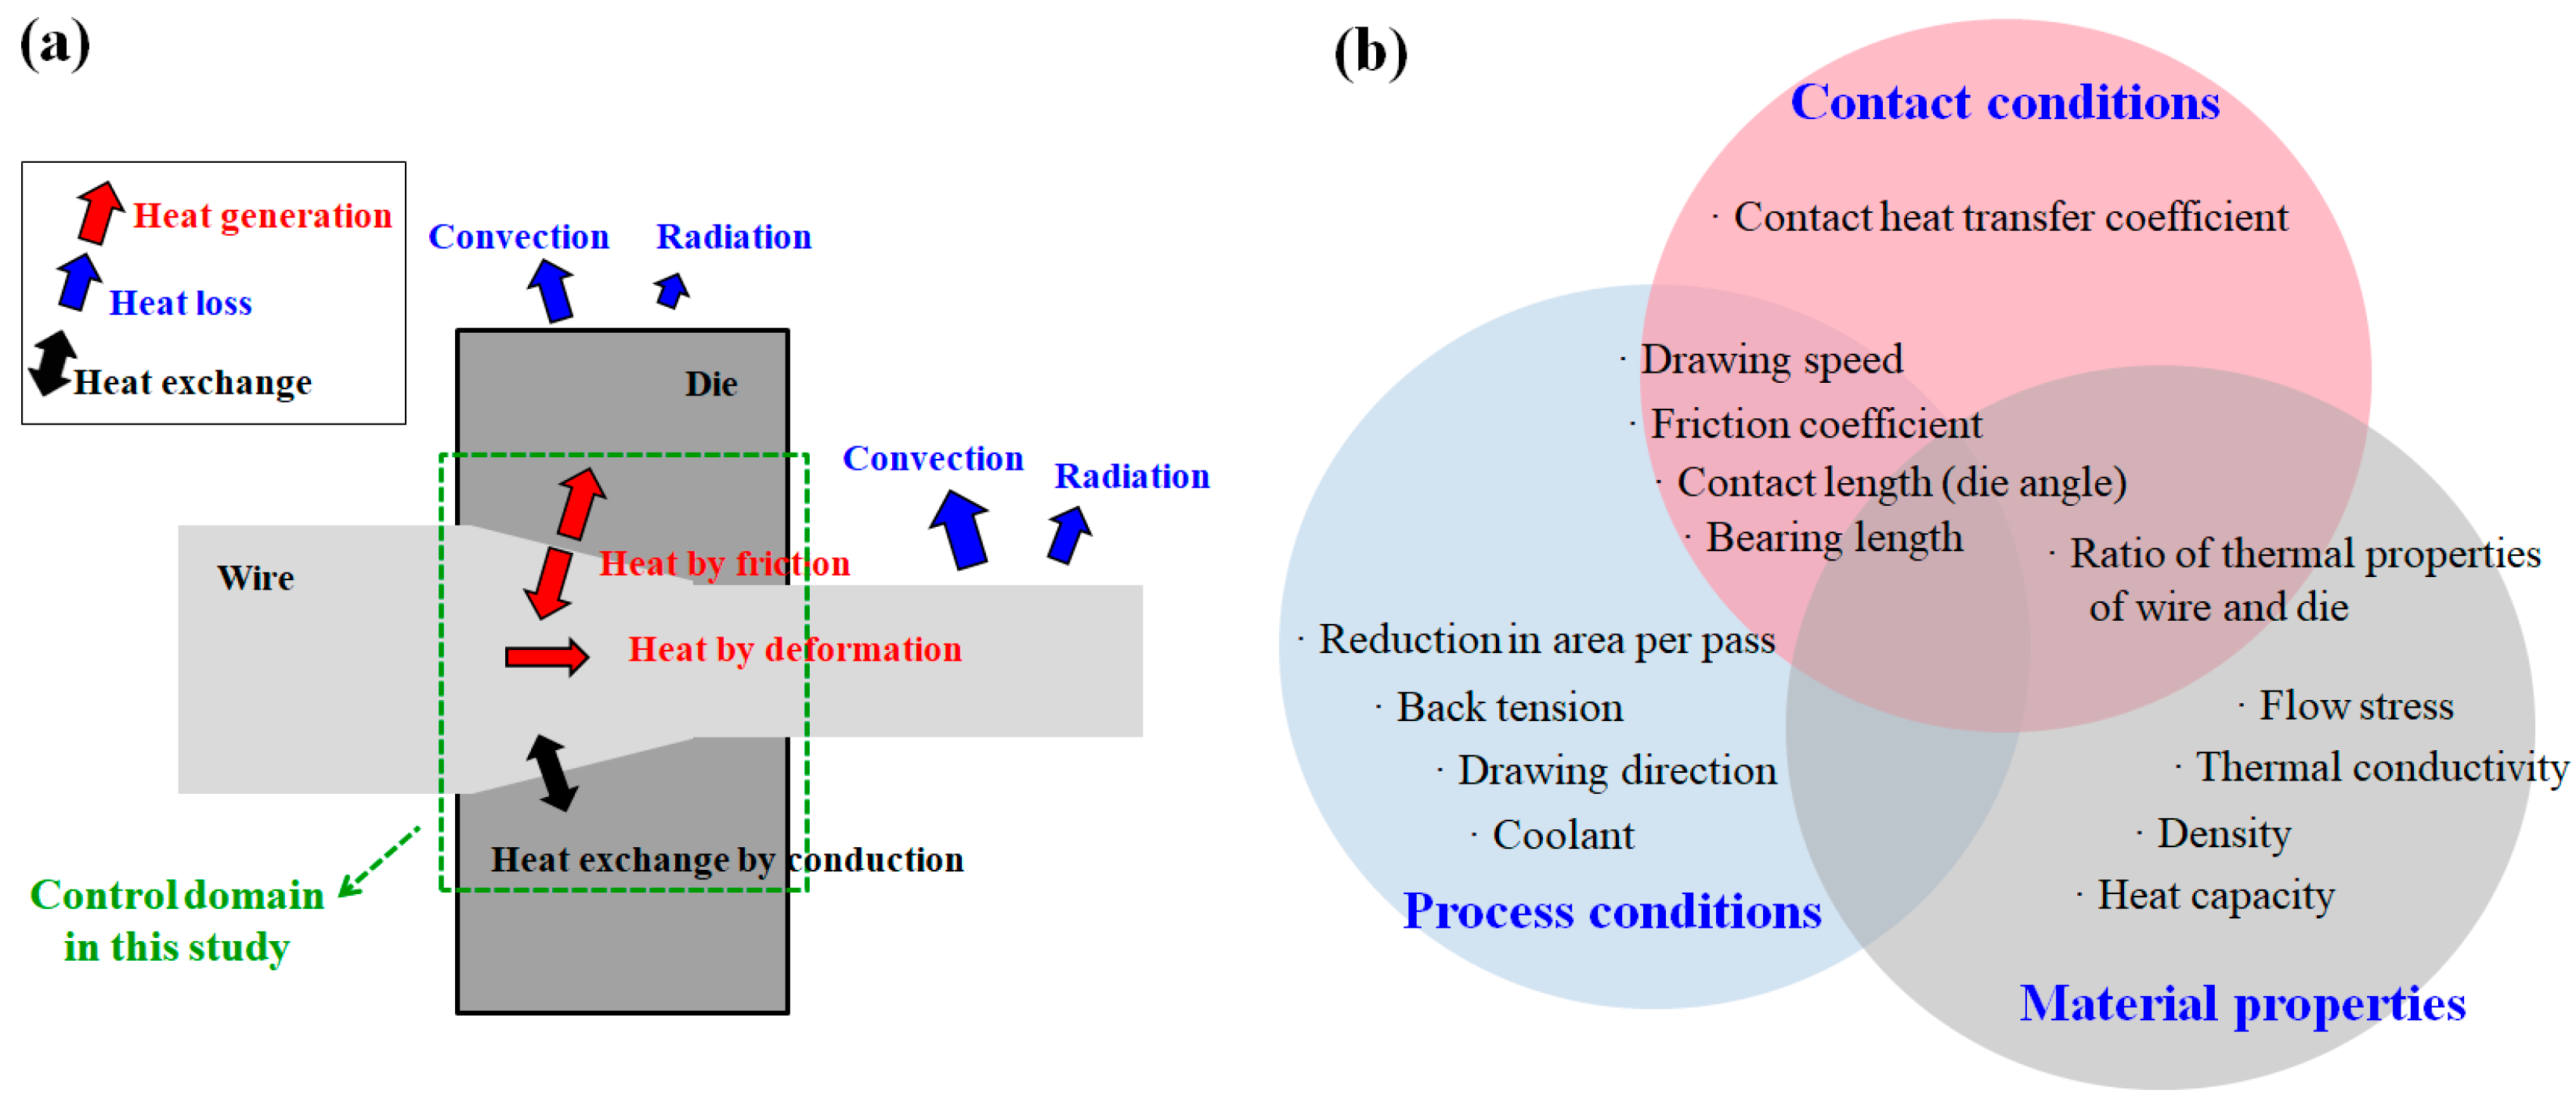
:1. Introduction
2. Experiment and Numerical Simulation
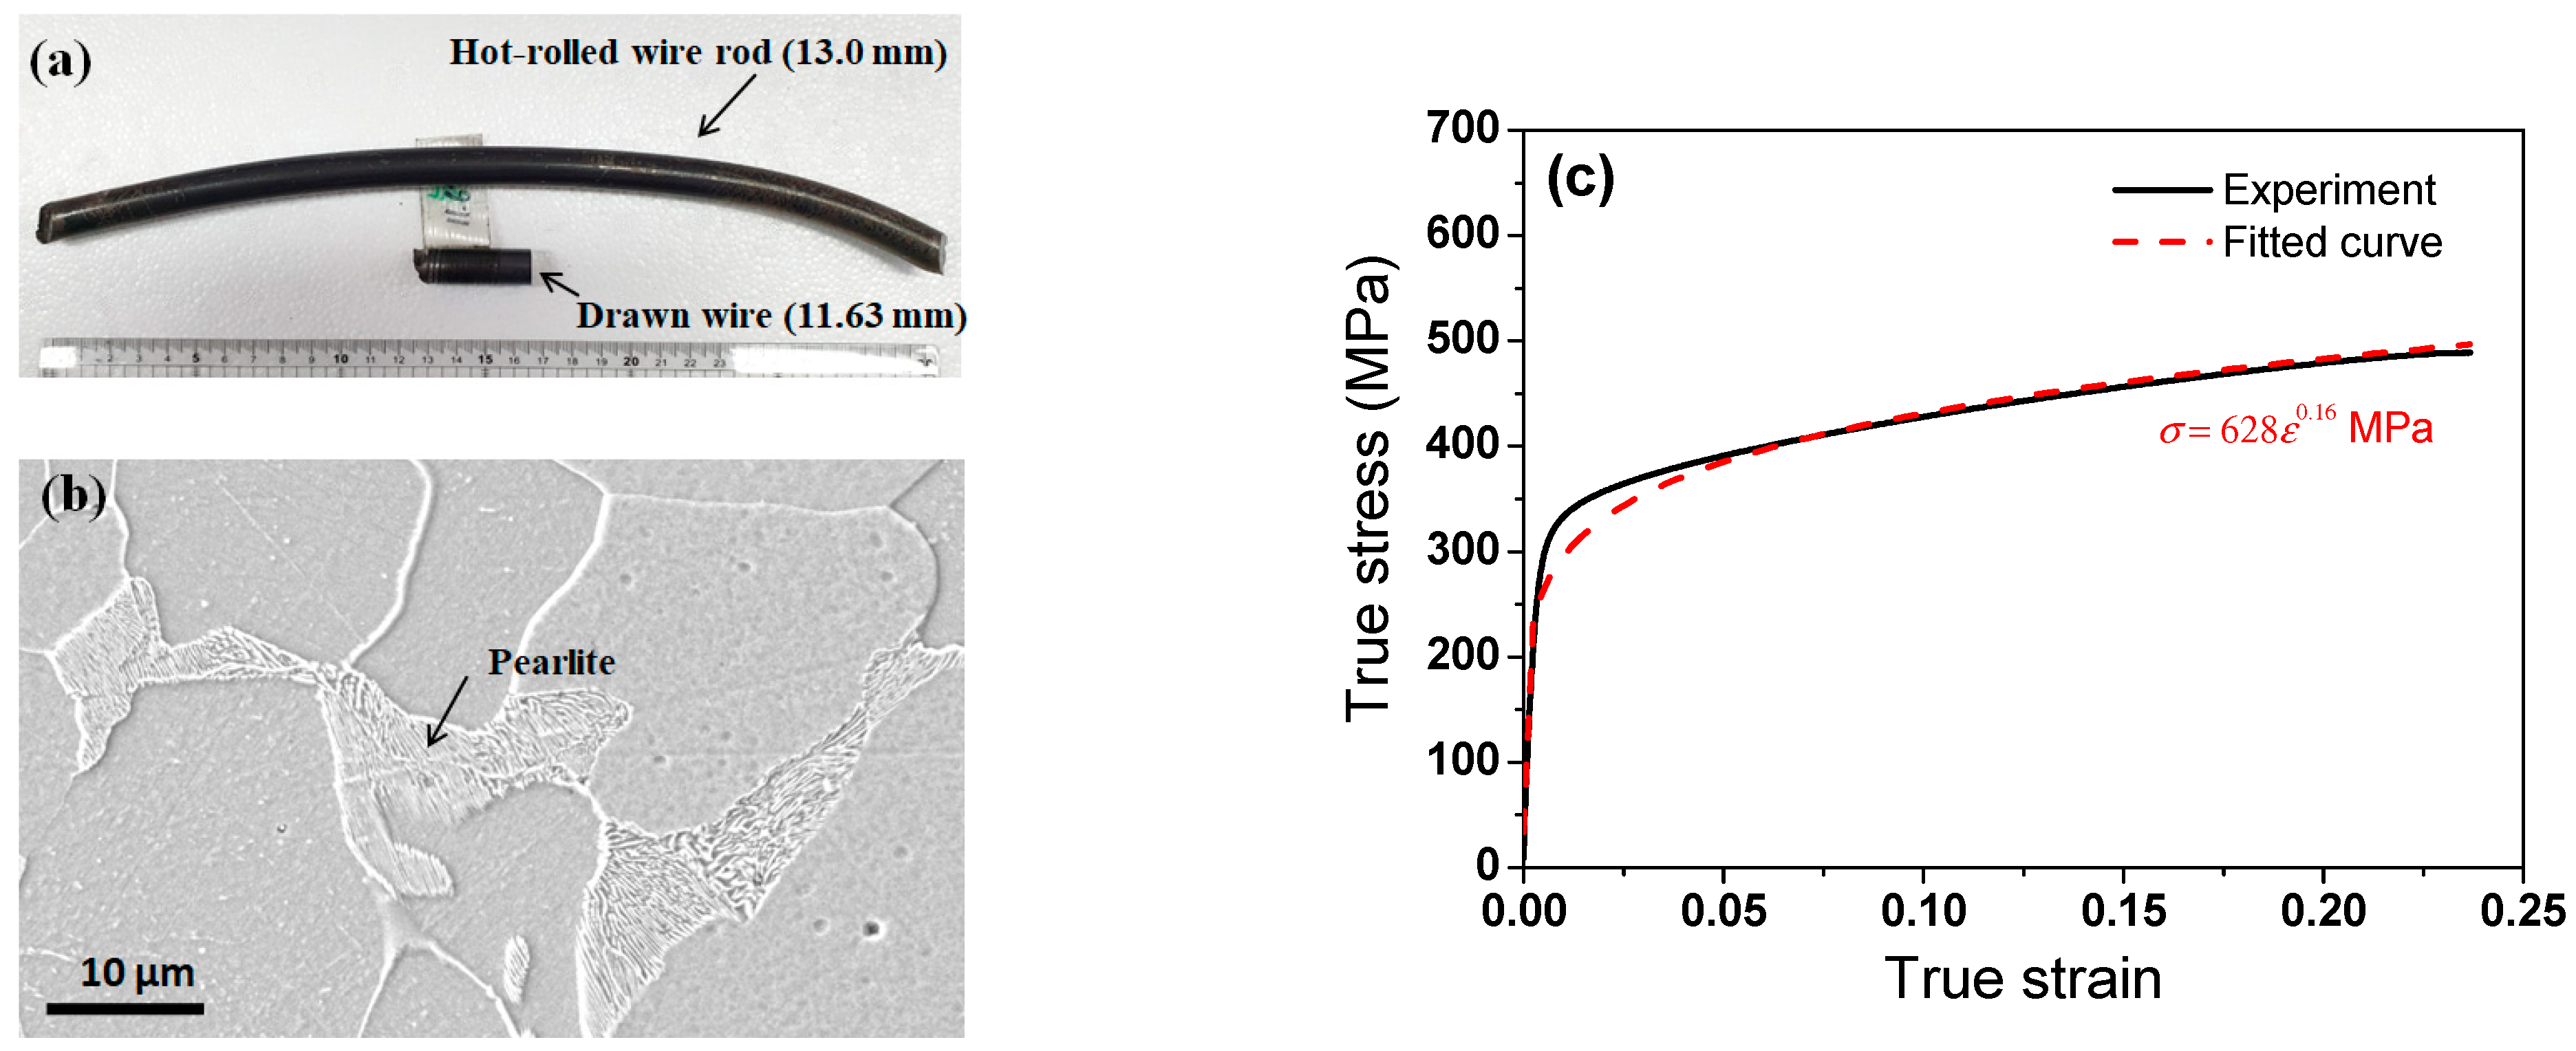
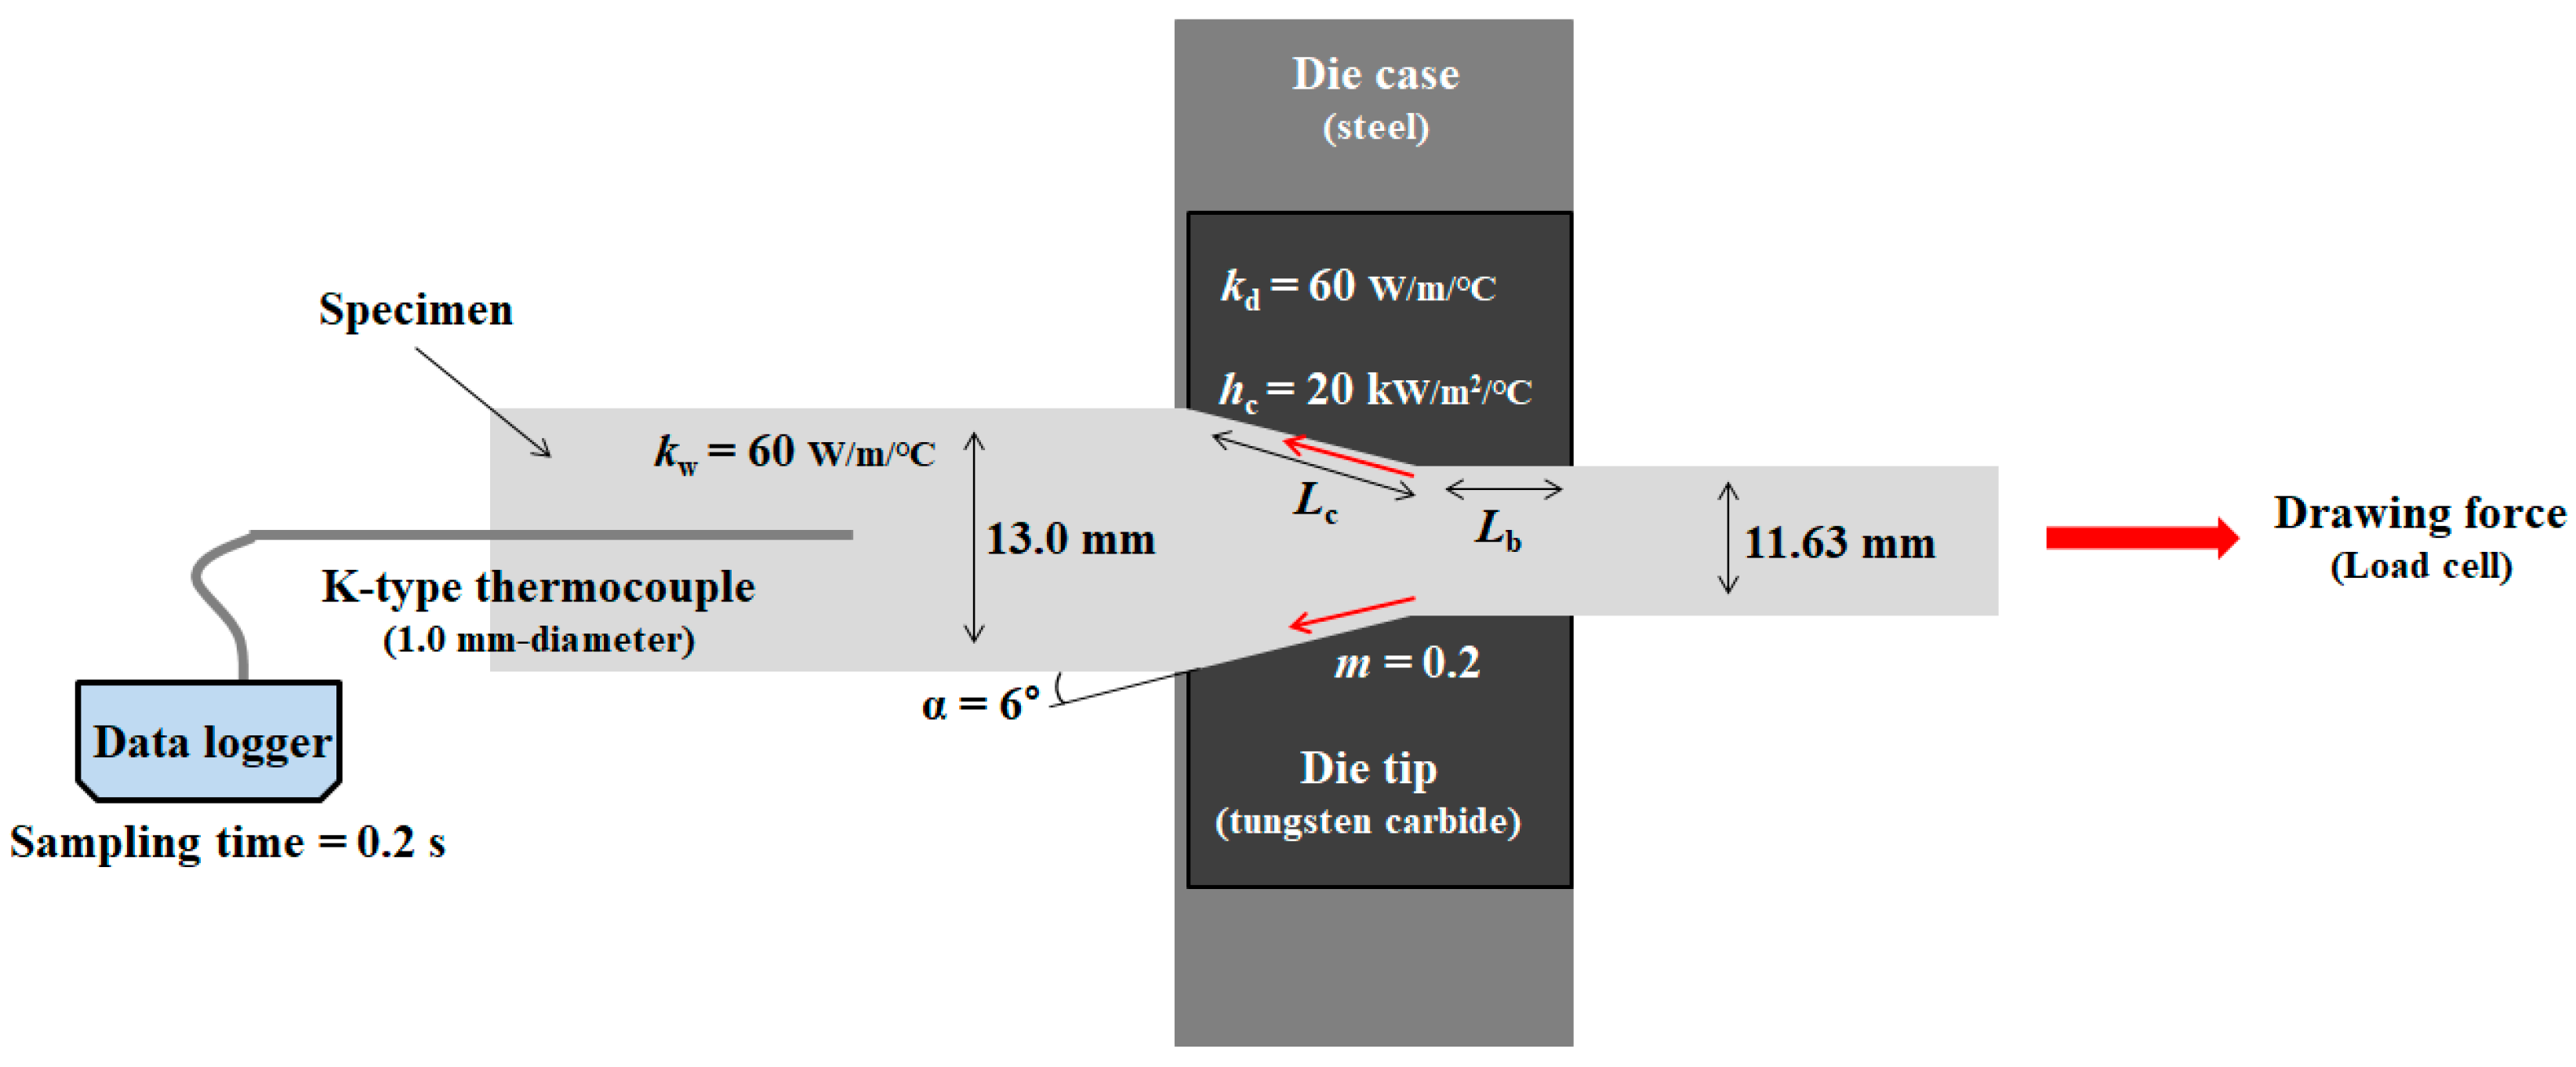
2.1. Experiment
2.2. Finite Element Analysis
- (i)
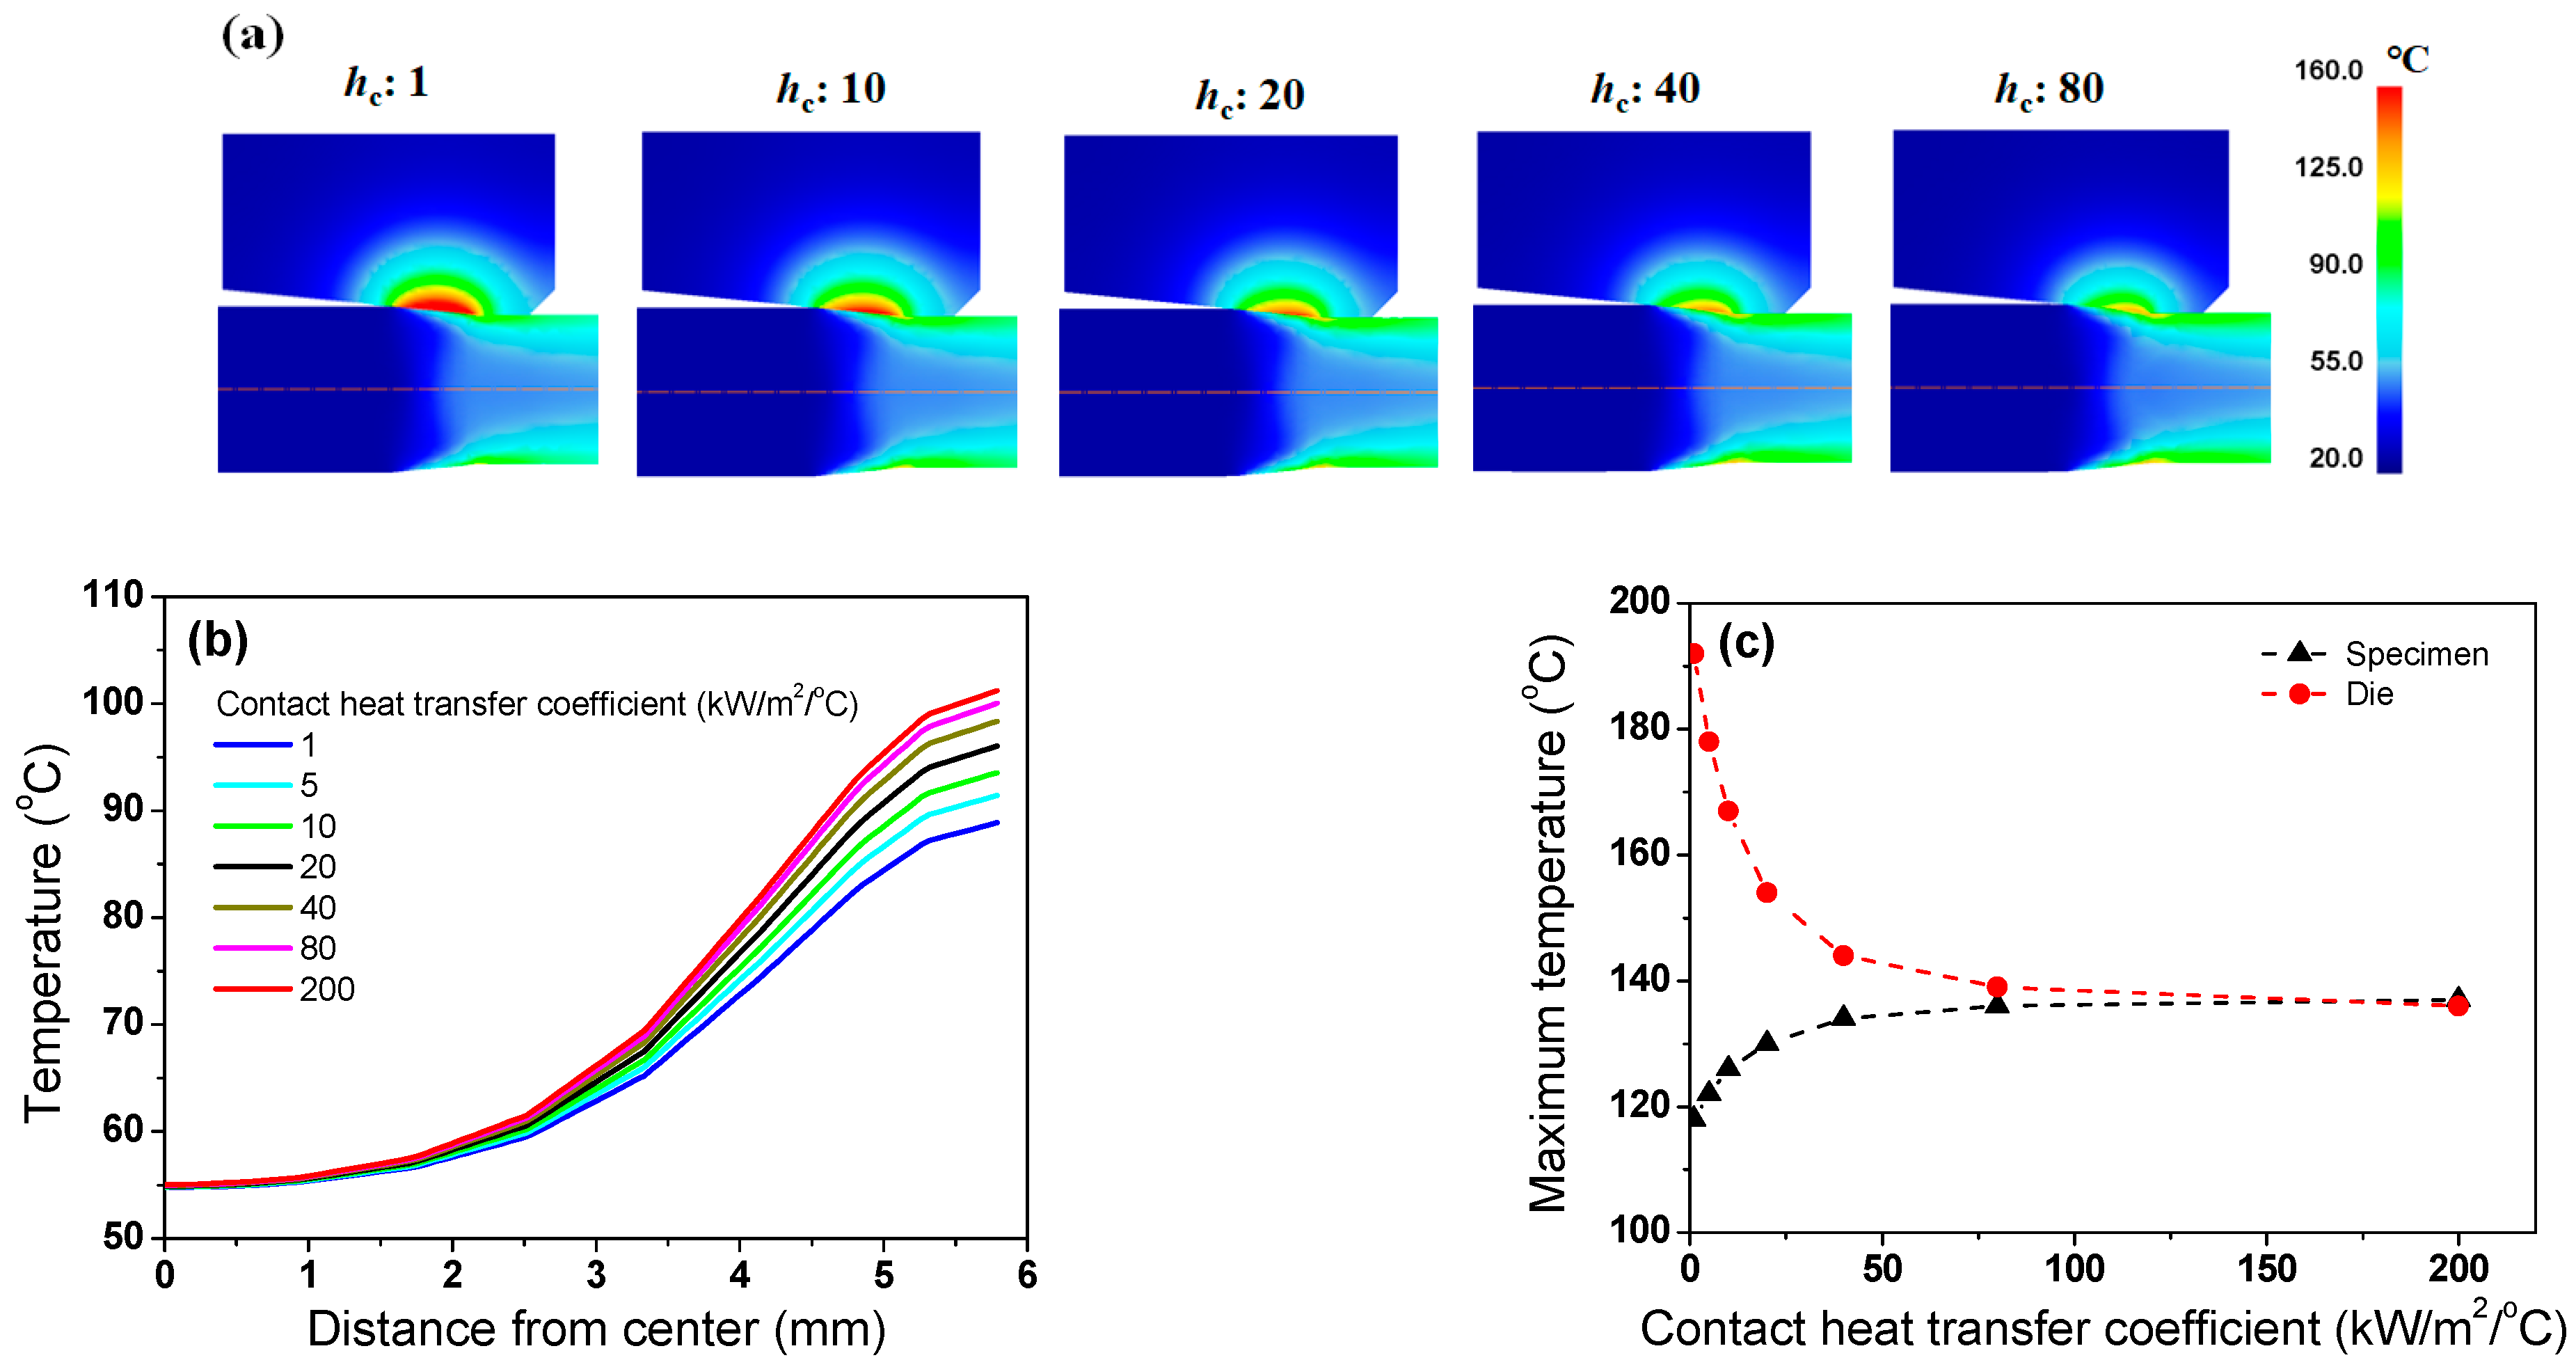
- hc varied from 1 to 200 kW/m2/°C.
- (ii)
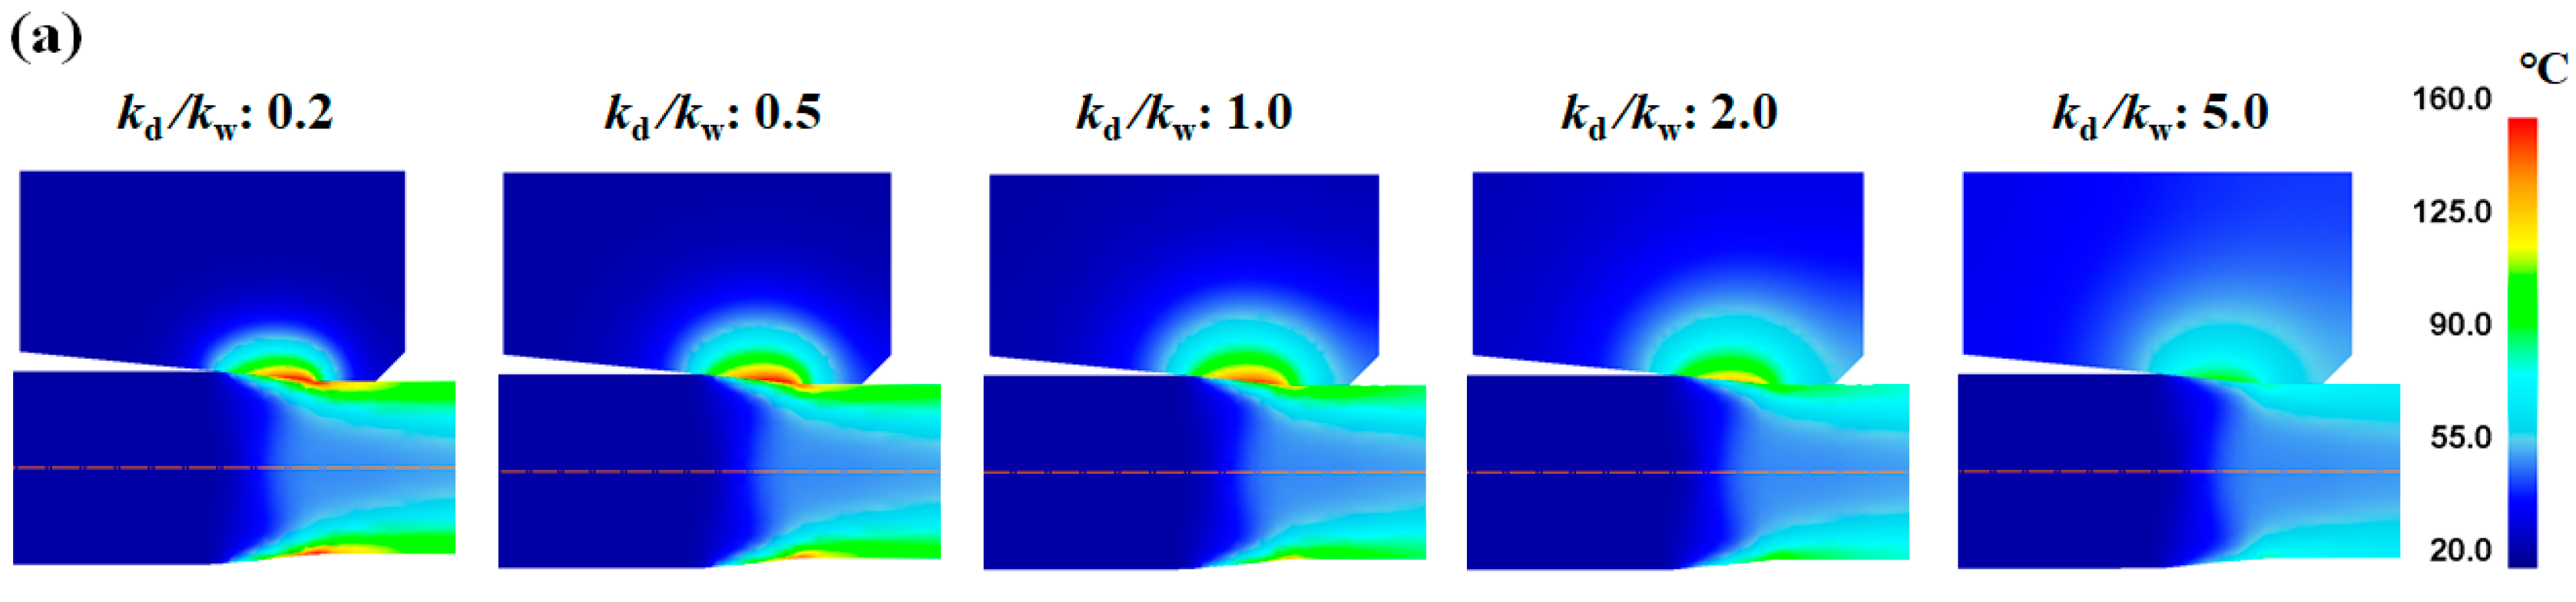
- kd varied from 12 to 300 W/m/°C.
- (iii)
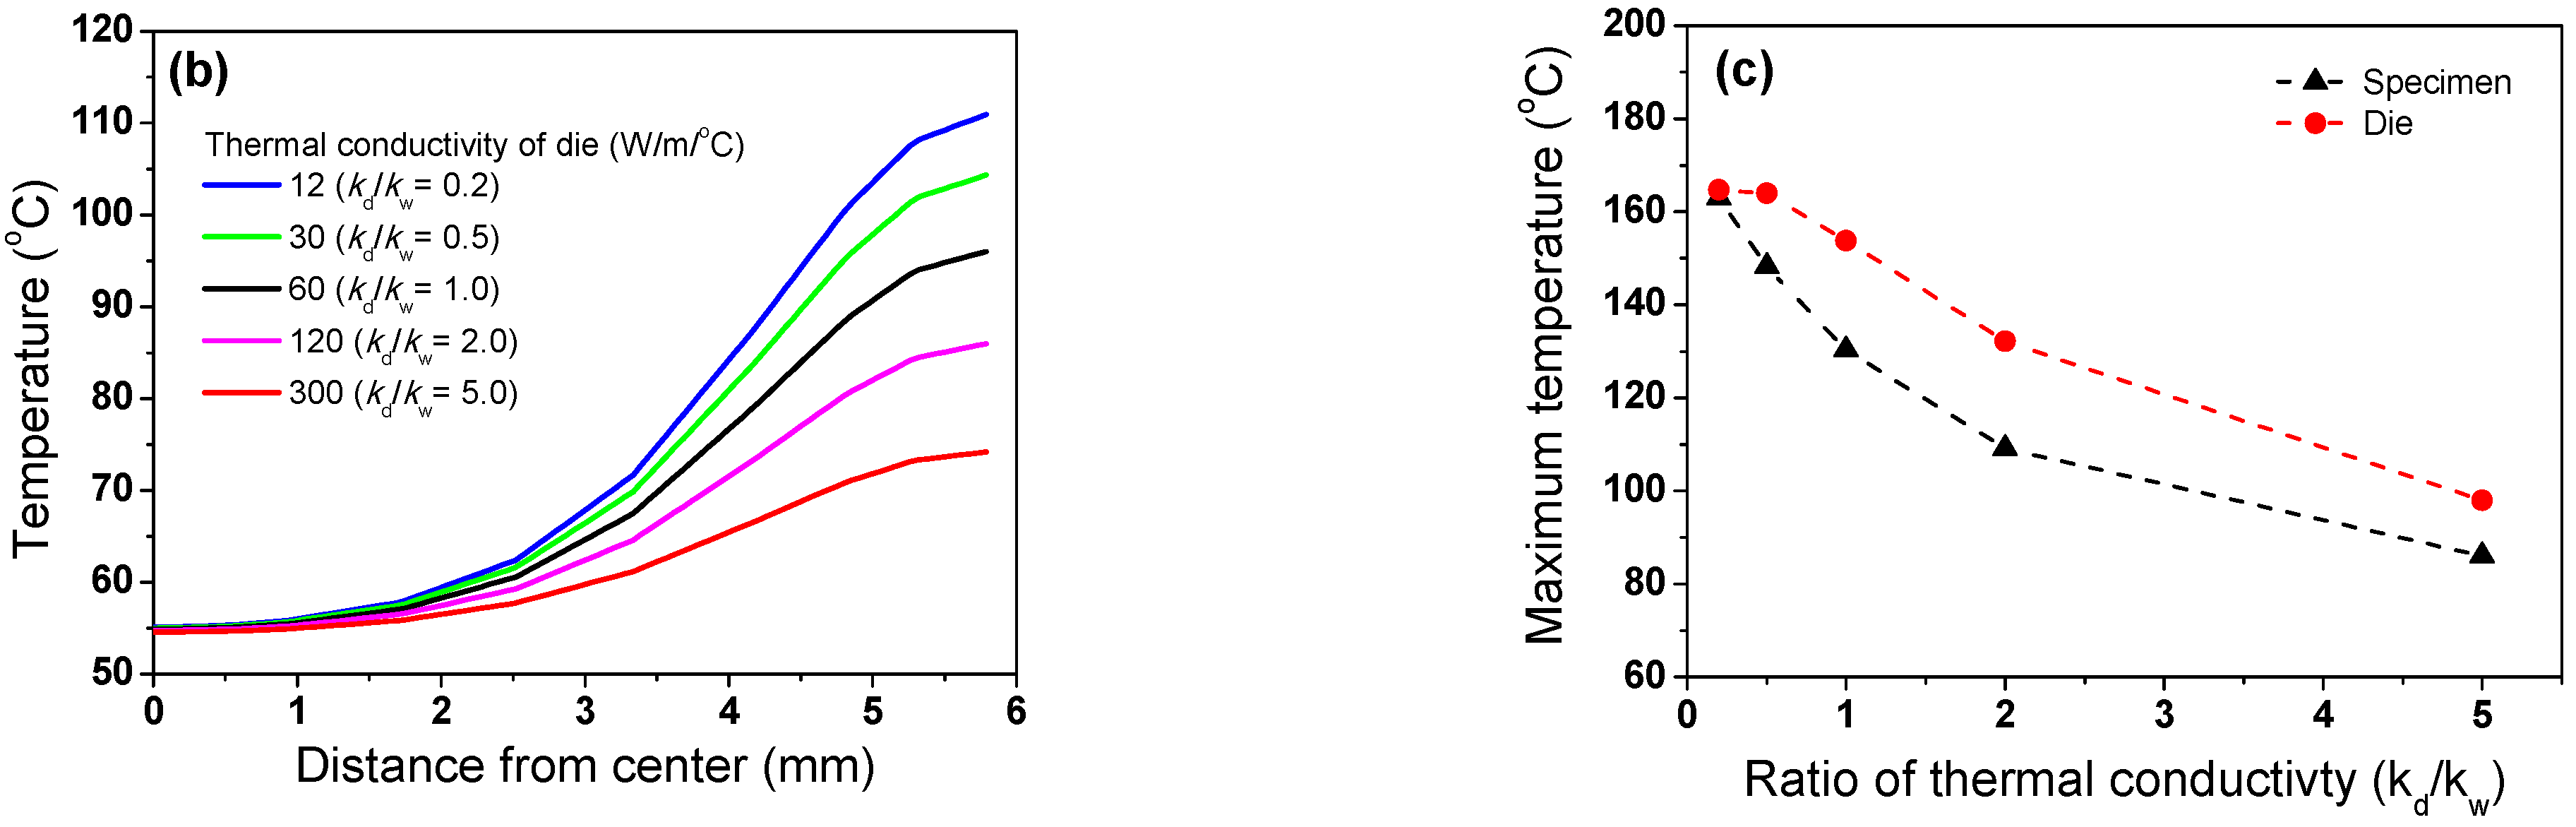
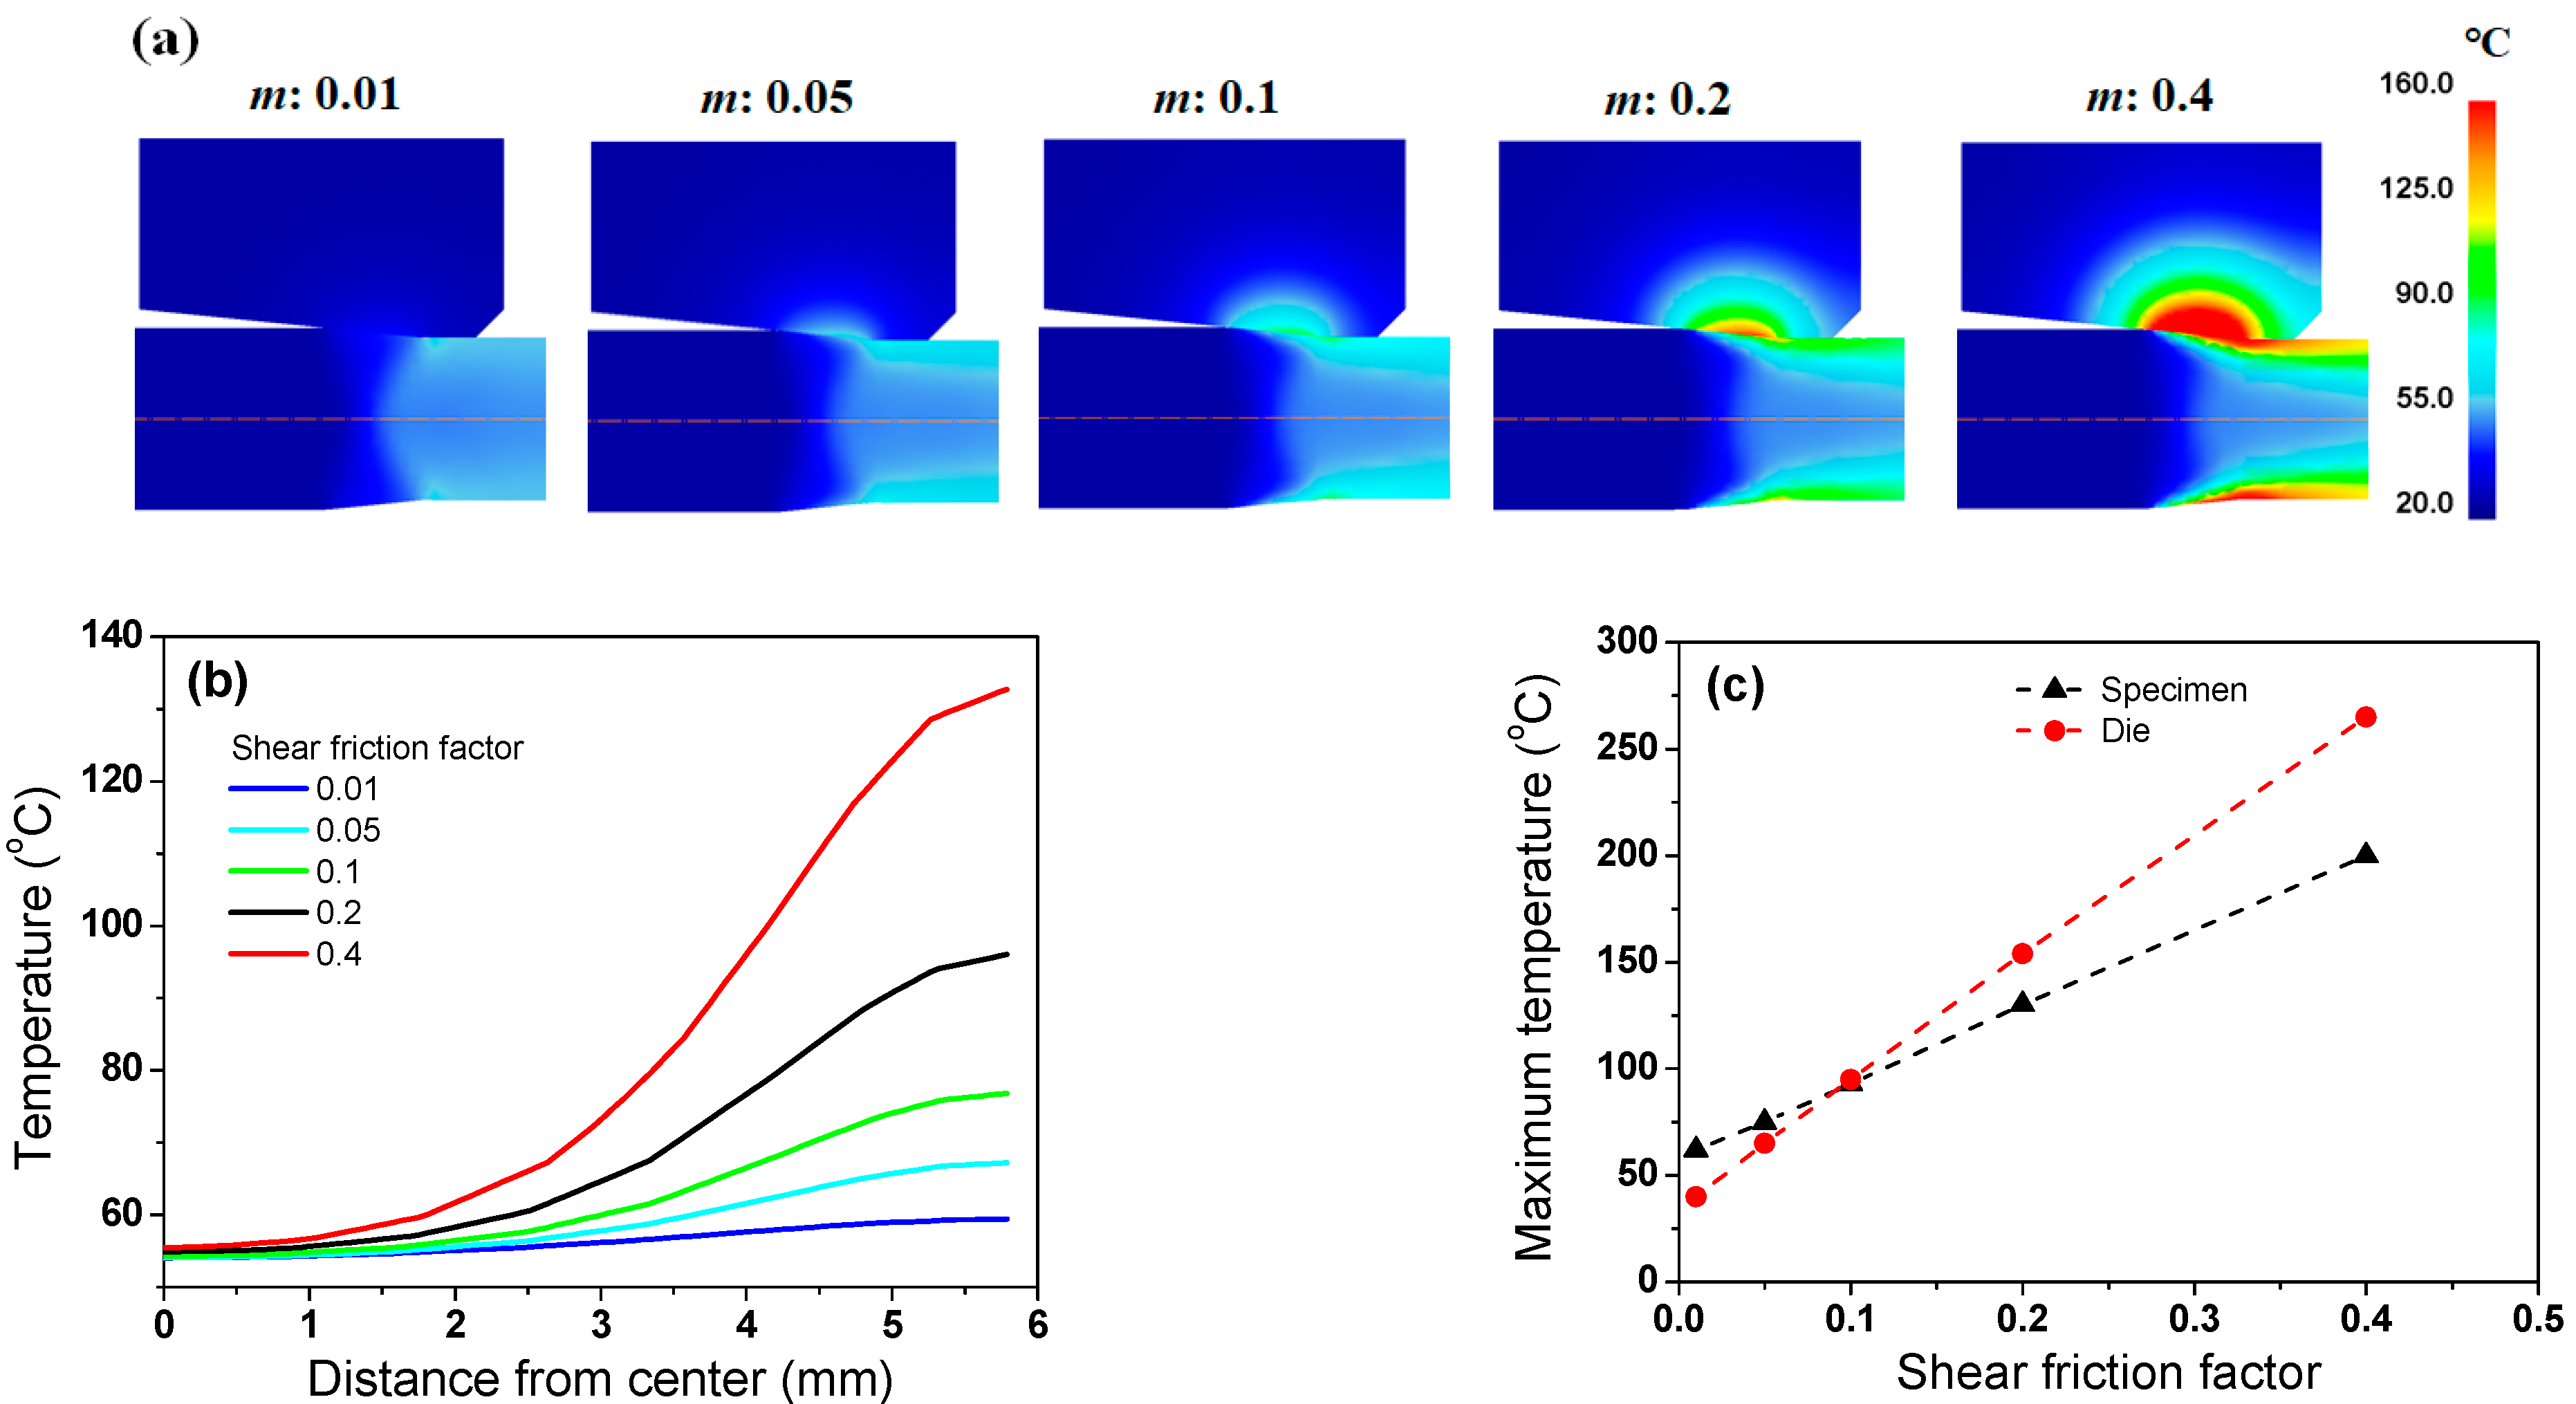
- m varied from 0.01 to 0.4.
- (iv)
- Vd varied from 0.05 to 0.3 m/s.
- (v)
- Lc varied from 3.17 to 12.61 mm.
- (vi)
- Lb varied from 1.3 to 7.8 mm.

| Parameter | Wire Rod | Die | Wire–Die Interface | |
|---|---|---|---|---|
| Material properties | Flow stress (MPa) | σ = 628ε0.16 | Rigid body | - |
| Thermal conductivity (k, W/m/°C) | 60 [35] | 12, 30, 60 *, 120, 300 | kd/kw of 0.2, 0.5, 1.0 *, 2.0, 5.0 | |
| Specific heat capacity (ρCp, N/mm2/°C) | 3.6 [32] | 3.6 | - | |
| Fraction factor (β) | 0.9 | - | - | |
| Process conditions | Initial wire diameter (do, mm) | 13.00 | - | - |
| Drawn wire diameter (df, mm) | - | 11.63 | - | |
| Reduction in area per pass (Rp, %) | 20 | - | - | |
| Drawing velocity (Vd, m/s) | - | - | 0.05, 0.1 0.15 *, 0.3 | |
| Contact conditions | Contact length (Lc, mm) | - | 3.17, 4.74, 6.31 *, 9.46, 12.61 | Lc/do of 0.24, 0.36, 0.49 *, 0.73, 0.97 |
| Bearing length (Lb, mm) | - | 1.3, 3.9 *, 7.8 | Lb/do of 0.1, 0.3 *, 0.6 | |
| Shear friction factor (m) | - | - | 0.01, 0.1, 0.2 *, 0.4 | |
| Contact heat transfer coefficient (hc, kW/m2/°C) | - | - | 1, 5, 10, 20 *, 40, 80, 200 |
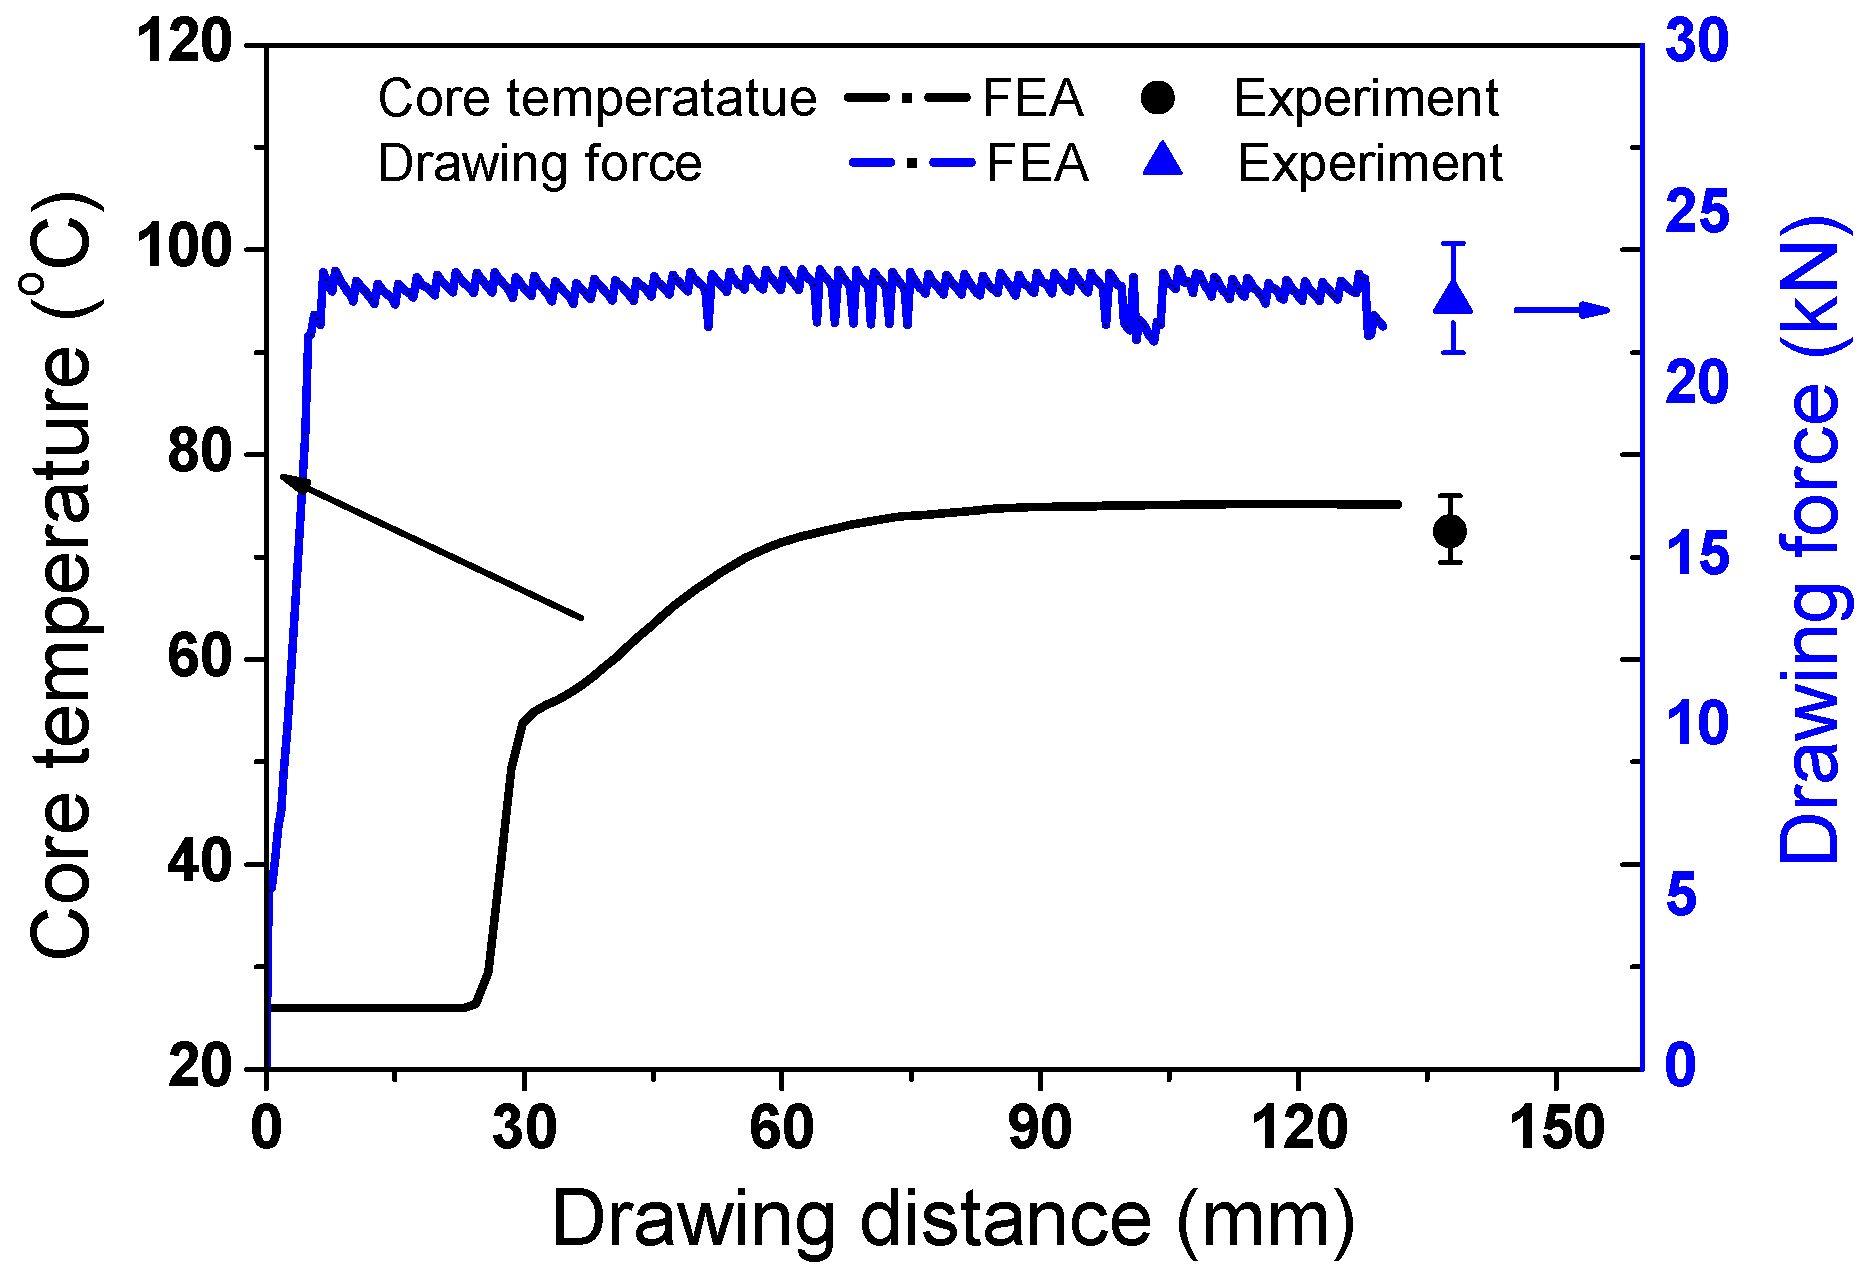
3. Model Validation
4. Results and Discussion
4.1. Effect of Contact Heat Transfer Coefficient
4.2. Effect of Thermal Conductivity of Die
4.3. Effect of Friction
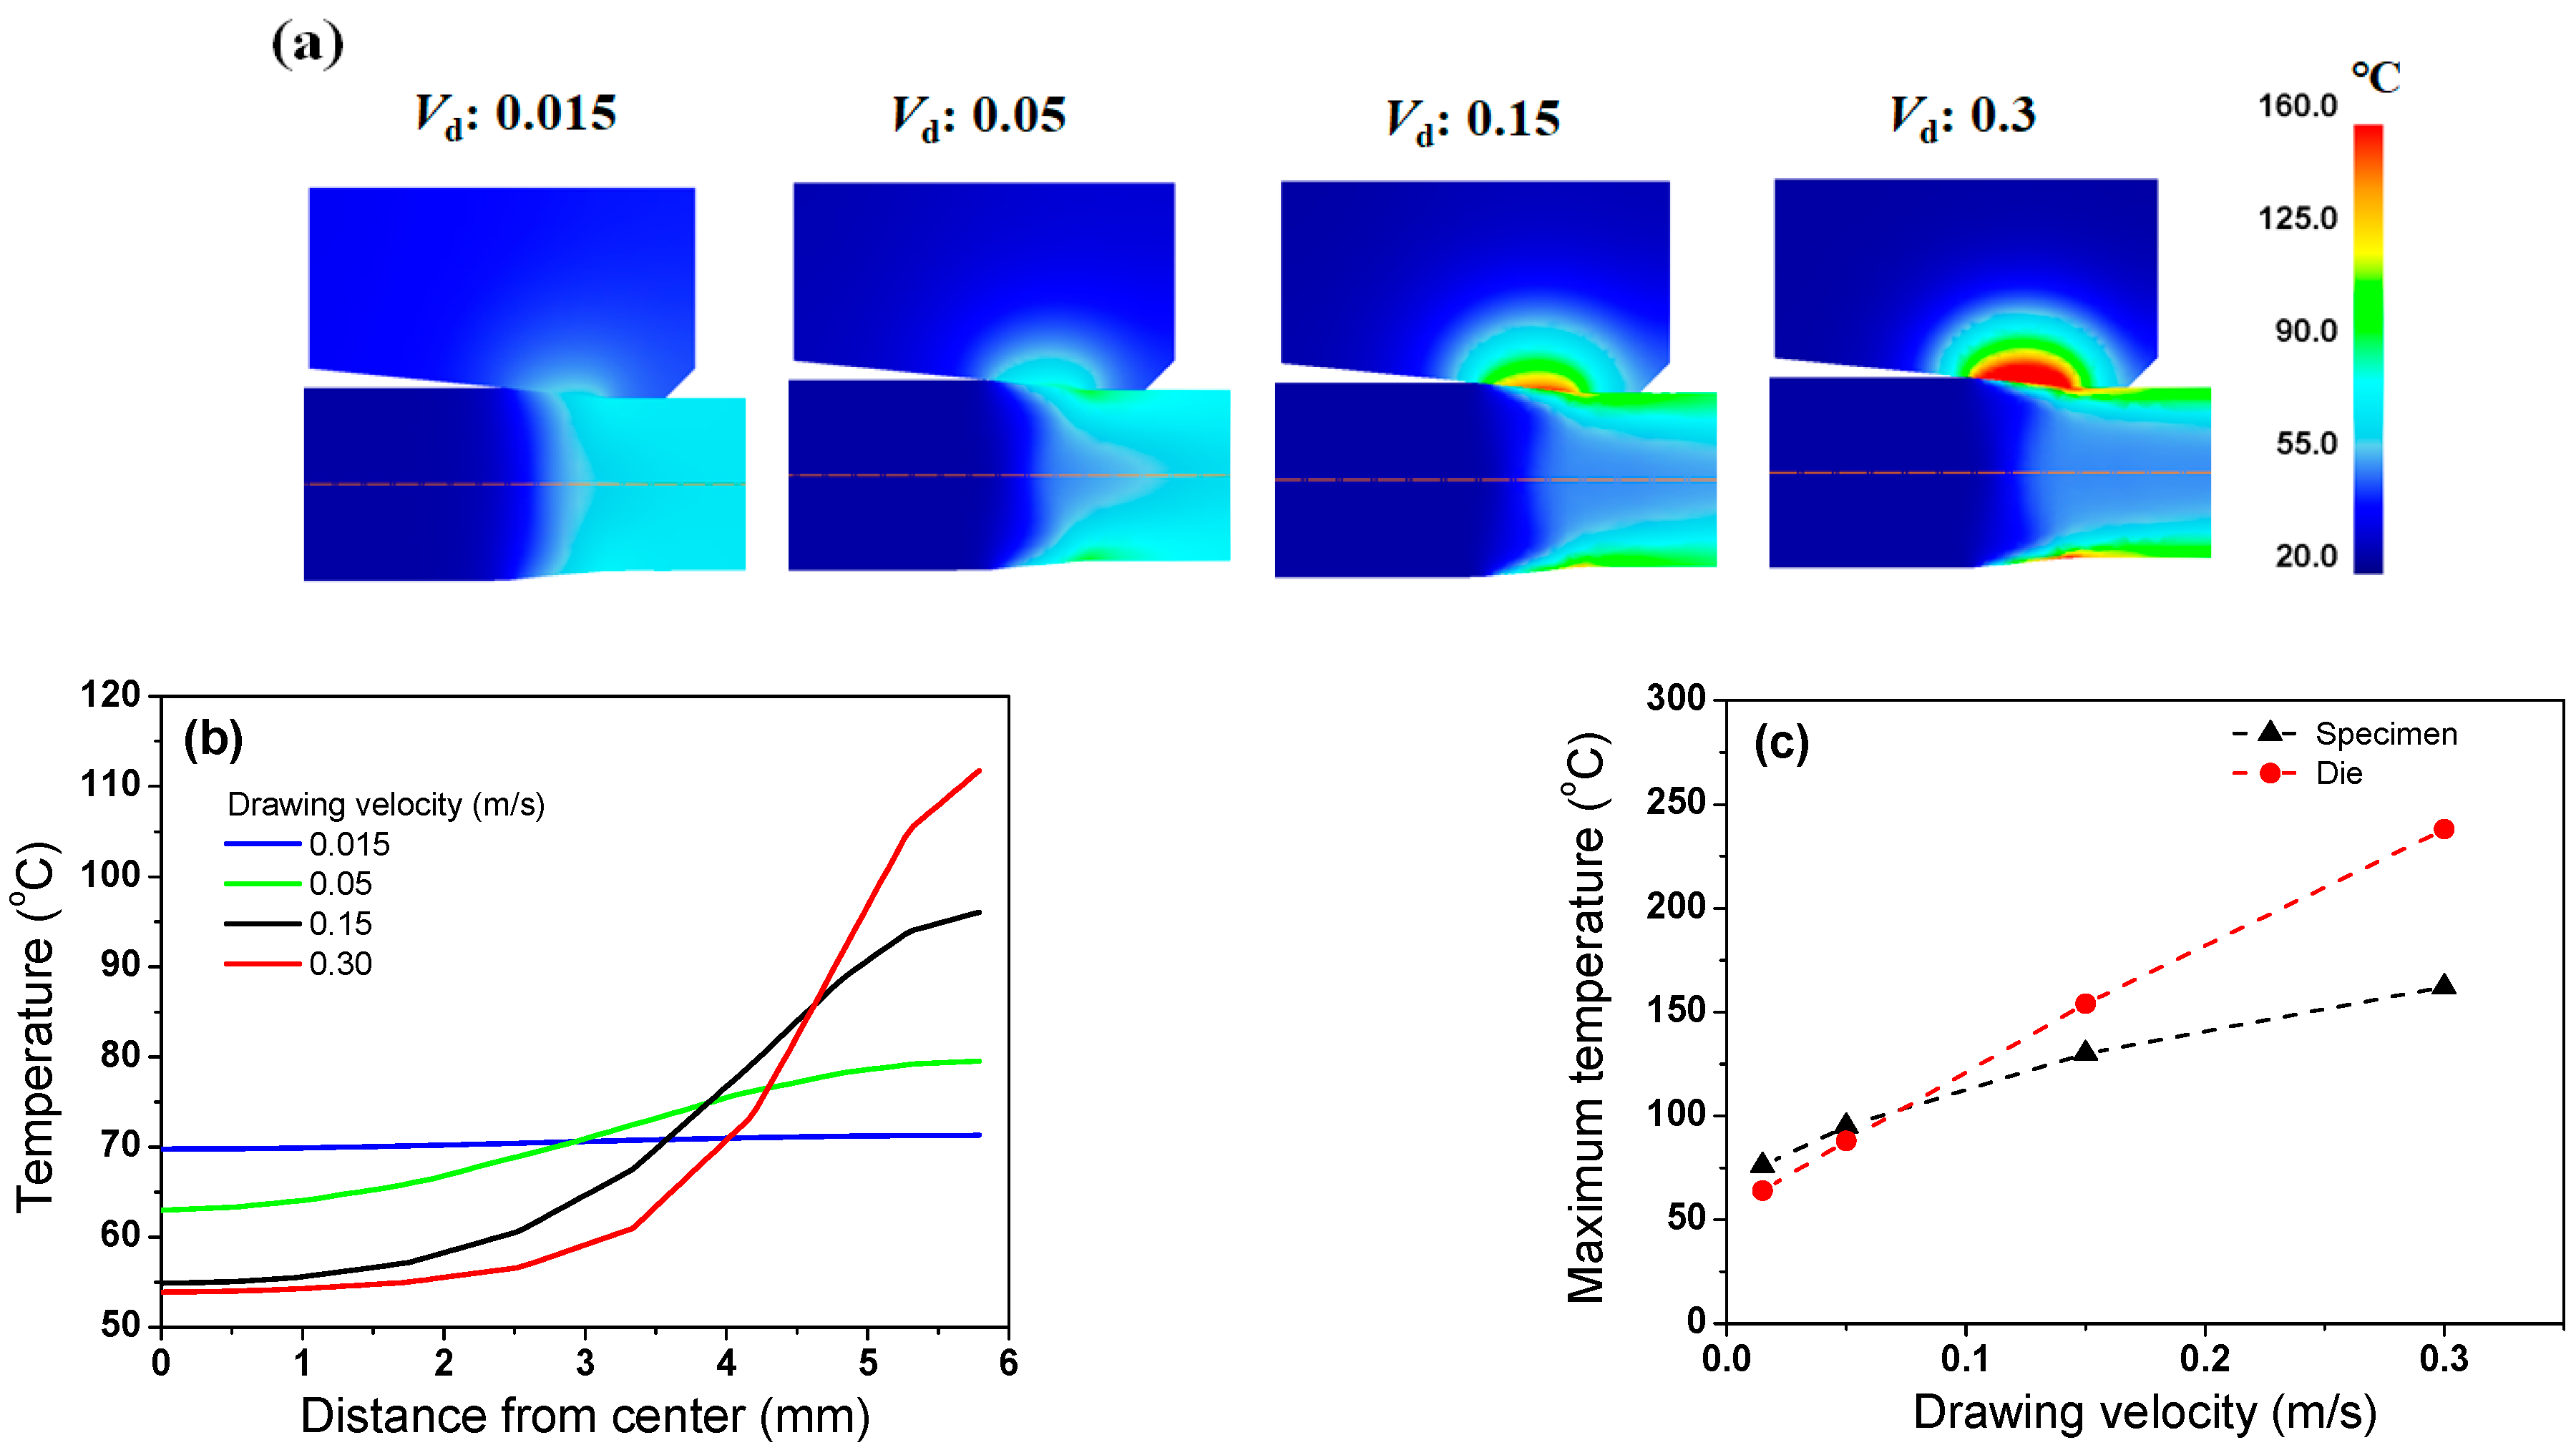
4.4. Effect of Drawing Velocity
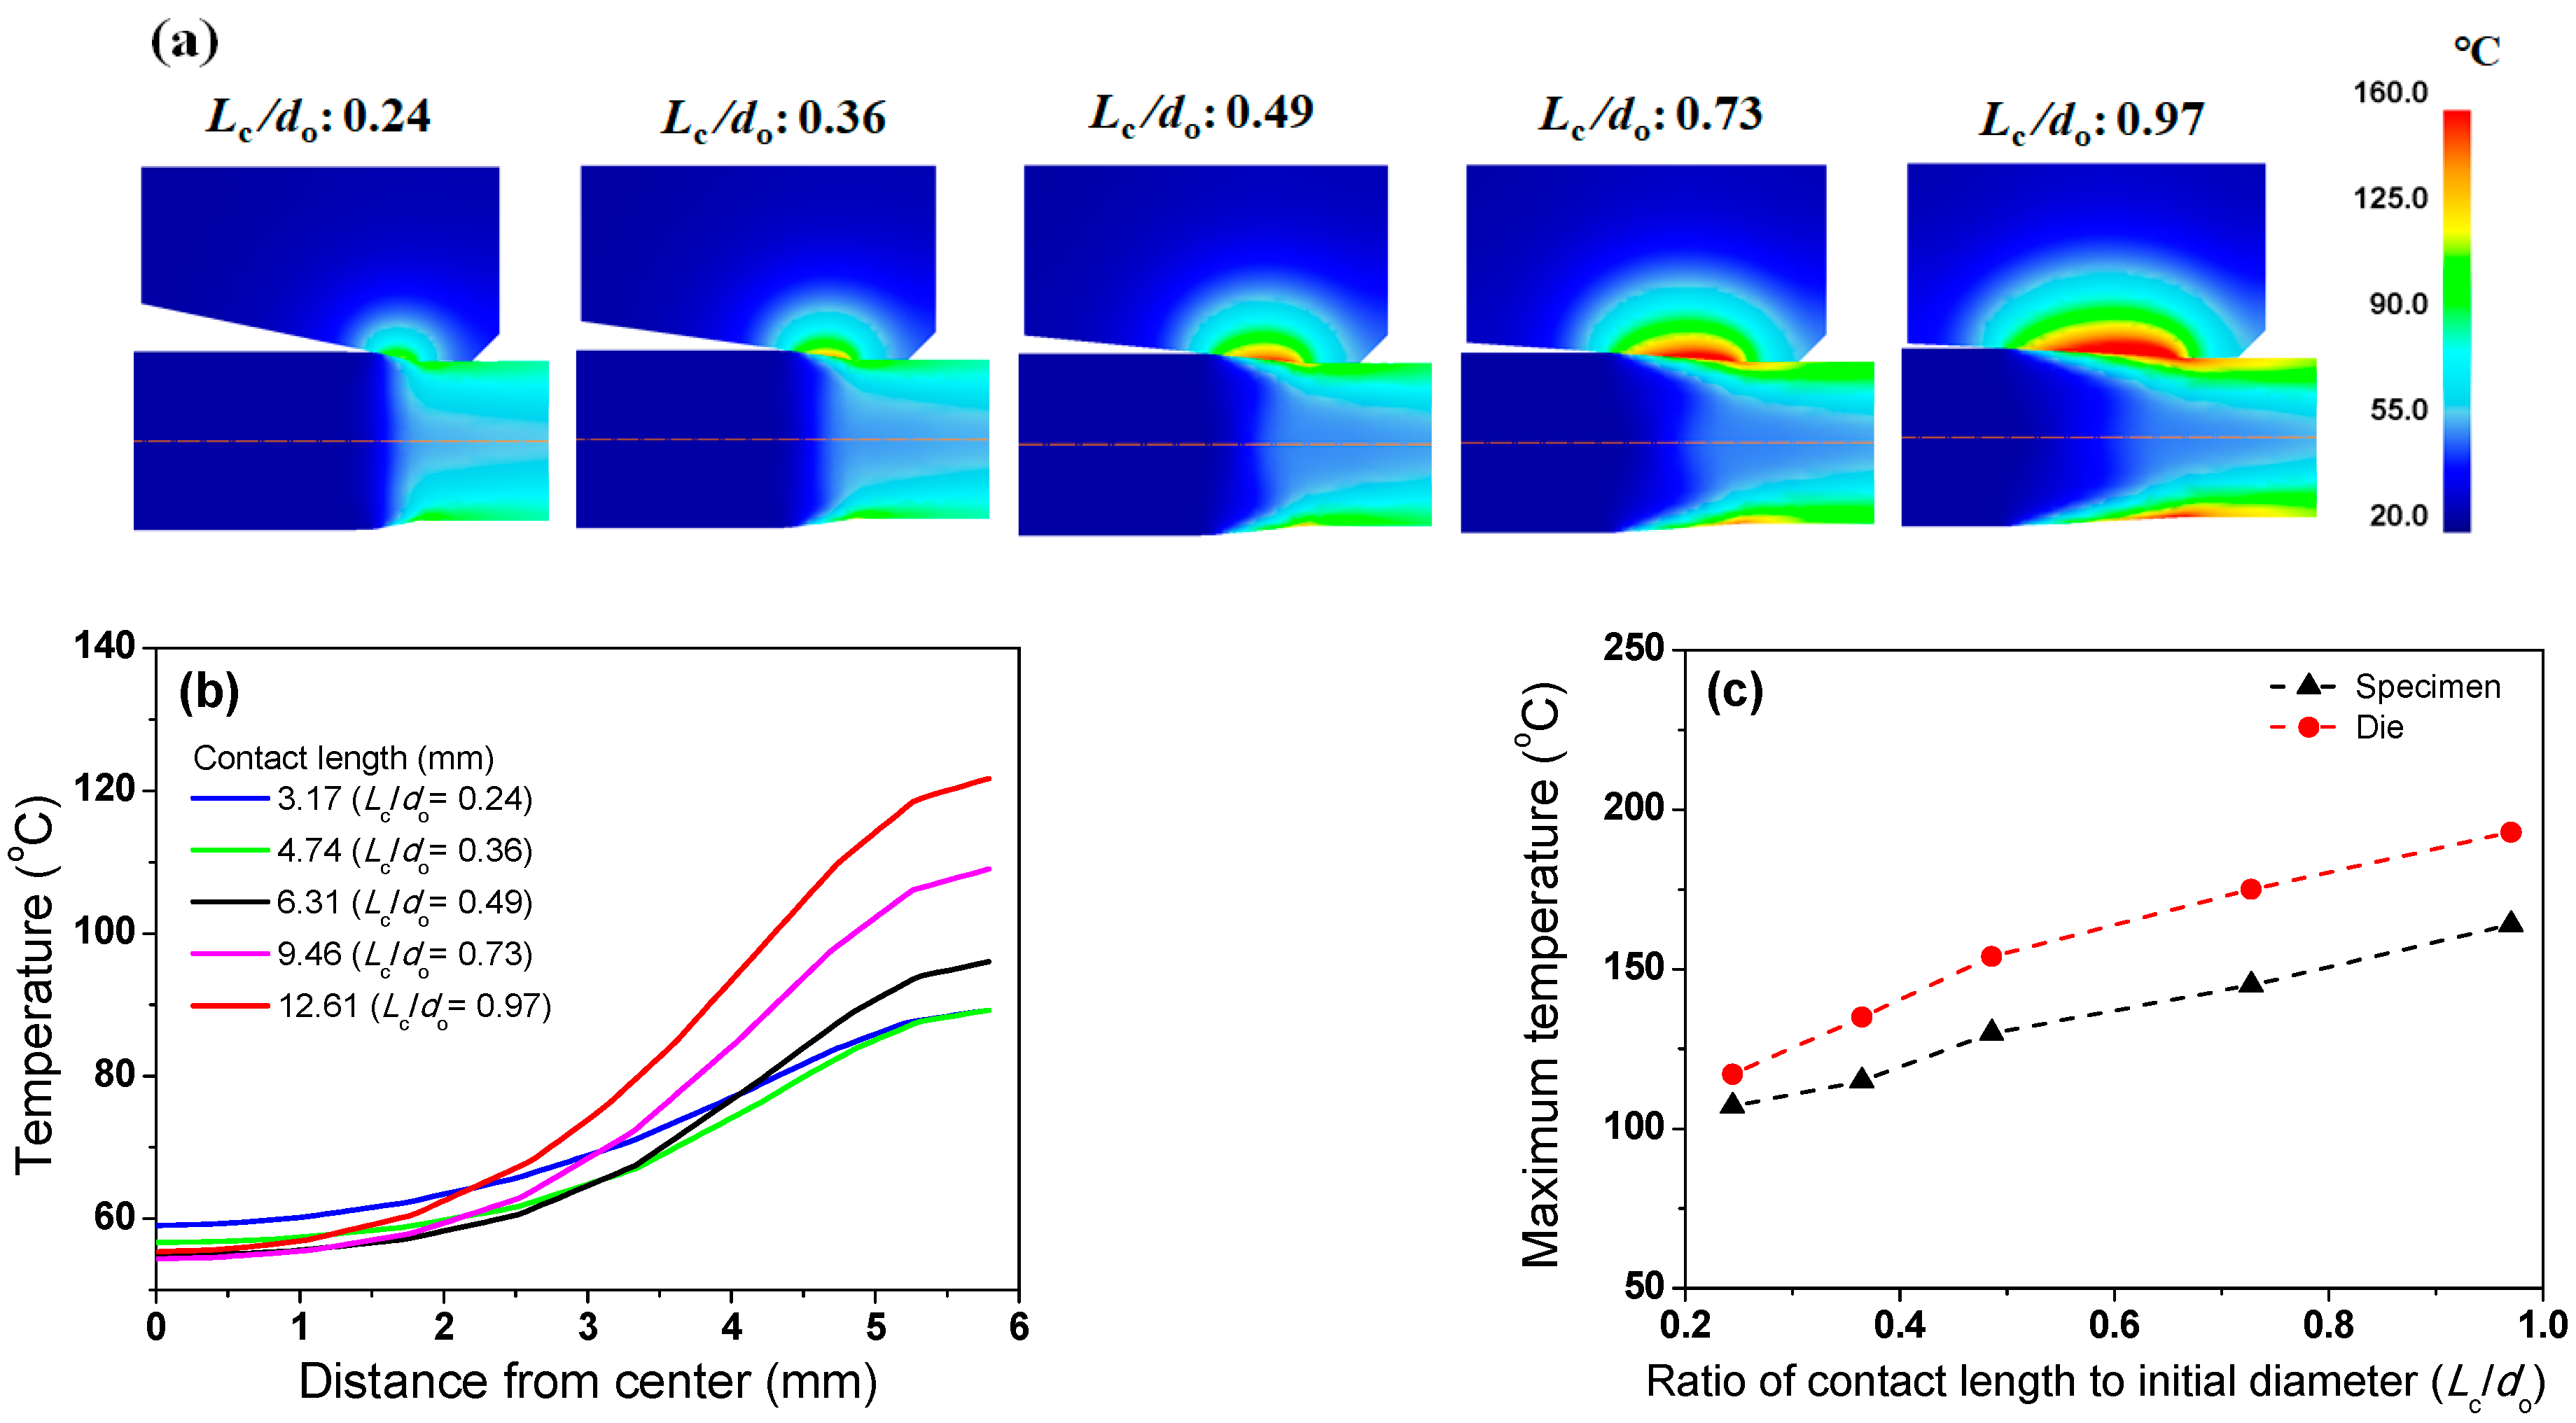
4.5. Effect of Contact Length
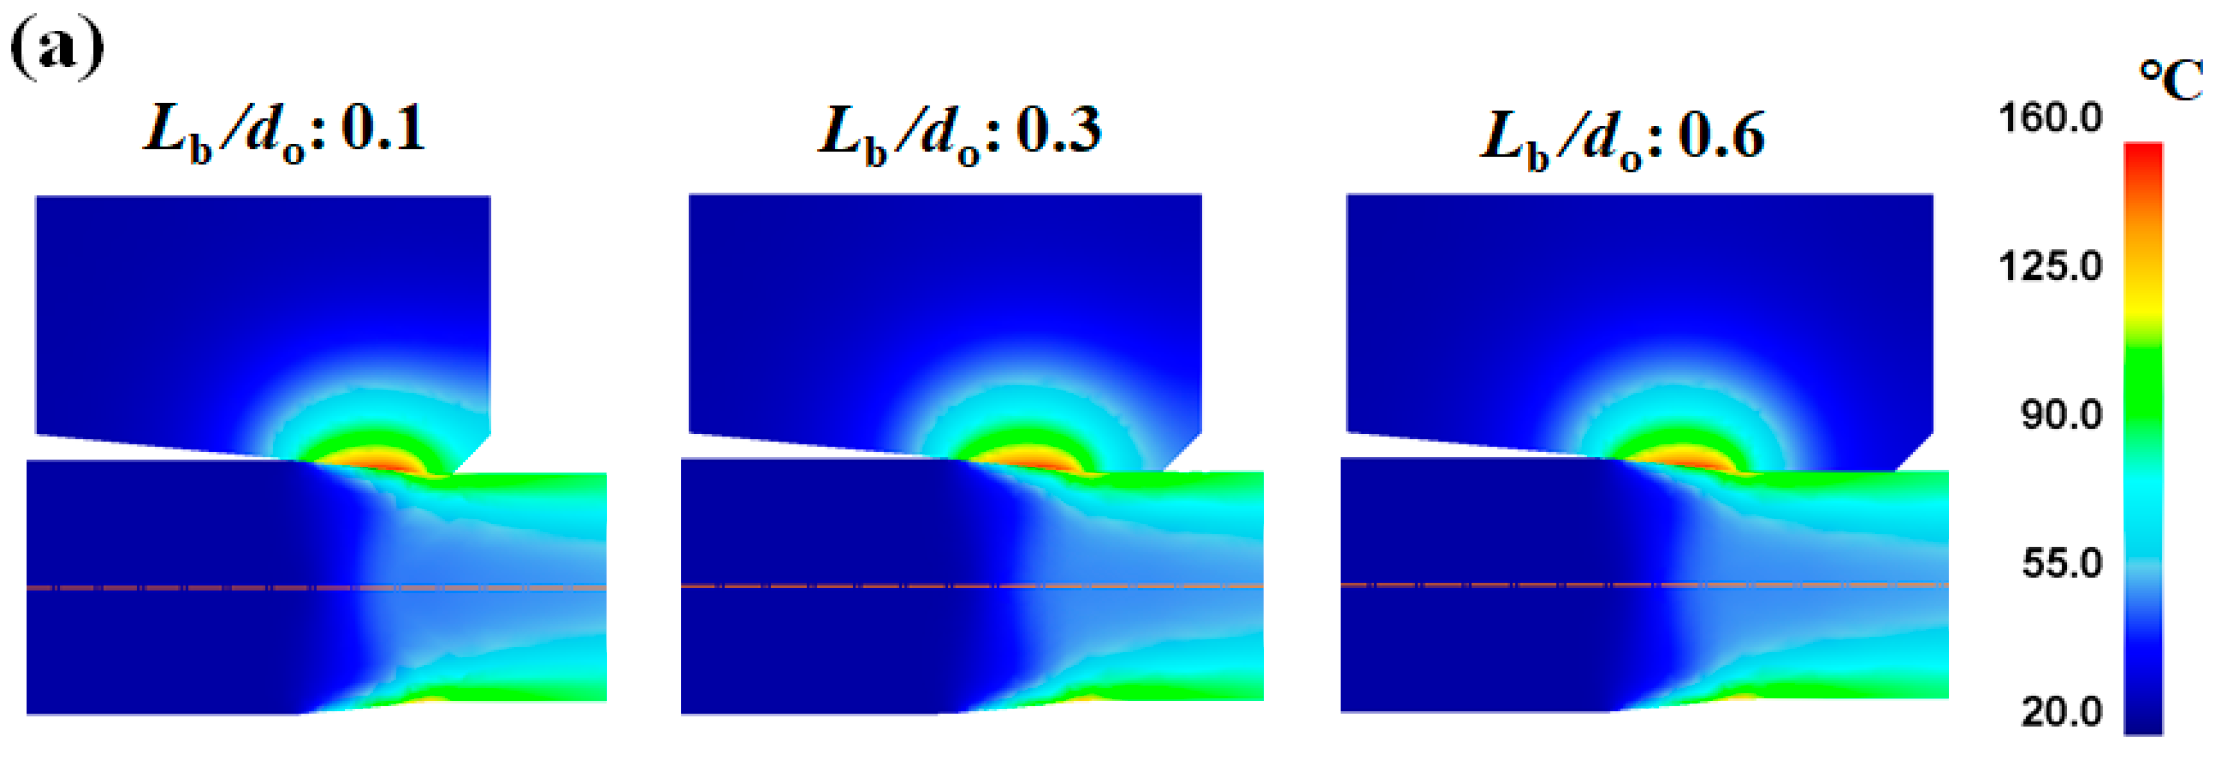
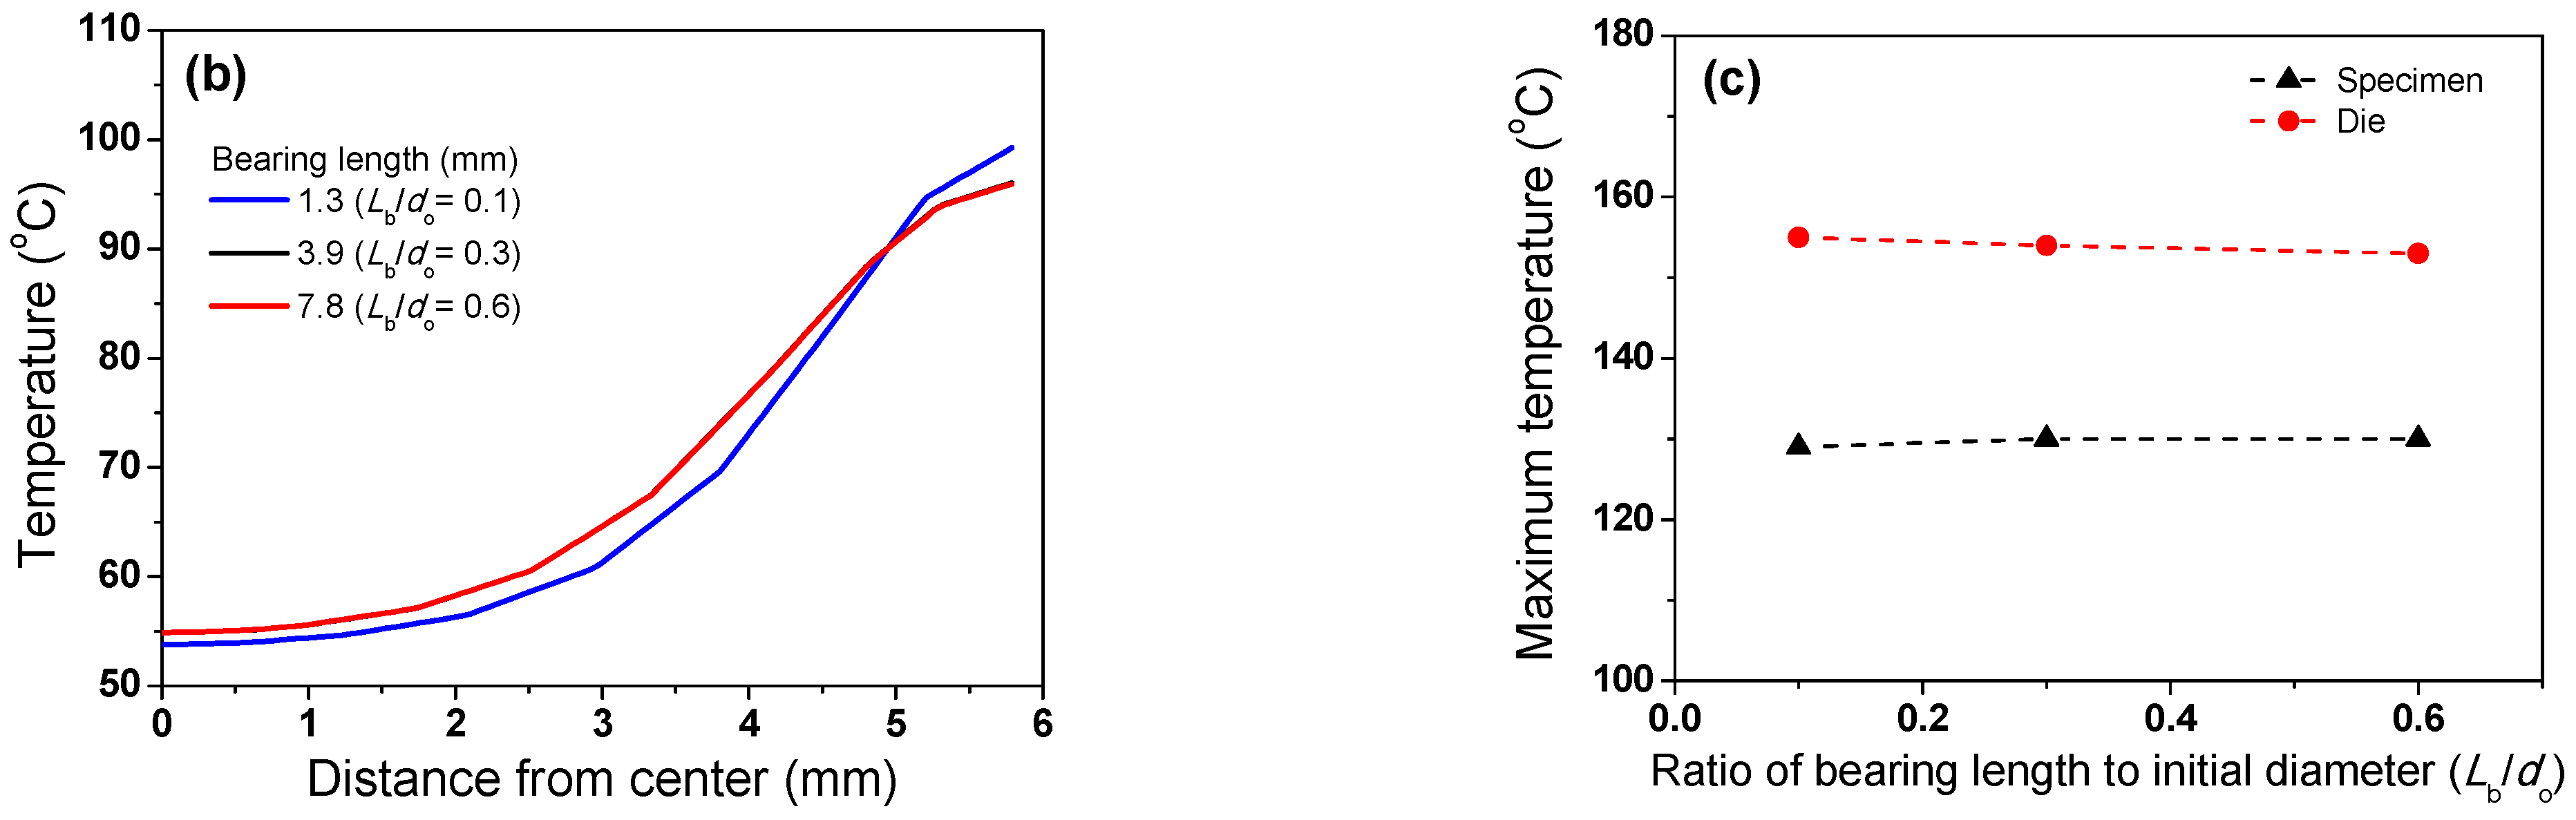
4.6. Effect of Bearing Length
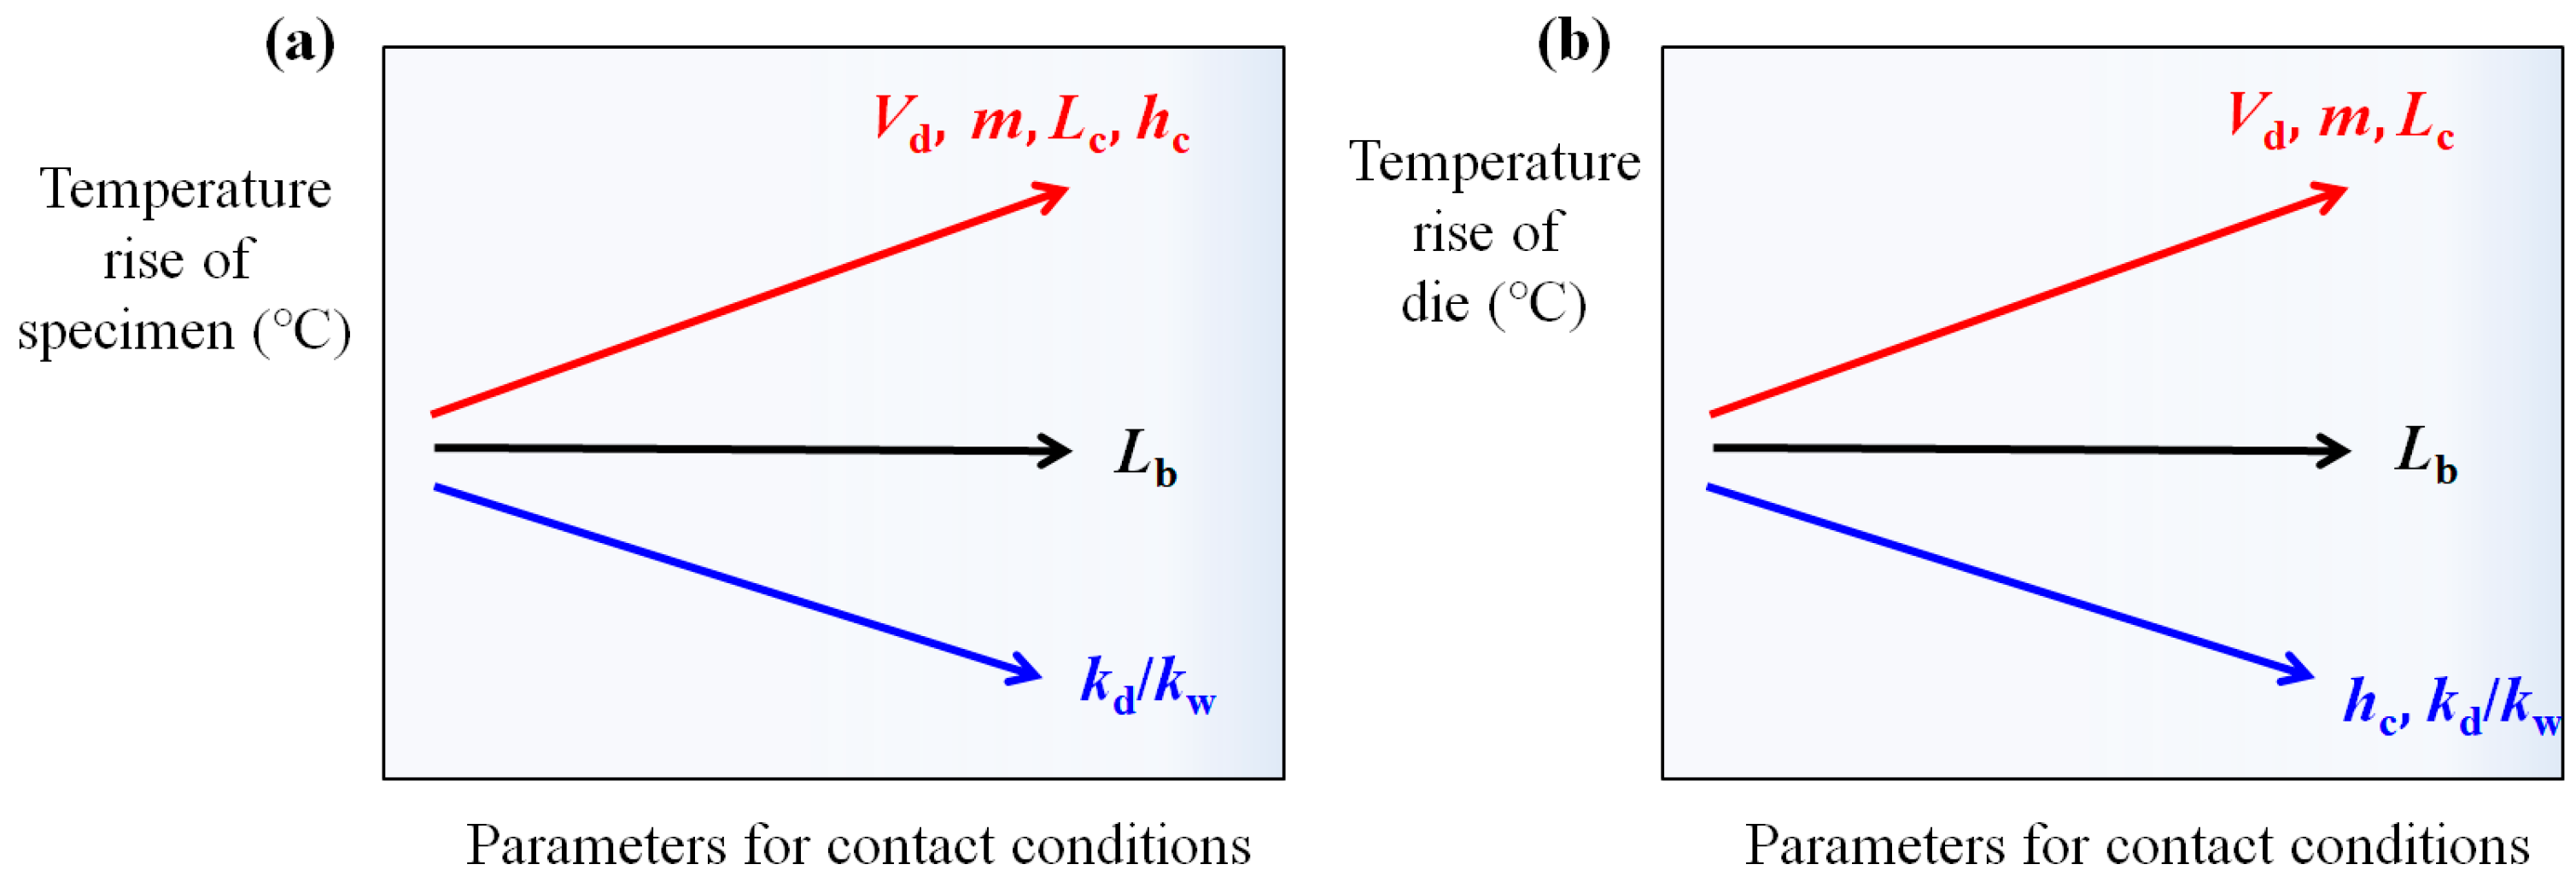
4.7. Effect of Contact Conditions on Temperature Increase
5. Conclusions
- The Tmax of the die decreased with increasing contact heat transfer coefficient, whereas that of the wire increased with contact heat transfer coefficient. The heat generated by friction at the wire–die interface was readily transferred from the die to the wire with an increasing contact heat transfer coefficient.
- The Tmax of the die and wire decreased with increasing thermal conductivity of the die. As the thermal conductivity of the die increased, the heat generated by friction was rapidly absorbed into the die, thus causing the Tmax of the die to decrease. Accordingly, the surface temperature of the wire at the contact region decreased with the thermal conductivity of the die.
- The Tmax of both the die and wire linearly increased with the friction factor. In particular, the Tmax of the die more sensitively changed with the friction factor compared with that of the wire.
- The temperature gradient along the radial direction of the wire increased with the drawing velocity because the heat generated by friction at the wire–die interface did not have enough time to be transferred into the wire interior or atmosphere. Meanwhile, the Tmax of the die linearly increased with drawing velocity, whereas that of the wire parabolically increased with drawing velocity.
- The Tmax of the die and wire increased with the contact length of the wire and die owing to the longer wire and die contact time. By contrast, the effect of the bearing length on the temperature increase of both the wire and die was insignificant.
Author Contributions
Funding
Data Availability Statement
Conflicts of Interest
Nomenclature
| Cp | specific heat (J/kg/K) |
| df | drawn wire diameter (mm) |
| do | initial wire diameter (mm) |
| hc | contact heat transfer coefficient (kW/m2/°C) |
| K | strain hardening coefficient (MPa) |
| k | shear yield stress of the material (MPa) |
| kd | thermal conductivity of die (W/m/°C) |
| kw | thermal conductivity of wire (W/m/°C) |
| Lb | bearing length (mm) |
| Lc | contact length (mm) |
| m | shear friction factor |
| n | strain hardening exponent |
| Rp | reduction in area per pass (%) |
| T | temperature (°C) |
| ΔTi | temperature rise from ideal plastic deformation (°C) |
| ΔTf | temperature increase caused by frictional work (°C) |
| ΔTr | temperature increase caused by redundant work (°C) |
| ΔTt | total temperature increase of wire (°C) |
| Vd | drawing velocity (m/s) |
| α | semi-die angle (degree) |
| β | fraction factor between the mechanical work and heat energy |
| ρ | density (kg/m3) |
| τ | shear stress on the contact surface (MPa) |
References
- Newbury, B.D.; Notis, M.R. The history and evolution of wiredrawing techniques. JOM 2004, 56, 33–37. [Google Scholar]
- Strzępek, P.; Mamala, A.; Zasadzińska, M.; Franczak, K.; Jurkiewicz, B. Research on the drawing process of Cu and CuZn wires obtained in the cryogenic conditions. Cryogenics 2019, 100, 11–17. [Google Scholar] [CrossRef]
- Kauffmann, A.; Freudenberger, J.; Klauß, H.; Schillinger, W.; Subramanya Sarma, V.; Schultz, L. Efficiency of the refinement by deformation twinning in wire drawn single phase copper alloys. Mater. Sci. Eng. A 2015, 624, 71–78. [Google Scholar]
- Hwang, J.K. Effect of drawing speed on microstructure distribution and drawability in twinning-induced plasticity steel during wire drawing. J. Iron Steel Res. Int. 2020, 27, 577–587. [Google Scholar]
- Hillery, M.T.; McCabe, V.J. Wire drawing at elevated temperatures using different die materials and lubricants. J. Mater. Process. Technol. 1995, 55, 53–57. [Google Scholar]
- Wei, D.; Min, X.; Hu, X.; Xie, Z.; Fang, F. Microstructure and mechanical properties of cold drawn pearlitic steel wires: Effects of drawing-induced heating. Mater. Sci. Eng. A 2020, 184, 139341. [Google Scholar] [CrossRef]
- Liu, J.P.; Chen, J.X.; Liu, T.W.; Li, C.; Chen, Y.; Dai, L.H. Superior strength-ductility CoCrNi medium-entropy alloy wire. Scr. Mater. 2020, 181, 19–24. [Google Scholar]
- Kubota, H.; Akimoto, Y.; Saito, K.; Sakurazawa, W.; Yoshida, K. Residual Stress Control in Drawn Bar and Wire by Heating-Cooling-Drawing Process. ISIJ Int. 2021, 61, 2792–2797. [Google Scholar] [CrossRef]
- Lee, S.K.; Lee, S.B.; Kim, B.M. Process design of multi-stage wet wire drawing for improving the drawing speed for 0.72 wt% C steel wire. J. Mater. Process. Technol. 2010, 210, 776–783. [Google Scholar] [CrossRef]
- Lee, S.K.; Kim, D.W.; Jeong, M.S.; Kim, B.M. Evolution of axial surface residual stress in 0.82 carbon steel wire during multi pass drawing process considering heat generation. Mater. Des. 2012, 34, 363–371. [Google Scholar] [CrossRef]
- Lee, S.K.; Ko, D.C.; Kim, B.M. Pass schedule of wire drawing process to prevent delamination for high strength steel cord wire. Mater. Des. 2009, 30, 2919–2927. [Google Scholar]
- Jo, H.H.; Lee, S.K.; Kim, M.A.; Kim, B.M. Pass schedule design system in the dry wire-drawing process of high carbon steel. Proc. IMechE Part B J. Eng. Manuf. 2002, 216, 365–373. [Google Scholar]
- Muskalski, Z. Selected problems from the high-carbon steel wire drawing theory and technology. Arch. Metall. Mater. 2014, 59, 527–535. [Google Scholar] [CrossRef]
- Suliga, M. Analysis of the heating of steel wires during high speed multipass drawing process. Arch. Metall. Mater. 2014, 59, 1475–1480. [Google Scholar]
- Hwang, J.K. Fracture behavior of twinning-induced plasticity steel during wire drawing. J. Mater. Res. Technol. 2020, 9, 4527–4537. [Google Scholar]
- Haddi, A.; Imad, A.; Vega, G. Analysis of temperature and speed effects on the drawing stress for improving the wire drawing process. Mater. Des. 2011, 32, 4310–4315. [Google Scholar] [CrossRef]
- Cetinarslan, C.S.; Guzey, A. Tensile properties of cold-drawn low-carbon steel wires under different process parameters. Mater. Technol. 2013, 47, 245–252. [Google Scholar]
- Vega, G.; Haddi, A.; Imad, A. Temperature effects on wire-drawing process: Experimental investigation. Int. J. Mater. Form. 2009, 2, 229–232. [Google Scholar] [CrossRef]
- Suliga, M.; Kruzel, R.; Garstka, T.; Gazdowicz, J. The influence of drawing speed on structure changes in high carbon steel wires. Metalurgija 2015, 54, 161–164. [Google Scholar]
- Pilarczyk, J.W.; Markowski, J.; Dyja, H.; Golis, B. FEM modeling of drawing of wires for prestressed concrete. Wire J. Int. 2004, 37, 118c123. [Google Scholar]
- Nemec, I.; Golis, B.; Pilarczyk, J.W.; Budzik, R.; Waszkielewicz, W. Effect of high-speed drawing on properties of high-carbon steel wires. Wire J. Int. 2007, 40, 63–68. [Google Scholar]
- Rittmann, K. Temperaturerhöhungen der Ziehholoberfläche beim Kaltziehen von Stabstahl mit großen Ziehgeschwindigkeiten. Arch. Für Das Eisenhüttenwesen 1971, 42, 265–271. [Google Scholar] [CrossRef]
- Zhang, G.L.; Wang, Z.W.; Zhang, S.H.; Cheng, M.; Song, H.W. A fast optimization approach for multipass wire drawing processes based on the analytical model. Proc. IMechE Part B J. Eng. Manuf. 2013, 227, 1023–1031. [Google Scholar]
- Strzępek, P.; Mamala, A.; Zasadzińska, M.; Kiesiewicz, G.; Knych, T.A. Shape analysis of the elastic deformation region throughout the axi-symmetric wire drawing process of ETP grade copper. Materials 2021, 14, 4713. [Google Scholar]
- Suliga, M.; Jabłońska, M.; Hawryluk, M. The effect of the length of the drawing die sizing portion on the energy and force parameters of the medium-carbon steel wire drawing process. Arch. Metall. Mater. 2019, 64, 1353–1359. [Google Scholar]
- Farr, J.P.G. Molybdenum disulphide in lubrication. A review. Wear 1975, 35, 1–22. [Google Scholar]
- Vadiraj, A.; Kamaraj, M.; Sreenivasan, V.S. Effect of solid lubricants on friction and wear behaviour of alloyed gray cast iron. Sadhana 2012, 37, 569–577. [Google Scholar] [CrossRef] [Green Version]
- Winer, W.O. Molybdenum disulfide as a lubricant: A review of the fundamental knowledge. Wear 1967, 10, 422–452. [Google Scholar]
- Hwang, J.K. Thermal Behavior of a Rod during Hot Shape Rolling and Its Comparison with a Plate during Flat Rolling. Processes 2020, 8, 327. [Google Scholar]
- Hwang, J.K. Effect of Air Temperature on the Thermal Behavior and Mechanical Properties of Wire Rod Steel during Stelmor Cooling. ISIJ Int. 2022, 62, 2343–2354. [Google Scholar]
- Kemp, I.P.; Pollard, G.; Bramley, A.N. Temperature distributions in the high speed drawing of high strength steel wire. Int. J. Mech. Sci. 1985, 27, 803–811. [Google Scholar] [CrossRef]
- Curtze, S.; Kuokkala, V.T. Dependence of tensile deformation behavior of TWIP steels on stacking fault energy, temperature and strain rate. Acta Mater. 2010, 58, 5129–5141. [Google Scholar]
- Yang, H.K.; Zhang, Z.J.; Dong, F.Y.; Duan, Q.Q.; Zhang, Z.F. Strain rate effects on tensile deformation behaviors for Fe-22Mn-0.6C-(1.5Al) twinning-induced plasticity steel. Mater. Sci. Eng. A 2014, 607, 551–558. [Google Scholar]
- Lee, H.W.; Kwon, H.C.; Im, Y.T.; Hodgson, P.D.; Zahiri, S.H. Local austenite grain size distribution in hot bar rolling of AISI 4135 steel. ISIJ Int. 2005, 45, 706–712. [Google Scholar] [CrossRef]
- Neu, R.W. Performance and characterization of TWIP steels for automotive applications. Mater. Perform. Charact. 2013, 2, 244–284. [Google Scholar]
- Moon, C.; Kim, N. Analysis of wire-drawing process with friction and thermal conditions obtained by inverse engineering. J. Mech. Sci. Technol. 2012, 26, 2903–2911. [Google Scholar] [CrossRef]
- Na, D.H.; Lee, Y. A study to predict the creation of surface defects on material and suppress them in caliber rolling process. Int. J. Precis. Eng. Manuf. 2013, 14, 1727–1734. [Google Scholar] [CrossRef]
- Nalawade, R.S.; Puranik, A.J.; Balachandran, G.; Mahadik, K.N.; Balasubramanian, V. Simulation of hot rolling deformation at intermediate passed and its industrial validity. Int. J. Mech. Sci. 2013, 77, 8–16. [Google Scholar]
- Bagheripoor, M.; Bisadi, H. Effects of rolling parameters on temperature distribution in the hot rolling of alumimum strips. Appl. Therm. Eng. 2011, 31, 1556–1565. [Google Scholar] [CrossRef]
- Wu, J.; Liang, X.; Tang, A.; Pan, F. Interfacial heat transfer under mixed lubrication condition for metal rolling: A theoretical calculation study. Appl. Therm. Eng. 2016, 106, 1002–1009. [Google Scholar] [CrossRef]
- Serajzadeh, S.; Karimi, T.A.; Nejati, M.; Izadi, J.; Fattahi, M. An investigation on strain inhomogeneity in hot strip rolling process. J. Mater. Process. Technol. 2002, 128, 88–99. [Google Scholar]
- Malinowski, Z.; Lenard, J.G.; Davies, M.E. A study of the heat-transfer coefficient as a function of temperature and pressure. J. Mater. Process. Technol. 1994, 41, 125–142. [Google Scholar] [CrossRef]
- Hwang, J.K. Comparison of Temperature Distribution between TWIP and Plain Carbon Steels during Wire Drawing. Materials 2022, 15, 8696. [Google Scholar] [CrossRef]
- Chen, C.; Sun, M.; Wang, B.; Zhou, J.; Jiang, Z. Recent Advances on Drawing Technology of Ultra-Fine Steel Tire Cord and Steel Saw Wire. Metals 2021, 10, 1590. [Google Scholar] [CrossRef]
- Lazzarotto, L.; Dubar, L.; Dubois, A.; Ravassard, P.; Oudin, J. Identification of Coulomb's friction coefficient in real contact conditions applied to a wire drawing process. Wear 1997, 211, 54–63. [Google Scholar]
- Haddi, A.; Imad, A.; Vega, G. The influence of the drawing parameters and temperature rise on the prediction of chevron crack formation in wire drawing. Int. J. Fract. 2012, 176, 171–180. [Google Scholar]
- Radionova, L.V.; Gromov, D.V.; Svistun, A.S.; Lisovskiy, R.A.; Faizov, S.R.; Glebov, L.A.; Zaramenskikh, S.E.; Bykov, V.A.; Erdakov, I.N. Mathematical modeling of heating and strain aging of steel during high-speed wire drawing. Metals 2022, 12, 1472. [Google Scholar] [CrossRef]
- Huang, M.; Fu, Y.; Qiao, X.; Chen, P. Investigation into Friction and Wear Characteristics of 316L Stainless-Steel Wire at High Temperature. Materials 2023, 16, 213. [Google Scholar] [CrossRef] [PubMed]
- Liu, X.Y.; Zhang, S.H. The design of a drawing die based on the logistic function for the energy analysis of drawing force. Appl. Math. Model. 2022, 109, 833–847. [Google Scholar]
- Lo, S.W.; Lu, Y.H. Wire drawing dies with prescribed variations of strain rate. J. Mater. Process. Technol. 2002, 123, 212–218. [Google Scholar]
- Lowrie, J.; Ngaile, G. Analytical modeling of hydrodynamic lubrication in a multiple-reduction drawing die. J. Manuf. Process 2017, 27, 291–303. [Google Scholar]
- Suliga, M.; Wartacz, R.; Hawryluk, M.; Kostrzewa, J. Effect of Drawing in Conventional and Hydrodynamic Dies on Structure and Corrosion Resistance of Hot-Dip Galvanized Zinc Coatings on Medium-Carbon Steel Wire. Materials 2022, 15, 6728. [Google Scholar]
- Nilsson, M.; Olsson, M. Tribological testing of some potential PVD and CVD coatings for steel wire drawing dies. Wear 2011, 273, 55–59. [Google Scholar] [CrossRef]
- Siegert, K.; Möck, A. Wire drawing with ultrasonically oscillating dies. J. Mater. Process. Technol. 1996, 60, 657–660. [Google Scholar]
- Pohlman, R.; Lehfeldt, E. Influence of ultrasonic vibration on metallic friction. Ultrasonics 1966, 4, 178–185. [Google Scholar]
- Liu, S.; Xie, T.; Han, J.; Shan, X. Stress superposition effect in ultrasonic drawing of titanium wires: An experimental study. Ultrasonics 2022, 125, 106775. [Google Scholar] [CrossRef]
- Stolyarov, A.; Polyakova, M.; Atangulova, G.; Alexandrov, S. Effect of die angle and frictional conditions on fine grain layer generation in multipass drawing of high carbon steel wire. Metals 2020, 10, 1462. [Google Scholar]
- Suliga, M.; Wartacz, R.; Michalczyk, J. High speed multi-stage drawing process of hot-dip galvanised steel wires. Int. J. Adv. Manuf. Technol. 2022, 120, 7639–7655. [Google Scholar]
- Wei, D.; Wang, L.; Hu, X.; Mao, X.; Xie, Z.; Fang, F. Effect of drawing strain rate on microstructure and mechanical properties of cold-drawn pearlitic steel wires. J. Mater. Sci. 2022, 57, 8924–8939. [Google Scholar] [CrossRef]
- Santana Martinez, G.A.; Qian, W.L.; Kabayama, L.K.; Prisco, U. Effect of process parameters in copper-wire drawing. Metals 2020, 10, 105. [Google Scholar] [CrossRef]
- Alexandrov, S.; Hwang, Y.M.; Tsui, H.S.R. Determining the Drawing Force in a Wire Drawing Process Considering an Arbitrary Hardening Law. Processes 2022, 10, 1336. [Google Scholar]
- Överstam, H. The influence of bearing geometry on the residual stress state in cold drawn wire, analysed by the FEM. J. Mater. Process. Technol. 2006, 171, 446–450. [Google Scholar] [CrossRef]
- Luis, C.J.; Leon, J.; Luri, R. Comparison between finite element method and analytical methods for studying wire drawing processes. J. Mater. Process. Technol. 2005, 164–165, 1218–1225. [Google Scholar] [CrossRef]
- Luksza, J.; Majta, J.; Burdek, M.; Ruminski, M. Modeling and measurements of mechanical behaviour in multi-pass drawing process. J. Mater. Process. Technol. 1998, 80–81, 398–405. [Google Scholar] [CrossRef]
- Chin, R.K.; Stelf, P.S. A computational study of strain inhomogeneity in wire drawing. Int. J. Mach. Tools Manuf. 1995, 35, 1087–1098. [Google Scholar]
- Karimi Taheri, A.; Maccagno, T.M.; Jonas, J.J. Dynamic Strain Aging and the Wire Drawing of Low Carbon Steel Rods. ISIJ Int. 1995, 35, 1532–1540. [Google Scholar]
- Kabayama, L.K.; Taguchi, S.P.; Martínez, G.A.S. The influence of die geometry on stress distribution by experimental and FEM simulation on electrolytic copper wiredrawing. Mat. Res. 2009, 12, 281–285. [Google Scholar] [CrossRef]
- Martínez, G.A.S.; Rodriguez-Alabanda, O.; Prisco, U.; Tintelecan, M.; Kabayama, L.K. The influences of the variable speed and internal die geometry on the performance of two commercial soluble oils in the drawing process of pure copper fine wire. Int. J. Adv. Manuf. Technol. 2022, 118, 3749–3760. [Google Scholar]
- Prisco, U.; Martinez, G.A.S.; Kabayama, L.K. Effect of die pressure on the lubricating regimes achieved in wire drawing. Prod. Eng. 2020, 14, 667–676. [Google Scholar] [CrossRef]


| Parameter | Experiment | FEA | Error (%) |
|---|---|---|---|
| Equilibrium drawing force (kN) | 22.5 ± 1.8 | 22.8 ± 1.4 | 1.4 |
| Equilibrium core temperature (°C) | 72.2 ± 3.7 | 75.1 ± 0.3 | 4.0 |
Disclaimer/Publisher’s Note: The statements, opinions and data contained in all publications are solely those of the individual author(s) and contributor(s) and not of MDPI and/or the editor(s). MDPI and/or the editor(s) disclaim responsibility for any injury to people or property resulting from any ideas, methods, instructions or products referred to in the content. |
© 2023 by the authors. Licensee MDPI, Basel, Switzerland. This article is an open access article distributed under the terms and conditions of the Creative Commons Attribution (CC BY) license (https://creativecommons.org/licenses/by/4.0/).
Share and Cite
Hwang, J.-K.; Chang, Y.-C. Effects of Contact Conditions at Wire–Die Interface on Temperature Distribution during Wire Drawing. Processes 2023, 11, 513. https://doi.org/10.3390/pr11020513
Hwang J-K, Chang Y-C. Effects of Contact Conditions at Wire–Die Interface on Temperature Distribution during Wire Drawing. Processes. 2023; 11(2):513. https://doi.org/10.3390/pr11020513
Chicago/Turabian StyleHwang, Joong-Ki, and Young-Chul Chang. 2023. "Effects of Contact Conditions at Wire–Die Interface on Temperature Distribution during Wire Drawing" Processes 11, no. 2: 513. https://doi.org/10.3390/pr11020513