


Microwave-Osmo-Dehydro-Freezing and Storage of Pineapple Titbits—Quality Advantage

Abstract
:1. Introduction
2. Materials and Methods
2.1. Sample Preparation
2.2. Coating Solution Preparation
2.3. Conventional Osmotic Dehydration-Samples Preparation
2.4. MWODS Sample Preparation
2.5. MWODS Coated Samples Preparation
2.6. Frozen Storage
2.7. Weight Reduction, Moisture Loss and Solid Gain
2.8. Ratio of Moisture Loss over Solids Gain
2.9. Drip Loss
2.10. Color
2.11. Texture
2.12. Statistical Analysis
3. Results and Discussion
3.1. Weight Reduction
3.2. Moisture Loss
3.3. Solid Gain
3.4. ML/SG Ratio
3.5. Drip Loss
3.5.1. Effect of MWODS on Drip Loss
3.5.2. Effect of the Coating on Drip Loss
3.6. Texture
3.6.1. Effect of MWODS on the Texture
3.6.2. Effect of the Edible Coating on Texture
3.7. Color
3.7.1. L* Value
3.7.2. b* Value
3.7.3. C Value
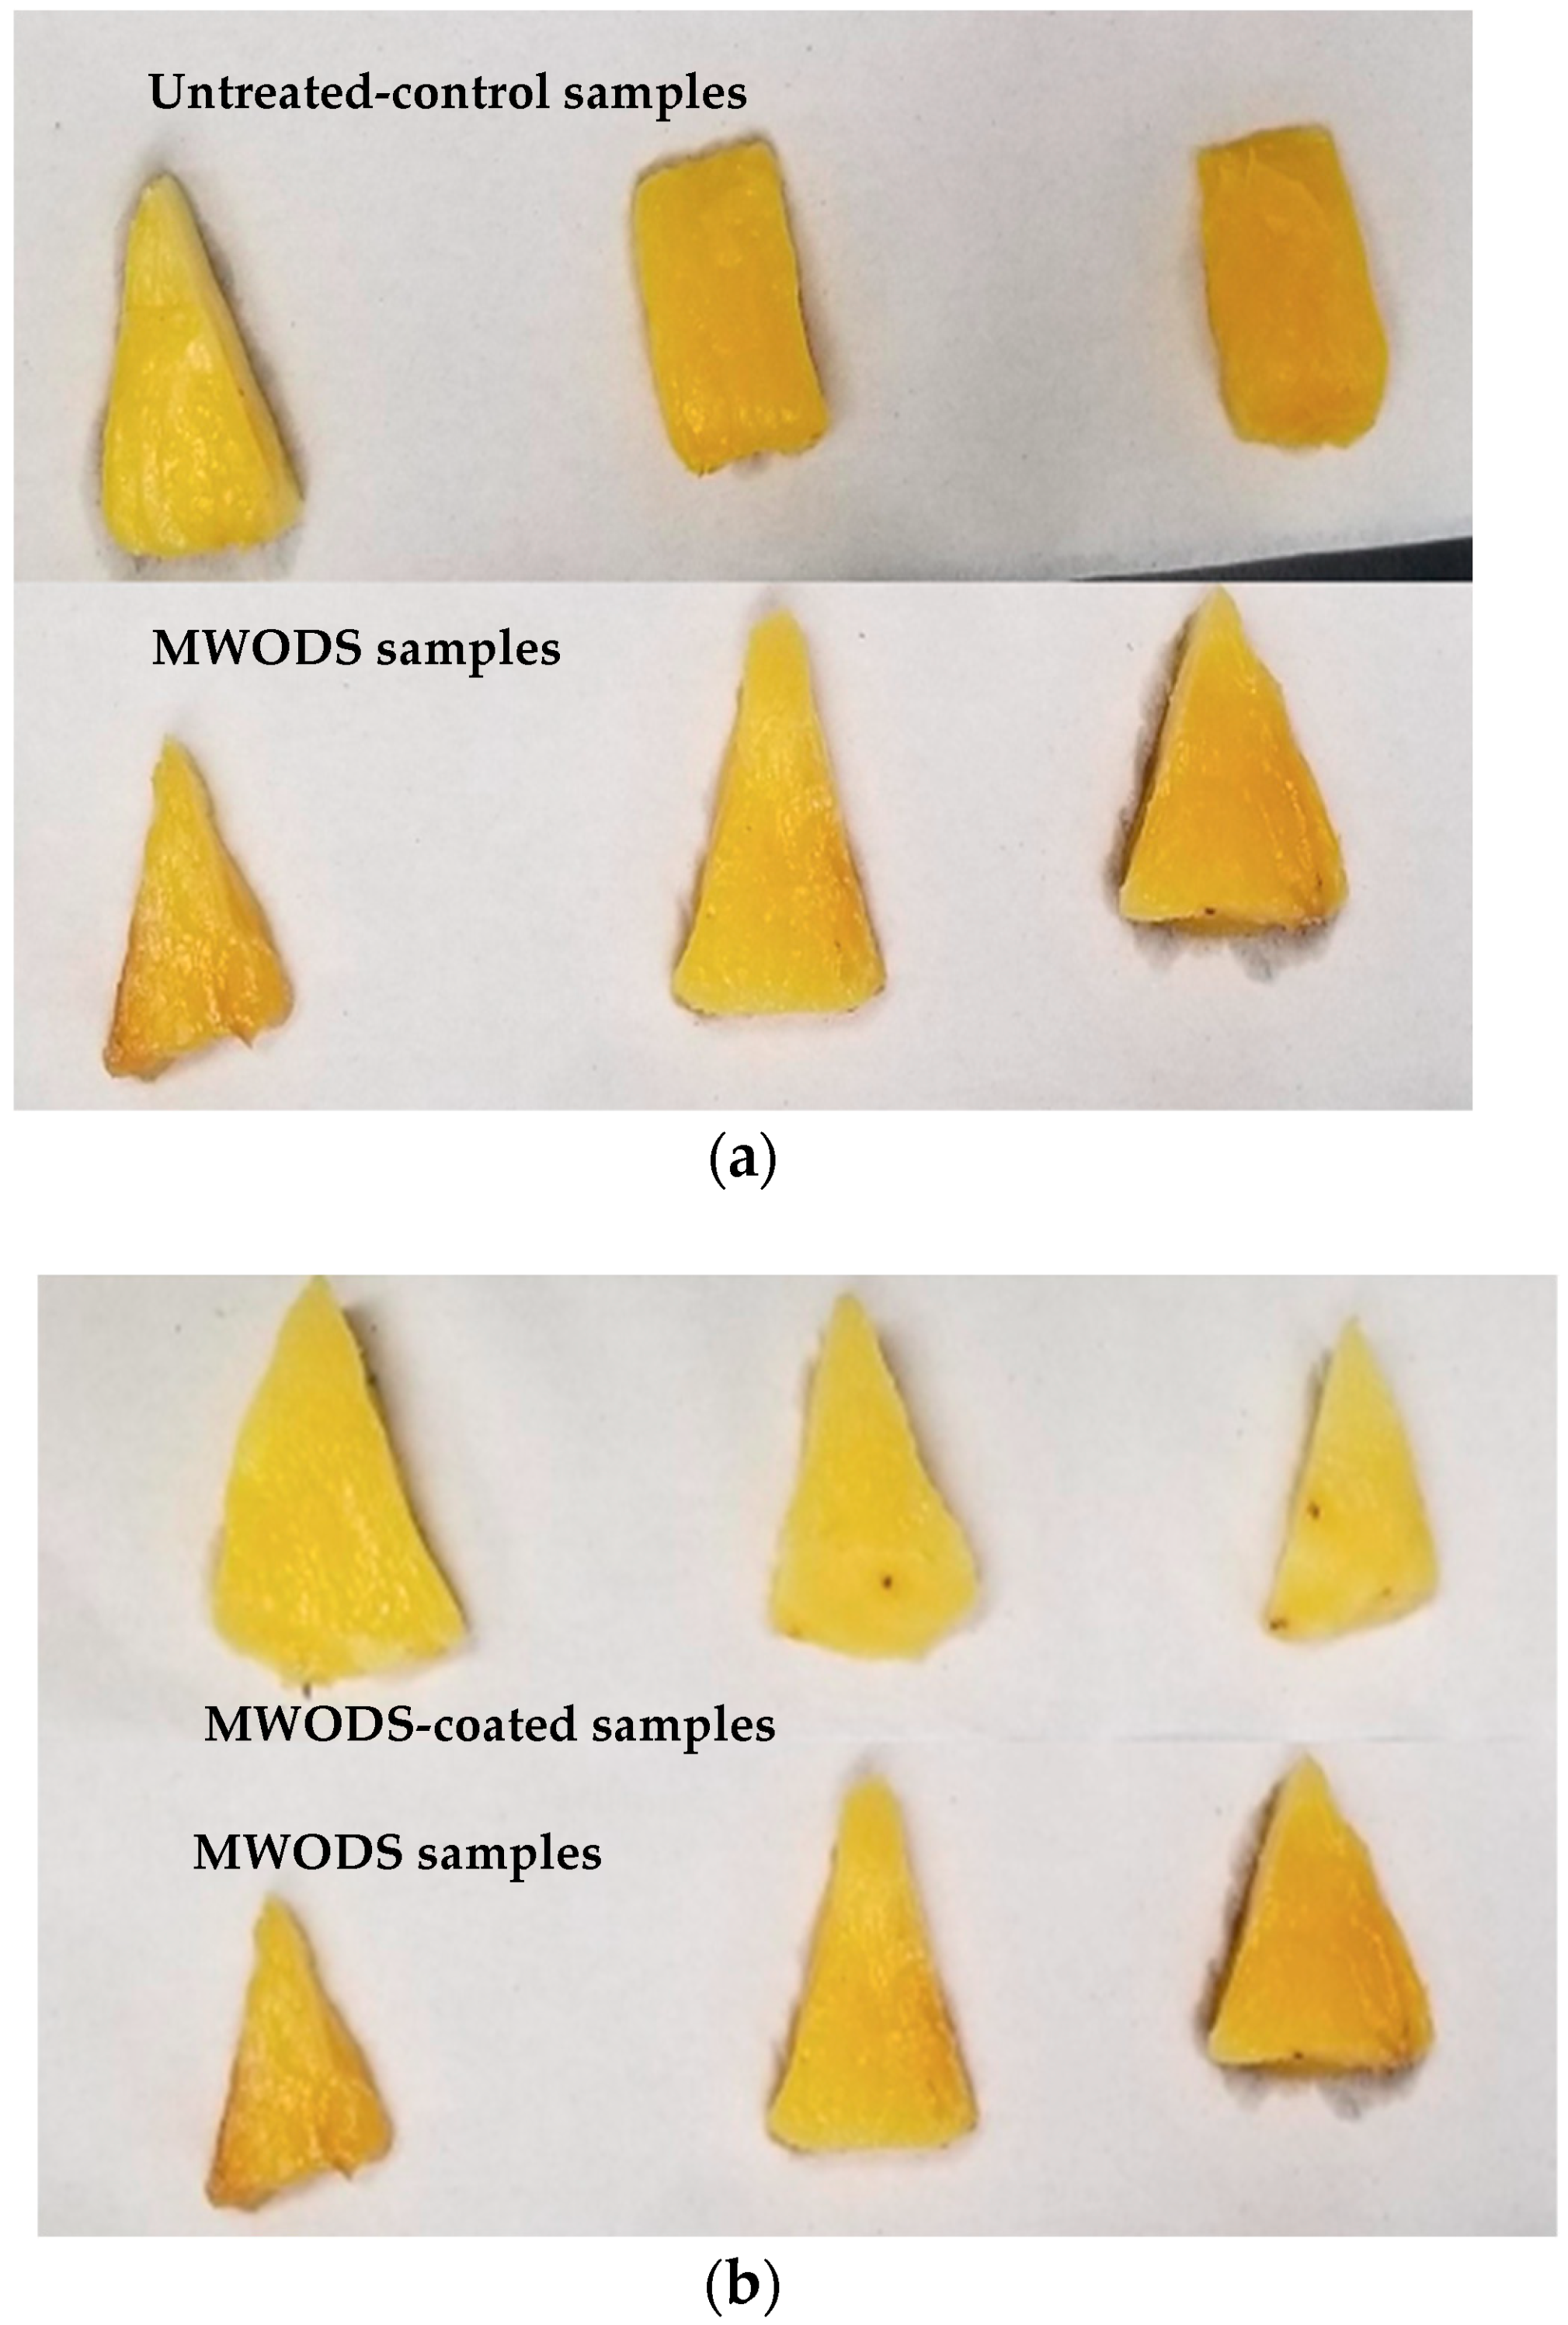
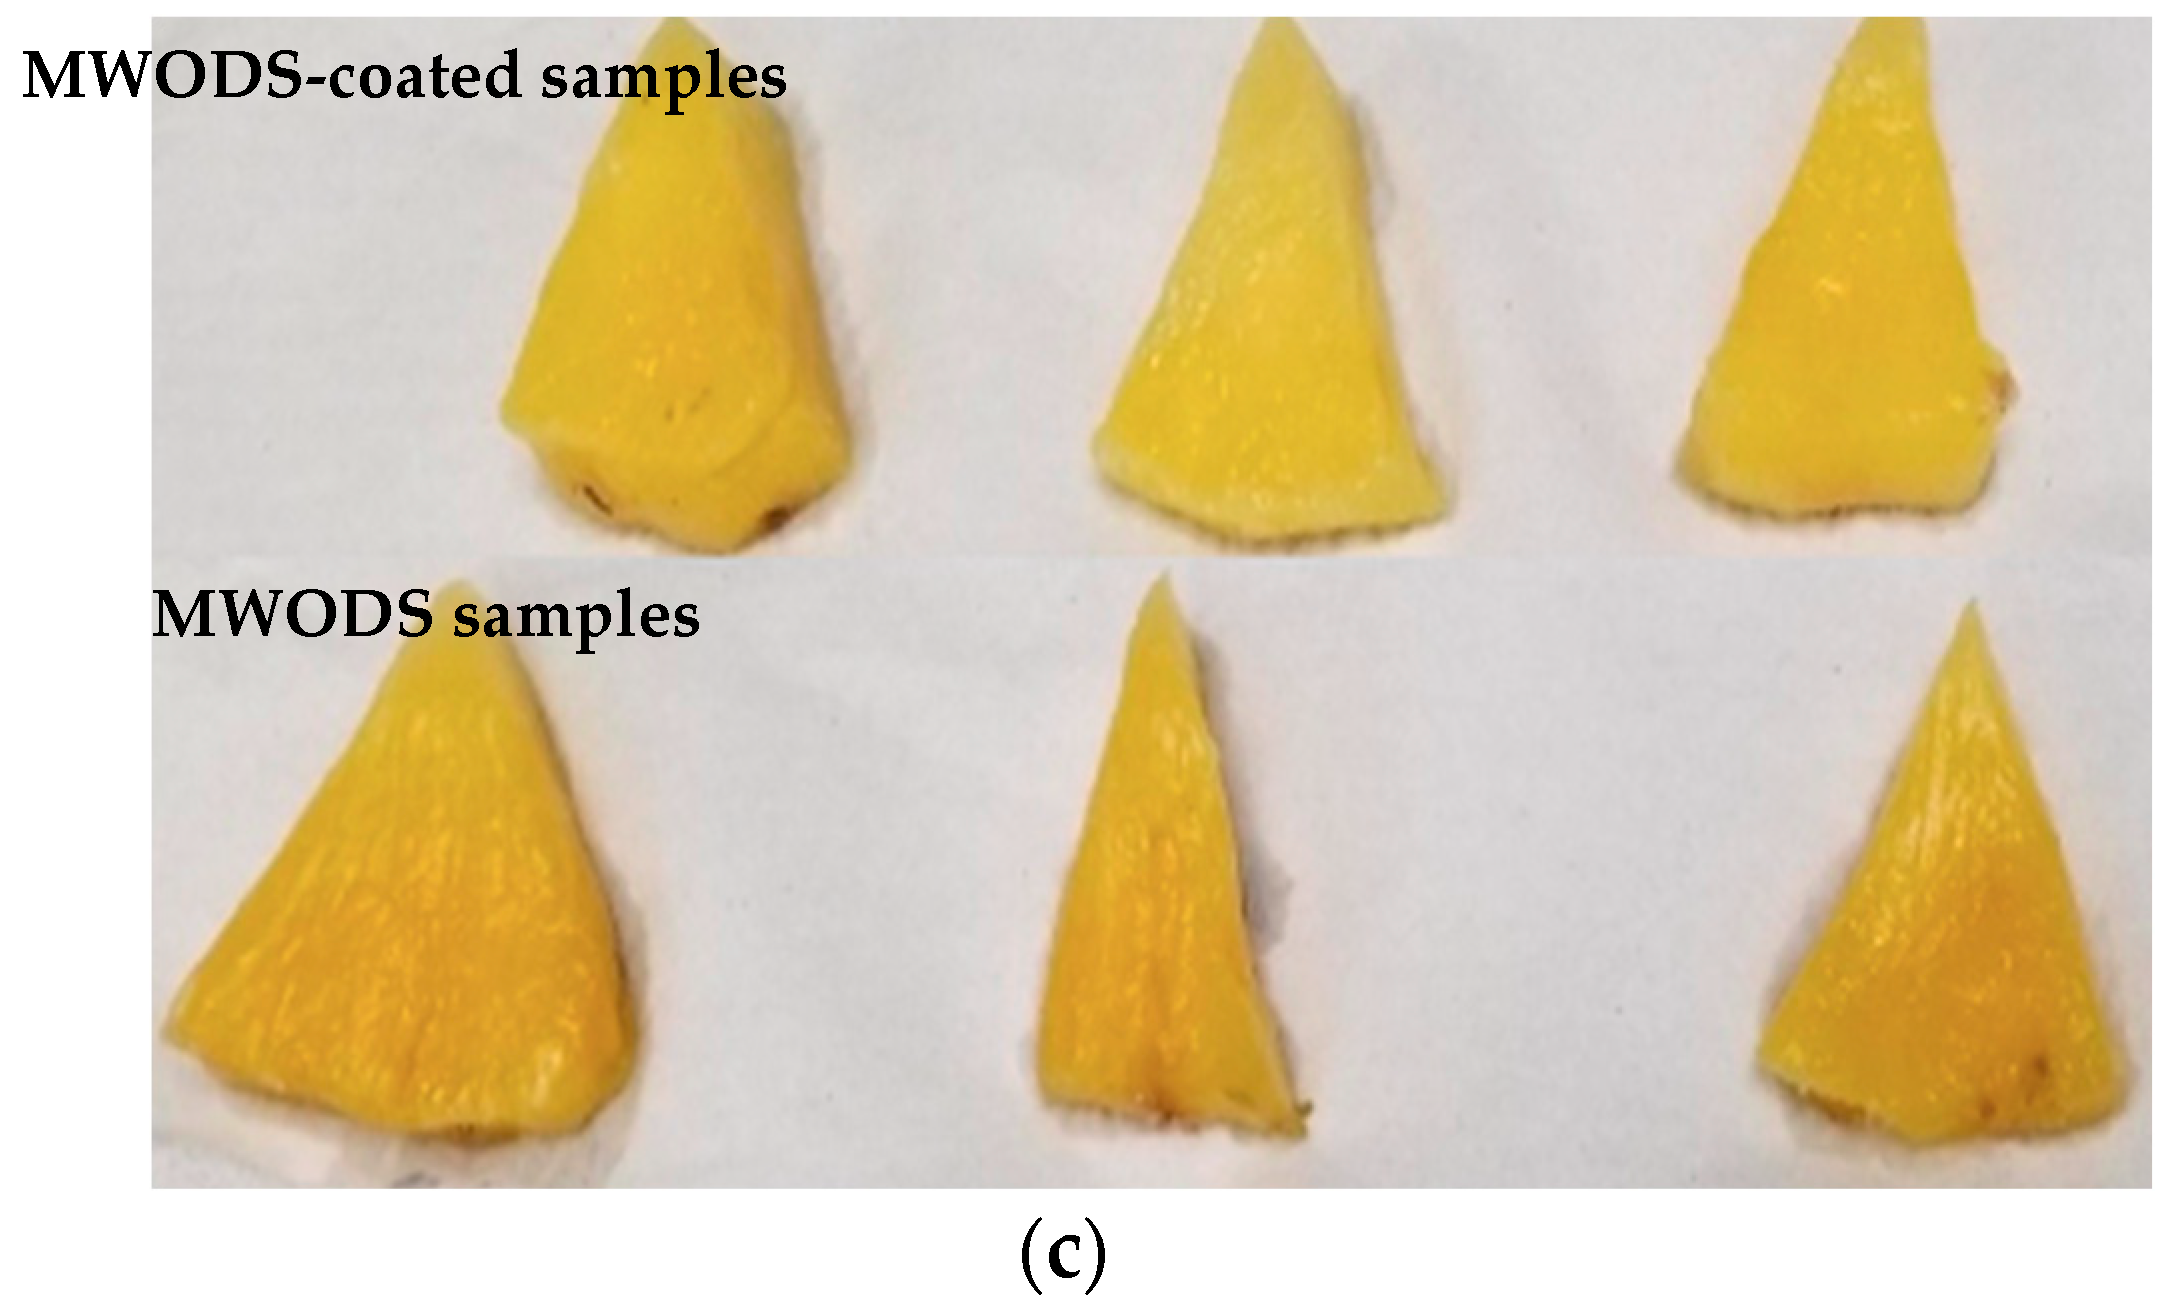
3.8. Appearance
4. Conclusions
Author Contributions
Funding
Institutional Review Board Statement
Informed Consent Statement
Data Availability Statement
Conflicts of Interest
References
- Van Arsdel, W.B.; Copely, M.J.; Olson, R.L. Quality and Stability in Frozen Foods, “Time-Temperature Tolerance” and Its Significance. J. Nutr. Educ. 1970, 1, 44. [Google Scholar]
- Marani, C.; Agnelli, M.; Mascheroni, R. Osmo-frozen fruits: Mass transfer and quality evaluation. J. Food Eng. 2007, 79, 1122–1130. [Google Scholar] [CrossRef]
- Dermesonlouoglou, E.K.; Giannakourou, M.; Taoukis, P.S. Kinetic study of the effect of the osmotic dehydration pre-treatment with alternative osmotic solutes to the shelf life of frozen strawberry. Food Bioprod. Process. 2016, 99, 212–221. [Google Scholar] [CrossRef]
- Li, B.; Sun, D.-W. Novel methods for rapid freezing and thawing of foods—A review. J. Food Eng. 2002, 54, 175–182. [Google Scholar] [CrossRef]
- Ben Haj Said, L.; Bellagha, S.; Allaf, K. Dehydrofreezing of Apple Fruits: Freezing Profiles, Freezing Characteristics, and Texture Variation. Food Bioprocess Technol. Int. J. 2016, 9, 252–261. [Google Scholar] [CrossRef]
- Alabi, K.P.; Olalusi, A.P.; Olaniyan, A.M.; Fadeyibi, A.; Gabriel, L.O. Effects of osmotic dehydration pretreatment on freezing characteristics and quality of frozen fruits and vegetables. J. Food Process. Eng. 2022, 45, e14037. [Google Scholar] [CrossRef]
- Schudel, S.; Prawiranto, K.; Defraeye, T. Comparison of freezing and convective dehydrofreezing of vegetables for reducing cell damage. J. Food Eng. 2021, 293, 110376. [Google Scholar] [CrossRef]
- Tumer, E.; Tulek, Y. Effects of dehydrofreezing conditions on tomato lycopene and kinetics of lycopene change in dehydrofrozen tomatoes during storage. J. Food Process. Eng. 2022, 46, e14237. [Google Scholar] [CrossRef]
- Hajji, W.; Gliguem, H.; Bellagha, S.; Allaf, K. Structural and textural improvements of strawberry fruits by partial water removal prior to conventional freezing process. J. Food Meas. Charact. 2022, 16, 3344–3353. [Google Scholar] [CrossRef]
- Hajji, W.; Rekik, C.; Besombes, C.; Bellagha, S.; Allaf, K. Optimisation of Instant Controlled Pressure Drop (DIC)-assisted dehydrofreezing using Response Surface Methodology towards better bioactive compounds retention of quince fruit. Acta Aliment. 2022, 51, 11–20. [Google Scholar] [CrossRef]
- Said, L.B.; Bellagha, S.; Allaf, K. Instant controlled pressure drop (DIC) assisted dehydrofreezing for improving freezing/thawing efficiency and apple fruit texture. J. Food Meas. Charact. 2021, 15, 577–584. [Google Scholar] [CrossRef]
- Fan, K.; Zhang, M.; Wang, W.; Bhandari, B. A novel method of osmotic-dehydrofreezing with ultrasound enhancement to improve water status and physicochemical properties of kiwifruit. Int. J. Refrig. 2020, 113, 49–57. [Google Scholar] [CrossRef]
- Fan, X.; Liu, B.; Cao, J.; Jiang, W.; Guo, F.; Zhang, C.; Nie, X.; Gong, H. Dehydrofreezing of peach: Blanching, D-sodium erythorbate vacuum infiltration, vacuum dehydration, and nitrogen packaging affect the thawed quality of peach. J. Food Biochem. 2019, 43, e12830. [Google Scholar] [CrossRef] [PubMed]
- Zhao, J.-H.; Liu, F.; Pang, X.-L.; Xiao, H.-W.; Wen, X.; Ni, Y.-Y. Effects of different osmo-dehydrofreezing treatments on the volatile compounds, phenolic compounds and physicochemical properties in mango (Mangifera indica L.). Int. J. Food Sci. Technol. 2016, 51, 1441–1448. [Google Scholar] [CrossRef]
- Ramallo, L.; Mascheroni, R. Dehydrofreezing of pineapple. J. Food Eng. 2010, 99, 269–275. [Google Scholar] [CrossRef]
- James, C.; Purnell, G.; James, S.J. A Review of Novel and Innovative Food Freezing Technologies. Food Bioprocess Technol. 2015, 8, 1616–1634. [Google Scholar] [CrossRef]
- Ramya, V.; Jain, N.K. A Review on Osmotic Dehydration of Fruits and Vegetables: An Integrated Approach. J. Food Process. Eng. 2016, 40, e12440. [Google Scholar] [CrossRef]
- Zhao, J.-H.; Hu, R.; Xiao, H.-W.; Yang, Y.; Liu, F.; Gan, Z.-L.; Ni, Y.-Y. Osmotic dehydration pretreatment for improving the quality attributes of frozen mango: Effects of different osmotic solutes and concentrations on the samples. Int. J. Food Sci. Technol. 2013, 49, 960–968. [Google Scholar] [CrossRef]
- Agnelli, M.; Marani, C.; Mascheroni, R. Modelling of heat and mass transfer during (osmo) dehydrofreezing of fruits. J. Food Eng. 2005, 69, 415–424. [Google Scholar] [CrossRef]
- Matuska, M.; Lenart, A.; Lazarides, H.N. On the use of edible coatings to monitor osmotic dehydration kinetics for minimal solids uptake. J. Food Eng. 2006, 72, 85–91. [Google Scholar] [CrossRef]
- Li, H.; Ramaswamy, H.S. Osmotic Dehydration of Apple Cylinders: III. Continuous Medium Flow Microwave Heating Conditions. Dry. Technol. 2006, 24, 643–651. [Google Scholar] [CrossRef]
- Azarpazhooh, E.; Ramaswamy, H.S. Microwave-Osmotic Dehydration of Apples Under Continuous Flow Medium Spray Conditions: Comparison with Other Methods. Dry. Technol. 2009, 28, 49–56. [Google Scholar] [CrossRef]
- Wray, D.; Ramaswamy, H.S. Development of a Microwave–Vacuum-Based Dehydration Technique for Fresh and Microwave–Osmotic (MWODS) Pretreated Whole Cranberries (Vaccinium macrocarpon). Dry. Technol. 2015, 33, 796–807. [Google Scholar] [CrossRef]
- Shinde, B.; Ramaswamy, H.S. Evaluation of mass transfer kinetics and quality of microwave-osmotic dehydrated mango cubes under continuous flow medium spray (MWODS) conditions in sucrose syrup as moderated by dextrose and maltodextrin supplements. Dry. Technol. 2019, 38, 1036–1050. [Google Scholar] [CrossRef]
- Shinde, B.; Ramaswamy, H.S. Kinetic modeling of microwave osmotic dehydration of mangoes under continuous flow medium spray conditions using sucrose and maltodextrin (10-18 DE) solute mixtures. Dry. Technol. 2020, 39, 713–725. [Google Scholar] [CrossRef]
- Gamboa-Santos, J.; Campañone, L.A. Application of osmotic dehydration and microwave drying to strawberries coated with edible films. Dry. Technol. 2018, 37, 1002–1012. [Google Scholar] [CrossRef]
- Ferrari, C.C.; Sarantopoulos, C.I.G.D.L.; Carmello-Guerreiro, S.M.; Hubinger, M. Effect of Osmotic Dehydration and Pectin Edible Coatings on Quality and Shelf Life of Fresh-Cut Melon. Food Bioprocess Technol. 2011, 6, 80–91. [Google Scholar] [CrossRef]
- Maftoonazad, N.; Ramaswamy, H. Effect of Pectin-Based Coating on the kinetics of Quality Change Associated with Stored Avocados. J. Food Process. Preserv. 2008, 32, 621–643. [Google Scholar] [CrossRef]
- Silva, K.S.; Fernandes, M.A.; Mauro, M.A. Effect of calcium on the osmotic dehydration kinetics and quality of pineapple. J. Food Eng. 2014, 134, 37–44. [Google Scholar] [CrossRef]
- Lowithun, N.; Charoenrein, S. Influence of osmodehydrofreezing with different sugars on the quality of frozen rambutan. Int. J. Food Sci. Technol. 2009, 44, 2183–2188. [Google Scholar] [CrossRef]
- Talens, P.; Martínez-Navarrete, N.; Fito, P.; Chiralt, A. Changes in optical and mechanical properties during osmodehydrofreezing of kiwi fruit. Innov. Food Sci. Emerg. Technol. 2002, 3, 191–199. [Google Scholar] [CrossRef]
- Rico, D.; Martín-Diana, A.; Frías, J.; Barat, J.; Henehan, G.; Barry-Ryan, C. Improvement in texture using calcium lactate and heat-shock treatments for stored ready-to-eat carrots. J. Food Eng. 2007, 79, 1196–1206. [Google Scholar] [CrossRef]
- Marcotte, M.; Taherian, A.R.; Ramaswamy, H.S. Physical properties of reconstituted carrot/alginate particles suitable for aseptic processing. J. Food Process Eng. 2000, 23, 463–480. [Google Scholar] [CrossRef]
- Rosenthal, A.; Deliza, R.; Barbosa-Cánovas, G.V.; Welti-Chanes, J. Fruit Preservation: Novel and Conventional Technologies; Springer: New York, NY, USA, 2018. [Google Scholar] [CrossRef]
- Soazo, M.; Pérez, L.M.; Rubiolo, A.C.; Verdini, R.A. Prefreezing application of whey protein-based edible coating to maintain quality attributes of strawberries. Int. J. Food Sci. Technol. 2014, 50, 605–611. [Google Scholar] [CrossRef]
- Sormani, A.; Maffi, D.; Bertolo, G.; Torreggiani, D. Textural and structural changes of dehydrofreeze-thawed strawberry slices: Effects of different dehydration pretreatments. Food Sci. Technol. Int. 1999, 5, 479–486. [Google Scholar] [CrossRef]
- Han, C.; Zhao, Y.; Leonard, S.; Traber, M. Edible coatings to improve storability and enhance nutritional value of fresh and frozen strawberries (Fragaria × ananassa) and raspberries (Rubus ideaus). Postharvest Biol. Technol. 2004, 33, 67–78. [Google Scholar] [CrossRef]


| Storage Time Days | Samples | Thawing Time 0 min | Thawing Time 10 min | Thawing Time 20 min | Thawing Time 30 min | Thawing Time 40 min | Thawing Time 50 min | Thawing Time 60 min |
|---|---|---|---|---|---|---|---|---|
| 10 | Control | 0 a,A | 2.03 ± 1.5 d,A | 5.98 ± 1.7 c,A | 8.33 ± 2.1 e,A | 9.63 ± 2.3 g,A | 11.45 ± 3.04 m,A | 13.26 ± 3.6 q,A |
| MWODS samples | 0 a,A | 0.16 ± 0.1 b,C | 1.59 ± 0.2 d,C | 4.001 ± 0.7 f,C | 6.74 ± 0.3 k,B | 9.47 ± 0.9 t,C | 11.65 ± 1.07 n,C | |
| MWODS-coated | 0 a,A | 0.06 ± 0.6 c,C | 0.72 ± 0.6 e,C | 2.07 ± 0.1 b,C | 3.3 ± 0.1 b,C | 4.48 ± 1.06 c,C | 6.1 ± 1.6 c,C | |
| 50 | Control | 0 a,A | 1.37 ± 0.8 c,B | 4.87 ± 1.2 e,B | 7.73 ± 1.2 b,B | 9.87 ± 1.6 c,A | 11.32 ± 1.7 c,A | 14.36 ± 2.06 c,B |
| MWODS samples | 0 a,A | 0.67 ± 0.2 d,D | 2.88 ± 0.4 f,D | 5.91 ± 1.3 c,D | 9.04 ± 1.1 c,C | 11.27 ± 1.2 c,D | 14.36 ± 0.3 c,D | |
| MWODS-coated | 0 a,A | 0.07 ± 0.1 e,C | 0.85 ± 0.1 d,C | 2.31 ± 0.2 d,C | 4.10 ± 0.1 d,D | 5.52 ± 0.9 d,D | 8.64 ± 1.1 d,D |
| Untreated Control Samples | MWODS Samples | |
|---|---|---|
| L* value | 61.95 ± 1.4 a | 42.01 ± 0.7 b |
| b* value | 34.91 ± 1.2 a | 33.19 ± 1.6 a |
| C value | 34.95 ± 1.2 a | 33.21 ± 1.6 a |
| Thawing after 10 Days of Storage at −20 °C | Thawing after 50 Days of Storage at −20 °C | |||||
|---|---|---|---|---|---|---|
| Untreated Control Samples | MWODS Samples | MWODS-Coated Samples | Untreated Control Samples | MWODS Samples | MWODS-Coated Samples | |
| L* value | 33.37 ± 2.7 aA | 31.52 ± 1.04 aA | 41.59± 0.75 cC | 28.8 ± 2.4 cB | 25.83 ± 2 aB | 41.2 ± 1.34 bC |
| b* value | 29.42 ± 2.1 bA | 25.04 ± 1.04 cA | 27.02 ± 0.73 cB | 23.94 ± 1.9 cE | 21.99 ± 1.7 cC | 25.59 ± 3.1dB |
| C value | 29.47 ± 2.1 bA | 25.31 ± 1.05 dA | 27.44 ± 0.72 dB | 24.00 ± 1.2 eE | 22.29 ± 1.7 eC | 25.65 ± 3.1 fB |
Disclaimer/Publisher’s Note: The statements, opinions and data contained in all publications are solely those of the individual author(s) and contributor(s) and not of MDPI and/or the editor(s). MDPI and/or the editor(s) disclaim responsibility for any injury to people or property resulting from any ideas, methods, instructions or products referred to in the content. |
© 2023 by the authors. Licensee MDPI, Basel, Switzerland. This article is an open access article distributed under the terms and conditions of the Creative Commons Attribution (CC BY) license (https://creativecommons.org/licenses/by/4.0/).
Share and Cite
Alharaty, G.; Ramaswamy, H.S. Microwave-Osmo-Dehydro-Freezing and Storage of Pineapple Titbits—Quality Advantage. Processes 2023, 11, 494. https://doi.org/10.3390/pr11020494
Alharaty G, Ramaswamy HS. Microwave-Osmo-Dehydro-Freezing and Storage of Pineapple Titbits—Quality Advantage. Processes. 2023; 11(2):494. https://doi.org/10.3390/pr11020494
Chicago/Turabian StyleAlharaty, Ghaidaa, and Hosahalli S. Ramaswamy. 2023. "Microwave-Osmo-Dehydro-Freezing and Storage of Pineapple Titbits—Quality Advantage" Processes 11, no. 2: 494. https://doi.org/10.3390/pr11020494