1. Introduction
Supercapacitors have attracted great attention due to their high charging/discharging rate, superior power density, and ultralong cycling life, which are widely used in power-needed areas (e.g., uninterruptable demands in wireless sensors, electronic modules, and subway and transit networks) [
1,
2,
3]. However, the limited energy density significantly impedes their applications. The energy density is proportional to the specific capacitance of electrode materials and the square of the electrochemical stability window of the electrolyte. Therefore, developing advanced electrodes composed of nanomaterials with high surface area, excellent electrical conductivity, etc., as well as electrolytes with high electric windows, are the key strategy to improve the energy density of supercapacitors [
4,
5,
6].
Two-dimensional (2D) molybdenum disulfide (MoS
2) has attracted broad interest in energy storage and conversion applications. Among various kinds of MoS
2 structures, 1T phase MoS
2 has been widely investigated as the electrode material of supercapacitors [
7,
8]. 1T phase MoS
2 is composed of a layer of Mo atoms sandwiched between two layers of S atoms, which is used as the simulation electrode model in this work. Compared to the 2H phase, 1T phase MoS
2 has two unique features that facilitate both electron transport and ion diffusion for electrochemical energy storage technologies. 1T phase MoS
2 has distorted octahedral coordination, enabling the electrical conductivity to be 10
5 times higher than the 2H phase; meanwhile, its hydrophilic property benefits ion diffusion [
9]. For example, M. Chhowalla et al. suggested that 1T phase MoS
2 can achieve capacitance values ranging from ∼400 to ∼700 F cm
−3 in a variety of aqueous electrolytes [
10], which is much higher than that of carbon-based supercapacitors (e.g., graphene and activated carbon, typically 100~300 F cm
−3). Moreover, they further demonstrated that MoS
2 is also suitable for high-voltage operation in non-aqueous organic electrolytes, showing prime energy and power density values, superior coulombic efficiencies (>95%), and stability (>5000 cycles). Feng et al. reported that 3D conductive MoS
2/N-doped carbon heteroaerogels exhibit ultrahigh capacitance (~4000 F/g), remarkable rate capability (~2000 F/g at 10 A/g), and excellent cycling stability (~8% capacitance decay after 8000 cycles) [
11]. Recently, our work realized a high capacitance of 511 F cm
−3 at an industrial-level submillimeter MoS
2 film electrode (94.2 μm) [
12]. These experimental studies have demonstrated the great potential of MoS
2 as the electrode material of supercapacitors.
On the other hand, room-temperature ionic liquids (ILs), composed of bulky organic cations and versatile anions, have been considered as the promising electrolyte of supercapacitors due to the large electrochemical stability window (3~7 V), negligible vapor pressure, superior thermal and chemical stability compared to aqueous and organic electrolytes [
13,
14]. The capacitive behaviors of ILs are primarily influenced by their electric double-layer (EDL) structure and dynamic properties, which have been widely investigated on graphene electrodes (including ours) [
15,
16,
17,
18]. For example, using molecular dynamics (MD) simulations, J. G. McDaniel studied the differential capacitance profiles of ionic liquids ([BMIM
+][BF
4−] and [BMIM
+][TFSI
−]) mixed with acetonitrile and 1,2-dichloroethane on graphene electrodes. It is reported that both pure and 10% mole fraction ionic liquid electrolytes exhibit camel-shaped capacitance profiles with two peaks on either side of a minimum at the potential of zero charge (PZC) [
19]. Using MD simulation, J. Seebeck reported that the differential capacitance of [BMI
+][PF
6−] shows a fluctuating behavior with respect to the curvature radius of the electrode [
18]. E. E. Fileti studied the effect of the ionic size of ILs on the double-layer capacitance [
20]. G. Feng investigated the effects of hydrophobicity/hydrophilicity of ILs and carbon electrodes on the interfacial distribution of ions and electrosorbed water [
21]. It is revealed that using hydrophilic ionic liquids would help to keep water molecules away from the negatively charged electrodes, even at large electrode polarizations. Utilizing constant voltage MD simulation, Tu et al. suggested that both pure and 10% mole fraction ionic liquid electrolytes exhibit camel-shaped capacitance profiles with two peaks on either side of a minimum centered at the potential of zero charge [
19]. More interestingly, Tu et al. investigated the relationship between capacitance and interfacial structure, revealing that inner layer capacitances for the organic solvents and [BMIm
+][BF
4−] solutions are very similar, regardless of solvent type and largely independent of ion concentration [
22].
Based on the above analysis, combinations of MoS
2 electrodes and high-stability ILs show great potential to boost the energy density of supercapacitors. However, the underlying charge storage mechanisms are poorly understood at the molecular scale, which needs a comprehensive MD simulation study. On the graphene electrode, conventional
U-shaped (from Gouy–Chapman theory), camel-shaped, and bell-shaped differential capacitance curves have been predicted by MD simulation [
23,
24,
25]. It is interesting to investigate the differential capacitance profiles and interfacial structures of MoS
2 electrodes in ILs.
In this work, we studied the energy storage mechanisms of MoS2-based supercapacitors in imidazolium ionic liquid ([BMI+][PF6−]) using MD simulation. [BMI+][PF6−] ionic liquid is chosen because of its high electrical stability window (~4.6 V), superior thermal stability (up to 400 °C), and suitable electrical conductivity (~2–5 mS/cm), which has been widely studied as the electrolyte of supercapacitors. The interfacial EDL structure is comprehensively investigated, including number density, charge density, electric potential distributions, electric field distributions, and separation coefficient, which is further explained in terms of ion-electrode interaction energy. Especially, a bell-shaped differential capacitance profile is recognized, which can be well described by the differential charge density curve in the Helmholtz layer. Moreover, the diffusion coefficient properties within different EDL regions are evaluated, revealing that ion dynamic properties are significantly suppressed by ~50% in the Helmholtz region.
3. Results and Discussions
MD simulation model of MoS
2 electrode in [BMI
+][PF
6−] electrolyte is shown in
Figure 1, which is used to investigate the interfacial behaviors, dynamics, and charge storage performance. The constant charge method is applied to mimic the electric potential applied on the MoS
2 electrode. Similar MD models and methods can be widely observed in previous theoretical studies [
33,
34].
Firstly, to study the interfacial structures of MoS
2 electrodes, the number density of [BMI
+][PF
6−] electrolyte at different charge densities is characterized, defined as:
where
present the number density of
i ion at a slab of
z −
zi.
Figure 2a,b show the interfacial populations of BMI
+ cations and PF
6− anions nearby the MoS
2 electrodes. Based on the number density distribution, we define the layers of EDL structures as follows: (1) inner Helmholtz layer located within 5.0 Å from the electrode surface, (2) outer Helmholtz layer located between 5.0 and 10 Å from the electrode surface, and (3) diffusion layer located > 10 Å from the electrode surface.
On the uncharged MoS2 electrode, [BMI+][PF6−] electrolyte shows a feature of multiple alternating layers of BMI+ ions and PF6− ions at the electrode-ILs interface. This can be explained in terms of strong electrode-ILs van der Waals interactions and cation–anion correlations in solvent-free ILs systems. On the uncharged MoS2 electrode, the inner Helmholtz layer is mainly composed of BMI+ ion and PF6− ion.
Upon applying negative charges, more BMI+ ions are attracted into the inner Helmholtz layer; meanwhile, desorption of PF6− ions occurs, which are moved away into the outer Helmholtz layer. As a result, the inner Helmholtz layer is mainly composed of BMI+ ions, which is followed by a second layer of PF6− ion in the outer Helmholtz layer. Such a multilayer structure propagates several nanometers away from the electrode, particularly at high electrode charge density.
With increasing the amount of charge density to −16 μC/cm
2, the magnitude of the first peak of BMI
+ cation in the inner Helmholtz layer is significantly enhanced by 2.7 times (from 0.01736 #/Å
3 to 0.04672 #/Å
3). Its packing position of the first peak is also shifted closer to the MoS
2 electrode (from 3.7 Å to 3.4 Å). Meanwhile, the magnitude of the first peak of PF
6− anion is significantly reduced by 52.5% (from 0.02316 #/Å
3 to 0.01098 #/Å
3), with the charge density increasing to −4 μC/cm
2. Upon further increasing negative charges, the position of the first peak of the PF
6− anion is moved further away from the MoS
2 electrode (from 4.0 Å to 7.0 Å) into the outer Helmholtz layer. However, further increasing the negative charges, the interfacial anion population in the outer Helmholtz layer is slightly improved (from 0.009 #/Å
3 to 0.014 #/Å
3). This can be attributed to the intense cation–anion interactions, which are also reported in previous literature [
35].
Figure 2c,d display the interfacial populations of BMI
+ cations and PF
6− anions nearby the positively charged MoS
2 electrodes. Upon increasing the positive charges, the density of the first peak of PF
6− anion in the inner Helmholtz layer is obviously enlarged by 2.75 folds (from 0.0257 #/Å
3 to 0.0708 #/Å
3) with the location at 3.6 Å to MoS
2 electrode. As expected, the intensity of BMI
+ cation is decreased (from 0.0175 #/Å
3 to 0.0072 #/Å
3 at 4 μC/cm
2), where its packing position is shifted to 6.6 Å into the outer Helmholtz layer, and the number density is improved to 0.0115 #/Å
3 at 16 μC/cm
2. This section may be divided into subheadings. It should provide a concise and precise description of the experimental results, their interpretation, as well as the experimental conclusions that can be drawn.
Representative MD snapshots are shown in
Figure 3 to reveal the electrolyte layering structure at different charge densities. Upon increasing negative charges, the interfacial population of cation within the inner Helmholtz region is enhanced; meanwhile, the anion population is suppressed. Especially, no anions can be observed at −16 μC/cm
2 due to the strong electrostatic repulsion interactions. Similar results can be observed on the positive polarization. Differently, cations can still be observed even at 16 μC/cm
2, which can be ascribed to the specific adsorption of BMI
+ on the MoS
2 surface.
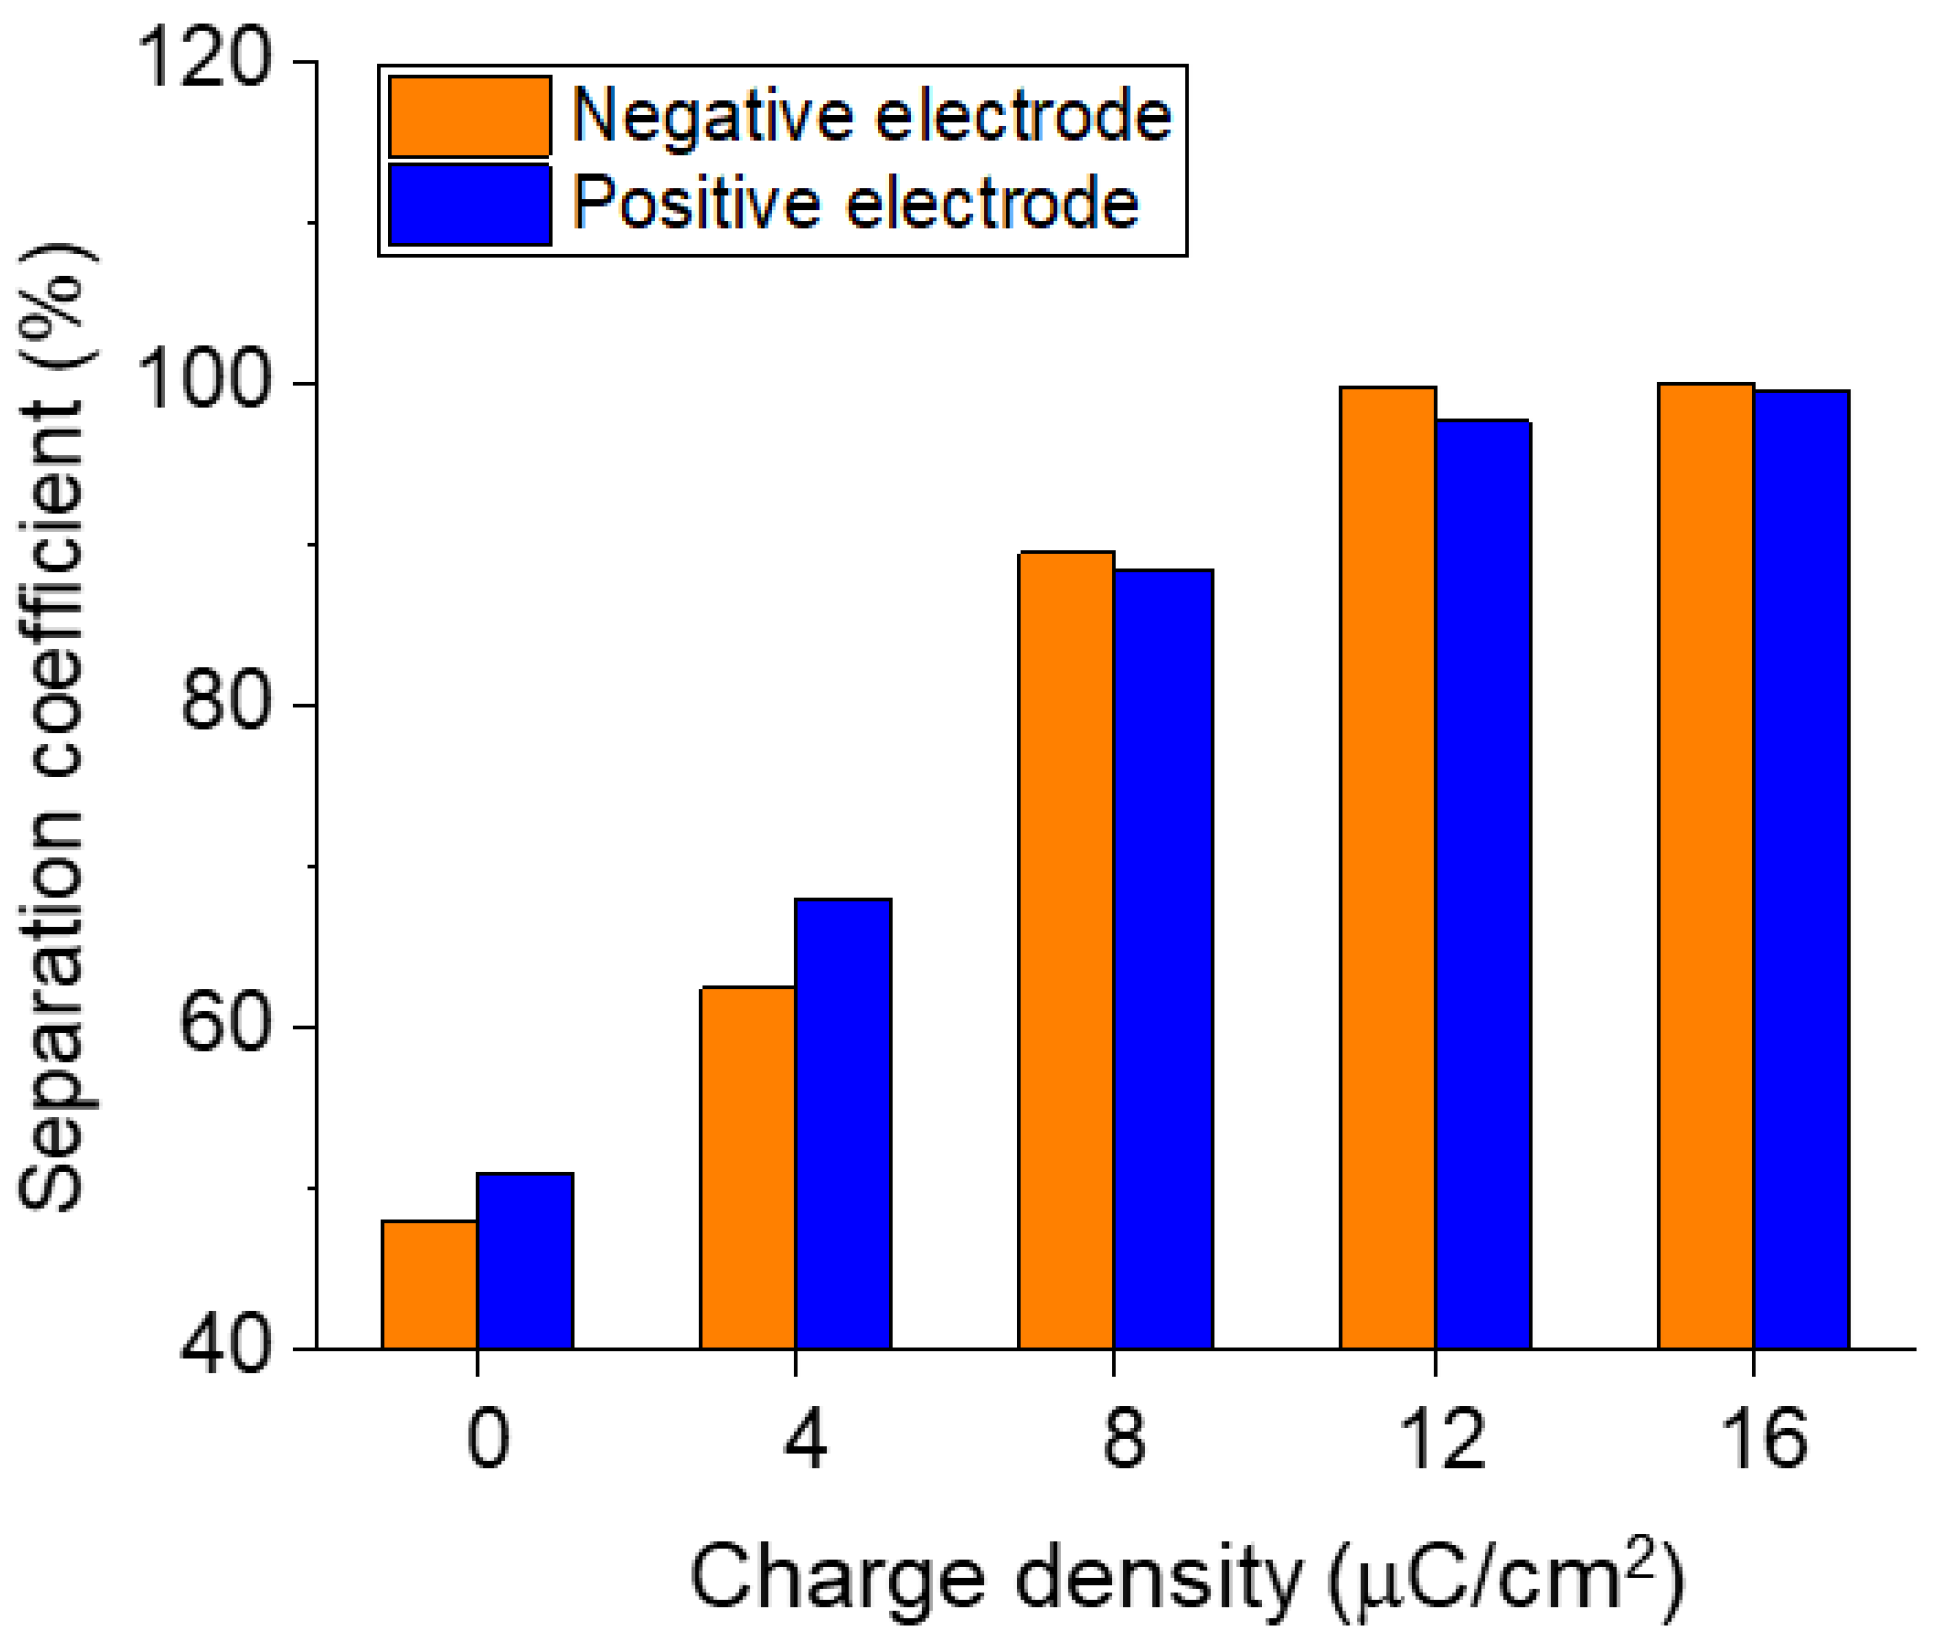
To describe the ion–MoS
2 and cation–anion interactions, the separation coefficient of ion within the Helmholtz layer is calculated, which is defined as:
Based on the number density results, the span of the inner Helmholtz region is about 5 Å on the MoS
2 electrode, which is chosen for the separation coefficient calculation (
Z1 = 5 Å). As shown in
Figure 4, upon the negative polarization, the separation coefficient of counterion (i.e., BMI
+) is prominently improved from 62.5% at −4 μC/cm
2 to 89.5% at −8 μC/cm
2, 99.9% at −12 μC/cm
2, and 100% at −16 μC/cm
2, which agrees well with the number density results. Similar results can be observed on the positive MoS
2 electrode, which is increased to 99.5% at 16 μC/cm
2.
The interaction energies between ions in the interfacial EDL regions and MoS
2 electrode are evaluated, which helps to explain the ion population in the Helmholtz layer to some extent. As shown in
Figure 5, the interaction energy value is around a constant value during the simulation time from 10 ns to 30 ns, indicating that ions nearby the MoS
2 electrode are in an equilibrium state. For the negatively charged MoS
2 electrode, the interaction energy of MoS
2-BMI
+ is approx. −140 kcal/mol, which is much higher than that of PF
6− anion (−10 kcal/mol). On the contrary, nearby the positively charged MoS
2 electrode, the interaction energy of MoS
2-BMI
+ (−7 kcal/mol) is much lower than that of PF
6− anion (−210 kcal/mol). These results can account for the formation mechanisms of the inner and outer Helmholtz layer on the MoS
2 electrode.
In MD simulations, the electric potential distributions can be calculated by integrating the Poisson equations:
where
,
, and
show the permittivity of vacuum, the charge density at
z, and the electric potential at
z, respectively.
The electric potential distribution across the simulation cell can be obtained:
Considering the complete screening of interfacial electric fields in the bulk region, the electrode potential
Uelectrode was calculated, defined as the potential drop within the electrode/electrolyte interfacial district relative to the potential of zero charge (
PZC):
where
UEDL is defined as the potential drop across the EDL-dominant area;
PZC is the potential of zero charge.
Figure 6a presents the electric potential distributions nearby the negative MoS
2 electrode. A multilayer structure feature is also recognized, especially at high charge density, which is in suitable accordance with the number density distributions. Especially, the peak position of the electric potential curve can correspond to the location of BMI
+ ion populations. For example, the electric potential profile at −16 μC/cm
2 presents a first peak at 3.6 Å, a second peak at 10.5 Å, and a third peak at 17 Å, which is in suitable agreement with BMI
+ ion number density. Meanwhile, the electric potential profile at −16 μC/cm
2 presents a first valley at 7.2 Å and a second valley at 13.8 Å, which can be indexed to the peak position of PF
6− ion number density. Interestingly, we would like to highlight that the correlations between the peak/valley position of the electric potential curve and cation/anion number density profiles have never been reported before. As shown in
Figure 6a, the uncharged MoS
2 electrode shows a PZC value of 0.016 V, which is probably due to the specific adsorption of BMI
+ ions. With the increment of electrode charge density, the electric potential drop across the EDL region increases from 0.88 V at −4 μC/cm
2 to 4.22 V at −16 μC/cm
2.
The interfacial electric field distribution is also presented to understand the screening of electrode charges by electrolyte structure (
Figure 6b). It is found that the strength of the electric field is rapidly suppressed in the inner and outer Helmholtz layers. Especially, a more obvious multilayer structure is recognized. It shows a first peak at 8.2 Å, a second peak at 15.1 Å, and a third peak at 21.8 Å; meanwhile, it shows the first valley at 5.3 Å, the second valley at 12.2 Å, and the third valley at 18.8 Å. These features basically agree well with the electrolyte charge density distributions (
Figure 6c). The position of the peak corresponds to the position of negative charges, while the valley location can be indexed to the position of positive charges. These results help to understand the screening of electrode charges by interfacial EDL structures. Similar results can be observed on the positive MoS
2 electrodes (
Figure 6d–f).
To qualitatively study the response of EDL structure upon the applied electric fields, we calculate the differential capacitance curves of MoS
2 electrodes in [BMI
+][PF
6−] electrolyte. The differential capacitance can be calculated by:
where
α is the charge density of the MoS
2 electrode and
UEDL is the electric potential drop across the EDL region.
As shown in
Figure 7a, the charge density increases monotonically with enlarging the electric potentials, which is in an almost linear relationship. Especially, the MoS
2 electrode shows bell-shaped differential capacitance profiles with respect to the electric potentials (
Figure 7b), which is different from the
U-shaped curve from conventional Gouy–Chapman theory. A maximum capacitance of 4.86 μF/cm
2 is observed at 0 V (with respect to PZC value), which is decreased to 1.23 and 2.94 μF/cm
2 upon the negative and positive polarization, respectively.
The bell-shaped differential capacitance curves are closely correlated with the high ion density at the interface, as observed in
Figure 2, especially within the inner Helmholtz layer. The high population of cations and anions nearby the uncharged MoS
2 electrode induce strong excluded volume steric interactions that are closely related to the compressibility. This will induce a high free-energy penalty for ion transporting from the bulk region to the interface to form EDL structures, which results in a much slower extent of counterion accumulation near the MoS
2 electrode surface with the increment of electric potential, leading to reduced capacitive values. Kornyshev et al. also demonstrated that the volume steric interactions and electrolyte compressibility within the EDL region play a major role in determining differential capacitance shape [
36]. The as-obtained capacitance values are also close to previous theoretical and experimental studies [
37,
38]. For example, J. Vatamanu suggested that the differential capacitance values of ILs (e.g., [pyr
13+][FSI
−] and [pyr
13+][TFSI
−]) are around 2~ 5 μF/cm
2 at different electric potentials [
39].
According to the electric double-layer theory, the specific capacitance of a single electrode could be calculated as:
where
α is the surface charge density of electrodes.
Figure 7c shows the electrode capacitance at different surface charge densities. At the relatively low charge density, the capacitance value at the negative electrode is higher than that of the positive counterpart. For example, the capacitance value of C
− (~4.63 μF/cm
2) is much larger than that of C
+ (~3.88 μF/cm
2) at 4 μC/cm
2. However, such a trend decreases with the increment of charge density, and an opposite phenomenon is observed at 16 μC/cm
2, where the capacitance value of C
− (~3.81 μF/cm
2) is slightly lower than that of C
+ (~4.06 μF/cm
2). Similar results are also reported on the graphene electrodes. For example, C. Merlet reported that the electrode capacitance of [BMI
+][PF
6−] is 4.8 and 3.8 μF/cm
2 on the negative and positive graphene electrodes, respectively [
31].
To establish the relationship between interfacial EDL structures and capacitive behaviors, the differential charge density is introduced and calculated by:
where
αe is the cumulated charge density of electrolyte in the EDL region, and
UEDL is the electric potential drop across the EDL region. Cumulated electrolyte charge densities in different EDL regions at the distance of 5, 7.5, 10, 12.5, 15, 17.5, and 20 Å to the MoS
2 electrode are calculated. As shown in
Figure 8, differential charge density profiles within different EDL regions show completely different shapes. Specifically, the differential charge density profiles at the distance of 5, 10, 12.5, and 17.5 Å to the MoS
2 electrode exhibit bell-shaped curves; the differential charge density profiles at the distance of 7.5, 15, and 20 Å to the MoS
2 electrode present the asymmetric
U-shaped curves. In aqueous electrolytes, the differential charge density curve can well reproduce that of differential capacitance profiles in the 10 Å-thickness EDL region. However, in ILs systems, the shape of the differential charge density curve in the 5 Å thickness EDL region is very close to the belled-shape differential capacitance profiles. This reveals that the capacitive behaviors of [BMI
+][PF
6−] electrolyte are dominantly determined by the first peak of counterion in the Helmholtz layer (5 Å to the MoS
2 electrode surface), while the electrolyte structure in the outer Helmholtz layer and diffusion layer plays a minor role. This finding also indicates that the effective thickness of the EDL region is approx. 5 Å.
In addition to the interfacial layering structures, the dynamic properties of [BMI
+][PF
6−] electrolyte in the EDL region with different distances to the MoS
2 electrode surface are studied, which helps to understand the charging mechanisms of ILs-based supercapacitors. The self-diffusion coefficients
D are calculated based on the mean square displacement method:
where
r(
t) is the position of the particle mass center at the time
t, and
n is the dimensionality of the system. Ion diffusion coefficients in the EDL region located at 0~5 Å, 5~10 Å, and 10~15 Å from MoS
2 electrodes are calculated, which corresponds to the inner Helmholtz layer, outer Helmholtz layer, and diffusion layer, respectively. The dynamic properties in the bulk electrolyte far away from the interfacial region are also evaluated for comparison.
As shown in
Figure 9, the diffusion coefficient of BMI
+ cation in the bulk region is 3.33 × 10
−9 m
2 s
−1. The ion dynamics are significantly reduced in the interfacial region of MoS
2 electrodes. Specifically, the diffusion coefficients of BMI
+ cation in the EDL region of 0~5 Å and 5~10 Å distance to the MoS
2 electrode surface are 1.32 × 10
−9 m
2 s
−1 and 1.53 × 10
−9 m
2 s
−1, respectively, which is reduced by ~60.0% and ~54.5%, respectively, compared to the bulk state. Moreover, the diffusion coefficient increases significantly with moving away from the MoS
2 electrode, which is calculated to be 3.26 × 10
−9 m
2 s
−1 in the EDL region of 10~15 Å from the electrode surface. Especially, the corresponding diffusion properties are close to the bulk properties with a distance over 10 Å. The observed reduced kinetics are mainly attributed to the strong ion-electrode and ion-ion interactions in the inner and outer Helmholtz layers. Similar results are observed in the positively charged systems. The diffusion coefficients of PF
6− anions are calculated to be 1.3 × 10
−9 m
2 s
−1, 2.19 × 10
−9 m
2 s
−1, and 2.77 × 10
−9 m
2 s
−1 in the interfacial region of 0~5 Å, 5~10 Å, and 10~15 Å from the positive MoS
2 electrode, respectively. In the inner and outer Helmholtz layers, the dynamics are reduced by ~53.7% and ~22.3%, respectively, compared to the bulk dynamics (2.82 × 10
−9 m
2 s
−1).
The MD simulation trajectories of BMI
+ ion and PF
6− ion are also recorded to visualize the cation–anion correlations and dynamic properties. As shown in
Figure 10a, the trajectories of BMI
+ ion and PF
6− ion are very close to each other during the simulation. This indicates the strong correlations between BMI
+ ion and PF
6− ion, which is mainly in the form of electrostatic interactions. The intense ion-ion correlations can be widely observed in the solvent-free ILs systems, which become much weaker in the organic and aqueous electrolytes.
Radical distribution function g(r) is calculated to quantify the correlations between BMI+ ion and PF6− ion. It is found that g(r) between BMI+ ion and PF6− ion shows an obvious peak at 4.85 Å (peak magnitude of 5.97). The corresponding coordination number is calculated to be 1.3, revealing the existence of cation-anions pairs.


