


Study on the Hydrodynamic Performance of a Countercurrent Total Spray Tray under Sloshing Conditions

Abstract
:1. Introduction
2. Materials and Methods
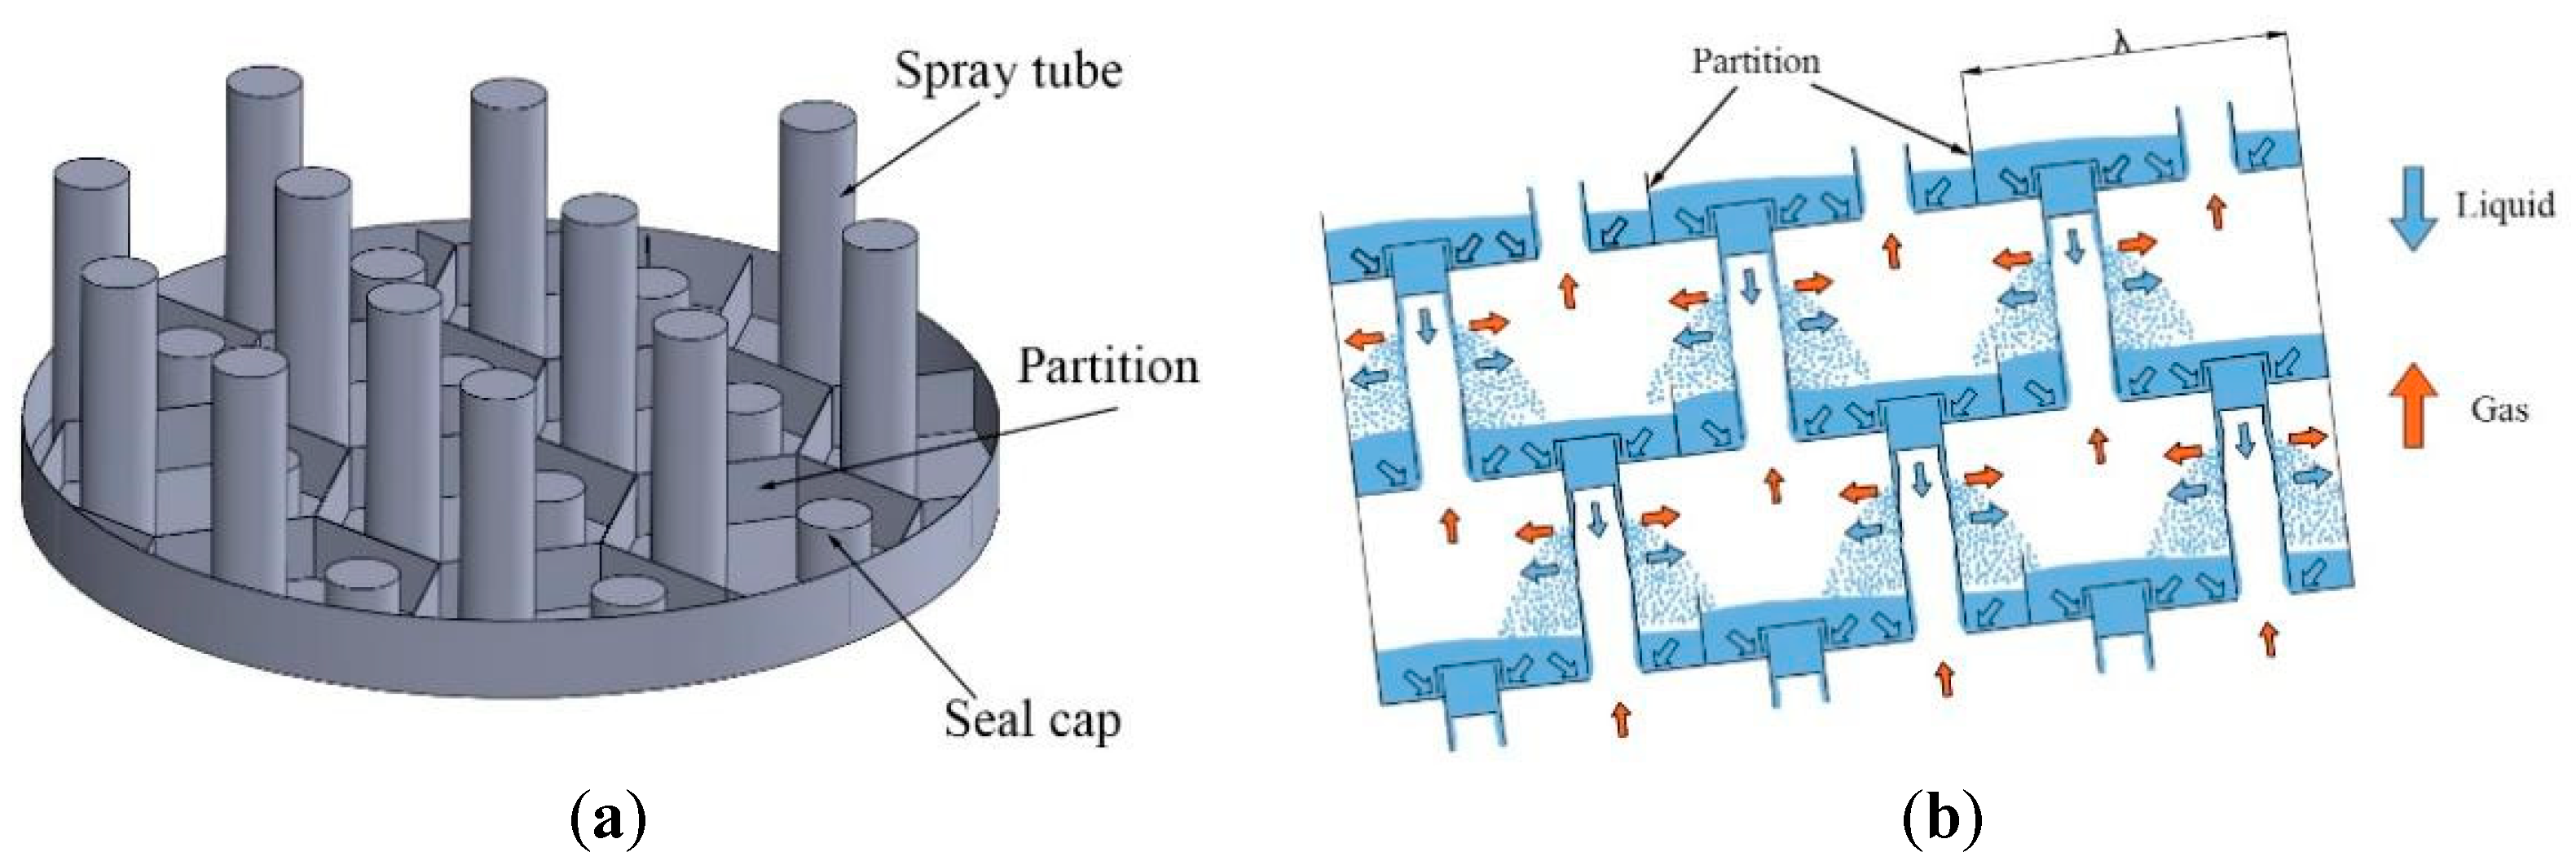
2.1. TST Space Barrier Drainage Principle
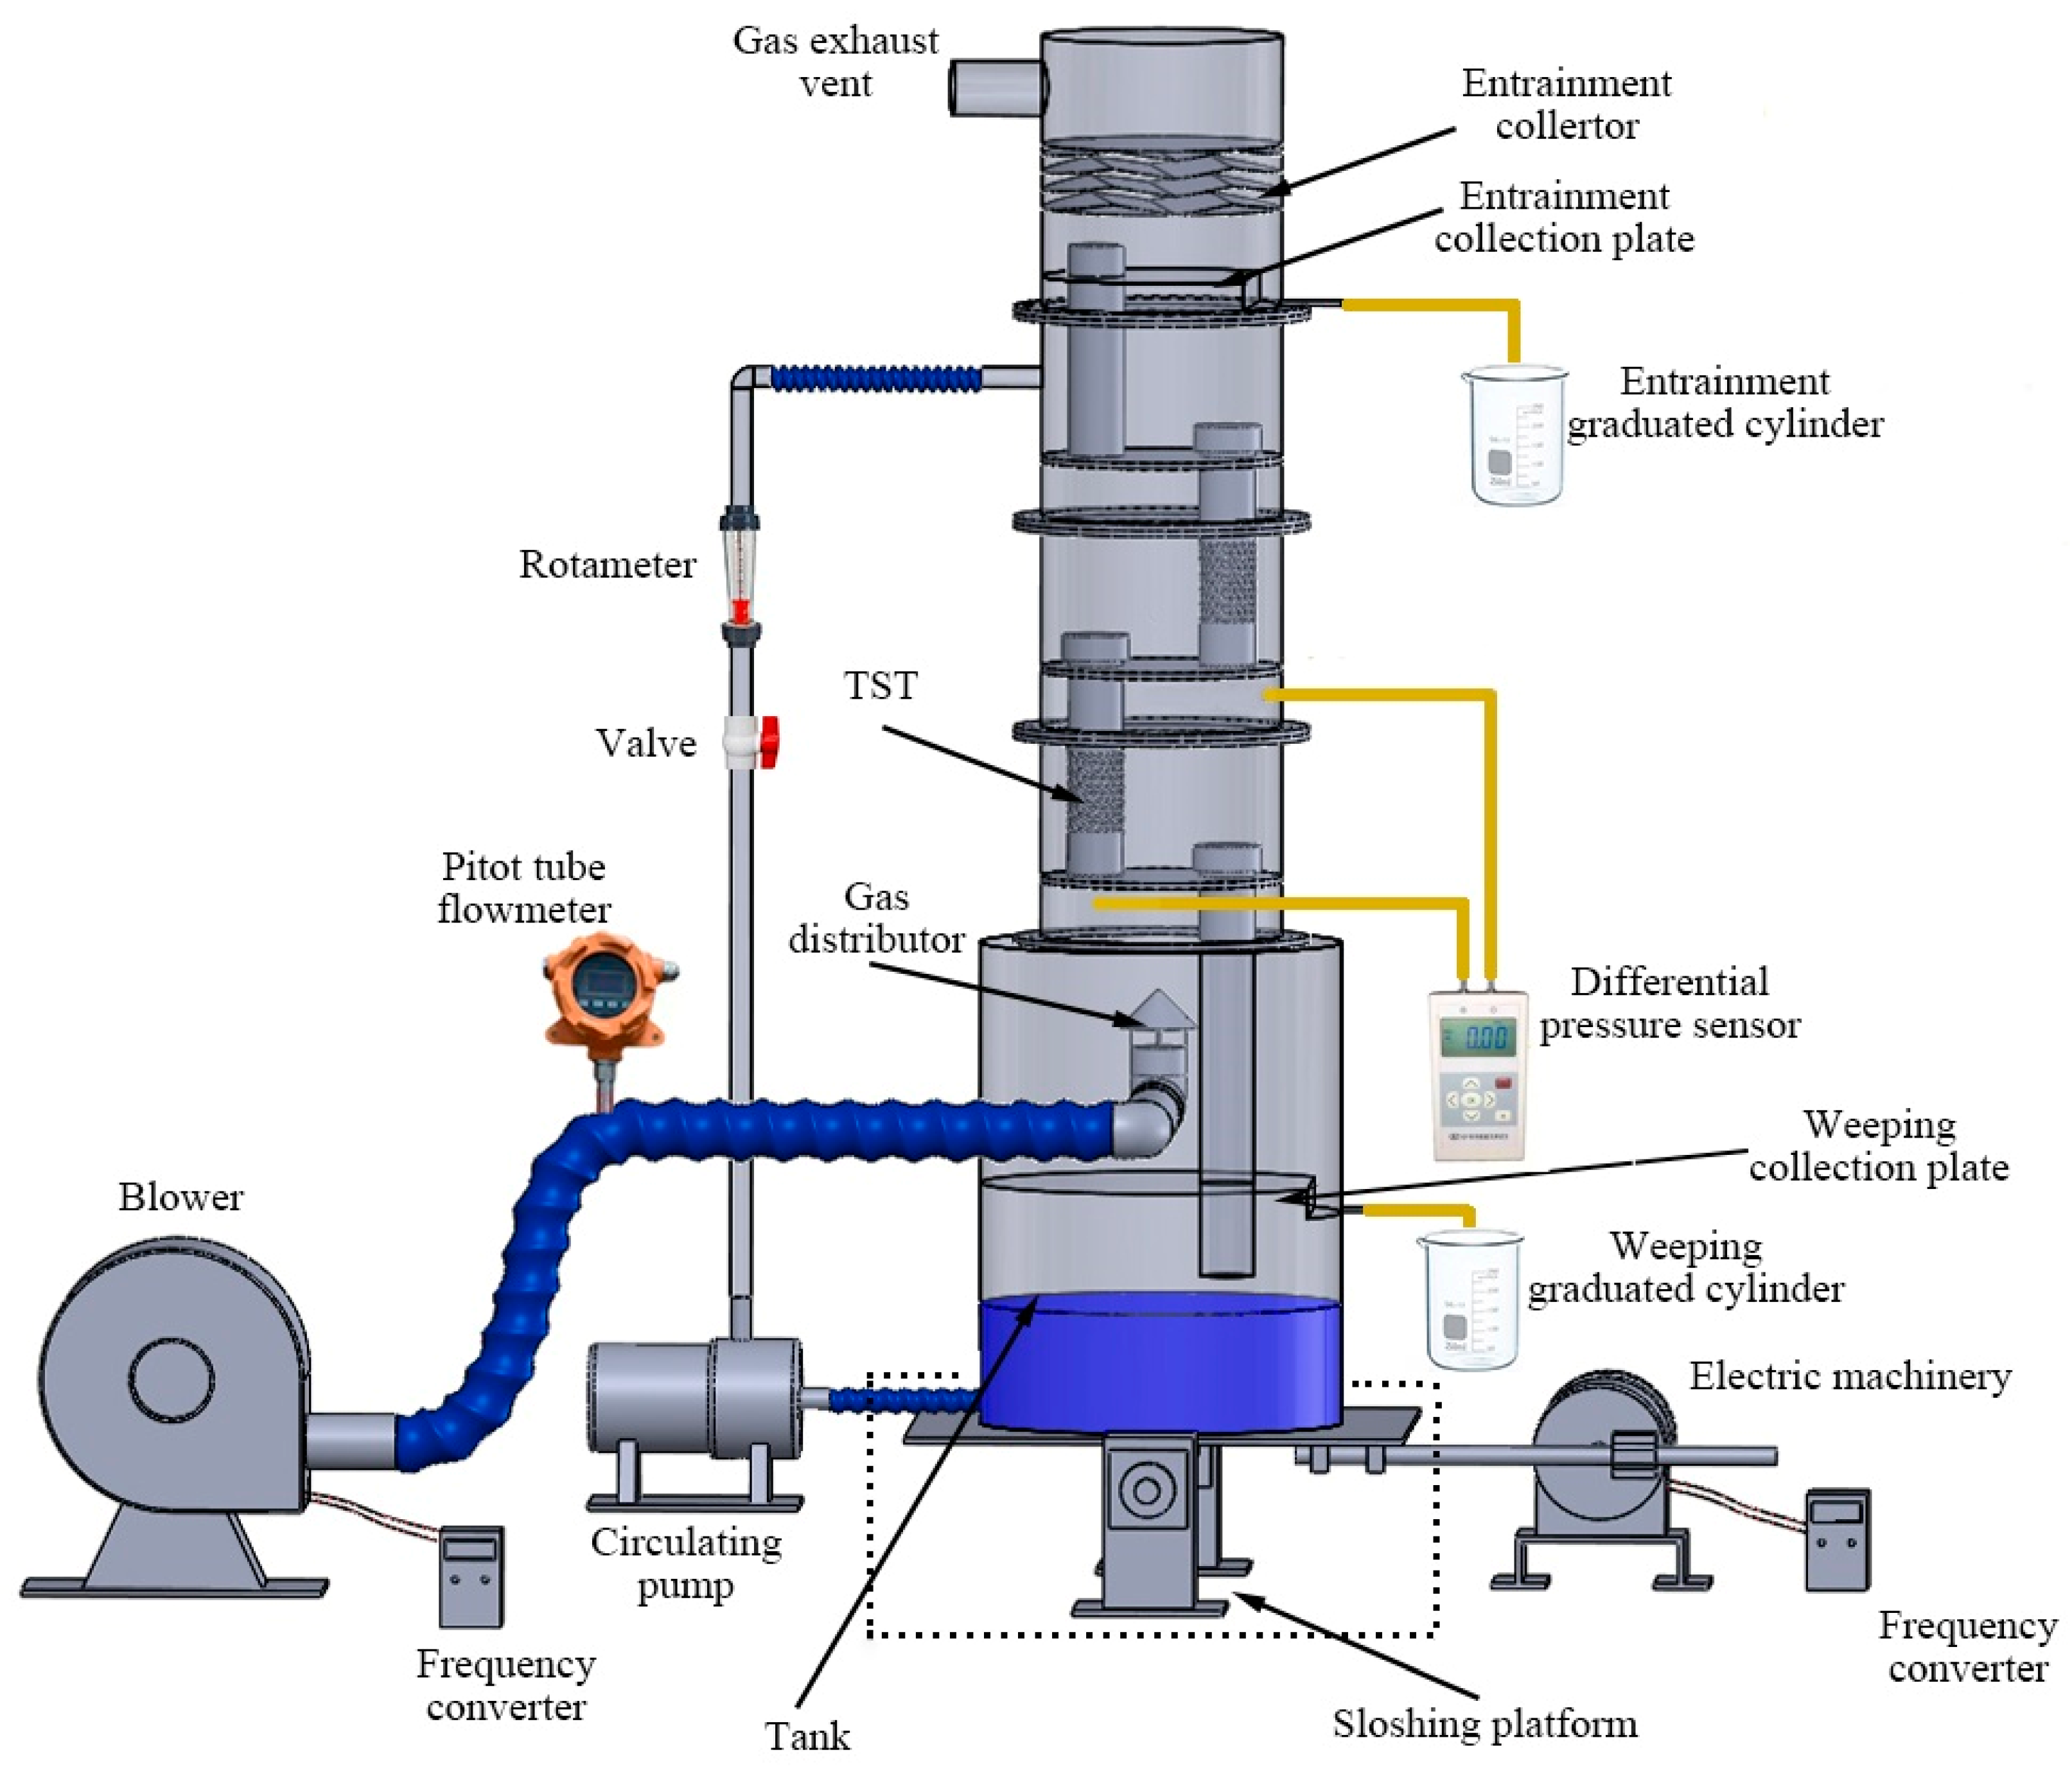
2.2. Experimental Setup and Process
3. Results and Discussion
3.1. Pressure Drop
3.1.1. Dry Plate Pressure Drop
3.1.2. Wet Plate Pressure Drop
3.2. Weeping
3.3. Entrainment
3.4. Liquid Level Unevenness
4. Conclusions
Author Contributions
Funding
Institutional Review Board Statement
Informed Consent Statement
Data Availability Statement
Conflicts of Interest
Nomenclature
| relative weeping | |
| gas entrainment | |
| plate hole kinetic energy factor ((m/s)(kg/m3)0.5) | |
| empty tower kinetic energy factor ((m/s)(kg/m3)0.5) | |
| liquid level at point i on the tower wall (mm) | |
| average liquid level on the tray (mm) | |
| volume of liquid per unit time (m3/h) | |
| mass rate of the liquid (kg/h) | |
| unevenness of liquid level | |
| mass rate of the gas (kg/h) | |
| number of measuring points on the tower wall | |
| pressure drop (Pa) | |
| pressure at the bottom of the tray (Pa) | |
| pressure at the top of the tray (Pa) | |
| dry pressure drop across the tray (Pa) | |
| wet pressure drop across the tray (Pa) | |
| velocity of the gas in the plate holes (m/s) | |
| velocity of the gas in the empty column (m/s) | |
| period (s) | |
| volume flow rates of the weeping liquid (m3/h) | |
| volume flow rates of the feed liquid (m3/h) | |
| Greek symbols | |
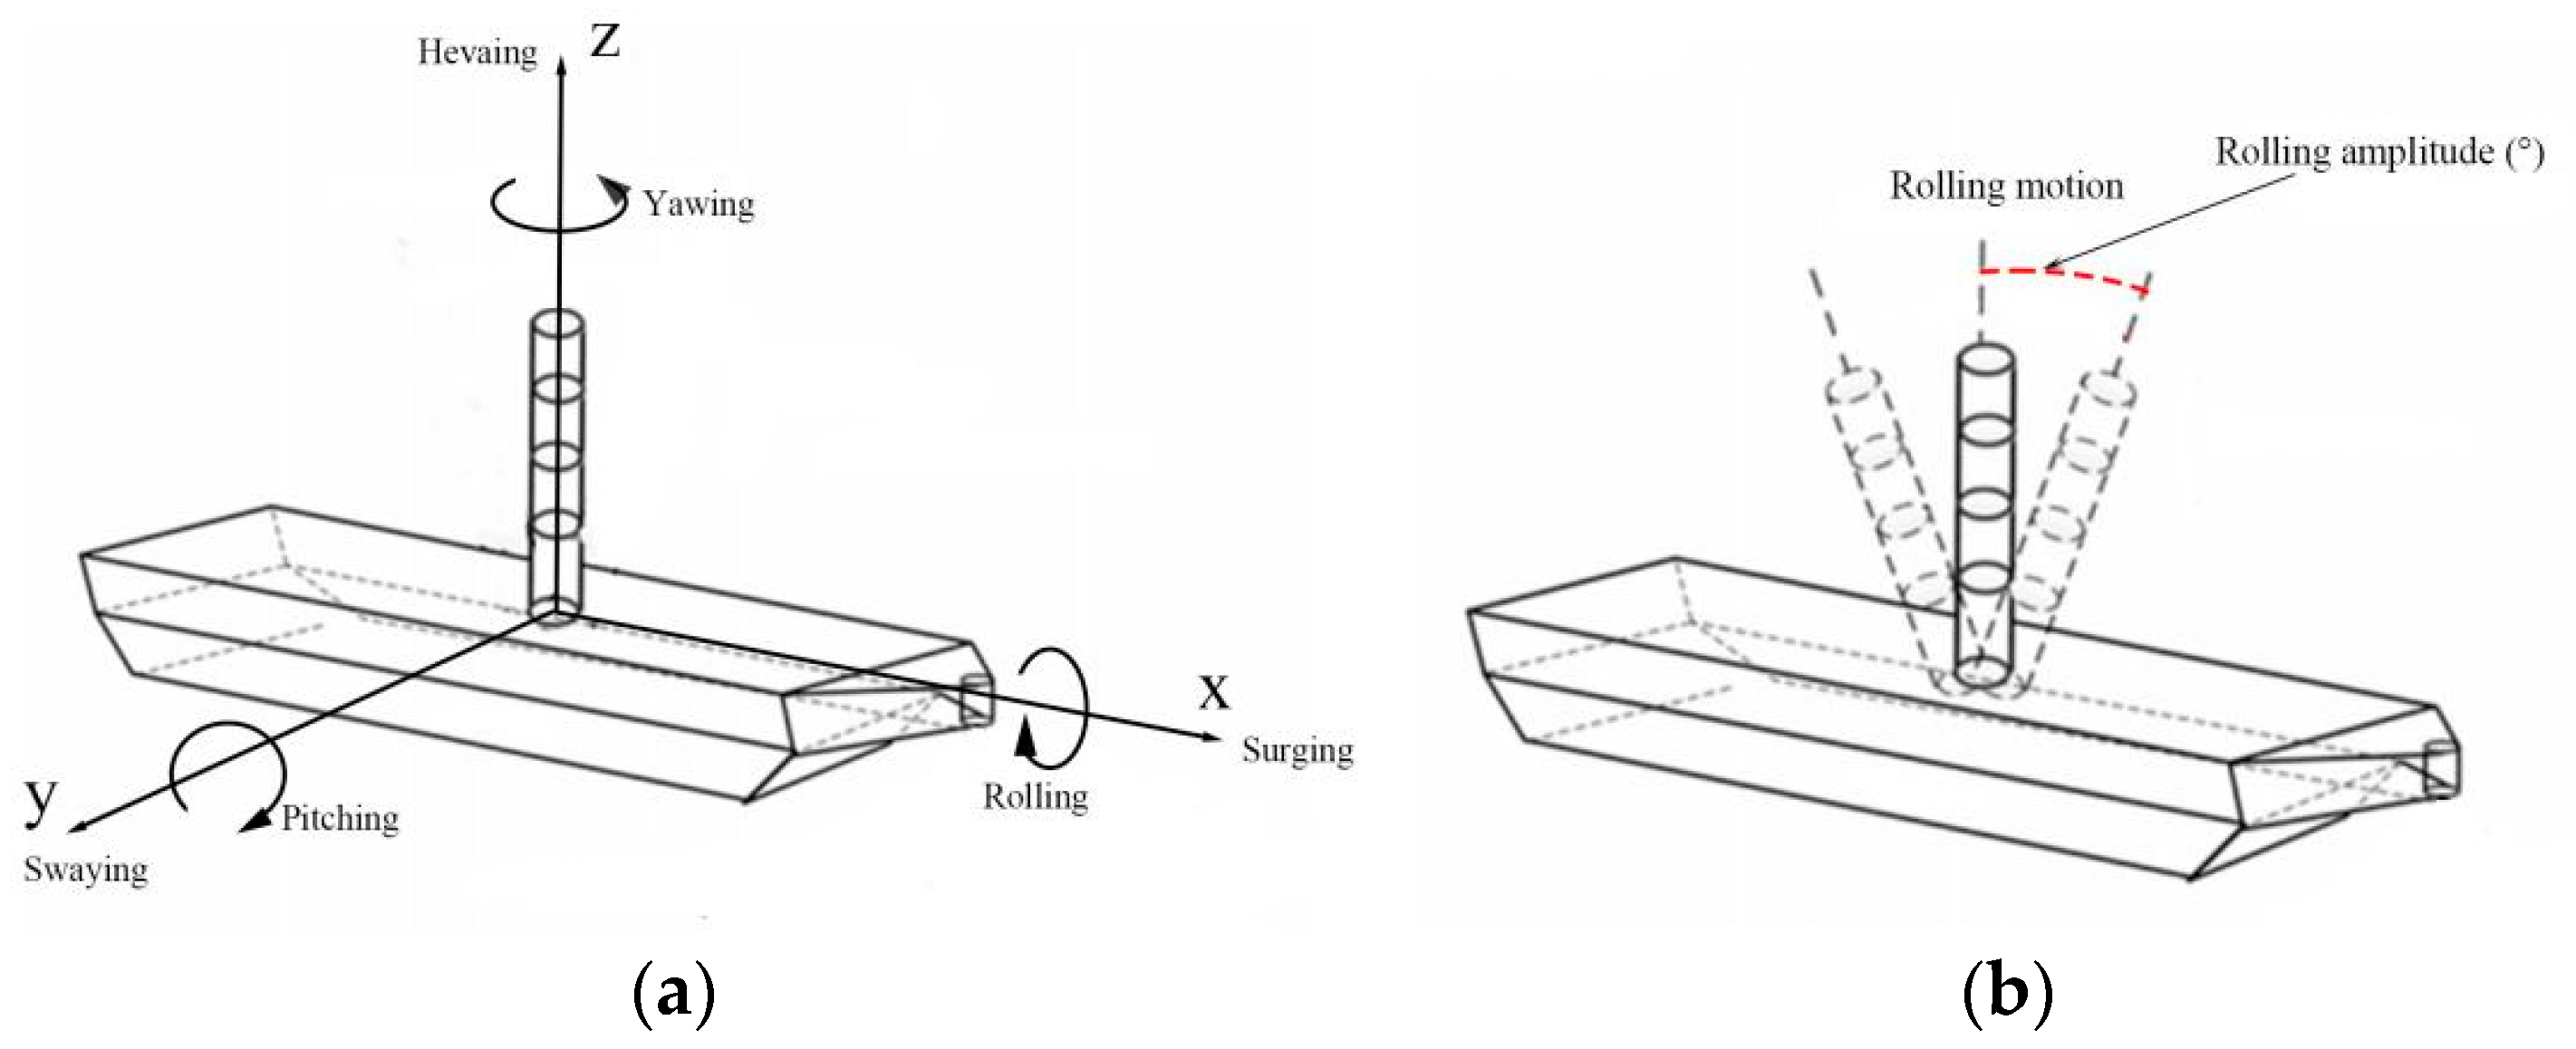
| θ | deviation angle of the column axis from the vertical axis (°) |
| ρG | density of the gas (kg/m3) |
| ρL | density of the liquid (kg/m3) |
| λ | partition spacing (mm) |
References
- Hailun, R.; Dengchao, A.; Taoyue, Z.; Hailong, L.; Xingang, L. Distillation technology research progress and industrial application. Chem. Ind. And. Eng. Prog. 2016, 35, 1606–1626. [Google Scholar]
- Chengzao, J.; Yongfeng, Z.; Xia, Z. Prospects of and challenges to natural gas industry development in China. Nat. Gas Ind. 2014, 34, 8–18. [Google Scholar] [CrossRef] [Green Version]
- Wenhua, Z. Numerical and Experimental Study on Hydrodynamics of an FLNG System. Ph.D. Thesis, Shanghai Jiao Tong University, Shanghai, China, 2014. [Google Scholar]
- Ma, P. Studies on Adaptation of Plate Column in FLNG Unit. Master’s Thesis, China University of Petroleum (EastChina), Dongying, China, 2017. [Google Scholar]
- Jiwei, S. Key Technology Research in FLNG General Design. Shipbuild. China 2015, 56, 81–86. [Google Scholar]
- Bin, X.; Xichong, Y.; Xuliang, H.; Yan, L. Research status of FLNG and its application prospect for deep water gas field development in South China Sea. China Offshore Oil Gas 2017, 29, 127–134. [Google Scholar]
- Bin, X.; Shisheng, W.; Xichong, Y.; Xia, H. FLNG/FLPG engineering models and their economy evaluation. Nat. Gas Ind. 2012, 32, 99–102+119–120. [Google Scholar]
- Scott, E.B.; Lane, M.K. SS: Floating Offshore LNG: Offshore LNG Value Chain Optimization. In Proceedings of the Offshore Technology Conference, Houston, TX, USA, 4–7 May 2009. [Google Scholar]
- Wijngaarden, W.V.; Meek, H.J.; Schier, M. The Generic LNG FPSO—A Quick & Cost-Effective Way to Monetize Stranded Gas Fields. In Proceedings of the SPE Asia Pacific Oil and Gas Conference and Exhibition, Perth, Australia, 20–22 October 2008. [Google Scholar]
- Gu, Y.; Ju, Y. LNG-FPSO: Offshore LNG solution. Front. Energy Power Eng. China 2008, 2, 249–255. [Google Scholar] [CrossRef]
- Chun, Z. Studies on Floating LNG Pretreatment Technology of Liwan Gas Field in the South China Sea. Master’s Thesis, China University of Petroleum, Dongying, China, 2011. [Google Scholar]
- Jianfeng, T.; Qiang, C.; Haojie, Z.; Wengang, Y.; Qingyan, X.; Zelin, S. Effect of shaking on pressure drop of structured packing absorption column. J. China Univ. Pet. Ed. Nat. Sci. 2018, 42, 142–148. [Google Scholar]
- Hafez, K.; El-Kot, A.-R. Comparative analysis of the separation variation influence on the hydrodynamic performance of a high speed trimaran. J. Mar. Sci. Appl. 2011, 10, 377–393. [Google Scholar] [CrossRef]
- Piller, M.; Nobile, E.; Hanratty, T.J. DNS study of turbulent transport at low Prandtl numbers in a channel flow. J. Fliud Mech. 2002, 458, 419–441. [Google Scholar] [CrossRef]
- Chengsheng, W.; Decai, Z.; Bo, L.; Lei, G. CFD Computation of Ship Motions and Added Resistance for a High Speed Trimaran in Regular Heading Waves. Shipbuild. China 2010, 51, 1–10. [Google Scholar]
- Shuxi, T. Sloshing Load Analysis for FLNG Tank Design. Master’s Thesis, Dalian University of Technology, Dalian, China, 2012. [Google Scholar]
- Cheng, Q. Study on Performance Evaluation of Two New Types of Tray on FLNG. Master’s Thesis, China University of Petroleum (EastChina), Dongying, China, 2018. [Google Scholar]
- Zhang, M.; Li, Y.; Li, Y.; Han, H.; Teng, L. Numerical simulations on the effect of sloshing on liquid flow maldistribution of randomly packed column. Appl. Therm. Eng. 2017, 112, 585–594. [Google Scholar] [CrossRef]
- Weedman, J.A.; Dodge, B.F. Rectification of Liquid Air in a Packed Column. Ind. Eng. Chem. 2002, 39, 732–744. [Google Scholar] [CrossRef]
- Di, X.; Ma, J.; Huang, Y. Mass-transfer area in a pilot-scale structured-packing column under different types of ship motion. Chem. Eng. Sci. 2019, 203, 302–311. [Google Scholar] [CrossRef]
- Meng, Y.; Wang, S.; Zhang, Y.; Chen, S.; Hou, Y.; Chen, L. Experimental evaluation of the performance of a cryogenic distillation system under offshore conditions. Chem. Eng. Sci. 2022, 263, 118084. [Google Scholar] [CrossRef]
- Bin, H. Studies on Decarbonisation Performance of Packed Absorption Tower under Sloshing Conditions. Master’s Thesis, China University of Petroleum (EastChina), Dongying, China, 2016. [Google Scholar]
- Fan, Y. Studies on Distributing Performance of ladder liquid distributor Under Sloshing Conditions. Master’s Thesis, China University of Petroleum (EastChina), Dongying, China, 2016. [Google Scholar]
- Zelin, S. Studies on Flow Performance of Structured Packing in Absorption Tower under the shaking Condition. Master’s Thesis, China University of Petroleum (EastChina), Dongying, China, 2016. [Google Scholar]
- Kai, Z. Studies on Decarbonization Tower Design Optimization Under Sloshing Conditions. Master’s Thesis, China University of Petroleum (EastChina), Dongying, China, 2015. [Google Scholar]
- Jianfeng, T.; Jian, C.; Yunfei, X.; Wengang, Y.; Xinpeng, J.; Weiming, Z. Research on orifices diameter of calandria liquid distributor used in offshore deacidification tower with different spray densities. Chem. Ind. Eng. Prog. 2017, 36, 1192–1201. [Google Scholar]
- Jianfeng, T.; Xinming, J.; Junyi, Z.; Wengang, Y.; Jian, C.; Haojie, Z. Compatibility test of gas distributor in the FLNG packed tower. Oil Gas Storage Transp. 2018, 37, 822–830. [Google Scholar]
- Jianfeng, T.; Bin, H.; Xinming, J.; Yihuai, H.; Zelin, S.; Qiang, C. Fluid distribution performance of packed tower under coupling sloshingworking conditions. J. China Univ. Pet. Ed. Nat. Sci. 2017, 41, 130–137. [Google Scholar]
- Yanli, L.; Jinliang, T.; Bo, L.; Zhicheng, S.; Feng, W. Study on hydrodynamics performance and mass transfer efficiency of total spray tray. Mod. Chem. Ind. 2018, 38, 200–204. [Google Scholar]
- Tao, J.L.; Shi, Z.C.; Ling, Y.L.; Wei, F. Hydrodynamic Characteristics in the Counter-Flow Total Spray Tray. Chem. Eng. Technol. 2019, 42, 1199–1204. [Google Scholar] [CrossRef]
- Ran, W.; Jinliang, T.; Yanli, L.; Feng, W.; Jidong, L. Total spray tray (TST) for distillation columns: A new generation tray with lower pressure drop. Chem. Ind. Chem. Eng. Q. 2017, 23, 523–527. [Google Scholar] [CrossRef]
- Xuliang, H.; Bin, X.; Xiaosong, Z.; Jingrui, Z. Numerical Simulation and Experimental Study on Hydrodynamic Performance of FLNG with Liquid Tanks. Shipbuild. China 2016, 57, 87–97. [Google Scholar]
- Wang, H.; Niu, X.; Li, C.; Li, B.; Yu, W. Combined trapezoid spray tray (CTST)—A novel tray with high separation efficiency and operation flexibility. Chem. Eng. Process. 2017, 112, 38–46. [Google Scholar] [CrossRef]
- Tang, M.; Zhang, S.; Wang, D.; Liu, Y.; Zhang, Y.; Wang, H.; Yang, K. Hydrodynamics of the tridimensional rotational flow sieve tray in a countercurrent gas-liquid column. Chem. Eng. Process. 2019, 142, 107568. [Google Scholar] [CrossRef]
- Zhang, M.; Zhang, B.Y.; Zhao, H.K.; Zhao, Y.; Sun, J.; Ren, Z.Q.; Li, Q.S. Hydrodynamics and mass transfer performance of flow-guided jet packing tray. Chem. Eng. Process. 2017, 120, 330–336. [Google Scholar] [CrossRef]
- Jaćimović, B.M. Entrainment effect on tray efficiency. Chem. Eng. Sci. 2000, 55, 3941–3949. [Google Scholar] [CrossRef]
- Kister, H.Z.; Haas, J.R. Entrainment from sieve trays in the froth regime. Ind. Eng. Chem. Res. 2002, 27, 2331–2341. [Google Scholar] [CrossRef]


| Condition | Value |
|---|---|
| Liquid flow (m3/h) | 2.2 |
| F0 ((m/s)(kg/m3)0.5) | 6–15 |
| FT ((m/s)(kg/m3)0.5) | 1.16, 2.01, 2.42 |
| Rolling amplitude (°) | 0, 1, 2, 3, 4, 5, 6, 7 |
| Rolling period (s) | 8, 12, 16, 20 |
Disclaimer/Publisher’s Note: The statements, opinions and data contained in all publications are solely those of the individual author(s) and contributor(s) and not of MDPI and/or the editor(s). MDPI and/or the editor(s) disclaim responsibility for any injury to people or property resulting from any ideas, methods, instructions or products referred to in the content. |
© 2023 by the authors. Licensee MDPI, Basel, Switzerland. This article is an open access article distributed under the terms and conditions of the Creative Commons Attribution (CC BY) license (https://creativecommons.org/licenses/by/4.0/).
Share and Cite
Tao, J.; Zhang, G.; Yao, J.; Wang, L.; Wei, F. Study on the Hydrodynamic Performance of a Countercurrent Total Spray Tray under Sloshing Conditions. Processes 2023, 11, 355. https://doi.org/10.3390/pr11020355
Tao J, Zhang G, Yao J, Wang L, Wei F. Study on the Hydrodynamic Performance of a Countercurrent Total Spray Tray under Sloshing Conditions. Processes. 2023; 11(2):355. https://doi.org/10.3390/pr11020355
Chicago/Turabian StyleTao, Jinliang, Guangwei Zhang, Jiakang Yao, Leiming Wang, and Feng Wei. 2023. "Study on the Hydrodynamic Performance of a Countercurrent Total Spray Tray under Sloshing Conditions" Processes 11, no. 2: 355. https://doi.org/10.3390/pr11020355