1. Introduction
Junggar basin is an important petroliferous basin in China. Mahu sag is a secondary tectonic unit in the basin. The sedimentary environment of the Fengcheng Formation in Mahu Sag is an alkaline lake environment [
1]. Compared with the freshwater environment, it has the characteristics of strong cementation and early hydrocarbon generation. Therefore, the diagenetic evolution of fine-grained sedimentary rocks in salt lakes is more complicated. The Fengcheng Formation in Mahu Sag is a set of typical ancient alkaline lake sediments with various rock types. These include terrigenous sedimentary sandstone (conglomerate), siltstone, mudstone, and saline rocks formed by alkali lake deposition. The lithological characteristics of different depths represented by the central area of the alkaline lake are controlled by salinity vertically. P1f1 layer: volcanic rocks, dolomitic argillaceous siltstone, alkali minerals, low salinity; p1f2 layer: the edge area is dominated by cloud mudstone and cloudy siltstone, and the salt rock strata in the center of the alkali lake appear in large quantities with high salinity; p1f3 layer: dolomitic rocks, limestone, etc. alkali minerals gradually decreased to disappear. The main salt layer is the P1f2 layer [
2]. The development of salt minerals in this area indicates that the climate was dry and hot during the deposition of dolomitic rocks in the Fengcheng Formation of Mahu Sag. As a result, warm-phase alkaline minerals and wide-temperature-phase salt minerals were precipitated [
3].
In the early stage, the Fengcheng Formation of Mahu Sag was fractured for 11 wells. Fracturing mainly uses a reverse mixed fracturing process. The implementation wells generally have high oil saturation, and the initial effect of fracturing is good so that industrial oil flow can be obtained. The initial production capacity is 15~20 t/d, but the stable production period is generally within 1 month. The later production decreased rapidly due to the decrease in fracture conductivity. Through analysis, it is believed that this has a great relationship with the special lithology of the High salinity reservoir. Studies have shown that one of the important characteristics of high salinity reservoirs is the high content of soluble salts (mainly sodium bicarbonate, sodium silicate, calcium carbonate, etc.). In the process of stimulation measures, since the fracturing fluid is a water-based system, salt will be dissolved in large quantities. This excessive salt dissolution will cause a decrease in strength and eventually lead to rock collapse. At the same time, the conductivity decreases and directly leads to a sharp decrease in production. Therefore, it is of great significance for the high salinity reservoir to study the influence factors of salt dissolution and take measures to maintain effective conductivity [
4].
Water dissolution is a basic characteristic of rock salt. From a physicochemical point of view, the contact between salt rock and water leads to two opposite effects at the solid-liquid interface and in an aqueous solution: the dissolution of rock salt and the crystallization of liquid solution [
5,
6,
7]. From the point of view of chemical kinetics, the dissolution process of salt rock can be regarded as the heterogeneous reaction at the interface between salt and water (i.e., solid-liquid phase interface). The reaction includes three basic processes: water entering the surface of rock salt, the interaction between water and rock salt, and the diffusion of dissolved rock salt into water [
8,
9]. In recent years, scholars in China and abroad have carried out a series of related research on the dissolution characteristics of salt rocks. Durie [
10] studied the surface characteristics of dissolution surface during salt dissolution. He found that the inhomogeneity of rock composition caused the uneven dissolution of salt corrosion surfaces. The dissolution area increased, thereby increasing the dissolution rate. Saberian [
11] analyzed the influence of flow rate, temperature, and other factors on the dissolution rate of salt rock through a large number of experiments. Hans Ulrich Rohr [
12] studied the effect of salt composition on the dissolution rate through a large number of basic experiments and gave the dissolution rate of different kinds of salt. The results showed that in the multi-component brine system dominated by NaCl, the dissolution rate of most salts decreased with the increase of NaCl concentration. Manvan Alkattan [
13] found through experiments that Co, Cr, Cd, and Pb metals could reduce the dissolution rate of rock salt, while Fe and Zn metals had little effect on the dissolution rate. Xiao Changfu [
14] et al. obtained the change rule of the dissolution rate of salt rock along with the main influencing factors and the corresponding calculation formula through the experimental study on dissolution characteristics of salt rock. Liang Weiguo [
15], Wang Chunrong [
16], Tang Kang [
17], Li Xiaokang [
18], and Zhang Zhandong [
19] et al. studied the influence of different temperatures, pressure, concentration, and flow velocity on the dissolution rate of salt rock through the salt rock dissolution test.
Although the above researchers have completed a series of research related to the dissolution characteristics of salt rock. However, most of them considered the dissolution characteristics of salt rock in the process of salt cavitating. Researchers have not studied the law of salt dissolution in the process of fracturing. Taking the high salinity reservoir in Mahu Sag, Junggar Basin as an example, this paper studies the salinity dissolution of the highly saline reservoir and its influence on rock strength and conductivity through a salt dissolution experiment, compressive experiment, and conductivity experiment.
In order to make the experimental data more representative, the P
1f
2 layer with the highest salt content in the typical well XY1 in this block was selected to carry out a whole-rock mineral analysis. As can be seen from the whole-rock mineral analysis results (
Table 1), it is generally characterized by “low clay minerals, low quartz, low feldspar, and high salt”. The salt-containing types are mainly sodium bicarbonate (easily soluble in water) and sodium silicate boron-type (insoluble in water), and the overall salt content of the core is between 62.9 and 100%, of which the soluble salt content is 0–100%. In order to clarify the law of salt dissolution and its influence on the change of rock strength and flow conductivity, experiments on influencing factors of salt dissolution, laboratory of mechanical strength changes before and after salt dissolution, and experiments on the influence of salt dissolution on the change of flow conductivity were carried out. In the experiments, we selected the core with a buried depth of 5,381.5 m and soluble salt content of 78% to carry out salt dissolution experiments. In the conductivity experiment, an 80% salt plate was made.
2. Mechanism and Influencing Factors of Fracturing Fluid Salt Dissolution
2.1. Influencing Factors of Salt Dissolution Law in the Fracturing Process
In this paper, a series of dissolution experiments of salt-containing rock samples were carried out by laboratory experiments. The most important factors affecting the dissolution rate of rock salt were selected for the experiment: formation temperature, the salinity of fracturing fluid water, the viscosity of fracturing fluid, and the pumping rate. The influence of these factors on the dissolution rate of rock salt will be observed in the experiment, and the research results will be helpful in guiding the optimization of fracturing technology.
This reservoir has a wide range of salt content values. In order to make the experimental results more representative, the core used in the salt dissolution experiment in this paper is taken from the main P1f2 layer of well XY1. The content of sodium bicarbonate in this section is 78% at 5375.5.5 m. The salt dissolution characteristics of this kind of reservoir were studied by using a core with high salt content.
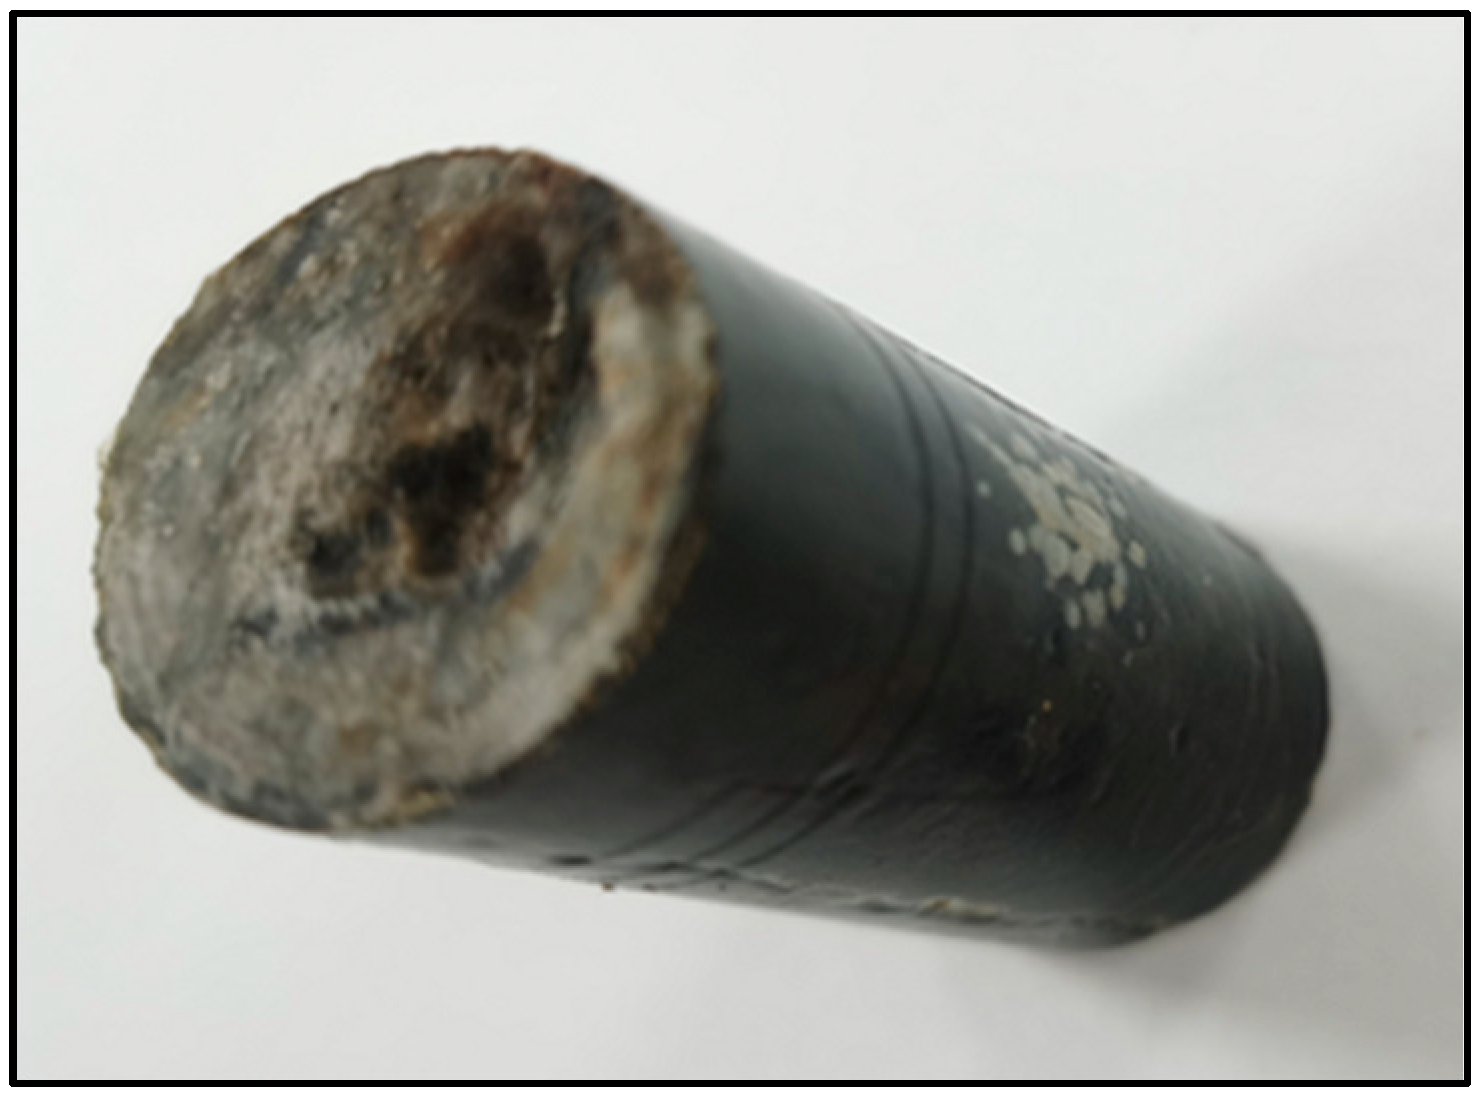
Before the experiment, the core was processed into a standard cylindrical specimen with a diameter of 25 mm and a length of 20 mm. The cutting process ensures that no water is touched. The processing of rock samples is carried out in strict accordance with the specifications. The processed rock sample is shown in
Figure 1. During the experiment, both the upper surface and the side of the sample were sealed to keep only the lower surface of the sample in contact with the liquid.
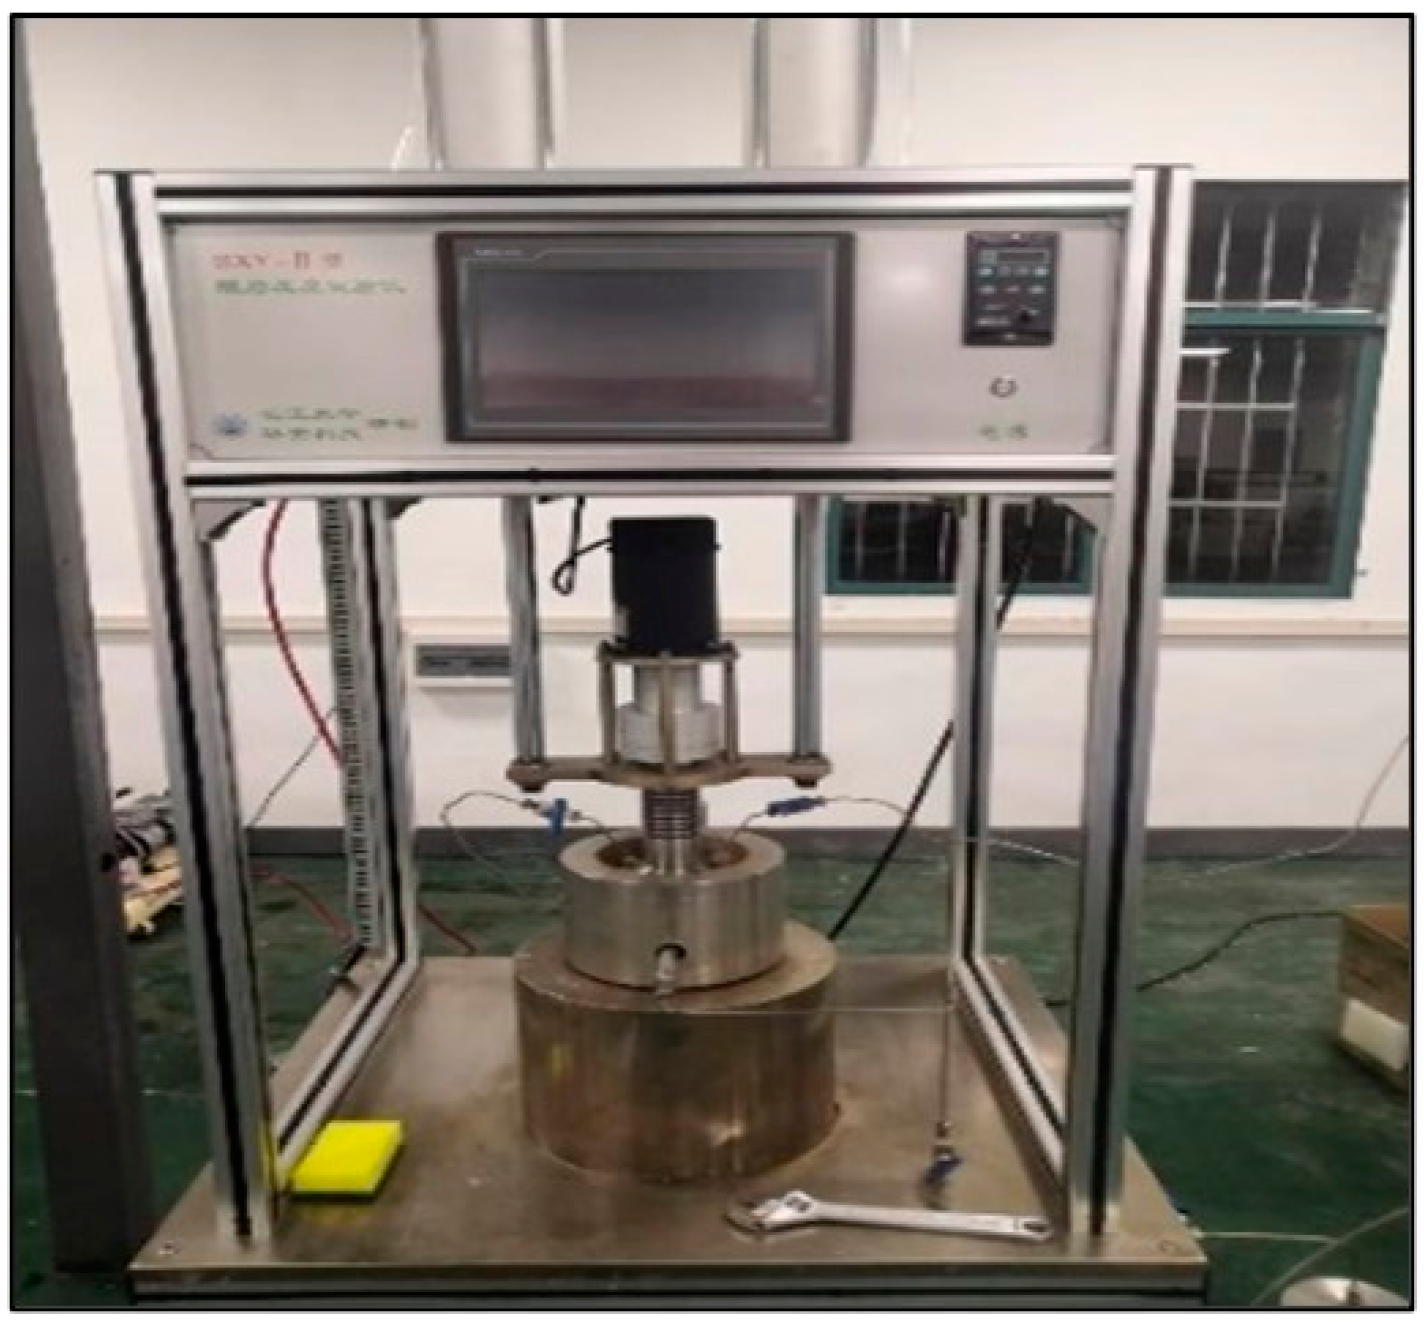
The experiment was carried out in SD-II reactive mechanics experimental facility,
Figure 2. During the experiment, the liquid was first added to the set temperature and pressure, and then the core was put into the solution for reaction. After the reaction for 30 min, the core was taken out for drying and weighing. The mass change of the rock sample before and after the reaction was measured, and the dissolution rate was represented by the mass change of the rock sample per unit area within a unit of time. See Equation (1).
Δm—the quality difference of rock samples before and after the experiment, g;
A—the dissolved area, cm2;
t—the experiment time, min;
—the dissolving rate, g/(cm2·min).
The experimental design refers to the actual reservoir environment and fracturing parameters. The formation temperature is 110 °C, the formation pressure is 40 Mpa, and the injecting rate is 4–8 m
3/min. Four factors were considered during the experiment. The three experimental temperatures were 70, 90, and 110 °C, respectively. The three viscosity liquids were clear water with a viscosity of 1 mPas, low viscosity fracturing fluid with a viscosity of 5 mPa·s, and high viscosity fracturing fluid with a viscosity of 55 mPa·s. The three kinds of salinity fracturing fluid are 0% clear water with salt content, 5% salt content, and 16.19% salt water with salt content. The injection rates of the three kinds are 4 m
3/min, 6 m
3/min, and 8 m
3/min, respectively. The above experiments were carried out in 12 groups, It is shown in
Table 2, the experimental results were analyzed, and the primary and secondary factors of salt dissolution were identified.
2.1.1. Influence of Temperature on Dissolution Rate of Salt Rock
The present experimental plan was to vary the solution temperature. The change in dissolved mass of salt rock samples at different temperatures and the effect on dissolution rate were studied. The solutions were low-viscosity fracturing fluids. The solution temperatures were 70, 90, and 110 °C. Firstly, the treated cores were put into the solution. Then the pressure and speed were adjusted to reach the set value. After dissolving for 30 min, the rock samples were weighed and recorded, and the data were processed, as shown in
Figure 3. From the experimental results, it can be seen that the dissolution rate of the rock samples all increased with the increase in temperature. This is because as the temperature increases, the molecular activity in the solution becomes stronger. This leads to an increase in the chance of collision between the solution molecules and the salt rock molecules, which leads to an increase in the dissolution rate. Finally, the data were fitted, and the results of the fit showed an exponential relationship between the dissolution rate and the solution temperature.
2.1.2. Influence of Fracturing Fluid with Different Salinity on Dissolution Rate of Salt Rock
This group of experiments studied the effect of different salinity fracturing fluids on the dissolution rate of rock samples. The solution was 1 L of 0% salt water, 5% sodium bicarbonate, and 16.19% sodium bicarbonate low-viscosity fracturing fluid. The treated cores were placed in the three solutions. Then adjust the temperature, pressure, and speed to the set value. After 30 min of dissolution, the rock samples were taken out, weighed, recorded, and processed, as shown in
Figure 4.
Figure 4 shows that the dissolution rate gradually decreases with the increase in concentration, and the salt rock specimen is no longer dissolved in a saturated solution. From the point of view of chemical kinetics, the difference between the concentration of the solution and the concentration of the saturated solution is one of the chemical potentials for the dissolution reaction of salt rock. The greater the difference between the two, the greater the dissolution rate. When the solution concentration is 0%, the difference is the largest, and the rock salt dissolution rate reaches the maximum. When the solution concentration is equal to the solution saturation concentration, the dissolution rate of rock salt is zero. The data were fitted, and the fitting results showed that the dissolution rate was linear with the solution concentration.
2.1.3. Effect of Fracturing Fluid Viscosity on Dissolution Rate
In this experiment, by changing the viscosity of the solution, the dissolution quality of salt rock samples under different viscosity and its influence on the dissolution rate were studied. Clean water, low viscosity fracturing fluid, and high viscosity fracturing fluid were selected for 1 L each (the three liquids were 55 mpa·s high viscosity fracturing fluid, 15 mpa·s low viscosity fracturing fluid, and 1 mpa·s clear water, respectively). The treated core was put into the solution, and the temperature, pressure, and rotational speed were adjusted to reach the set values.
Figure 5. It can be seen from
Figure 5 that the dissolution rate of rock samples decreases with the increase of viscosity. This is because the higher the viscosity of the solution, the greater the resistance to the movement of molecules in the solution, the more difficult the diffusion of solute molecules in the solution, and the lower the diffusion rate of solute to the surface of the rock samples and the lower the dissolution rate of rock samples.
2.1.4. Effect of Fracturing Fluid Velocity on Dissolution Rate
In this experiment, the dissolution of salt rock under the simulated dynamic condition under a certain flow state was studied, and the change of dissolution mass of salt rock under different flow rates was studied. In this experiment, based on the principle of the same linear velocity, the salt dissolution characteristics of 121, 153, and 204 r/min were adopted when the flow rate was 4, 6, and 8 m
3/min, respectively. Put the treated core into the solution, adjust the temperature and pressure to reach the set value, take out the rock sample weighing record and process the data after 30 min of dissolution.
Figure 6 shows that within a certain flow velocity range, the dissolution rate of salt rock increases with the increase in flow velocity. The motion of the solution accelerates the convection and diffusion of the salt solution and the salt particles in the solution, which can accelerate the dissolution rate of minerals to a certain extent. The dissolution rate of minerals will be different under different flow rates. The data were fitted, and the fitting results showed that there was an exponential relationship between the dissolution rate and the velocity of the solution.
2.2. Analysis of Primary and Secondary Factors Affecting Salt Dissolution
Grey correlation analysis is a method to measure the degree of correlation between factors according to the degree of similarity or dissimilarity of development trends between factors. Therefore, grey correlation analysis is used to analyze the correlation degree of each influencing factor so as to find out the main factors affecting the dissolution rate of salt rock. The main idea is as follows: Firstly, the dissolution rate is determined as the reference sequence, and the sub-factors (the above-influencing factors) for the correlation degree compared with the reference sequence are taken as the comparison sequence, as shown in
Table 3. Before the analysis, it is necessary to average the data so as to find out the grey correlation value between the solving parent sequence and the feature sequence and then calculate the correlation degree between them. The greater the value, the closer the relationship between the sub-factor and the parent factor.
Through the grey correlation analysis of salt rock dissolution rate, it can be found that each influencing factor restricts the other, but the degree of influence is very different. The degree of influence is arranged from large to small: solution temperature > solution flow rate > solution viscosity > solution concentration, as shown in
Table 4. Therefore, in the actual fracturing process, how to reduce the solution temperature, using low displacement injection, and using brine high viscosity fracturing fluid are the main directions to reduce the impact of salt dissolution.
4. Effect of Salt Dissolution on the Change of Fracture Conductivity
The fracture conductivity largely reflects the effectiveness of hydraulic fracturing. As the fracture conductivity increases, the hydraulic fracturing effect is better, and the production of fractured wells is better. In view of the prominent characteristics of salt dissolution in high salinity reservoirs, it is necessary to study the trend of change of fracture conductivity under salt dissolution [
20,
21].
4.1. Test Pieces and Equipment
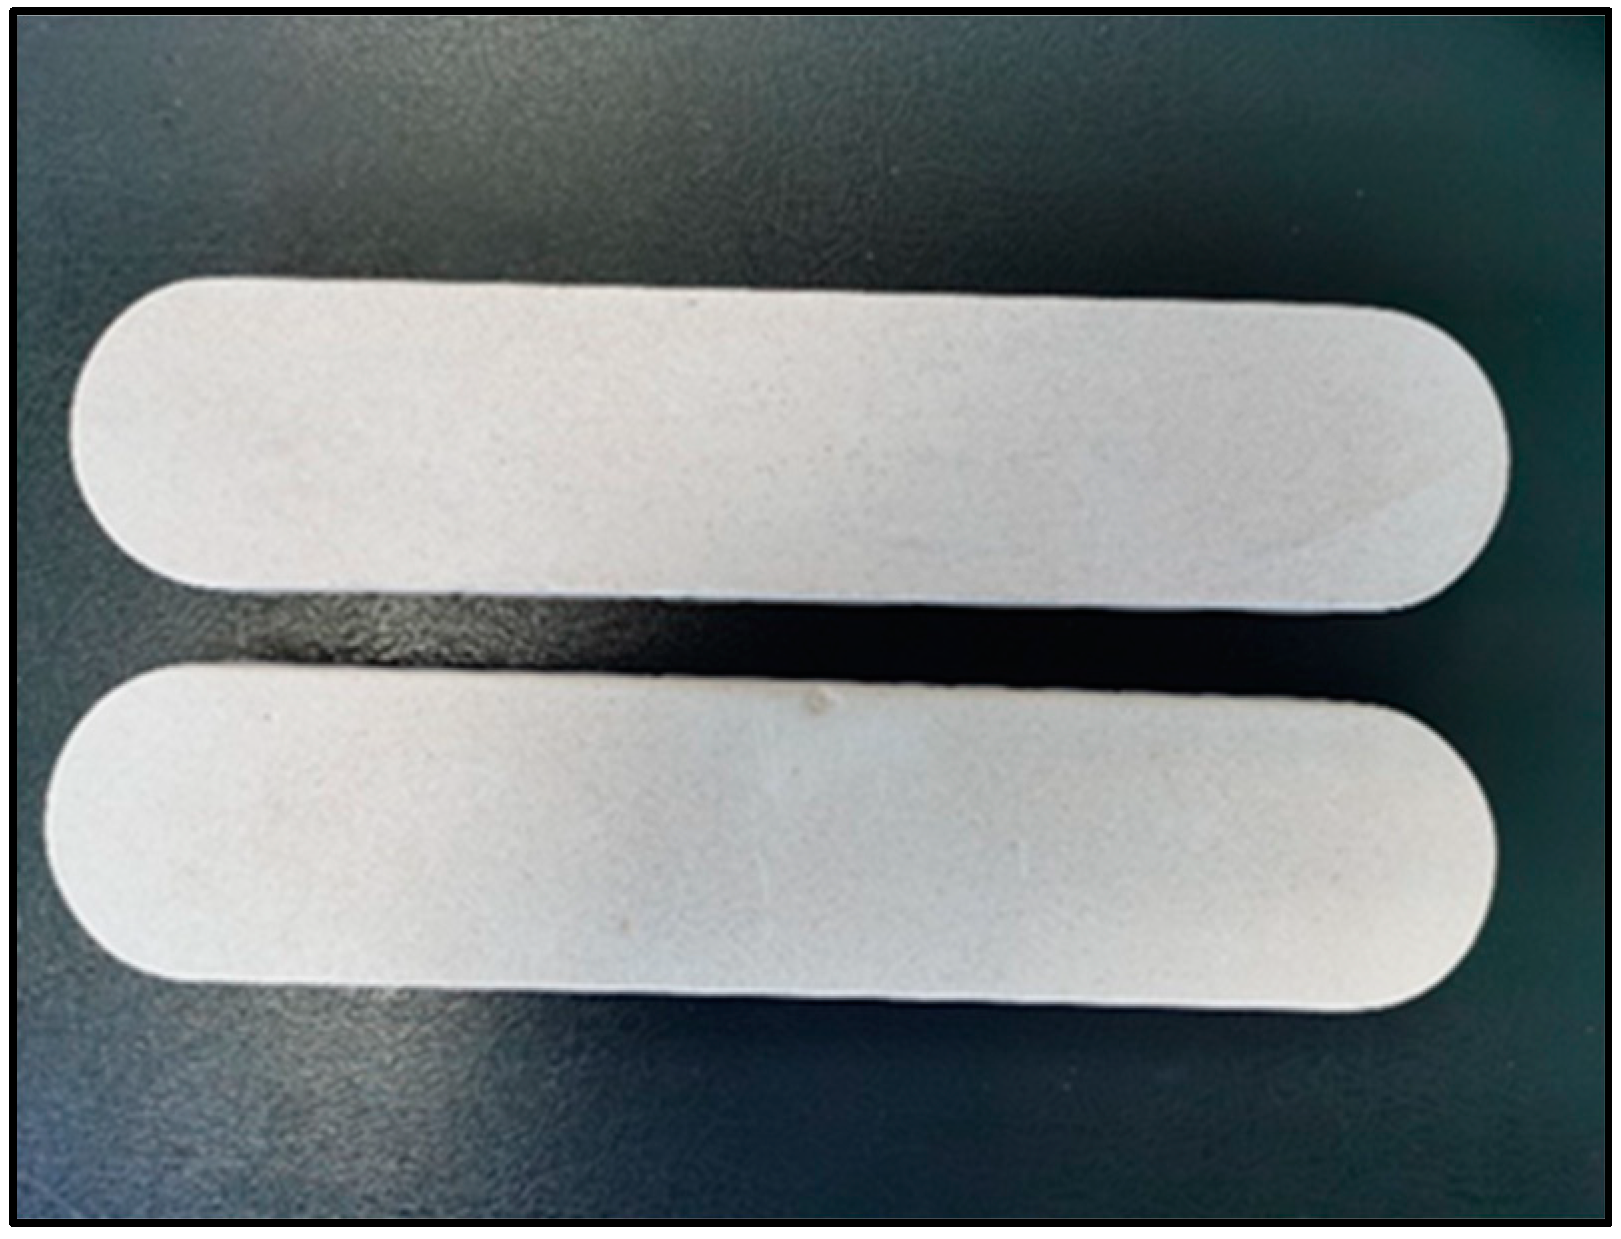
Due to the small number of cores in the Fengcheng Formation of Mahu, it is difficult to obtain natural cores to make rock slabs. Therefore, this experiment refers to the mineral analysis results of well XY1 at 5375.5.5 m and makes artificial rock with a sodium bicarbonate content of 78%. The rock slab with the required size of API conductivity was cut and processed by emery wire cutting, as shown in
Figure 10.
The HXDL-2C proppant conductivity system device was used in the fracture conductivity test. The experimental instrument mainly includes a closure pressure system, API flow chamber, displacement monitoring and measurement system, back pressure control, measurement system, and data acquisition and processing system, as shown in
Figure 11. The instrument can be used to evaluate the performance of different proppant fracture conductivity by simulating downhole closure pressure, temperature, and other reservoir-related conditions under standard experimental conditions. The main parameters are the maximum temperature of 200 °C, the maximum closure pressure of 120 MPa, and the fluid flow rate in the range of 0–20 mL/min.
4.2. The Experimental Method
In this conductivity experiment, the influence of salt dissolution on the change of fracture conductivity under no proppant condition was first considered. And the suitable fluid type was selected through the experiment. Secondly, experiments were carried out under different proppant particle sizes and proppant placement concentrations. 8 groups were carried out in the experiment, as shown in
Table 5.
The corresponding fracture conductivity can be calculated by measuring the flow rate and pressure difference during the experiment and combining them with the fluid viscosity.
k·Wf—propped fracture conductivity, D·cm;
Q—the flow rate through the fracture, cm3/s;
—fluid viscosity, mpa·s;
ΔP—pressure difference between the two ends of the propped fracture, kPa.
4.3. Analysis of Experimental Results
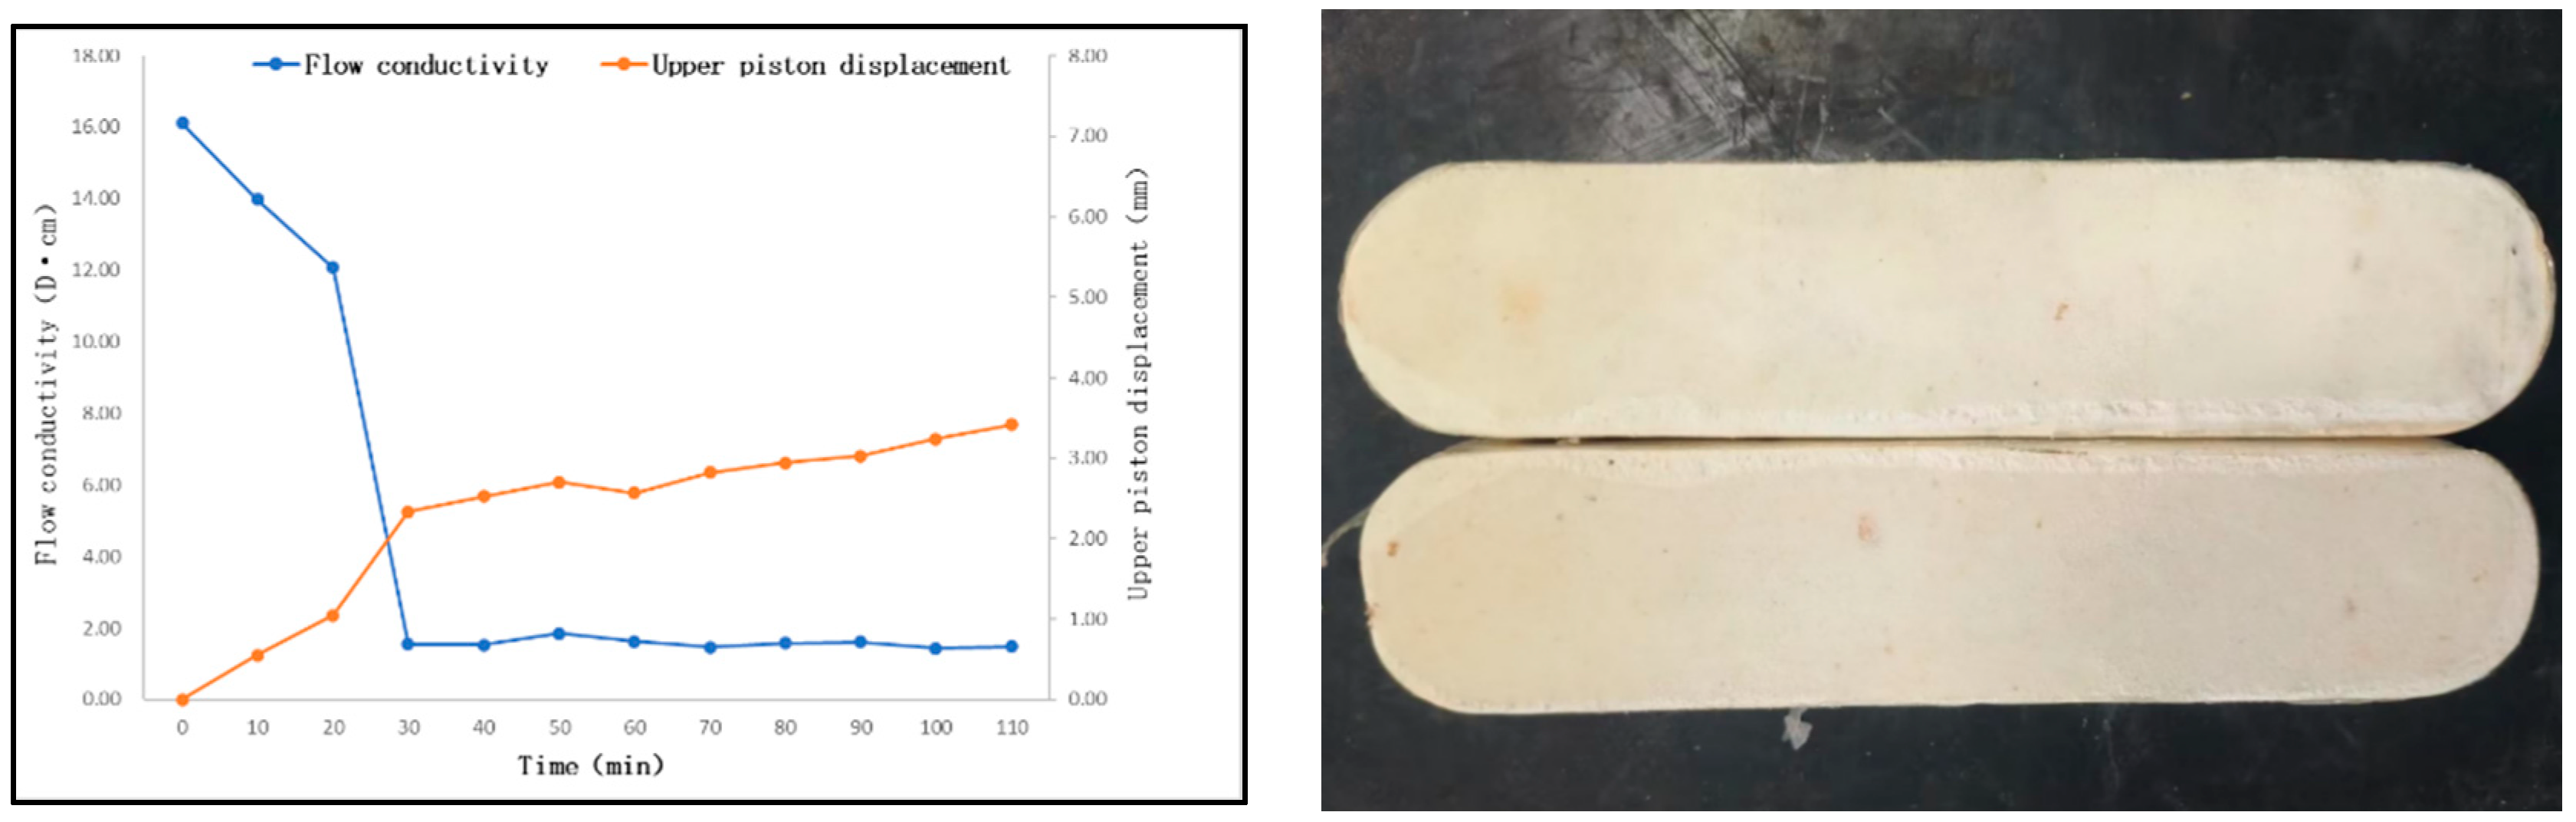
Firstly, the experiments with saturated sodium bicarbonate fracturing fluid without proppant were conducted. At the beginning of the experiment, the fracture width of the rock slab was small due to the lack of proppant. The flow path was the gap generated by the rough surface of the upper and lower rock slabs, and the measured initial fracture conductivity was 16.12 cm·D. As shown in
Figure 12, when the solution passed through the rock slab, the conductivity decreased rapidly and dropped to 1.54 cm·D at 30 min. Moreover, there was almost no change in the subsequent measurement time. By weighing the rock slab after this group of diversion experiments, it was found that the weight loss of the rock slab was very small. This result indicates that salt dissolution can be neglected. As can be seen from the picture of the rock slab after the experiment, the surface of the rock slab is smooth and flat, and there is no sign of dissolution. The saturated sodium bicarbonate fracturing fluid is closer to the change law of conductivity of conventional rock in the process of conductivity test. Under a certain closing pressure, the conductivity decreases rapidly in the initial stage and gradually reaches a stable value in the later stage.
Through the conductivity experiment of clean water fracturing fluid without proppant, it was found that the initial conductivity measured at the beginning of the experiment was 12.48 cm D. After that, in the process of the solution passing through the rock slab, the conductivity began to increase gradually due to the salt dissolution of the solution to the rock slab. The flow channel is also gradually increasing, and the conductivity is rising faster and faster, up to 116.39 cm D. When the experiment was carried out for 170 min, the flow channel generated by the salt solution collapsed under the action of long-term closure pressure. The fracture closes quickly and gradually blocks the rock slab gap. At the same time, the conductivity decreased sharply and finally decreased to 2.52 cm D. Subsequent observation of the rock slab after the conductivity experiment (
Figure 13), the surface collapse corrosion was significant. After weighing, it was found that the weight loss of the rock slab was 124.07 g, and the salt solution reduction effect was significant. Summarizing the above two sets of experimental results, combined with the previous salt solution experiment and compression experiment, the final conductivity of the water fracturing fluid is slightly higher. However, considering reservoir stability and conductivity, saturated brine fracturing fluid is more suitable for High salinity reservoirs.
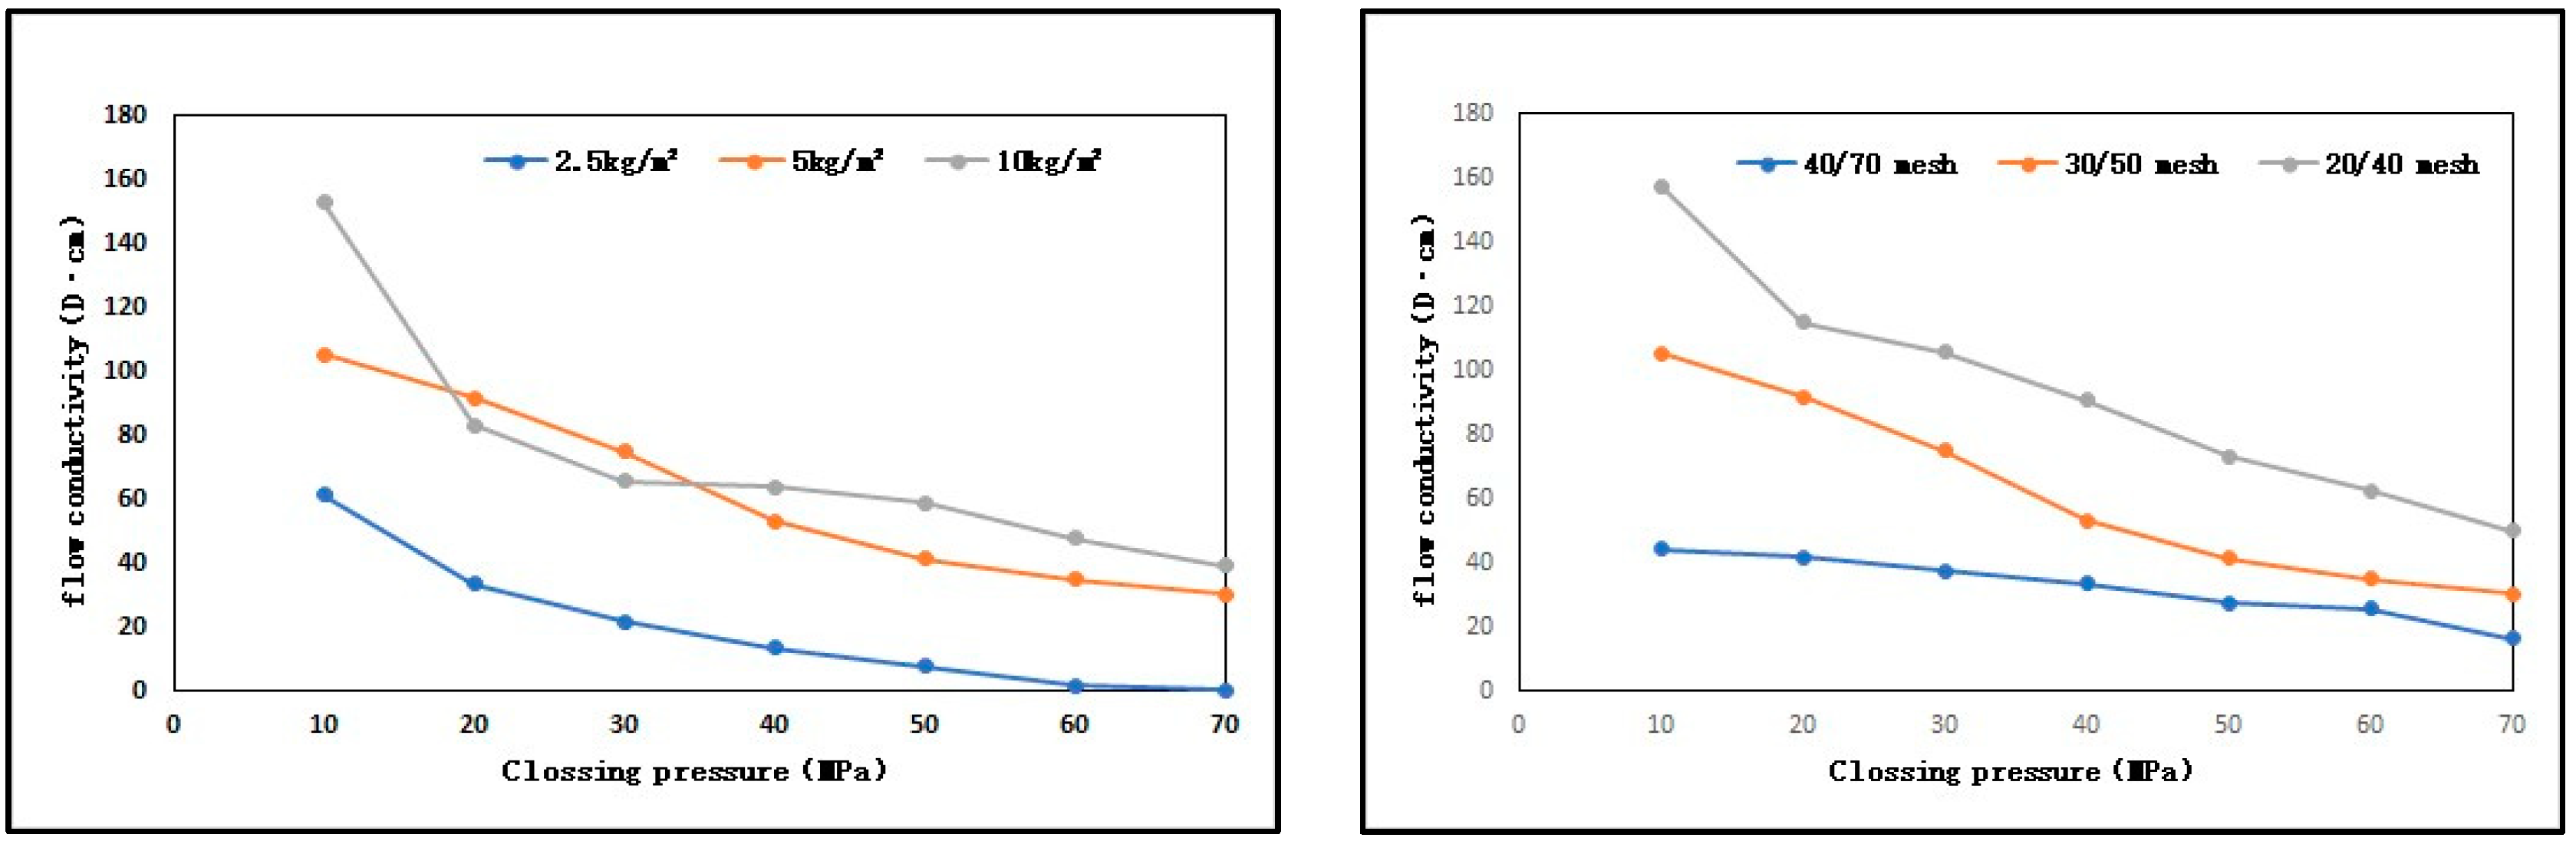
The conductivity experiments of different particle sizes of proppant were carried out using saturated saline fracturing fluid and Ceramic proppant with a sand concentration of 2.5–10 kg/m
2 and a closing pressure of 10–70 MPa. As shown in
Figure 14, it can be seen that the larger the particle size of the proppant, the higher the fracture conductivity. The larger the particle size of the proppant, the smaller the embedding effect; so that the larger the effective fracture width can be provided, the higher the fracture conductivity.
Using saturated saline fracturing fluid and 30/50 Ceramic proppant with a closing pressure design of 10–70 MPa, three groups of different sand concentrations of 10 kg/m2, 5 kg/m2, and 2.5 kg/m2 were carried out, respectively. With the increase of proppant concentration, the conductivity changes significantly. Final fracture conductivity size 10 kg/m2 greater than 5 kg/m2 greater than 2.5 kg/m2. At high closing pressure of 2.5 kg/m2 proppant, it is embedded in the rock slab part more, which can hardly provide fracture width that fracture conductivity is very low. There is little difference between 10 kg/m2 and 5 kg/m2 fracture conductivity.


