Article

Investigation into the Flow Mechanism of Nano-Elastic Microspheres during Water Invasion

1
No.1 Gas Production Plant, PetroChina Xiniang Oilfield Company, Karamay 834000, China
2
State Key Laboratory of Petroleum Resources and Prospecting, China University of Petroleum, Beijing 102249, China
*
Author to whom correspondence should be addressed.
Processes 2023, 11(12), 3342; https://doi.org/10.3390/pr11123342
Submission received: 12 October 2023 / Revised: 17 November 2023 / Accepted: 23 November 2023 / Published: 30 November 2023

Abstract

:
Nano-elastic microspheres are particle-absorbent polymers that can be applied in plugging water. They plug pores and throats, reducing the damage from water invasion. The plug effect and flow mechanism of nano-elastic microspheres during water invasion were investigated in this paper through laboratory experiments. The results of the plugging experiments show that the nano-elastic microspheres had a higher plugging rate and formed physical plugs in the aquiferous region, thus preventing water invasion. Online nuclear magnetic resonance experiments indicated that the nano-elastic microspheres migrated from large pores to smaller ones during the flow process, forming elastic plugs in the porous media. The nano-elastic microspheres expanded in the aquiferous layer, increasing the flow resistance through both physical and elastic plugging, thereby reducing the water cut. Nano-elastic microspheres employed physical plugging to prevent water invasion and exhibited elastic flow in the porous media during the invasion.

1. Introduction

With the continuous exploitation of crude oil, reservoirs gradually enter a high-water-cut stage. In fields with an elevated water cut, profile control and water plugging emerge as the primary methods for enhancing oil recovery. In recent years, the petroleum industry has introduced a plethora of water-plugging products, including microgels, polymer microspheres, fuzzy-ball fluids, nanofluids, polymer gel systems, and preformed particle gels, among others [1,2,3,4,5,6,7,8,9,10,11,12,13]. Polymer microspheres are commonly used in enhanced oil recovery (EOR). Hao et al. developed breakable microspheres that offer a selective and targeted approach to remove blockages caused by heavy oil and asphaltene precipitates [14]. Poly(aminopropyl/methyl) silsesquioxane microspheres, developed by Yang et al., hinder interactions among paraffin crystals, thus improving the fluidity of waxy oil [15]. Yang et al. also produced acid-resistant hydrophobic polymer nanospheres that adhere to the gas–liquid interface, enhancing the stability of CO2 foam [16]. Magnetic polymer nanospheres, developed by Zhou et al., possess a low viscosity and strong magnetism, allowing them to be efficiently separated from the produced fluid. These nanospheres are suitable for deep profile control and are reusable [17].
As a profile-controlling agent, polymer microspheres effectively decrease the water cut by plugging high-permeability channels [18,19,20,21,22]. The intricate flow dynamics within porous media necessitate a comprehensive understanding for the future application of deep profile control technology [19,20]. Polymer microspheres induce resistance via complete, single, and bridge plugging, causing deformation and additional resistance [23,24]. The flow modes can be categorized as smooth pass, elastic plugging, and complete plugging based on the compatibility coefficients between the particle and pore geometry [25,26]. When the width of the throats ranges from 3 to 7 times that of a particle, the microspheres enter the pores and coalesce, resulting in bridge plugging [27,28]. Subsequent fluids then fail to navigate past the blockage, diverting instead towards paths of least resistance [22,29,30].
Nuclear magnetic resonance (NMR) technology is prevalently utilized in the petroleum sector, notably for discerning rock pore structures and fluid flow characteristics [31,32,33]. Low-field NMR laboratory core analysis experiments yield richer and more precise data about rock structures [34,35]. This study employs NMR experiments to explore the flow characteristics of nano-elastic microspheres in heterogeneous low-permeability reservoirs.
The nano-elastic microspheres referenced herein are polymer microspheres crafted using the reverse microemulsion technique. They have the ability to absorb water and swell, effectively sealing areas with a high water cut. This research investigates the water plugging and flow mechanisms of nano-elastic microspheres at the microscopic level by combining plugging and NMR experiments. This paper investigates the plugging actions of nano-elastic microspheres in both matrix and fracturing zones, utilizing the plugging rate as an index of plugging. This paper analyzes variations in the T2 spectrum during the flow of nano-elastic microspheres, unveiling their operative mechanism within the formation.

2. Material and Methods

2.1. Material

Nano-elastic microspheres. The main components of the nano-elastic microspheres used in this study consisted of acrylamide, N,
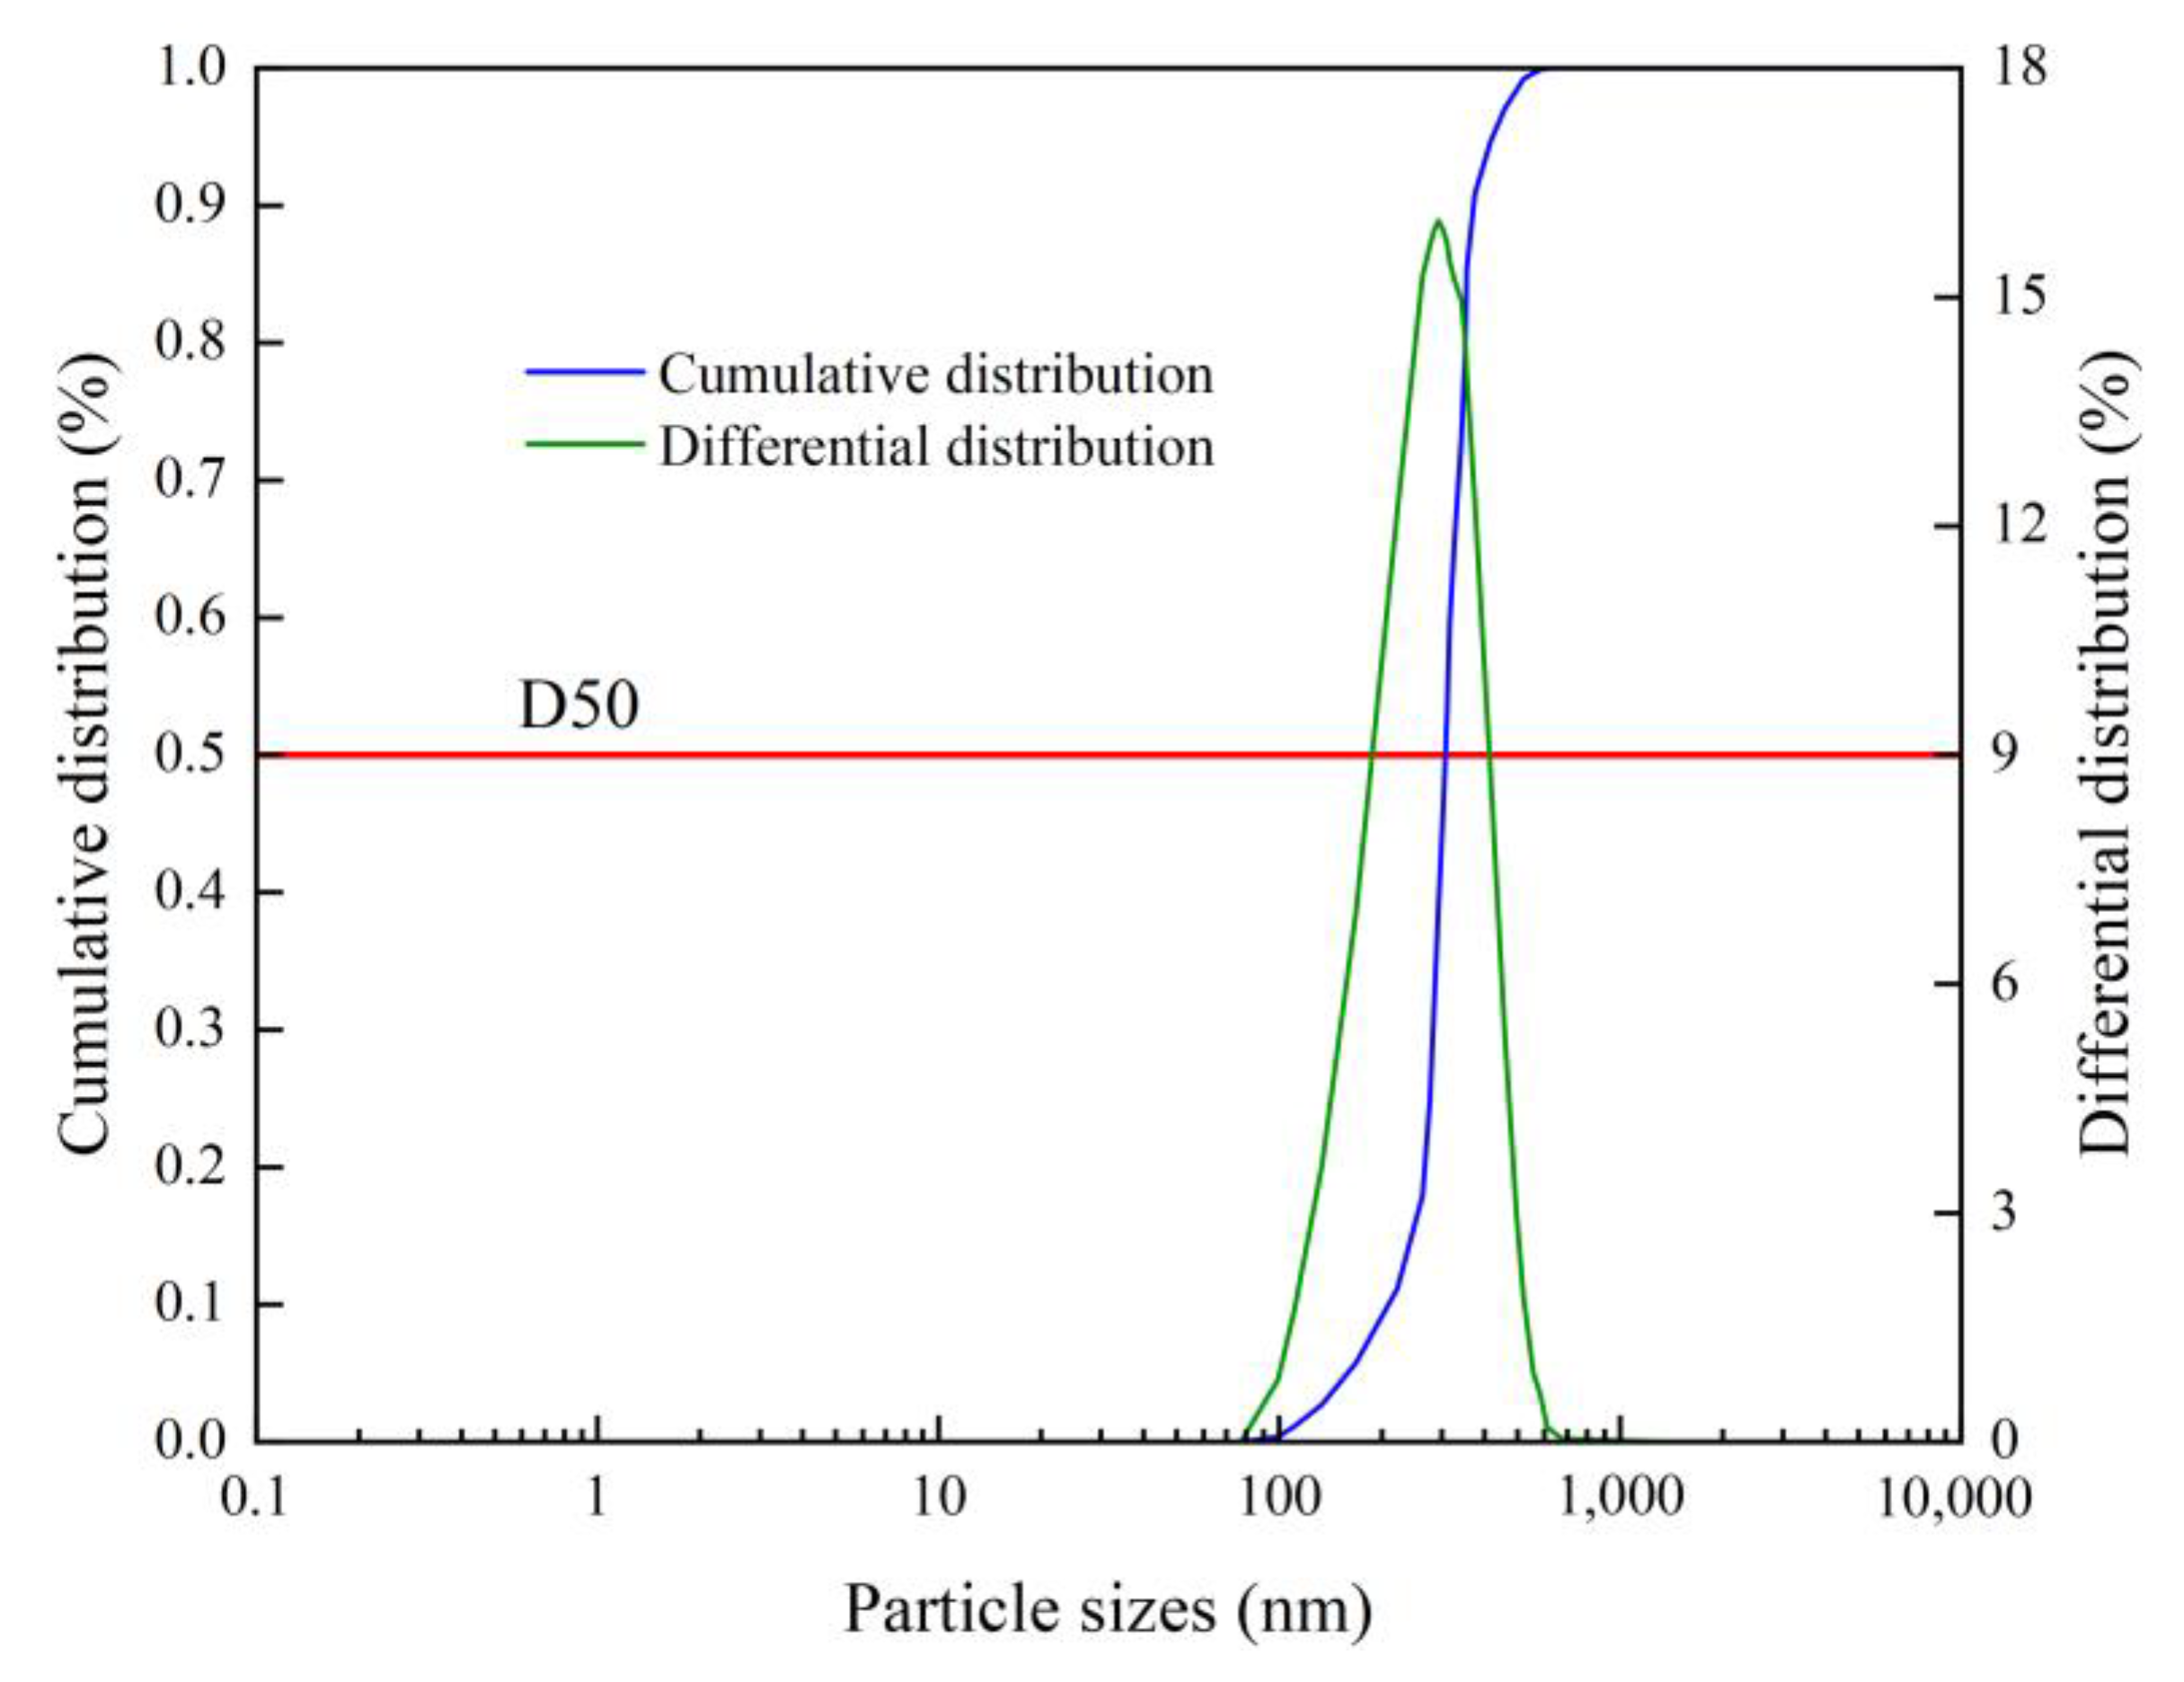
N-methylene bisacrylamide, ammonium persulfate, and sodium bisulfite. Prepared through reverse microemulsion polymerization, these microspheres were stored in kerosene, with an initial particle size of approximately 300 nm. 
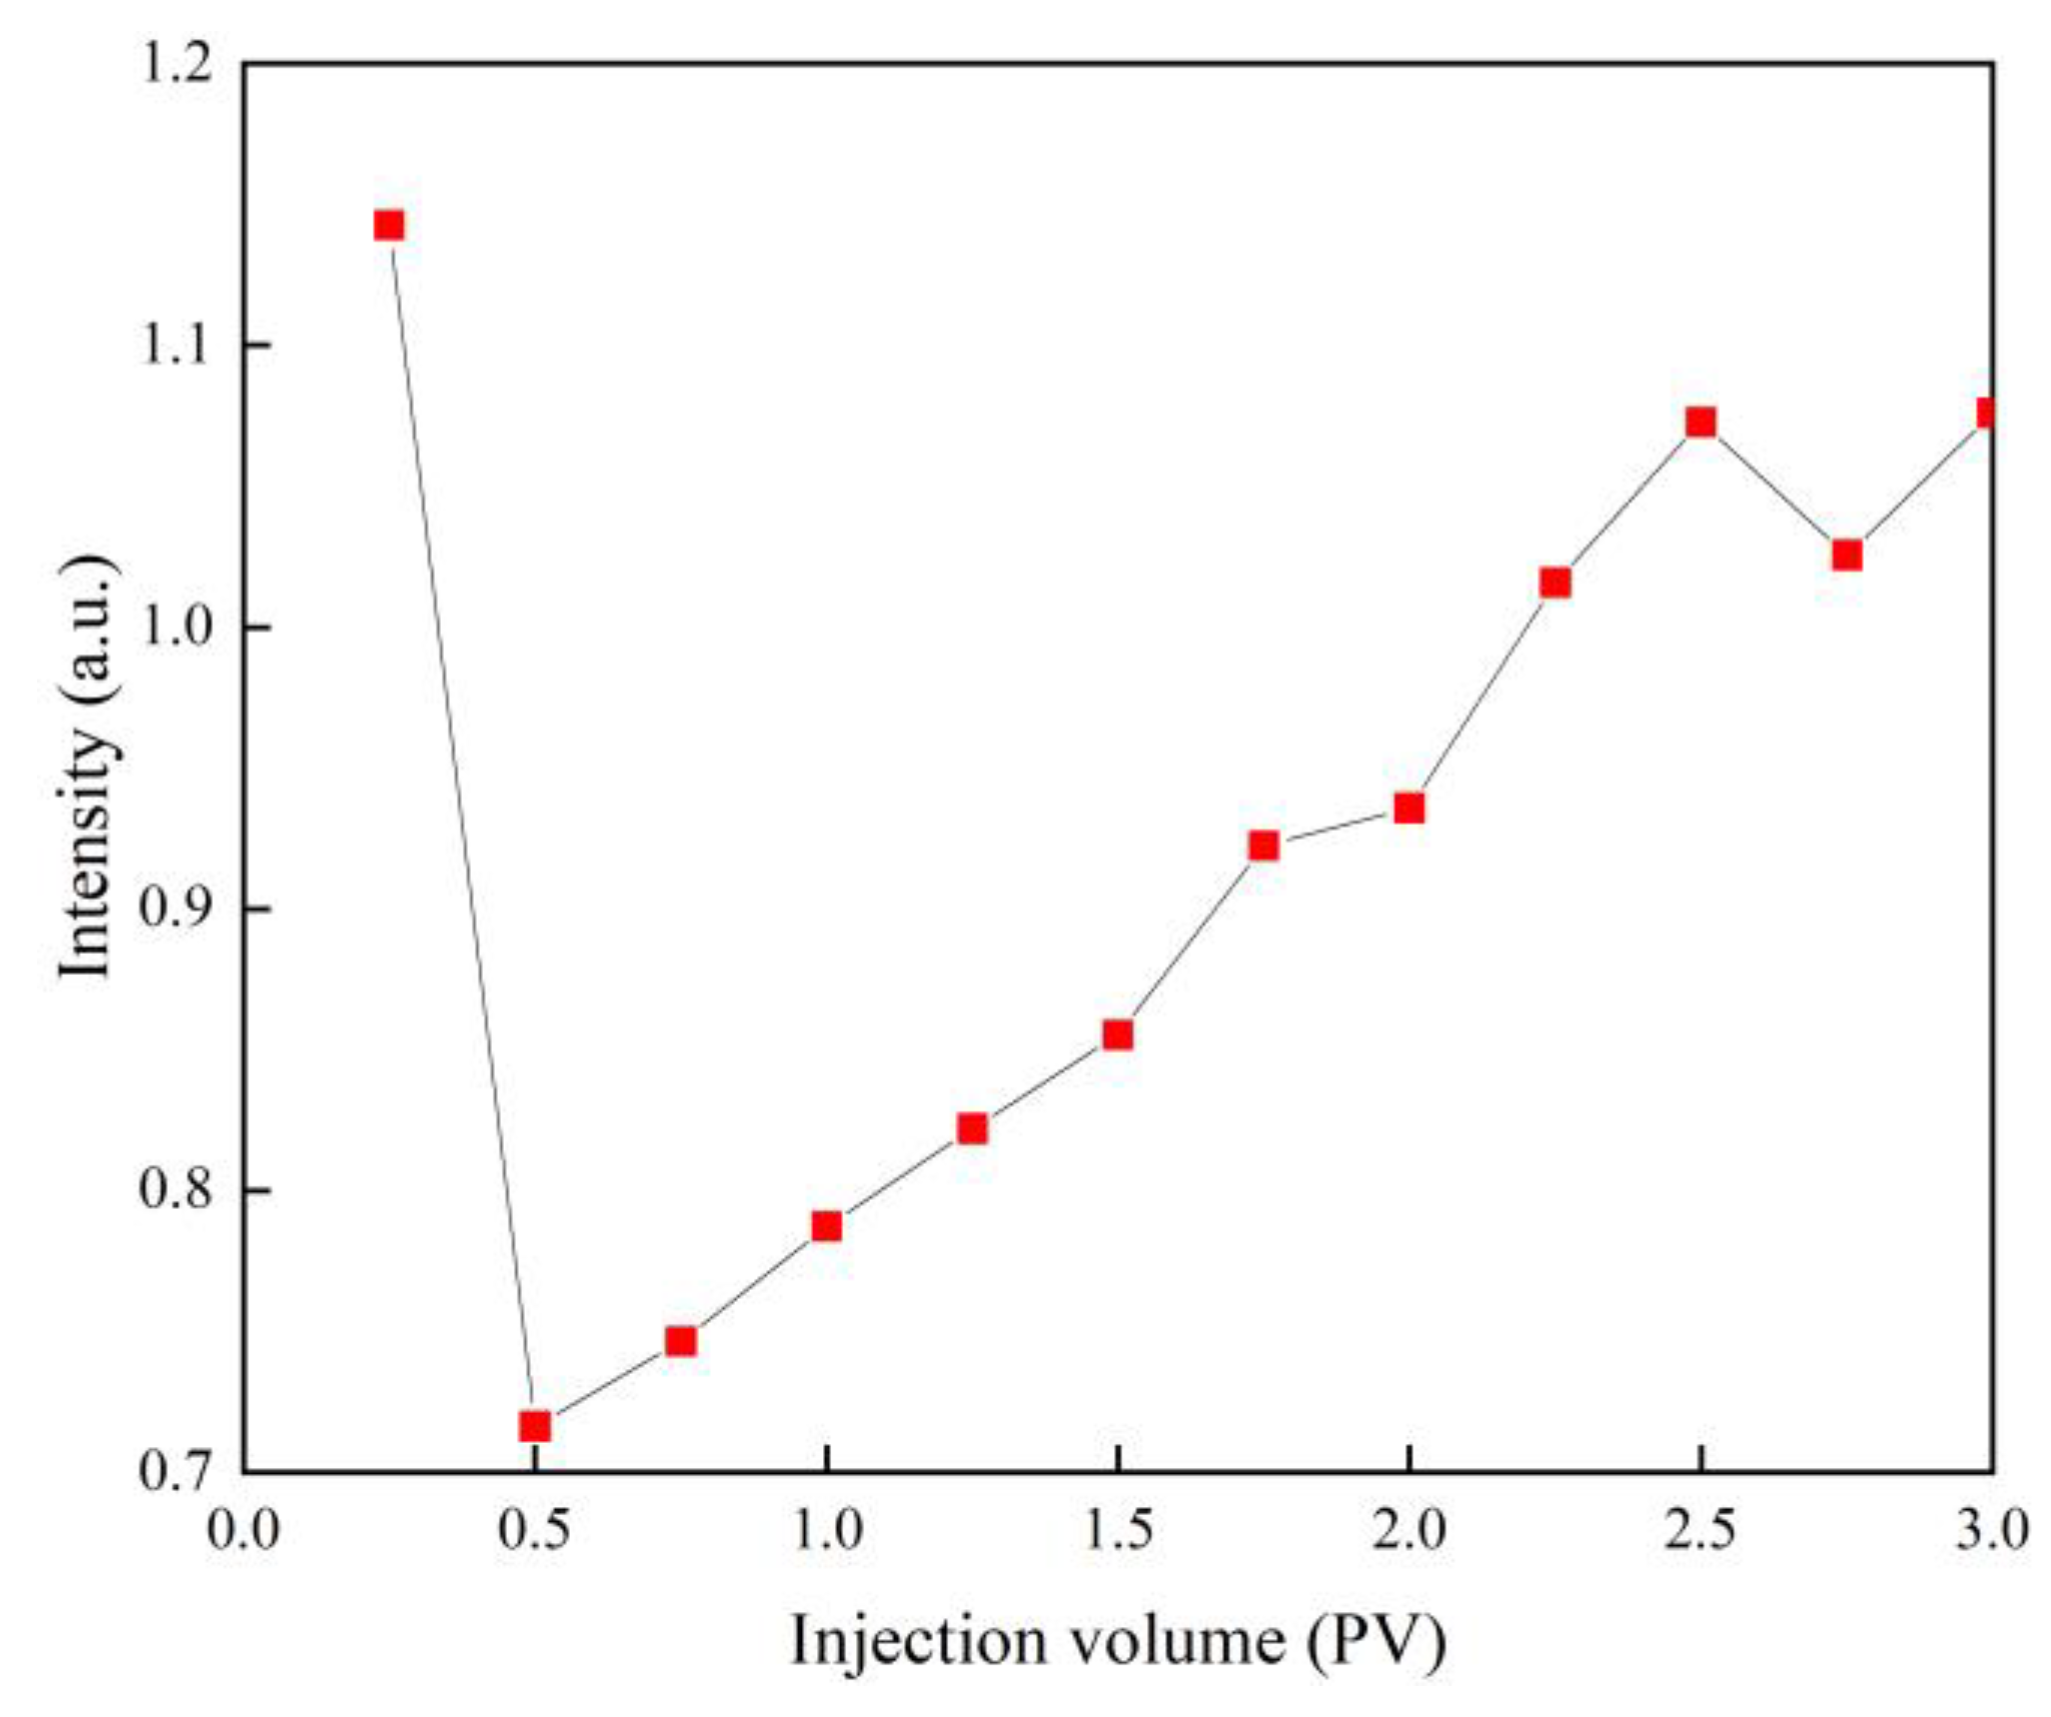
Figure 1 illustrates the particle size distribution, and 
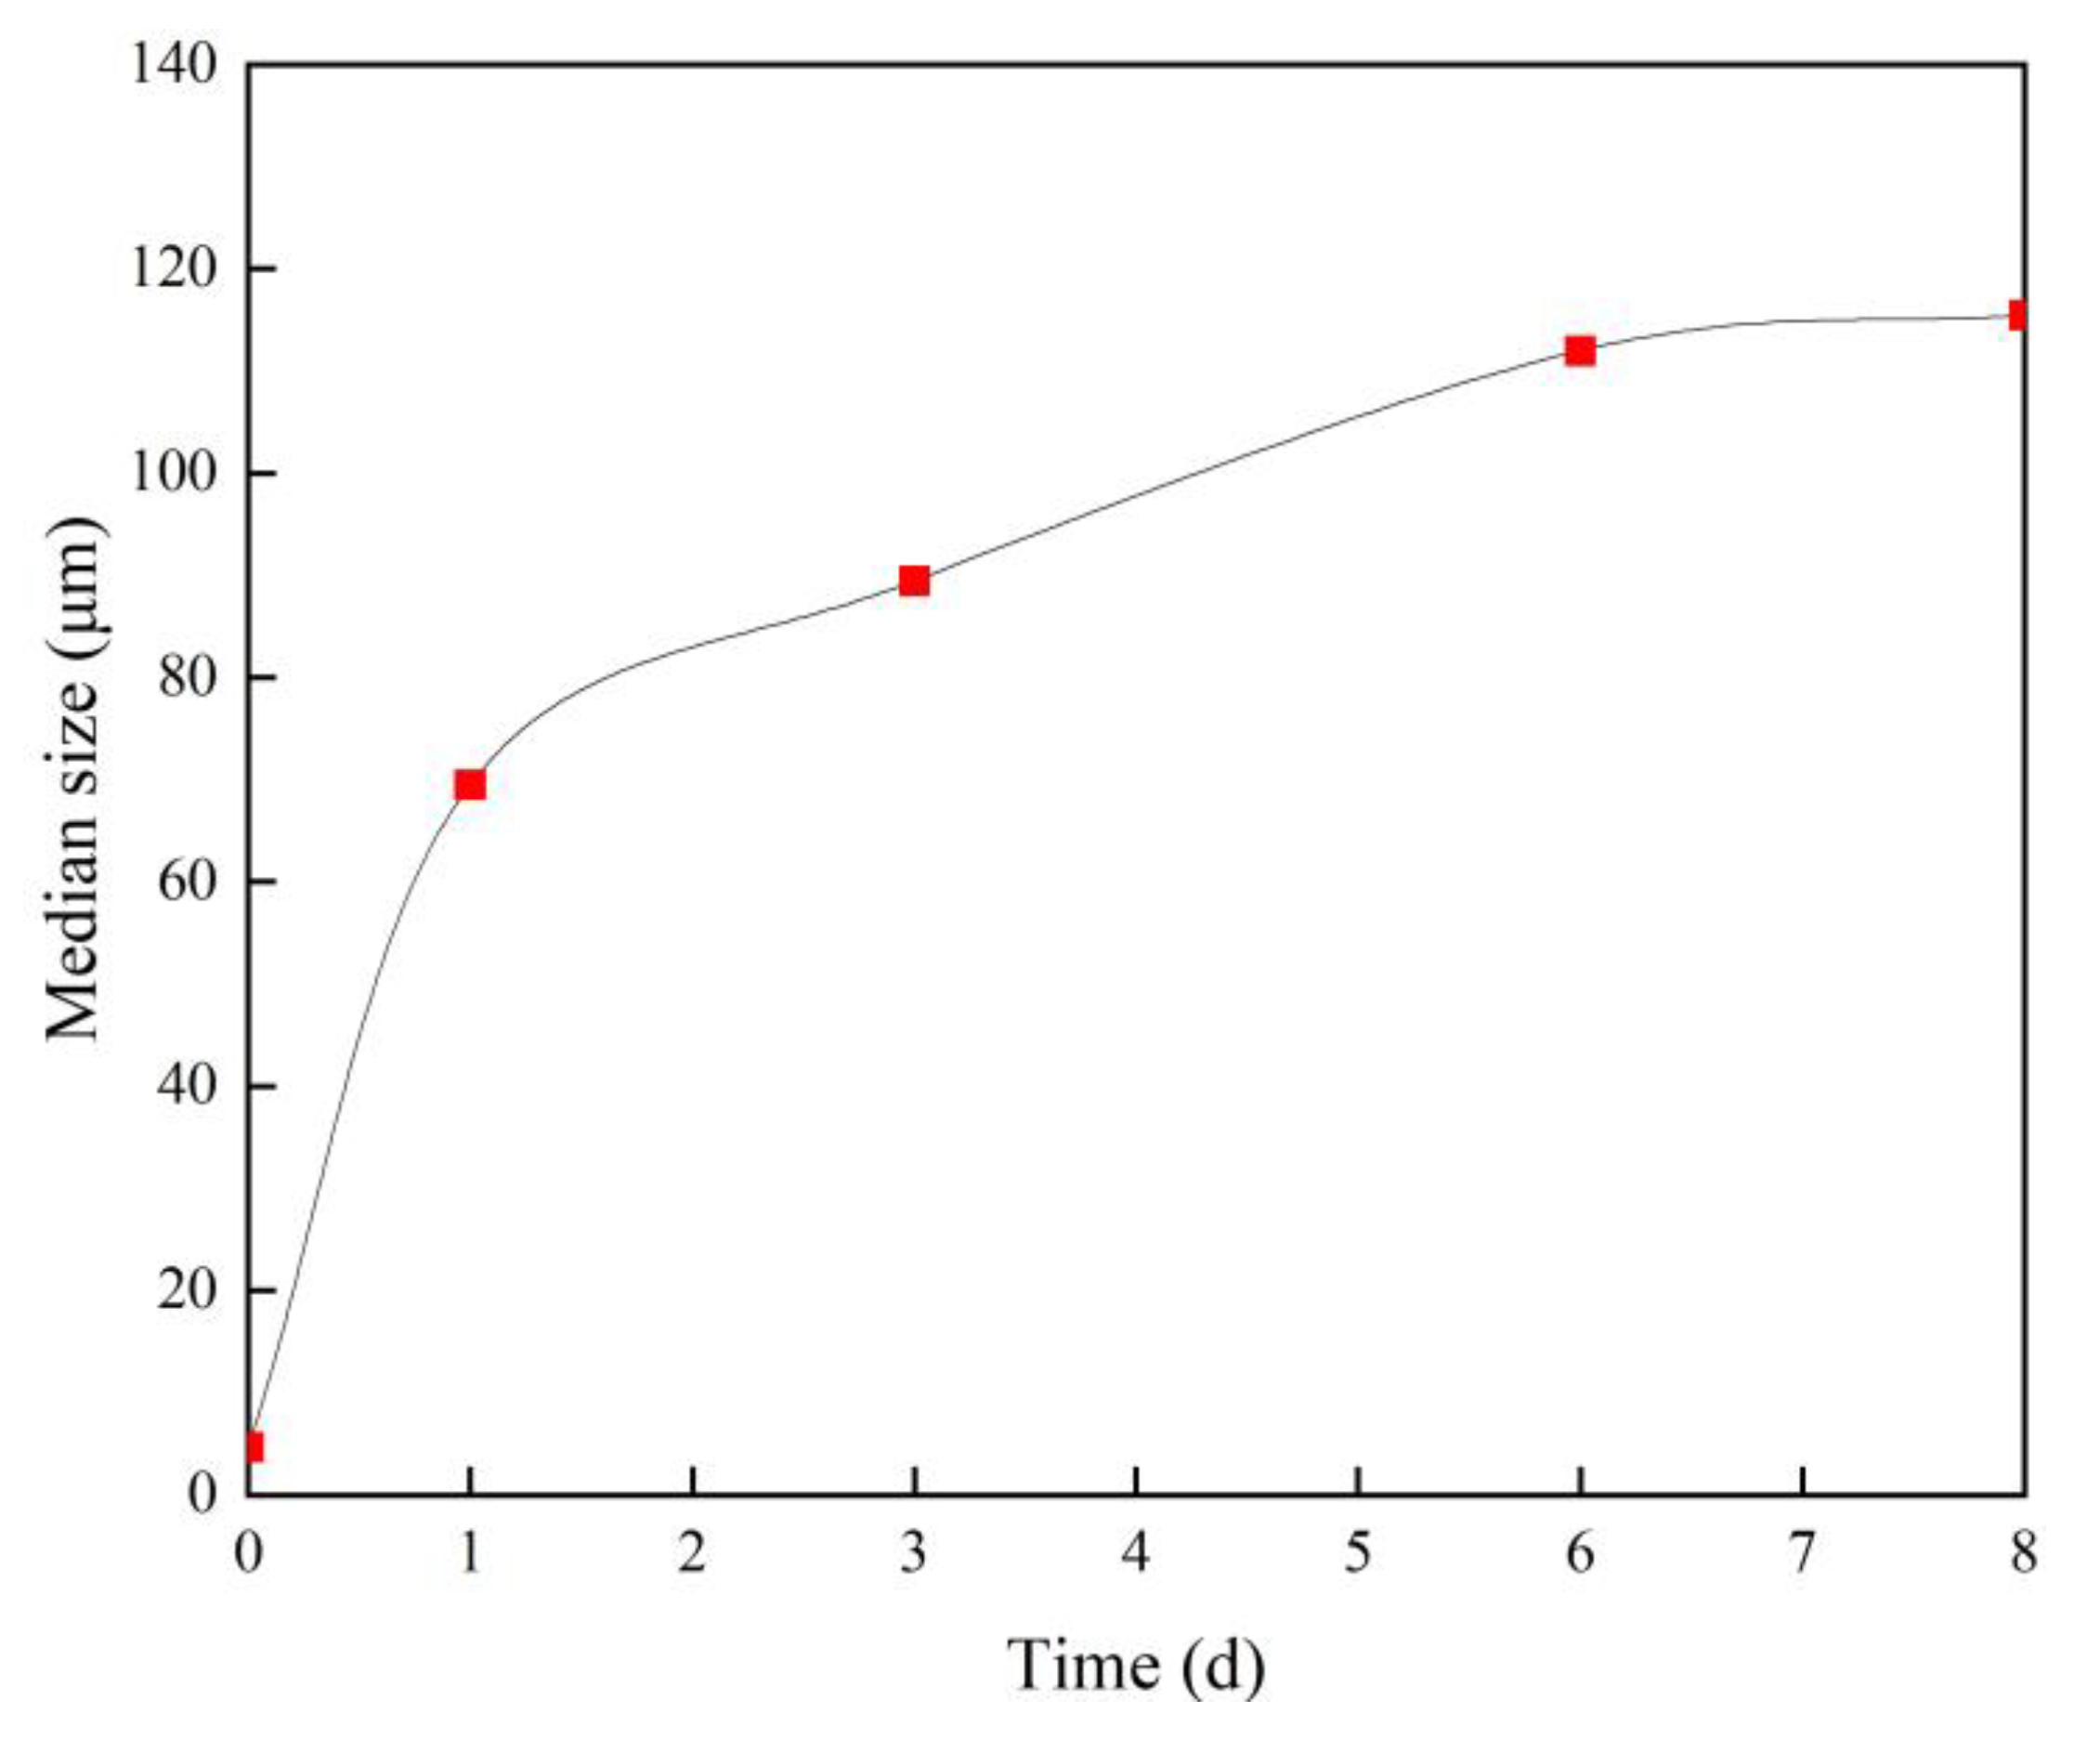
Figure 2 displays the curve of the particle size of the nano-elastic microspheres in Yan5 formation water. Following a 6-day submersion in formation water, the nano-elastic microspheres underwent maximum expansion, with the particle size reaching up to 115.4 μm.
Rock. The cores, taken from the Yan5 formation in the Ordos Basin, were cut to a length of 5 cm and a diameter of 2.5 cm. The formation pressure ranges between 15 and 25 MPa, and the formation temperature is 60 °C. These cores were specifically designated for core-plugging experiments. The remaining rock material was ground into 70-mesh and 140-mesh sands. The sand particles were mixed in a ratio of 100:1 and filled in sand-packs. The properties of the sand-packs closely resembled the formation, which can simulate the formation fracturing zone [36]. The parameters of core and sand-packs used in this paper are detailed in Table 1.
Liquid. Both dead oil and formation water were retrieved from the Yan5 layer in the Ordos Basin. The components of the dead oil are shown in Figure 3 and Table 2. The viscosity of the oil was 1.326 mPa·s, which was used in the plugging experiments. Table 3 presents the composition and salinity of the formation water, with K+ and Na+ as the main cations and Cl as the main anion. The salinity was 82,577 mg/L, classifying the water as CaCl2-type according to Sulin’s system. The formation water was stored in a relatively closed and anoxic environment. The simulated formation water, formulated as per Table 2, was utilized in both the plugging and NMR experiments.
3MTM electronic fluorinated solution (FC-40), with a molecular formula of C12F27N, has a viscosity of 3.8 mPa·s and a density of 1.9 g/cm3. This material does not contain hydrogen and cannot be identified in NMR experiments. As a result, it is frequently utilized as a substitute for crude oil in displacement experiments [36,37].

2.2. Plugging Experiments

The plugging experiments included core-plugging experiments and sand-pack-plugging experiments. The core-plugging experiment investigated the plugging mechanism of nano-elastic microspheres in the formation, while the sand-pack-plugging experiment explored the plugging mechanism in the fracturing zone. In this paper, the plugging rate, serving as the plugging index, was dedicated to evaluating the plugging effect of nano-elastic microspheres in both the formation and fracturing zone. The calculation formula for the plugging rate is shown in Equation (1).
η = K 1 K 2 K 1
where η is the plugging rate, %; K1 is the initial permeability, ×10−3 μm2; and K2 is the permeability after nano-elastic microsphere injection, ×10−3 μm2.
Experimental cores A-1, A-2, and A-3 were selected for the study. A-1 was saturated with dead oil, A-2 with simulated formation water, and A-3 established the irreducible water via the oil flooding method. These cores, respectively, simulated the oil layer, water layer, and oil–water transition zone in the formation. The schematic diagram of the core-plugging experiments is shown in Figure 4. The equipment included a displacement system (constant velocity and constant pressure pump (its accuracy is 0.001 mL/min), an intermediate vessel (can withstand 70 MPa), a core holder, a confining pressure pump (its accuracy is 0.001 mL/min)) and measurement system (measurement tube and pressure sensor (accuracy 0.001 MPa)). The equipment was produced by Jiangsu Tuochuang Scientific Research Instruments Co., Ltd (Nantong, China). The experimental equipment with these accuracies could effectively conduct the plugging experiment of nano-elastic microspheres. The intermediate vessel contained simulated formation water, dead oil, and a nano-elastic microsphere solution. The experimental temperature was set at 60 °C and the pressure was maintained at 25 MPa. The steps of the core-plugging experiment were as follows:
Step 1: The permeability K1o of A-1 was measured using oil, with the flow rate set at 0.05 mL/min. The permeability K1w of A-2 and A-3 was measured using simulated formation water, with the flow rate also set at 0.05 mL/min;
Step 2: The core holder was rotated and the mother liquor of nano-elastic microspheres was injected into A-1. For A-2 and A-3 cores, a solution of nano-elastic microspheres (5000 mg/L) was injected. The injection volume was set at 2 PV, and the flow rate was maintained at 0.05 mL/min;
Step 3: the valves at both locations of the core holder were closed and the core was left to sit for 6 days to allow the nano-elastic microspheres to fully expand;
Step 4: Step 1 was repeated to measure the permeability K2 of the three cores;
Step 5: Equation (1) was used to calculate the plugging rates of two types of nano-elastic microspheres in the matrix.
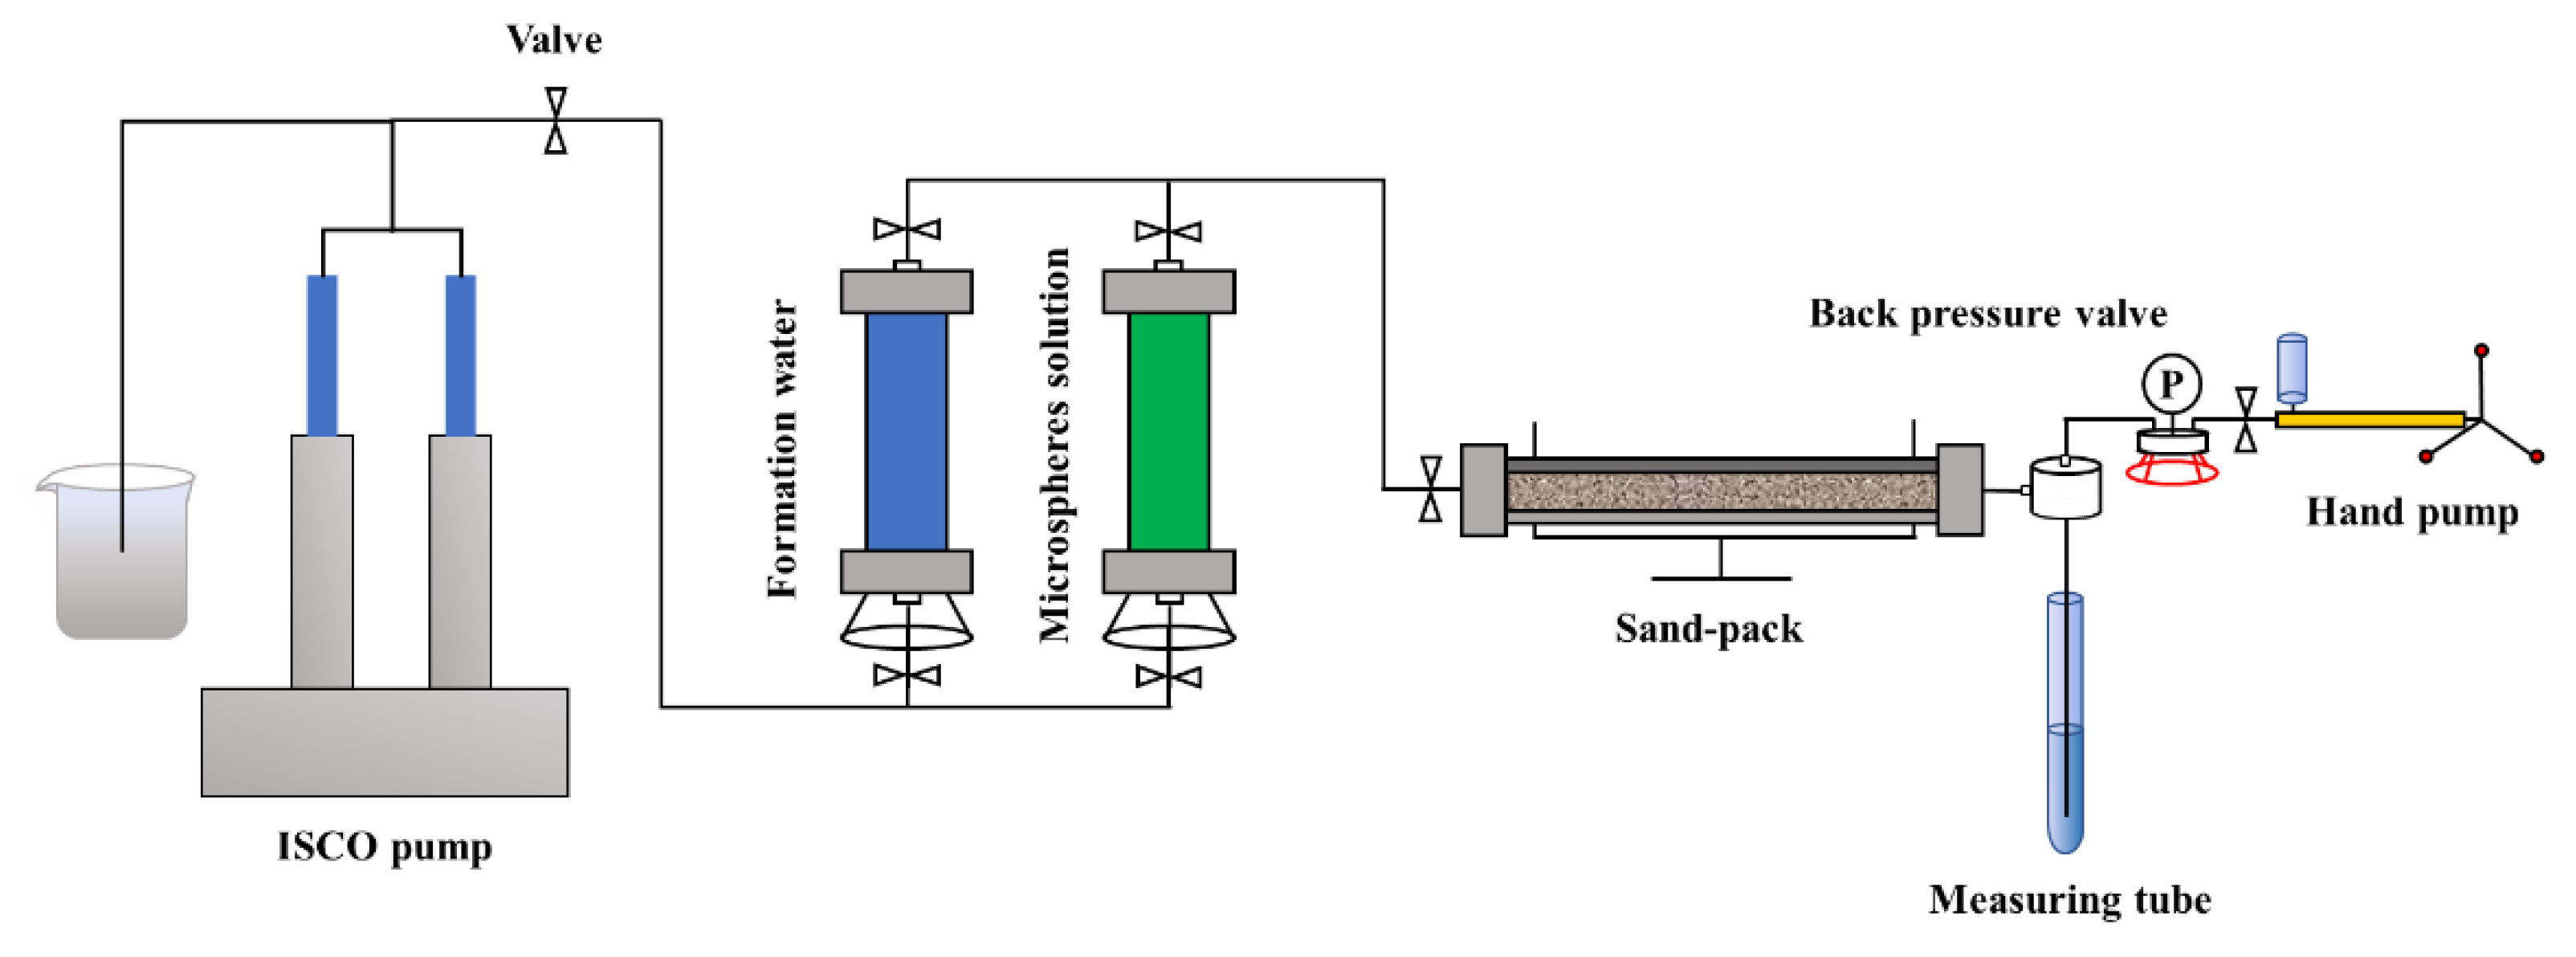
Sand-pack 1 and sand-pack 2 were filled in the same way, possessing an identical porous media structure. It was assumed that the net pressure in the fracture was 10 MPa after fracturing. Sand-pack 1 applied 15 MPa of back pressure to simulate the fracturing zone at the production well, while sand-pack 2 applied 25 MPa of back pressure to simulate the boundary of the fracturing zone. In this study, we simulated different locations of fracturing zones by applying different pressures of sand-packs to investigate the plugging mechanism. The schematic diagram of sand-pack-plugging experiments is shown in Figure 5. The experimental apparatus aligned with that used in the core-plugging experiments, with the sand-pack replacing the core holder and the back pressure system located behind the sand-pack. Back pressure was regulated with a valve and supplied using a hand pump. When the fluid pressure exceeded the back pressure, the fluid could flow out. The specific experimental steps were as follows:
Step 1: 70-mesh and 140-mesh sands were homogeneously mixed, filled into the sand-packs, compacted, and saturated with simulated formation water;
Step 2: the back pressure was applied using a hand pump, and it was set to 15 MPa and 25 MPa, respectively;
Step 3: the permeability K1 of the sand-pack was measured using simulated formation water with a flow rate set at 1 mL/min;
Step 4: The nano-elastic microsphere solution was injected into the sand-pack until the nano-elastic microspheres flowed out uniformly and continuously. The nano-elastic microspheres were allowed to expand in the sand-pack for 6 days, and then, the permeability K2 was measured with the simulated formation water once again;
Step 5: The pressure at the inlet was raised step by step (the step size was 0.2 MPa), and each pressure level was maintained for a constant duration. The breakthrough pressure Pb was determined when a continuous fluid flow was observed;
Step 6: we used Equation (1) to calculate the plugging rate η and Equation (2) to calculate the breakthrough pressure gradient PL.
G b = P b L
where Gb represents the breakthrough pressure gradient in MPa/m; Pb denotes the breakthrough pressure in MPa; and L is the length of the sand-pack in meters.
The plugging rate reflects the plugging ability of nano-elastic microspheres in porous media, while the breakthrough pressure reflects the minimum pressure required for water to break through the porous media blocked by the nano-elastic microspheres.

2.3. NMR Experiments

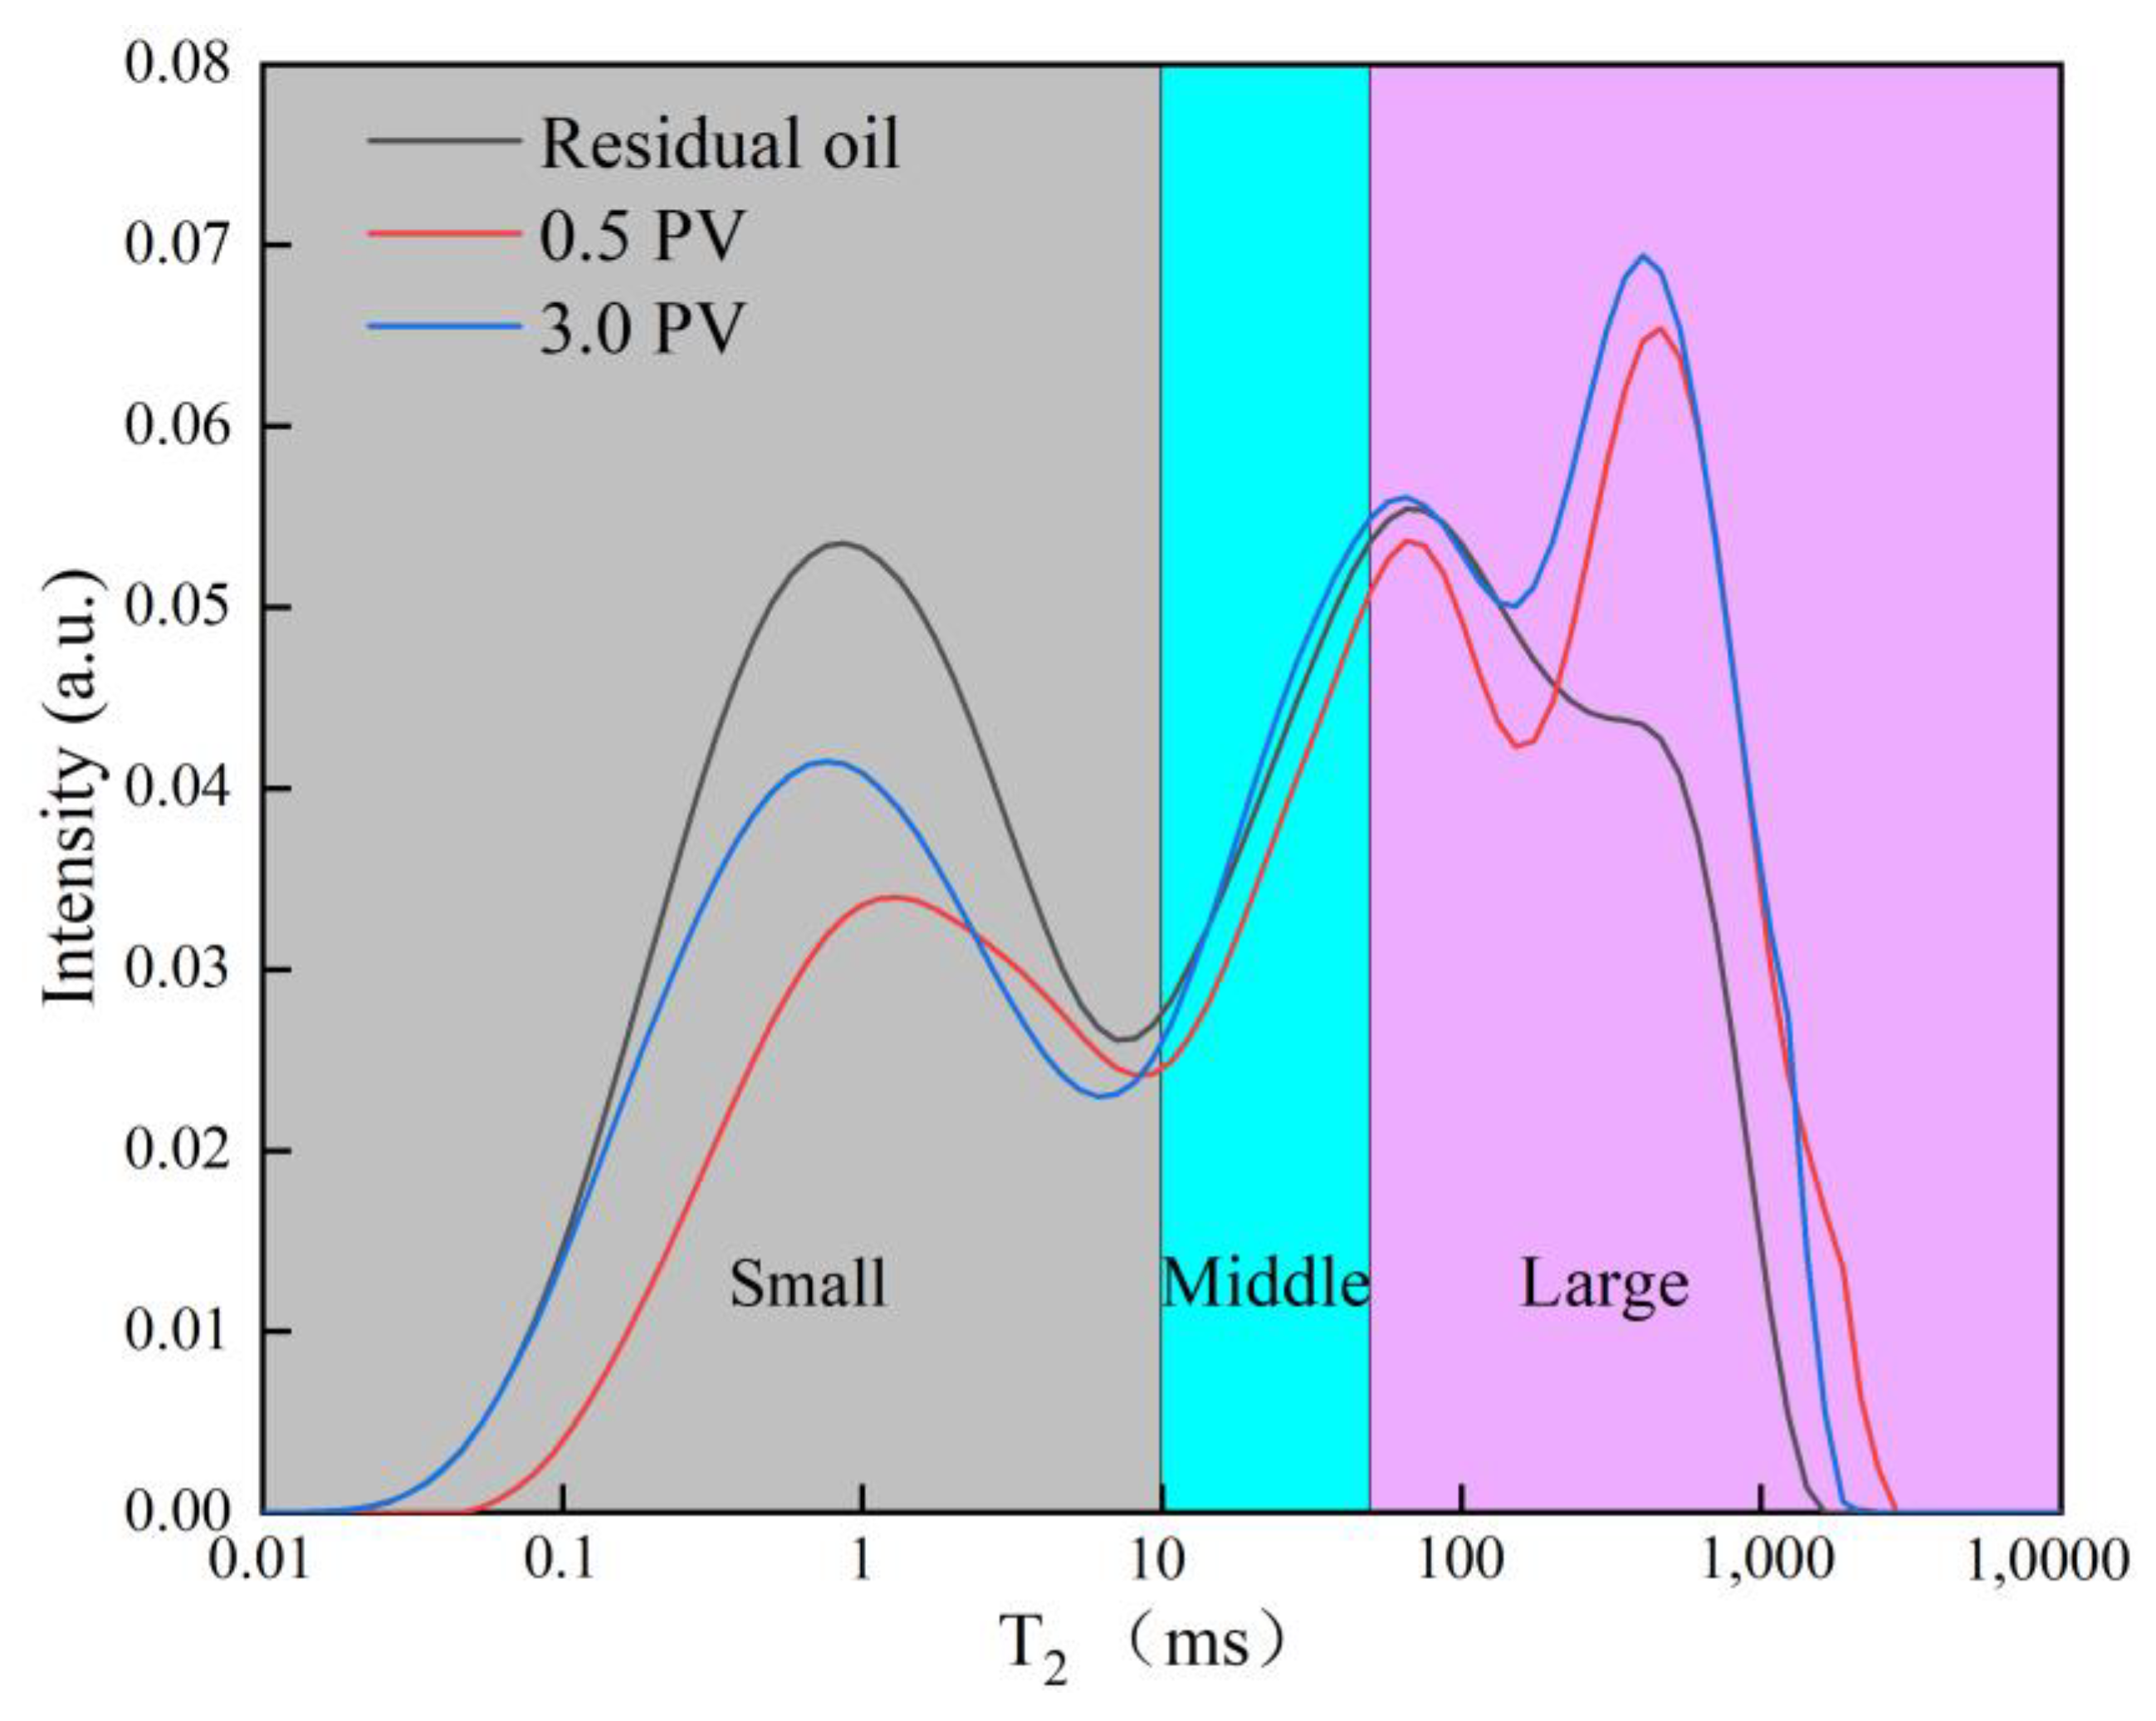
NMR experiments on cores explore the flow pattern by correlating transverse relaxation time (T2) with hydrogen signal intensity [38]. In this paper, the flow mechanism of nano-elastic microspheres in porous media was investigated using online NMR experiments, and the feasibility of employing nano-elastic microspheres to enhance oil recovery was verified.
The schematic diagram of the experimental device used in this section is shown in Figure 6. The equipment included a displacement system (constant velocity and constant pressure pump with an accuracy of 0.001 mL/min), an intermediate vessel (withstanding 70 MPa), an NMR core holder, a confining pressure pump, and a measurement system (measurement tube and pressure sensor with an accuracy of 0.001 MPa) (NMR analyzer). The NMR analyzer was produced by Suzhou Niumai Analytical Instrument Corporation, Suzhou, China. The intermediate container contained simulated formation water, nano-elastic microsphere solution, and FC-40. The NMR analyzer scanned the process of fluid injection, obtaining T
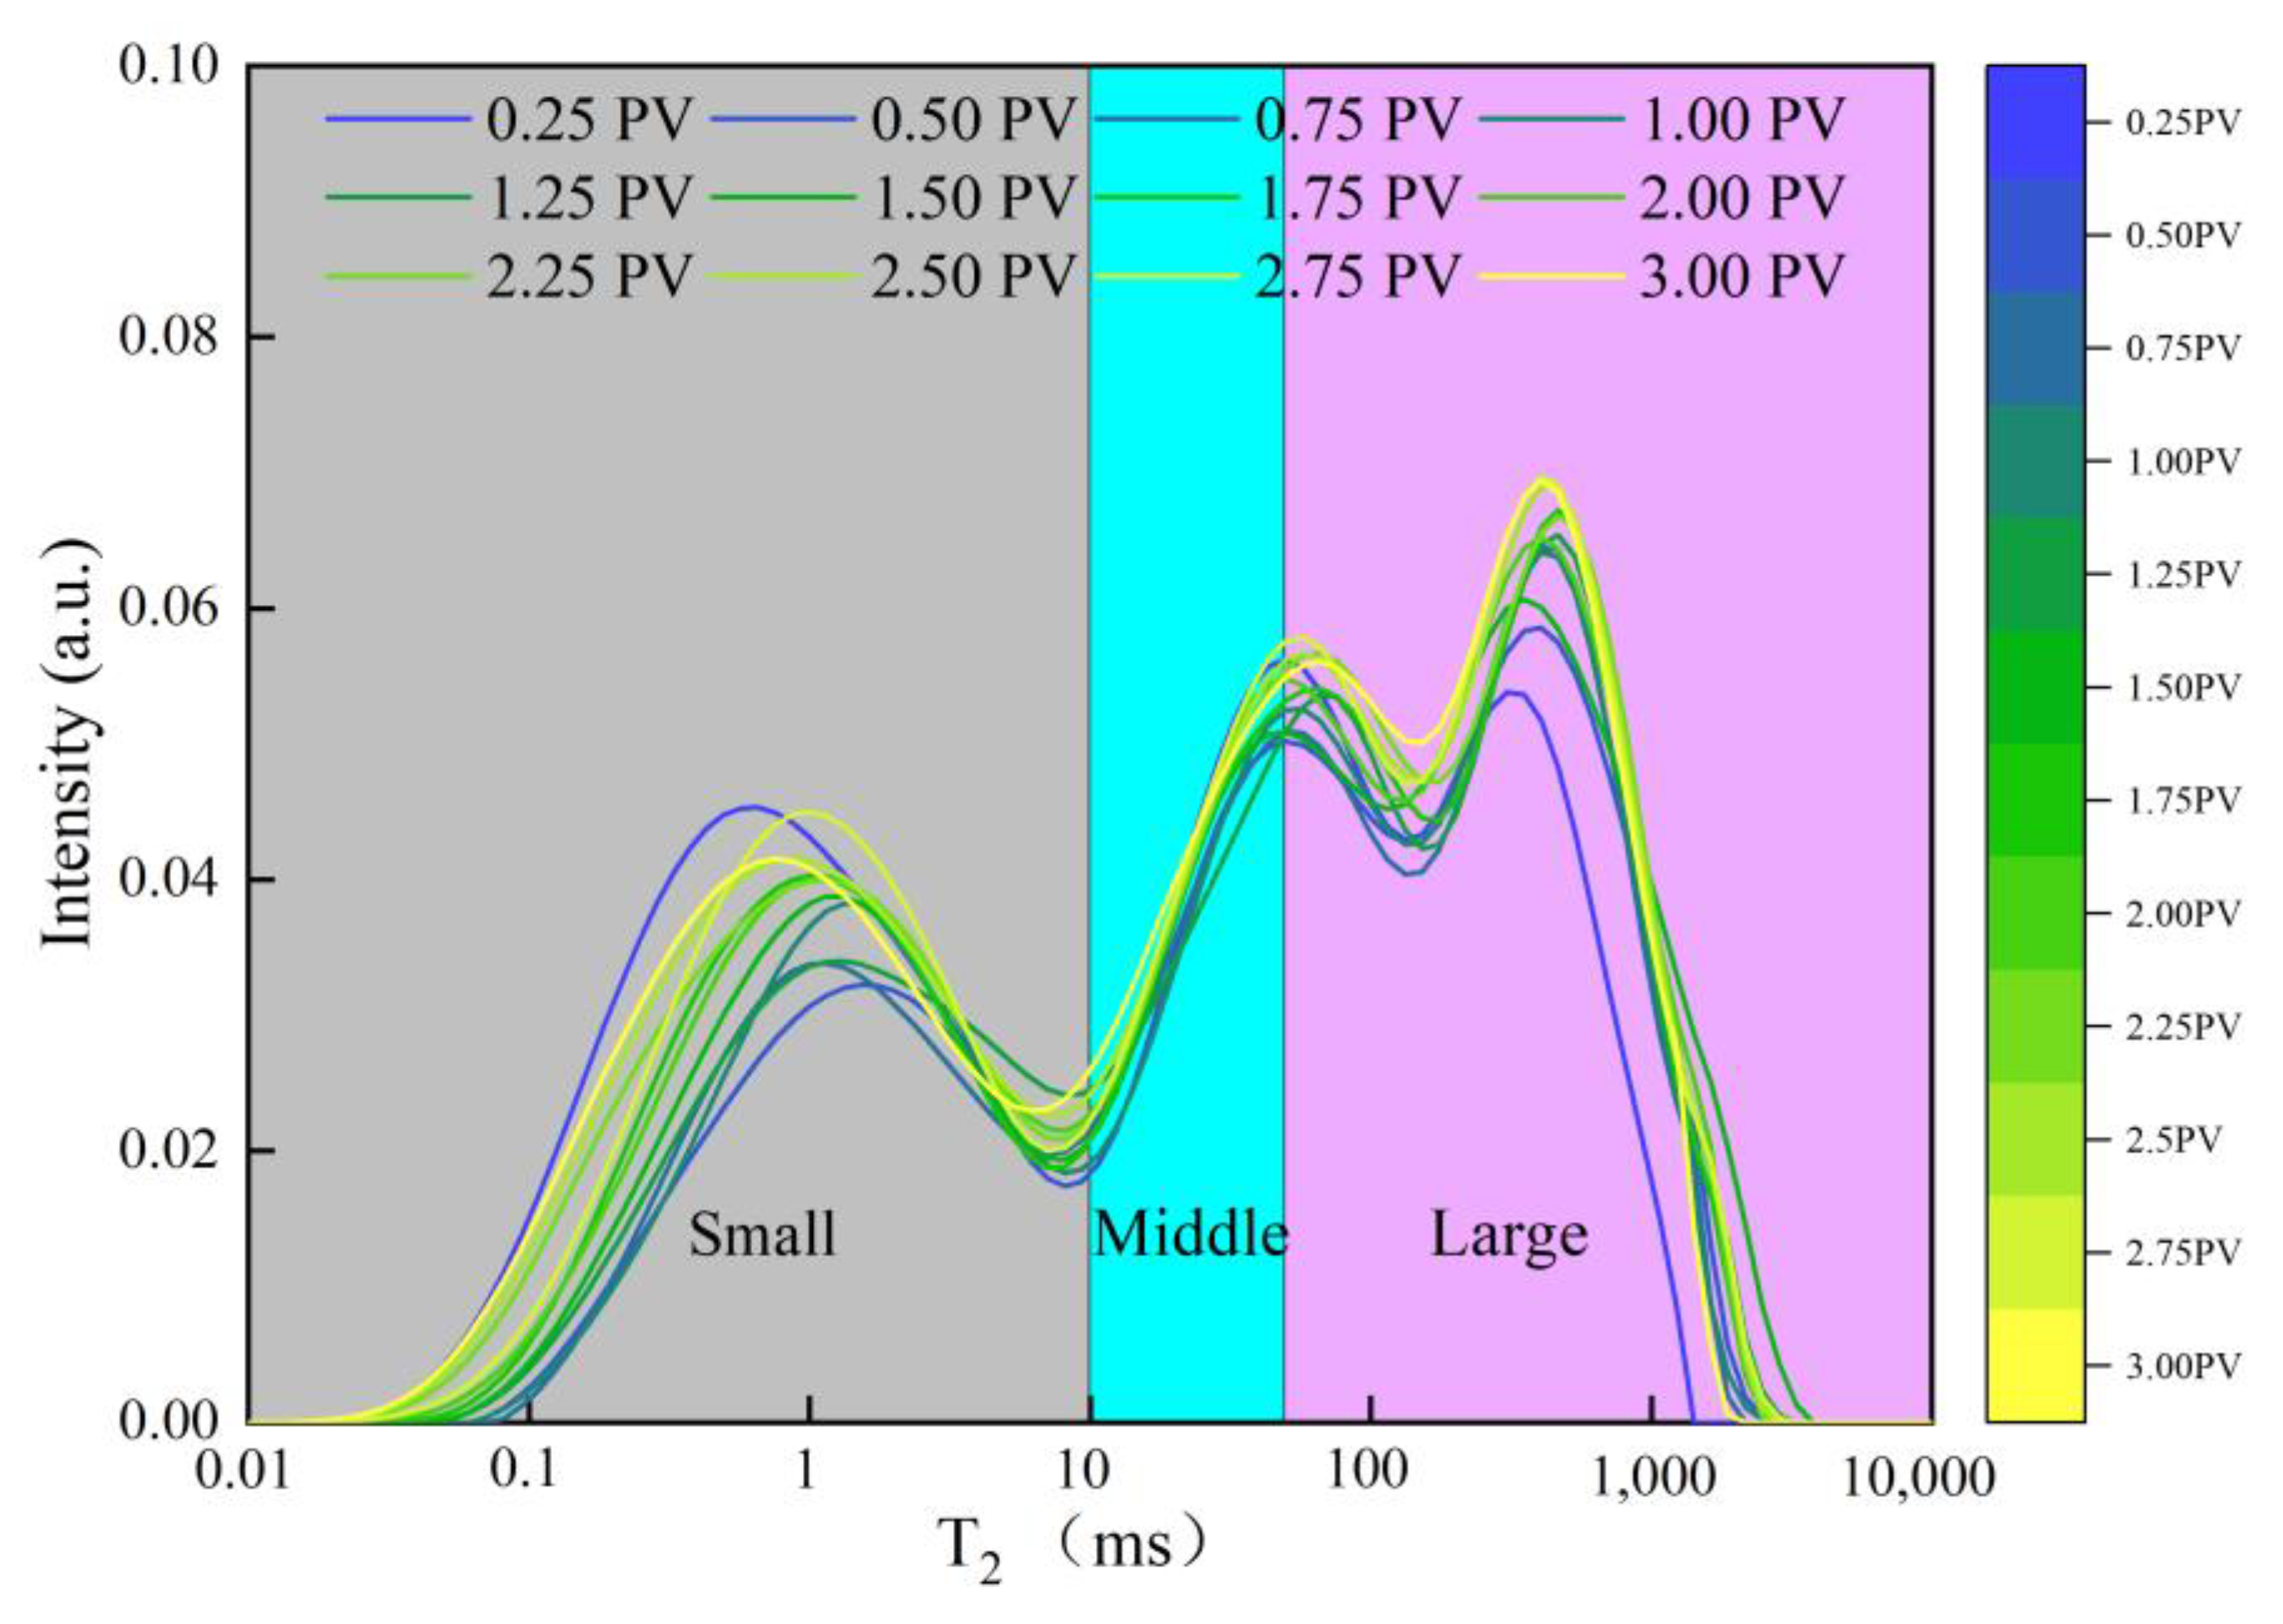
2 spectrums, which were then employed to explore the flow mechanism of the nano-elastic microsphere solution. The NMR analyzer utilized a permanent magnet with a magnetic field strength of 0.3 ± 0.05 T. The experimental equipment with these accuracies could effectively conduct the flow experiment of nano-elastic microspheres. The specific experimental steps are as follows:
Step 1: Place B-1 into the core holder and vacuum for 6 h;
Step 2: The simulated formation water was injected into the core at a flow rate of 0.01 mL/min. B-1 was taken out and weighed every 5 PV injection until the mass is stable. At this time, the core was scanned to obtain the T2 spectrum of the saturating simulated formation water state;
Step 3: B-1 was injected with FC-40 at a flow rate of 0.01 mL/min, and irreducible water was established using the oil flooding method. The displacement rate gradually increased until there is no water in the core grip. At this time, a nuclear magnetic resonance analyzer was used to scan the core and obtained the T2 spectrum of the experimental core in the state of irreducible water;
Step 4: FC-40 was injected at a flow rate of 0.01 mL/min into cores well saturated with simulated formation water to establish irreducible water saturation using the oil flooding method. The rate of expulsion was gradually increased until no water was produced from the clamped sections of the core. At this point, the core was scanned using an NMR analyzer to obtain the T2 spectrum of the experimental core in the irreducible water state;
Step 5: Apply a 0.5 MPa back pressure to the core in the residual oil condition and set the confining pressure to be 3 MPa higher than the inlet pressure;
Step 6: The nano-elastic microsphere solution was injected into the core at a flow rate of 0.05 mL/min, and the whole process was scanned using the online NMR. During the process of microsphere injection, each injection of 0.25PV nano-elastic microsphere solution was scanned once, up to a total of 3PV injection.

3. Results and Discussion

3.1. Water-Plugging Mechanism in Formation

The results of the core-plugging experiment are presented in Table 4. The A-1 core was saturated with formation crude oil, and the core permeability decreased from 42.08 × 10⁻³ μm2 to 38.84 × 10⁻³ μm2 after the injection and a 6-day resting period of the mother liquor of nano-elastic microspheres. The core-plugging rate for saturated crude oil with the nano-elastic microspheres was 7.70%. For the A-2 core saturated with simulated formation water, the injection of a 5000 mg/L nano-elastic microsphere solution, followed by a 6-day resting period, resulted in a decrease in the core permeability from 28.43 × 10⁻³ μm2 to 0.57 × 10⁻³ μm2. The core-plugging rate of the nano-elastic microspheres in saturated simulated formation water was 98.00%. The oil flooding method was used in the A-3 core to establish irreducible water, resulting in a water saturation of 33.65%. After the injection of a 5000 mg/L nano-elastic microsphere solution and a 6-day resting period, the core permeability decreased from 22.43 × 10⁻³ μm2 to 5.18 × 10⁻³ μm2. The plugging rate of the core with 33.65% water saturation was 76.91%.
The initial particle size of the nano-elastic microspheres utilized in this experiment was about 300 nm. In the A-1 core saturated with oil, the microspheres did not expand, resulting in physical plugging caused by the microsphere particle size approaching the reservoir pore throat, as illustrated in Figure 7. This form of fluid plugging, detrimental to reservoir fluid, can be identified as reservoir damage. However, in the study by Yu et al., the median particle size of nanospheres was 124.3 nm, and the core damage rate to saturated oil was 0 [37]. When employing these for EOR, it is essential to comprehensively consider the relationship between particle size and pore size to minimize reservoir damage.
The expansion limit of the nano-elastic microspheres with simulated formation water in this paper was 115.4 μm. Nano-elastic microspheres resided in the water-bearing pores of the rock core, absorbing water, swelling, and subsequently blocking the pores, thereby achieving water plugging. The particle size of the nano-elastic microspheres, as discussed in this study, rose from the nanometer scale to the micron scale following water absorption and expansion. Enhanced water-plugging results were observed in the A-2 core, which was saturated with simulated formation water. The water saturation of the A-3 core registered at 33.65%, with the plugging rate of the nano-elastic microspheres being 76.91%. During the second hydrographic permeability measurement, the water phase permeability of the core, represented as Krw, increased as a consequence of the elevated water saturation. However, the experimentally measured plugging rate in this study fell below the actual value in the irreducible water state of the core. This discrepancy can be attributed to the establishment of irreducible water through oil displacement, wherein the majority of the water occupied the small pores, while oil predominantly filled the larger pores. Upon injection, nano-elastic microspheres initially occupied the large pores and subsequently moved to the smaller ones. These microspheres absorbed water and expanded in both small pores containing water and in medium-to-large pores with partial water, thereby plugging the water. Minimal blockage occurred in the pores that contained solely oil. Thus, the nano-elastic microspheres demonstrated marginally reduced efficacy in blocking water within the oil–water transition zone compared to the water layer.
Upon entry into the formation and after water absorption and expansion, the nano-elastic microspheres first established a robust blockage in the water layer of the partition, primarily obstructing the bottom water. A subsequent blockage in the oil–water transition zone, albeit slightly less effective than in the water layer, resulted in secondary plugging. Nano-elastic microspheres in the oil reservoir will not cause any damage to the reservoir.

3.2. Water-Plugging Mechanism in Fracturing Zone

Sand-pack 1 was pressurized with 15 MPa to simulate the fractured zone in the formation near the wellhead. Sand-pack 2 was pressurized with 25 MPa to simulate the edge of the fractured zone. The results of the sand-pack-plugging experiment are shown in Table 5. The nano-elastic microsphere solution demonstrates a good plugging effect on the porous medium of 10,985.83 × 10−3 μm2, achieving a plugging rate of 97.08% and a high breakthrough pressure gradient. At 15 MPa, the breakthrough pressure gradient was between 2.720 and 3.108 MPa/m. Similarly, the nano-elastic microsphere solution exhibited a good plugging effect on porous media with an area of 11,845.23 × 10−3 μm2, achieving a plugging rate of 97.38% and a high breakthrough pressure gradient. At 25 MPa, the breakthrough pressure gradient remained between 2.720 and 3.108 MPa/m.
The two sand-packs were filled identically, suggesting they possess the same porous media structure. The plugging rate of elastic microspheres achieved 97.08% and 97.38% at pressures of 15 MPa and 25 MPa, respectively. The breakthrough pressure spanned from 1.4 to 1.6 MPa, with a corresponding pressure gradient ranging between 2.720 and 3.108 MPa/m. Pressure seemingly exerted no influence on the plugging efficiency of the nano-elastic microspheres. These microspheres have the capability to absorb water and expand during bottom water intrusion, subsequently forming a barrier to obstruct the inflow of bottom water.
Injecting nano-elastic microspheres into the sand-packs can simulate the procedure of adding nano-elastic microspheres to the fracture modification zone due to bottom water in the formation. Upon concluding the experiment, a significant concentration of nano-elastic microspheres accumulated at the injection end of the sand-pack (Figure 8). Such a result indicates that when the nano-elastic microspheres are introduced into the fracture modification zone, these microspheres also establish a partition at the boundary of the fracture modification zone, preventing bottom water infiltration.

3.3. The Flow Mechanism of Nano-Elastic Microspheres

The T2 spectrum of the B-1 core in the saturated simulated formation water, irreducible water, and residual oil states is shown in Figure 9. Since the T2 spectrum of the core in these three states all showed a bimodal structure, the range between the two peaks of the T2 spectrum of the core (i.e., T2 = 10 ms) was selected in this paper to classify the central and small holes of the cores. As illustrated in Figure 9, the right peak of the T2 spectrum decreases and shifts to the left as the core transitions from the saturated simulated formation water state to the residual oil state. At locations where T2 is less than 50 ms, there are almost no changes in the spectrum. In contrast, significant changes occur in the spectrum at locations where T2 is greater than 50 ms. These results suggest that in the B-1 core, the fluid in pores with a T2 value greater than 50 ms can participate in either oil or water displacement processes. As a result, a T2 value of 50 ms serves as a criterion to distinguish between middle and large pores in the B-1 core. Based on the aforementioned principles, the T2 spectrum of the core, when saturated with simulated formation water, was analyzed and calculated. The volume distribution of large, medium, and small pores in the B-1 core was 50.32%, 13.17%, and 36.51%, respectively. The criteria for pore categorization and the results are presented in Table 6.
The results of the online NMR experiments with injected nano-elastic microsphere solutions are shown in Figure 10. During the 0.5 PV injection, there is a noticeable decrease in the peaks corresponding to middle and small orifices. Subsequent to this stage, these peaks exhibit an increasing trend and show a tendency to shift towards the left. The peaks associated with large orifices consistently trend upwards, indicating a continuous ingress of the microsphere solution. Upon concluding the experiment and after the removal of the core adder, microspheres were observed at the core’s exit, as shown in Figure 11. This observation confirms the successful injection of nano-elastic microspheres into the core.
The analysis of peak strength variations within the small, middle, and large pore sections of the core is quantitatively presented in Figure 12, Figure 13 and Figure 14. Before the injection of 0.5 PV, the total intensity of the small pore channel exhibited enhancement. Notably, the nano-elastic microspheres exhibited a preference for entering the large pore channel. Following the injection of 0.5 PV, there was an increase in the total intensity of both middle and small pore channels. Nano-elastic microspheres were observed to enter the middle and small orifices after 0.5 PV injection. The peak intensity in the middle and small pores decreased, while the peak intensity in the large pores increased, when nano-elastic microspheres were injected with 0.5 PV. Before the B-1 core was injected into the nano-elastic microspheres, the large pore contained a lot of fluorinated liquid and the middle and small pores contained a lot of water. A decline in the peak intensity of the middle and small pores suggests a transfer of the fluorinated liquid from the large pores to the middle and small pores. Following the 0.5 PV injection, there was a gradual increase in the peak intensity for the large pores, with a concurrent rise in the middle and small pores. This trend can be attributed to the obstruction of the nano-elastic microspheres within the large pores, leading to an accumulation of the microsphere solution therein. Consequently, the resultant pressure prompted the microspheres to deform and infiltrate the smaller pores. The flow dynamics of the nano-elastic microspheres are shown in Figure 15.
In order to better explore the injection performance of the nano-elastic microspheres in the matrix, the T2 spectrum of nano-elastic microspheres injected at 0.5PV and 3.0PV was compared with the T2 spectrum of residual oil states (Figure 16). When the nano-elastic microspheres were injected at 0.5PV, the total intensity of the small and middle-sized pores reached the minimum before continuously increasing. The strength increase after the 0.5PV injection was caused by the entry of the nano-elastic microsphere solution into the small and middle pores. Therefore, the T2 spectrum for the 0.5PV and 3.0PV injections can be compared to explore the fluidity of nano-elastic microspheres in small and middle pores. The total signal strength in the large pores showed an upward trend. Therefore, the T2 spectrum in the initial state (residual oil state) and the end state of the experiment (the injection of nano-elastic microspheres at 3 PV) could be compared to explore the fluidity of the nano-elastic microspheres in the large pores. The variations in total intensity in the small, middle, and large pores are shown in Table 7. The T2 spectrum intensity change in the small pores was 0.359, accounting for 49.18% of the total intensity change. The intensity changes in the T2 spectrum in the middle pores was 0.06, accounting for 8.22% of the total intensity change. The intensity change in the T2 spectrum in the large pores was 0.311, accounting for 42.60% of the total intensity change. The 100 nm elastic microspheres exhibit effective fluidity within the Jurassic strata and can penetrate small, middle, and large pores. However, nano-elastic microspheres predominantly tend to accumulate within the small pores.
The retention index R of the nano-elastic microspheres in the pores is defined as the ratio of the total energy variation percentage (PI) to the corresponding pore volume percentage (Pφ), i.e.:
R = P I P φ
where R is the retention index of the nano-elastic microspheres and is a dimensionless quantity; PI is the total energy variation percentage; and Pφ is the corresponding pore volume percentage.
The higher the proportion of energy change in the pore, the lower the proportion of pore volume and the stronger the mobility of the nano-elastic microspheres in the pore. The flow index of nano-elastic microspheres in small, middle, and large pores is shown in Table 8. The retention index of the 100 nm elastic microspheres in the small pores was 1.35, that in middle pores was 0.62, and that in large pores was 0.85. After the 3PV injection, the nano-elastic microspheres were more likely to stay in the small pores and form static plugging due to the problem of elastic flow. The retention index of the large and middle pores was relatively low, so the nano-elastic microspheres formed elastic flow in the large and middle pores, resulting in dynamic plugging.

3.4. Challenges and Limitations of the Field Application

The inherent heterogeneity of reservoirs poses a challenge to the sweep efficiency of nano-elastic microspheres, potentially diminishing their water-plugging effectiveness observed in laboratory experiments. Moreover, in reservoirs characterized by difficult-to-access or poorly connected zones, the microspheres may struggle to effectively reach and plug these areas.
An additional concern is the potential for reservoir damage caused by the introduction of nano-elastic microspheres. A thorough assessment of the environmental impact is imperative, considering the complex interactions these microspheres may have. Obtaining regulatory approval for the utilization of nano-elastic microspheres in oil recovery is anticipated to be a protracted process due to stringent safety and environmental standards.
Furthermore, the long-term effects of microsphere injection on reservoir integrity, wellbore conditions, and overall oil recovery necessitate comprehensive study to ensure sustained and safe operations. The challenge of achieving uniform size and distribution of nano-elastic microspheres adds an extra layer of complexity, as variability may compromise their transport and distribution within reservoirs.
Designing microspheres capable of withstanding the harsh conditions prevalent in reservoirs, such as high temperatures, pressures, and chemical interactions, is critical for their stability and retention. Scaling up from laboratory experiments to field applications presents challenges, requiring careful consideration of scalability issues. Additionally, the cost-effectiveness of large-scale implementation warrants thorough assessment to ensure economic viability.

4. Conclusions

In this paper, the plugging mechanism of nano-elastic microspheres in both low-permeability reservoirs and fracturing zones was investigated, utilizing the plugging rate as a water-plugging index. The flow mechanism of these microspheres in low-permeability reservoirs was further explored through online NMR experiments. The subsequent conclusions are derived from both the plugging and NMR experiments:
  • The nano-elastic microspheres expand in the matrix upon contact with water, effectively plugging it. The plugging rates are 98% in the water layer, 76.91% in the oil–water transition zone, and 97% in the water-bearing fracturing zone.
  • The plugging rate of nano-elastic microspheres in the saturated oil core is 4%. These microspheres cause certain damage to the reservoir. It is advisable to select a suitable particle size when plugging water with nano-elastic microspheres to minimize reservoir damage.
  • After injecting nano-elastic microspheres into the formation, they will form a partition in the water layer and the oil–water transition zone, achieving higher plugging rates of 98% and 76.91%, respectively. As the nano-elastic microspheres migrate, they form a partition to block bottom water in the fracturing zone and in front of the fracturing zone. The plugging rate of the partition at the fracturing zone is over 97%.
  • The retention index of nano-elastic microspheres in the large, middle, and small pores of the core is 0.85, 0.62, and 1.35, respectively. Nano-elastic microspheres are more likely to form dynamic plugging in large pores and static plugging in small pores.

Author Contributions

Conceptualization, X.F.; methodology, X.F., H.Z. and J.H.; validation, H.L.; formal analysis, X.F., J.H., J.L., Y.Y. and Z.L.; investigation, X.F., H.Z., H.L. and Y.Y.; resources, H.L. and J.L.; writing—original draft preparation, H.Z. and J.H.; writing—review and editing, M.A.A. and H.Y. (Haifeng Yang); supervision, H.Y. (Haiyang Yu); project administration, H.Y. (Haiyang Yu). All authors have read and agreed to the published version of the manuscript.

Funding

This work was financially supported by the National Natural Science Foundation of China (52074317) and Strategic Cooperation Technology Projects of CNPC and CUPB (ZLZX2020-02-04-04).

Data Availability Statement

Data are contained within the article.

Conflicts of Interest

Author Xuezhang Feng, Hongjie Zhang, Honglei Liu, Jiangling Hong, Jinbo Liu, Yingqiang Yang and Zelin Liu was employed by the company PetroChina Xiniang Oilfield Company. The authors declare that this study received funding from Strategic Cooperation Technology Projects of CNPC and CUPB. The funder was not involved in the study design, collection, analysis, interpretation of data, the writing of this article or the decision to submit it for publication.

References

  1. Bai, B.; Li, L.; Liu, Y.; Liu, H.; Wang, Z.; You, C. Preformed particle gel for conformance control: Factors affecting its properties and applications. SPE Reserv. Eval. Eng. 2007, 10, 415–422. [Google Scholar] [CrossRef]
  2. Imqam, A.; Bai, B.; Ramadan, M.A.; Wei, M.; Delshad, M.; Sepehrnoori, K. Preformed-particle-gel extrusion through open conduits during conformance-control treatments. SPE J. 2015, 20, 1083–1093. [Google Scholar] [CrossRef]
  3. Elsharafi, M.O.; Bai, B. Effect of back pressure on the gel pack permeability in mature reservoir. Fuel 2016, 183, 449–456. [Google Scholar] [CrossRef]
  4. Alhuraishawy, A.K.; Sun, X.; Bai, B.; Wei, M.; Imqam, A. Areal sweep efficiency improvement by integrating preformed particle gel and low salinity water flooding in fractured reservoirs. Fuel 2018, 221, 380–392. [Google Scholar] [CrossRef]
  5. Sun, Y.; Yang, D.; Shi, L.; Wu, H.; Cao, Y.; He, Y.; Xie, T. Properties of Nanofluids and Their Applications in Enhanced Oil Recovery: A Comprehensive Review. Energy Fuels 2020, 34, 1202–1218. [Google Scholar] [CrossRef]
  6. Wei, P.; Zheng, L.; Yang, M.; Wang, C.; Chang, Q.; Zhang, W. Fuzzy-ball fluid self-selective profile control for enhanced oil recovery in heterogeneous reservoirs: The techniques and the mechanisms. Fuel 2020, 275, 117959. [Google Scholar] [CrossRef]
  7. Ahmad, S.; Ali, S.; Ullah, I.; Zobaer, M.S.; Albakri, A.; Muhammad, T. Synthesis and characterization of manganese ferrite from low grade manganese ore through solid state reaction route. Sci. Rep. 2021, 11, 16190. [Google Scholar] [CrossRef]
  8. Aminian, E.; Kamali, M.; Vatanjoo, E.; Saffari, H. Theoretical analysis on condensation heat transfer on microstructured hybrid hydrophobic-hydrophilic tube. Heat Mass Transf. 2022, 58, 1207–1221. [Google Scholar] [CrossRef]
  9. Ullah, I.; Hayat, T.; Alsaedi, A. Optimization of entropy production in flow of hybrid nanomaterials through Darcy–Forchheimer porous space. J. Therm. Anal. Calorim. 2022, 147, 5855–5864. [Google Scholar] [CrossRef]
  10. Deng, B.; Jia, Z.; Liu, W.; Liu, X.; Gu, J.; Ye, W.; Wen, H.; Qu, Z. Selective Water Plugging Technology for Horizontal Well with Screen Completion. Energies 2021, 14, 791. [Google Scholar] [CrossRef]
  11. Ullah, I. Heat transfer enhancement in Marangoni convection and nonlinear radiative flow of gasoline oil conveying Boehmite alumina and aluminum alloy nanoparticles. Int. Commun. Heat Mass Transf. 2022, 132, 105920. [Google Scholar] [CrossRef]
  12. Liu, J.; Almakimi, A.; Wei, M.; Bai, B.; Ali Hussein, I. A comprehensive review of experimental evaluation methods and results of polymer micro/nanogels for enhanced oil recovery and reduced water production. Fuel 2022, 324, 124664. [Google Scholar] [CrossRef]
  13. Roslan, A.A.; Aziz, N.A.A.; Dzulkarnain, I.; Tewari, R.D.; Jaafar, M.Z. Experimental Investigation on the Performance of Polymer-Coated Clay/Polyacrylamide Hydrogel for Water Shutoff Treatment. SPE Prod. Oper. 2023, 38, 490–503. [Google Scholar] [CrossRef]
  14. Hao, L.; Chen, I.C.; Oh, J.K.; Yegin, C.; Nagabandi, N.; Talari, J.V.; Zhang, L.; Akbulut, M.; Jiang, B. Solid-shelled microspheres loaded with solvent as diluents for extracting blockages by heavy-oil and asphaltene precipitates. Fuel 2018, 234, 656–663. [Google Scholar] [CrossRef]
  15. Yang, F.; Zhang, X.; Li, C.; Dai, S.; Yao, B.; Mu, Z.; Sun, G. Poly(aminopropyl/methyl)silsesquioxane microspheres improve the flowability of model waxy oils associated with asphaltenes. Fuel 2019, 243, 60–69. [Google Scholar] [CrossRef]
  16. Yang, H.; Lv, Z.; Wang, L.; Feng, C.; Wang, J.; Xu, Z.; Huang, Y.; Li, Z.; Kang, W. Stability mechanism of controlled acid-resistant hydrophobic polymer nanospheres on CO2 foam. Fuel 2023, 346, 128332. [Google Scholar] [CrossRef]
  17. Zhou, M.; Zou, J.; Gu, Y.; Yi, R.; Tu, H. Preparation of magnetic polymer nanosphere and its profile control. J. Dispers. Sci. Technol. 2020, 41, 557–565. [Google Scholar] [CrossRef]
  18. Yao, C.; Lei, G.; Li, L.; Gao, X. Selectivity of Pore-Scale Elastic Microspheres as a Novel Profile Control and Oil Displacement Agent. Energy Fuels 2012, 26, 5092–5101. [Google Scholar] [CrossRef]
  19. Yao, C.; Lei, G.; Cathles, L.M.; Steenhuis, T.S. Pore-scale investigation of micron-size polyacrylamide elastic microspheres (MPEMs) transport and retention in saturated porous media. Environ. Sci. Technol. 2014, 48, 5329–5335. [Google Scholar] [CrossRef]
  20. Yao, C.; Lei, G.; Hou, J.; Xu, X.; Wang, D.; Steenhuis, T.S. Enhanced Oil Recovery Using Micron-Size Polyacrylamide Elastic Microspheres: Underlying Mechanisms and Displacement Experiments. Ind. Eng. Chem. Res. 2015, 54, 10925–10934. [Google Scholar] [CrossRef]
  21. Yao, C.; Wang, D.; Wang, J.; Hou, J.; Lei, G.; Steenhuis, T.S. Effect of Ionic Strength on the Transport and Retention of Polyacrylamide Microspheres in Reservoir Water Shutoff Treatment. Ind. Eng. Chem. Res. 2017, 56, 8158–8168. [Google Scholar] [CrossRef]
  22. Lin, M.; Zhang, G.; Hua, Z.; Zhao, Q.; Sun, F. Conformation and plugging properties of crosslinked polymer microspheres for profile control. Colloids Surf. A Physicochem. Eng. Asp. 2015, 477, 49–54. [Google Scholar] [CrossRef]
  23. Hua, Z.; Lin, M.; Guo, J.; Xu, F.; Li, Z.; Li, M. Study on plugging performance of cross-linked polymer microspheres with reservoir pores. J. Pet. Sci. Eng. 2013, 105, 70–75. [Google Scholar] [CrossRef]
  24. Hua, Z.; Lin, M.; Dong, Z.; Li, M.; Zhang, G.; Yang, J. Study of deep profile control and oil displacement technologies with nanoscale polymer microspheres. J. Colloid Interface Sci. 2014, 424, 67–74. [Google Scholar] [CrossRef]
  25. Zhao, S.; Pu, W.; Wei, B.; Xu, X. A comprehensive investigation of polymer microspheres (PMs) migration in porous media: EOR implication. Fuel 2019, 235, 249–258. [Google Scholar] [CrossRef]
  26. May, R.; Akbariyeh, S.; Li, Y. Pore-scale investigation of nanoparticle transport in saturated porous media using laser scanning cytometry. Environ. Sci. Technol. 2012, 46, 9980–9986. [Google Scholar] [CrossRef]
  27. Shi, X.; Yue, X. Migration and plugging mechanisms of self-aggregated microspheres as a novel profile control. J. Pet. Sci. Eng. 2020, 184, 106458. [Google Scholar] [CrossRef]
  28. Zhang, F.; Hou, B.; Wang, S.; Chen, H.; Yang, J.; Fan, H.; Gui, L. Study on the Profile Control and Oil Displacement Mechanism of a Polymer Nano-microsphere for Oilfield. Energy Fuels 2023, 37, 2692–2701. [Google Scholar] [CrossRef]
  29. Chen, Y.; Tang, Z.; Wang, S.; Liu, Y.; Qu, J.; Liu, X.; Qi, P.; Miao, G.; Liu, X.; Zheng, J.; et al. Fluorescent polyacrylamide nanospheres for concentration detection and fluorescent visual oil displacement experiments. J. Appl. Polym. Sci. 2021, 139, 51898. [Google Scholar] [CrossRef]
  30. Su, H.; Zhou, F.; Wang, Q.; Yu, F.; Dong, R.; Xiong, C.; Li, J.; Liang, T. Flow Physics of Polymer Nanospheres and Diluted Microemulsion in Fractured Carbonate Reservoirs: An Investigation into Enhanced Oil Recovery Mechanisms. SPE J. 2021, 26, 2231–2244. [Google Scholar] [CrossRef]
  31. Chen, J.-H.; Zhang, H.; Althaus, S.M.; Boudjatit, M. High-spatial-resolution nuclear-magnetic-resonance method for investigation of fluid distribution in whole cores. Fuel 2021, 297, 120777. [Google Scholar] [CrossRef]
  32. Ghomeshi, S.; Kryuchkov, S.; Kantzas, A. An investigation into the effects of pore connectivity on T(2) NMR relaxation. J. Magn. Reson. 2018, 289, 79–91. [Google Scholar] [CrossRef]
  33. Liu, L.; Zhang, Z.; Liu, C.; Wu, N.; Ning, F.; Zhang, Y.; Meng, Q.; Li, C. Nuclear Magnetic Resonance Transverse Surface Relaxivity in Quartzitic Sands Containing Gas Hydrate. Energy Fuels 2021, 35, 6144–6152. [Google Scholar] [CrossRef]
  34. Pinto, V.S. Use of 1H nuclear magnetic resonance and chemometrics to detect the percentage of ethanol anhydrous in Brazilian type C premium gasoline. Fuel 2020, 276, 118015. [Google Scholar] [CrossRef]
  35. Nikolskaya, E.; Hiltunen, Y. Time-Domain NMR in Characterization of Liquid Fuels: A Mini-Review. Energy Fuels 2020, 34, 7929–7934. [Google Scholar] [CrossRef]
  36. Tang, M.; Wang, C.; Deng, X.; Yang, H.; Lu, J.; Yu, H. Experimental investigation on plugging performance of nanospheres in low-permeability reservoir with bottom water. Adv. Geo-Energy Res. 2022, 6, 95–103. [Google Scholar] [CrossRef]
  37. Yu, H.; Wang, S.; Yang, H.; Yang, Y.; Zhang, J.; Wang, Y.; Yang, W.; Lu, J. A Systematic Method to Investigate the EOR Mechanism of Nanospheres: Laboratory Experiments from Core to Micro Perspective. Energy Fuels 2023, 37, 2053–2065. [Google Scholar] [CrossRef]
  38. Moro, M.K.; Dos Santos, F.D.; Folli, G.S.; Romao, W.; Filgueiras, P.R. A review of chemometrics models to predict crude oil properties from nuclear magnetic resonance and infrared spectroscopy. Fuel 2021, 303, 121283. [Google Scholar] [CrossRef]
Figure 1. Particle size distribution curve of nano-elastic microspheres in the initial state. Blue curve represents the cumulative distribution of microspheres. Green curve represents the cumulative distribution of microspheres. They reflect the particle size distribution of microspheres in kerosene.
Processes 11 03342 g001
Figure 2. Particle sizes change in formation water during swelling. This reflects the expansion performance of nano-elastic microspheres in formation water.
Processes 11 03342 g002
Figure 3. Composition of dead oil.
Processes 11 03342 g003
Figure 4. Schematic diagram of core-plugging experimental device.
Processes 11 03342 g004
Figure 5. Schematic diagram of sand-pack-plugging experimental device.
Processes 11 03342 g005
Figure 6. Schematic diagram of NMR experimental device.
Processes 11 03342 g006
Figure 7. Schematic diagram of physical plugging of nano-elastic microspheres.
Processes 11 03342 g007
Figure 8. The sand-pack entrance after the experiments.
Processes 11 03342 g008
Figure 9. T2 spectrum at the states of saturating water, irreducible water, and residual oil of core 24. The gray part represents the small pores, the blue part represents the middle pores, and the purple represents the large pores.
Processes 11 03342 g009
Figure 10. T2 spectrum during nanosphere solution injection. The gray part represents the small pores, the blue part represents the middle pores, and the purple represents the large pores.
Processes 11 03342 g010
Figure 11. The outlet of B-1 after experiment.
Processes 11 03342 g011
Figure 12. The variation in total intensity in small pores during the injection.
Processes 11 03342 g012
Figure 13. The variation in total intensity in middle pores during the injection.
Processes 11 03342 g013
Figure 14. The variation in total intensity in large pores during the injection.
Processes 11 03342 g014
Figure 15. Schematic diagram of elastic flow mechanism of nano-elastic microspheres.
Processes 11 03342 g015
Figure 16. T2 spectrum at the states of residual oil, 0.5 PV injection, and 3.0 PV injection. The gray part represents the small pores, the blue part represents the middle pores, and the purple represents the large pores.
Processes 11 03342 g016
Table 1. Parameters of cores and sand-packs used in this paper.
SamplesDiameter (cm)Length (cm)PorosityPermeability (×10−3 μm2)Experiments
A-12.5084.9860.140965.62Plugging experiments
A-22.5105.0620.171545.95
A-32.4645.0250.151031.18
Sand-pack 12.5951.48//
Sand-pack 22.5951.48//
B-12.4685.0370.154931.15NMR experiments
Table 2. Composition of dead oil.
ComponentConcentration/mol %ComponentConcentration/mol %ComponentConcentration/mol %
C32.02C132.58C230.97
C47.61C142.54C240.82
C519.25C152.39C250.78
C620.3C161.94C260.69
C711.49C171.87C270.59
C85.25C181.65C280.45
C92.92C191.66C290.38
C102.78C201.39C300.23
C112.67C211.24
C122.45C221.09
Table 3. Composition and salinity of formation water.
Cation (mg·L−1)Anion (mg·L−1)Salinity (mg·L−1)
K+ + Na+Ca2+Mg2+ClSO42−HCO3
29,029284580449,29448412182,577
Table 4. Results of core-plugging experiments.
SamplesCore StateK1 (×10−3 μm2)K2 (×10−3 μm2)η
A-1Oil42.0840.144.61%
A-2Water28.430.5798.00%
A-3Irreducible water22.435.1876.91%
Table 5. Results of sand-pack-plugging experiments.
SamplesK1 (×10−3 μm2)K2 (×10−3 μm2)ηPb (MPa)Gb (MPa/m)
Sand-pack 110,985.83320.5997.081.400–1.6002.720–3.108
Sand-pack 211,845.23310.7597.381.400–1.6002.720–3.108
Table 6. The basis and result of pore division.
ParameterSmallMiddleLarge
T2 (ms)<1010–50>50
Percentage (%)36.5113.1750.32
Table 7. The variations in total intensity in the small, middle, and large pores.
ParametersSmallMiddleLarge
Variations in total intensity0.3590.0600.311
Percentage (%)49.188.2242.60
Table 8. The retention index of the small, middle, and large pores.
ParametersSmallMiddleLarge
PI (%)49.188.2242.60
Pφ (%)36.5113.1750.32
R1.350.620.85
Disclaimer/Publisher’s Note: The statements, opinions and data contained in all publications are solely those of the individual author(s) and contributor(s) and not of MDPI and/or the editor(s). MDPI and/or the editor(s) disclaim responsibility for any injury to people or property resulting from any ideas, methods, instructions or products referred to in the content.

